Origins of Functional Organization in the Visual Cortex - Frontiers
←
→
Page content transcription
If your browser does not render page correctly, please read the page content below
REVIEW
                                                                                                                                              published: 03 March 2020
                                                                                                                                        doi: 10.3389/fnsys.2020.00010

                                           Origins of Functional Organization in
                                           the Visual Cortex
                                           Michael Ibbotson 1,2* and Young Jun Jung 1,2*
                                           1
                                            Australian College of Optometry, National Vision Research Institute, Carlton, VIC, Australia, 2 Department of Optometry
                                           and Vision Science, The University of Melbourne, Parkville, VIC, Australia

                                           How are the complex maps for orientation selectivity (OS) created in the primary
                                           visual cortex (V1)? Rodents and rabbits have a random distribution of OS preferences
                                           across V1 while in cats, ferrets, and all primates cells with similar OS preferences
                                           cluster together into relatively wide cortical columns. Given other clear similarities in
                                           the organization of the visual pathways, why is it that maps coding OS preferences are
                                           so radically different? Prominent models have been created of cortical OS mapping
                                           that incorporate Hebbian plasticity, intracortical interactions, and the properties of
                                           growing axons. However, these models suggest that the maps arise primarily through
                                           intracortical interactions. Here we focus on several other features of the visual system
                                           and brain that may influence V1 structure. These are: eye divergence, the total number
                                           of cells in V1, the thalamocortical networks, the topography of the retina and phylogeny.
                                           We outline the evidence for and against these factors contributing to map formation.
                                           One promising theory is that the central-to-peripheral ratio (CP ratio) of retinal cell
                                           density can be used to predict whether or not a species has pinwheel maps. Animals
                           Edited by:      with high CP ratios (>7) have orientation columns while those with low CP ratios (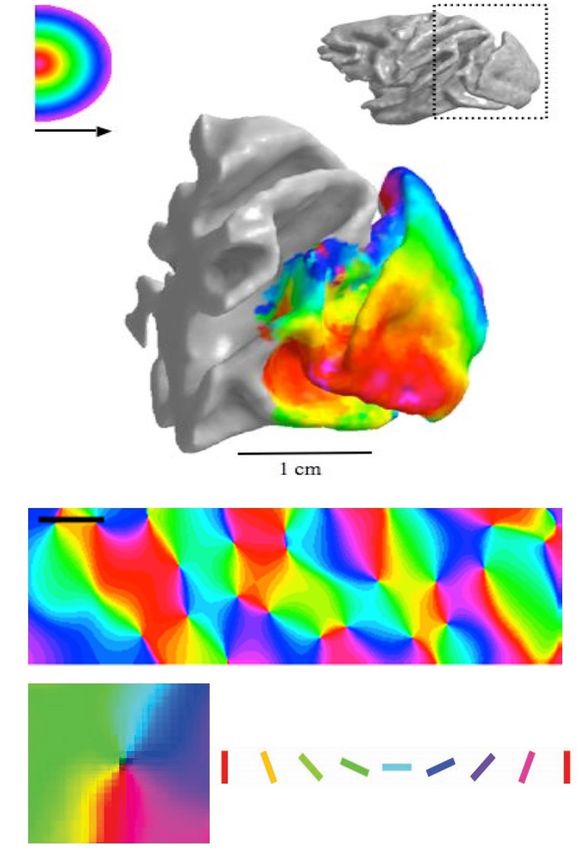
Ibbotson and Jung Maps in Visual Cortex
Markram et al., 2015). Functionally, cortical architecture is and experiments that would greatly assist in creating a better
structured similarly between brain regions, each possessing understanding of map structures in cortex. The rationale for such
systematic maps of the features they code: e.g. retinotopy in experiments is placed into the context of the reviewed literature.
visual areas (Figure 1A; Brewer et al., 2002), tonotopy in auditory
areas (Pantev et al., 1995), and homunculi (maps of the body) Cortical Maps
in somatosensory and motor areas (Feldman and Brecht, 2005; In every mammalian species studied, V1 has a retinotopic map
Harrison et al., 2012). It is generally believed that these patterned in which information from the visual field is coded onto a two-
maps are an integral part of the computations performed by the dimensional surface that retains the image’s spatial organization.
cortical circuits. Embedded in the retinotopic map, V1 also codes other stimulus
Comparative approaches have proved very useful for features, e.g. the orientation of edges, the eye of origin (ocular
identifying genetically driven distinctions in the functional dominance), spatial frequency, and the direction of motion
organization of mammalian nervous systems. For example, the (Goodhill, 2007). There is an extensive literature describing how
corpus callosum is not present in monotremes and marsupials various stimulus features can be mapped onto the cortex, which
(metatherians) but is found in placental (eutherian) mammals, shows that self-organizing mechanisms are good at reproducing
providing a timeline for the emergence of this feature (reviewed V1 maps in species such as cats, ferrets, and primates, but they
in Kaas, 2017). While this article reviews what is currently may not provide all the answers (Hubel et al., 1977; Blasdel
known, the relative lack of data in some areas has led us, here, and Salama, 1986; Bonhoeffer and Grinvald, 1991; Bartfeld and
to take an expanded approach – we propose several theories Grinvald, 1992; Obermayer and Blasdel, 1993; Hübener et al.,
1997; Nauhaus et al., 2012).
Here, we will focus on the maps of orientation selectivity (OS),
which need to code oriented structures in every patch of visual
space through the full 180◦ . It has been suggested that detecting
the orientation of edges in visual scenes is as fundamental to
visual processing as detecting brightness (Bell and Sejnowski,
1997). Some species (e.g. primates and cats) organize their OS
cells into highly structured orientation columns, where cells with
the same preference cluster together into columns that are 0.2–
0.7 mm in diameter (Figure 1B; e.g. Cloherty et al., 2016).
In these species, all cells through all six cortical layers have
the same OS, suggesting an emphasis on vertical integration of
feature selectivity through the cortical layers. To ensure that all
orientations are represented in every patch of the retinotopic
map, the orientation columns representing different orientations
are arranged radially around a central location in the horizontal
plane, centered on a particular point in the retinotopic map
(Figure 1C). This cortical architecture is known as a “pinwheel”
OS map. Other species have a random distribution of orientation
selective cells, i.e. most cells are OS but those with different
orientation preferences are juxtaposed in a random fashion
(rodents/rabbits: Ohki et al., 2005; Van Hooser et al., 2005; Bonin
et al., 2011; Espinosa and Stryker, 2012; Reid, 2012). The cells
are intermingled both horizontally across the retinotopic map
and vertically through the six cortical layers. This is known as a
“random” or “salt-and-pepper” OS map.
Essential Techniques
Five essential experimental techniques need to be briefly
discussed before reviewing current and future directions in this
field. (1) Intrinsic optical imaging (OI) is a technique that allows
cortical maps to be measured with a high degree of accuracy
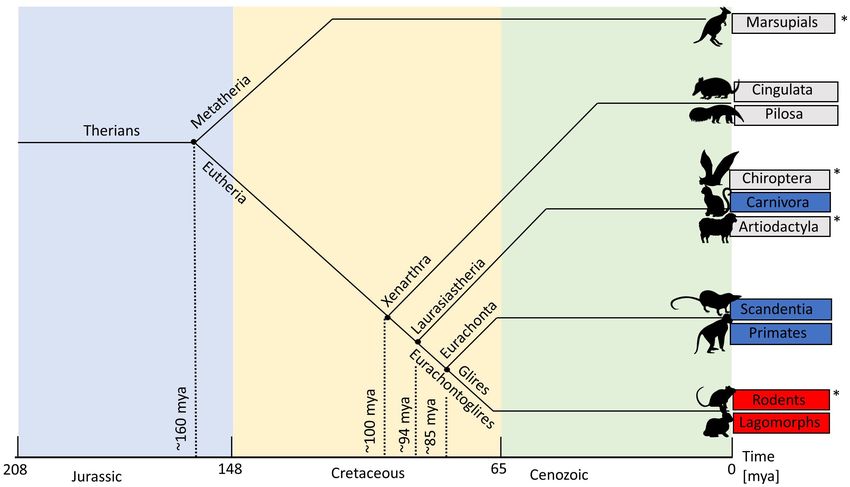
FIGURE 1 | (A) Retinotopic map in monkey visual cortex (fMRI data).
over relatively wide regions of the cortex down to depths of 600–
(B) Orientation map in cat cortex measured using optical imaging, with 1000 µm, with a horizontal resolution of ∼50 µm. This technique
orientation selectivity coded by specific colors. Scale = 1 mm. (C) Zoom onto is simple in principle but complex in operation. A bright red or
a single pinwheel in cat cortex. Square width = 1 mm. Oriented bars show green light is shone onto the cortex and this partially penetrates
color code in panels B and C. Panel A reproduced from Brewer et al. (2002)
into the neural tissue (Grinvald et al., 1986; for recent red–green
with permission from the copyright holder. Panels B and C adapted from
Cloherty et al. (2016) with permission from the copyright holder.
comparison, see Cloherty et al., 2016). Areas that have large
volumes of blood or increase in deoxy-hemoglobin concentration
Frontiers in Systems Neuroscience | www.frontiersin.org 2 March 2020 | Volume 14 | Article 10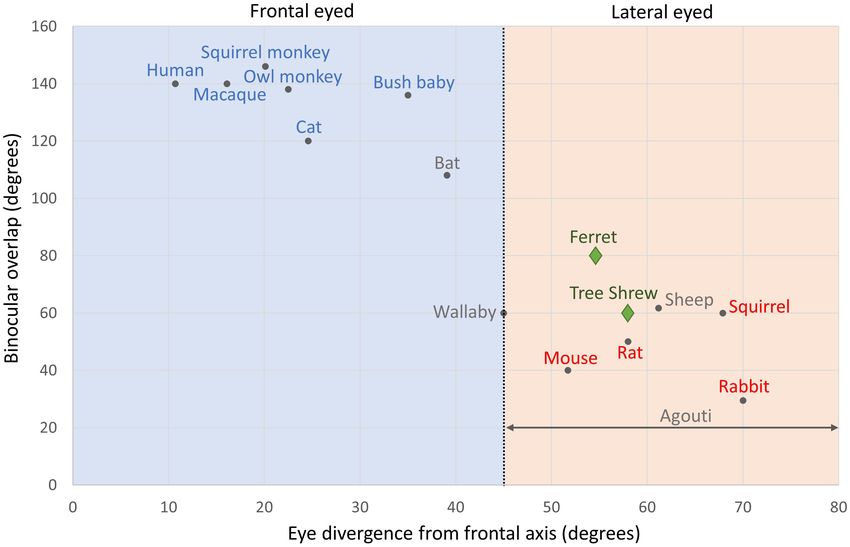
Ibbotson and Jung                                                                                                              Maps in Visual Cortex

due to high levels of neural activity do not reflect much light,            carnivorous rodent has been shown to have a salt-and-pepper OS
so they appear dark. In contrast, areas with less blood flow                map (Scholl et al., 2017). Could OS map structure be related to
reflect more light, so they appear brighter. In this way, it is             nocturnal versus diurnal lifestyles? This is unlikely as cats and
possible to determine which areas of cortex are active and                  some primates are primarily nocturnal but have pinwheel OS
which are not, thus allowing the measurement of cortical maps               maps. Also, some rodents (squirrels) are diurnal but have salt-
(Figures 1B,C). (2) Two photon calcium imaging allows much                  and-pepper OS maps. We will compare several possibilities: eye
higher spatial resolution in three-dimensions but is restricted             divergence, the total number of cells in V1, the thalamocortical
to far smaller areas of the cortex. This technique, for example,            networks that provide their visual inputs, the topography of the
allows the visualization of single neurons in an entire column              retina and the phylogenetic relationships between mammalian
of cortex (Tischbirek et al., 2019). The two-photon technique               species, and discuss how each factor may influence cortical map
requires the cells to be loaded with a calcium sensitive dye or             structure. We propose that the central-to-peripheral ratio (CP
made to express a genetically encoded calcium indicator. Both               ratio) of retinal cell density is good at predicting the presence or
techniques allow the activity-dependent fluorescent signals to              absence of OS maps.
be measured, thus allowing fine detailed mapping of cortical
areas. (3) Whenever investigating cortex, it is useful to record
electrical responses from cortical cells at the spiking level. This         Understanding Cortical Maps Through
not only provides essential information about neural processing             Eye Divergence
but also validates the data from the OI (Zepeda et al., 2004).              Could animals with frontal eyes have pinwheel OS maps while
In recent years multi-electrode recordings have become possible             lateral eyed animals have salt-and-pepper maps? Figure 2 plots
and this has greatly improved the capacity to correlate OI with             binocular overlap in the visual field against eye divergence for
massed recording techniques (Nauhaus and Ringach, 2007). (4)                mammals that have had their cortical OS maps assessed. Pupillary
Dye injection into various regions of brains allows the local and           (eye) divergence can be quantified by photographing the eyes
long-distance connectivity to be established (Bosking et al., 1997).        while the animal is facing a distant light source. The images of this
This is fundamental to understanding cortical map structures.               light, formed by reflection at the corneas, coincide approximately
For example, dye injections into the lateral geniculate nucleus             with the optical centers of the eyes, and the distance by which
(LGN), which is the relay center between the retina and V1                  the separation of the pupils exceeds the separation of these
can establish the topography of the retinal cells that provide the          images is defined as pupillary divergence (Olson and Freeman,
input to V1 (e.g. Wimborne et al., 1999). (5) Finally, computer             1978). Figure 2 shows which species have pinwheel (blue) or
modeling is a critical technique in understanding cortical                  salt-and-pepper (red) maps. The species in blue at the top left
maps in several important ways (Durbin and Mitchison, 1990;                 are from humans, macaques, squirrel monkeys, owl monkeys,
Swindale, 1996; Koulakov and Chklovskii, 2001; Goodhill, 2007).             bushbabies, and the domestic cat. The species in red at the
These models offer potential mechanisms that can be tested                  bottom right are squirrels, rats, mice, and rabbits. If our analysis
experimentally and provide quantitative methods for developing              stopped there, we could draw quite a robust conclusion that
new theories.                                                               a lack of orientation columns in the cortex is associated with
                                                                            animals that have highly diverged eyes and small binocular fields,
Understanding Cortical Maps Through                                         while those with pinwheel structures in cortex have small eye
Comparative Physiology                                                      divergence and large binocular fields. However, tree shrews and
Why do some mammals have salt-and-pepper OS maps and                        ferrets (green diamonds) contradict this simple theory because
others pinwheel OS maps? This question is a hotly debated                   both have quite laterally positioned eyes and small binocular
topic in the fields of visual neuroscience and developmental                overlaps, yet they have exquisite pinwheel OS maps (Bosking
neurobiology (Horton and Adams, 2005; Van Hooser et al.,                    et al., 1996; Rao et al., 1997). The species in gray in Figure 2
2005; Kaschube et al., 2010; Scholl et al., 2013; Vidyasagar and            show four species of mammals that have not had their cortices
Eysel, 2015; Kremkow et al., 2016). There are many factors that             imaged (i.e. sheep, wallaby, fruit bat, and agouti). Measuring the
might influence evolution’s choice of OS map. These include                 cortical map structures in these species would clearly help to fill
(a) predator versus prey, (b) the degree to which animals are               in essential missing data.
nocturnal, (c) the need for binocular processing based on the                  The agouti clearly has quite lateral eyes but no specific
divergence of the eyes, (d) the size of the brain (or visual                optical measure has been conducted, so we show it as a span
cortex), (e) the sophistication of the cortical architecture, (f) the       of eye divergence angles (horizontal gray line). However, its
resolution of the visual system, (g) the thalamocortical networks           binocular overlap has been measured as 20◦ (Picanço-Diniz
that provide their visual inputs, (h) the distribution of retinal           et al., 2011). The wallaby is a particularly interesting species
ganglion cells (RGCs) in the retina, which is thought to be related         to study as its eye divergence is almost exactly 45◦ , placing
to each species’ visual environment (Hughes, 1977), or (i) a                it between the two extremes. The bat and the sheep are also
genetic factor related to phylogeny.                                        interesting species to examine as they naturally cluster on
    We will begin by discounting the first two things on this               this plot, respectively, with the frontal or lateral eyed species
list. Might predators have pinwheel structures and herbivores               but electrophysiological evidence suggests that the sheep might
a salt-and-pepper structure? Primates contradict this notion as             have pinwheel cortical maps (see below), while we can only
all have pinwheel maps but most are fructivores. Moreover, a                hypothesize about the bat at present.

Frontiers in Systems Neuroscience | www.frontiersin.org                 3                                         March 2020 | Volume 14 | Article 10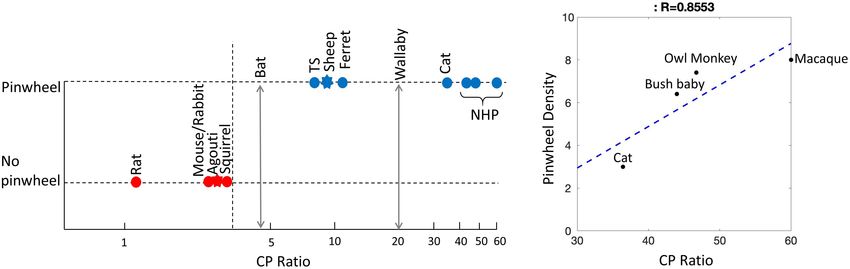
Ibbotson and Jung                                                                                                                                   Maps in Visual Cortex

  FIGURE 2 | Binocular overlap plotted against eye divergence in mammals. The black vertical line shows an eye divergence of 45 degrees, which divides frontal from
  lateral eyed animals: Eye divergence = 90 degrees – Orbit convergence. Species names in blue have pinwheel maps. Species names in red have salt-and-pepper
  maps. Ferrets and tree shrews have names and symbols in green: both have pinwheel maps. Species names in gray are those that we suggest should be
  investigated in future studies: agouti, fruit bat, sheep, and wallaby. Adapted from Heesy (2004) with permission from the copyright holder. Binocular overlap data for
  agouti is from Picanço-Diniz et al. (2011).

Understanding Cortical Maps Through                                                     the type of OS map structure. They presented a model in which
V1 Cell Numbers, Cortical Complexity,                                                   the number of cells in V1 influences the interactions between
                                                                                        neurons – according to their model, the more cells the more
and Spatial Resolution                                                                  likely the brain organizes itself into columns. To support this
Could it be that mammals with smaller primary visual cortices,                          notion, they presented a graph that plotted cell number in cortex
relatively undifferentiated cortices or poor-resolution vision are                      against the existence, or not, of OS maps. We present a modified
restricted to having salt-and-pepper OS maps? These concepts                            and updated version of that plot in Figure 3. It shows that all
were thoroughly investigated by selecting a rodent that has good                        primates and the cat have large cortical cell populations (>30 M)
spatial resolution, and a V1 that is highly differentiated and has a                    and pinwheel maps, while all rodents that have had their OS
surface area similar to that of animals with pinwheel OS maps; the                      maps studied have low numbers of cortical cells (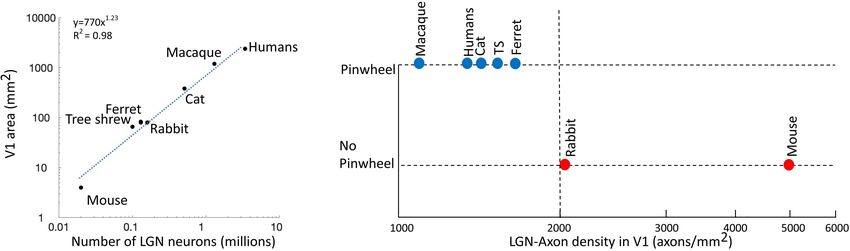
Ibbotson and Jung                                                                                                                                  Maps in Visual Cortex

  FIGURE 3 | Existence of pinwheels plotted against the number of cells in V1. Red, no pinwheels; blue, pinwheels. Circles show results from intrinsic optical imaging.
  Stars show results obtained only from single-cell recording. The dotted vertical line shows the possible threshold between species with pinwheels and those without.
  Note that the Agouti has more cells in V1 than both ferrets and tree shrews but the indication is that they have a salt-and-pepper map. The double-headed vertical
  arrow shows the cell count in wallaby V1 – it is not yet known if they have pinwheels. Fer, ferret; TS, tree shrew; NHP, non-human primates (including marmoset,
  bush baby, owl monkey, squirrel monkey, macaque); Chimp, chimpanzee. Reproduced from Weigand et al. (2017) with permission from the copyright holder.

distance across the cortex has been conducted for the agouti                           we could not add the fruit bat into Figure 3 because we
(Ferreiro, 2018). It showed that the local correlations in OS                          do not yet have a reliable measure of the number of cells
were similar to those of the mouse and very different to the                           in fruit bat V1.
cat. In the cat the similarity of orientation preferences changes
slowly and smoothly, which corresponds with a pinwheel map
structure. These smooth changes did not occur in the agouti.                           Understanding Cortical Maps Through
Instead there were abrupt changes in the OS of neighboring cells                       Understanding the Visual Pathways
with a clustering of cells with similar orientation preferences                        Recent work suggests that cortical maps are seeded by the
occurring only over very short ranges. Therefore, the agouti                           thalamocortical networks that provide their input (Paik and
may at most have minicolumns, which would appear with                                  Ringach, 2011; Nauhaus and Nielsen, 2014; Wang et al., 2015;
two-photon calcium imaging, as is the case in mice (Kondo                              Kremkow et al., 2016; Lee et al., 2016). The visual pathway
et al., 2016). This mapping does not support Weigand et al.’s                          to the cortex is from RGCs to LGN to V1. Each V1 neuron
(2017) theory (because ferret and tree shrew have far smaller                          receives input from a bundle of thalamic afferents that control the
cell numbers in cortex) but does support the theory that all                           shape of the cortical receptive field. The ON and OFF thalamic
rodents have a consistent lack of the classic pinwheel OS maps,                        afferents rotate around each other to minimize the cortical wiring
as found in other mammals (see the section “Understanding                              needed to represent visual points (Schummers et al., 2002). It
Cortical Maps Through Phylogeny”). Given Ferreiro’s results,                           has been revealed through experimental studies that the receptive
we have tentatively placed the agouti on the “no pinwheel”                             field structure of ON and OFF thalamic afferents can predict
line in Figure 3.                                                                      orientation preference and the clustering of cells in cortical
    The sheep has 18 M cells in cortex, but its OS map structure                       domains (Koch et al., 2016; Kremkow et al., 2016). However, it
remains unknown. Based on the observation that orientation                             remains unknown whether ON–OFF rotation in receptive field
preferences changed slowly during single electrode recordings it                       position is developed by the mosaic arrangement of ON and
is likely that the sheep has a structured, pinwheel-like orientation                   OFF ganglion cells in retina (Wässle et al., 1981; Soodak et al.,
map (Clarke et al., 1976; Ramachandran et al., 1977; Kennedy                           1987; Ringach, 2004; Paik and Ringach, 2011) or by the strongly
et al., 1983). Therefore, we have tentatively placed the sheep                         correlated firing between ON and OFF thalamic afferents (Miller,
on the “has pinwheel” line in Figure 3. Clearly, an imaging                            1994; Goodhill and Löwel, 1995; Nakagama et al., 2000).
investigation of agouti and sheep cortices would be a very                                 A theory proposed by Paik and Ringach (2011) suggests that
useful way of filling in the missing data to confirm or reject                         Moire interference patterns formed by the ON and OFF ganglion
the theory of Weigand et al. (2017). Rather than thinking of                           cell arrays create different patterns of OS in the cortex, which
the data confirming or rejecting the theory, it is also worth                          resemble pinwheel maps. If true, this model could have a role
considering that the theory has merit but in the transition zone                       in determining whether a species has pinwheel maps. However,
between large and small numbers of cortical cells, other factors                       the model requires that the ON and OFF arrays are geometrically
also play important roles, as outlined below. Unfortunately,                           precise while the system is imprecise in lining up the two arrays.

Frontiers in Systems Neuroscience | www.frontiersin.org                            5                                                 March 2020 | Volume 14 | Article 10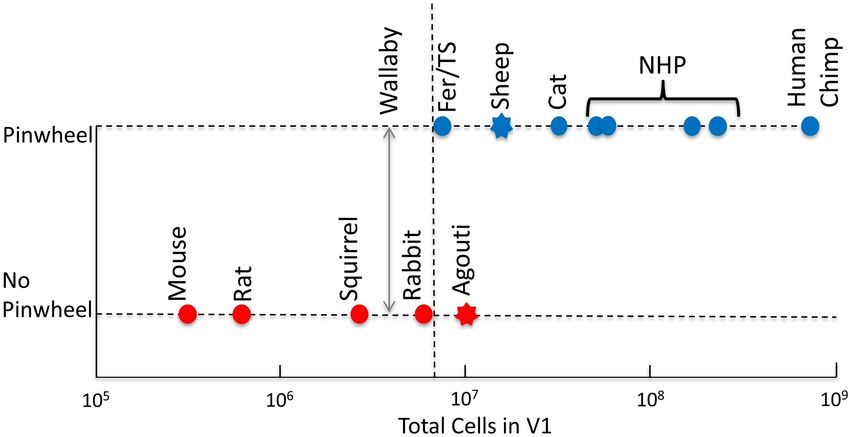
Ibbotson and Jung                                                                                                           Maps in Visual Cortex

Hore et al. (2012) showed that the RGCs do not have the spatial           propose that the CP ratio is high among species with organized
distributions required to create perfect ON and OFF retinal               pinwheel maps and low in those without. Moreover, the CP
mosaics. Additionally, a more recent computational model by               ratios correlate strongly with pinwheel density (per mm2 ) in
Schottdorf et al. (2014) suggests that the spatial structure of cat       species with pinwheel maps. To show this, we have conducted
and macaque retinal mosaics are not plausible for seeding the             a comparative analysis of ganglion cell distribution maps across
orientation preference maps of the primary visual cortex. It is           various species for which visual cortex has been studied. Each
also not clear how the geometrical realities imposed by different         species has a unique arrangement of retinal specializations (areas
retinal designs might affect the arrangement of ON and OFF                of higher cell density), which appears to be influenced by
RGCs (see below for retinal designs).                                     ecological and developmental selective pressures in its ecological
    Mazade and Alonso (2017) propose that the spacing between             niche and habitat (Hughes, 1977; Collin, 1999, 2008). Mammalian
thalamic axon patches with overlapping receptive fields needs             retinas have been traditionally divided into two types: those
to be greater than 2 axon patches to allow afferents to cluster           with an area centralis (AC) and those with a visual streak (VS)
within different cortical domains. As shown in Figure 4A, as              (Figure 5; Moore et al., 2012). However, this terminology does
the number of LGN neurons increases, the size of V1 increases             not tell the whole story. A quantitative measure such as the
in a non-linear fashion, as shown by the exponential plot                 CP factor may help us understand in more detail how RGC
(y = 770x1.23 , R2 = 0.98) (Stevens, 2001), i.e. V1’s size becomes        organization influences V1 organization.
much larger than that expected from a linear co-scaling of                   Published retinal topography maps have iso-density contour
thalamus and cortex. In primates, carnivores, and scandentia (e.g.        lines showing variations in cell density across the retina. The
tree shrew), the overexpansion of area V1 makes the density               iso-density lines are used to measure the changes in cell density
of LGN axons per mm2 of cortical area smaller. In Figure 4B,              from retinal periphery to the retinal specialization (Moore et al.,
we can see that species with low densities of LGN axons in V1             2012). The center of retinal specialization is the point with the
have pinwheel maps, while in species with high LGN densities              highest RGC density, which is often marked as a black dot in
(>2000 axons/mm2 ) the pinwheels are absent. It seems that there          the topographic maps. If this point was not reported in published
is a certain threshold between species with pinwheels and those           maps, the center of retinal specialization density was determined
without, which we have tentatively drawn as a dashed line at              as the density marked on the inner most iso-contour line of
2000 axons/mm2 . Unfortunately, we do not have information                the map. The peripheral density was defined as the density at
regarding the LGN densities of the four species that we have              the extreme edge of the retina (in nasal and temporal regions).
highlighted above as future candidates, making such studies               When the outer perimeter of the retina was not available, the
worthwhile future pursuits.                                               cell density of the first iso-density line shown nearest the outer
    The high total number of LGN neurons in primates and                  perimeter of the retina was halved. This method was utilized
carnivores are associated with larger numbers of central RGCs             by Moore et al. (2012), based on the patterns observed in
(Kremkow and Alonso, 2018). As a result of evolutionary                   the topographic maps that included information on the outer
pressure, primates and carnivores have greater binocular overlap          perimeter of the retina. In most species, the cell densities of
and in turn, there is a greater percentage of RGCs projecting             nasal and temporal periphery were the same, but for mouse,
to the LGN. In primates and cats, most RGCs project to the                cat, sheep, and agouti, they were different. So, the nasal and
LGN and very few project to other subcortical regions (Illing and         temporal peripheral values were averaged for these species. We
Wässle, 1981; Perry and Cowey, 1984). In comparison, most of              assumed that the retinal whole-mount methodology was similar
the mouse and rabbit RGCs project to the superior colliculus              across studies to produce the topographic maps. For instance,
and other subcortical regions responsible for visual navigation           we assumed that the wholemount was correctly oriented and the
(Ellis et al., 2016).                                                     degree of shrinkage was similar across studies. Also, we assumed
    Different mammalian species have different ways of                    that the cells counted were all RGCs, because in some studies
organizing their retinal inputs to accommodate their visual               the amacrine cells were difficult to distinguish from the ganglion
needs. For example, the retinal inputs in rabbits are devoted to          cell layers (Hughes, 1975; Vitek et al., 1985), thus, potentially
peripheral vision and offer a panoramic view of the environment.          resulting in higher cell densities in the periphery. We understand
This gives them the best opportunity to lookout for predators             that the assumptions mentioned above could introduce a certain
(Oyster et al., 1981). On the other hand, primates have a                 degree of error in our measurements. Despite these limitations,
strong retinal bias toward central vision to process high acuity          we believe the CP ratios can be used to study how retinal
vision. Therefore, the spatial distribution of retinal inputs is an       topography influences cortical OS maps.
important factor determining the number of thalamic afferents                Arboreal species or those inhabiting dense forests generally
to V1 (see below for more on retinal topography).                         have an AC, i.e. cell isodensity contours are circular and are
                                                                          centered roughly on the middle of the retina (e.g. Figures 5A–
                                                                          C). This type of design provides a range of acuities across
Understanding Cortical Maps Through                                       the visual field in all directions. However, not all retinas with
Retinal Topography                                                        an AC are the same. Three general types of AC have been
Here we use a centroperipheral ratio, CP, which is the ganglion           identified (Hughes, 1977). Some species with an AC have low
cell density in the center of the retinal specialization divided by       ganglion cell densities with little centroperipheral gradient (CP
the peripheral cell density (Navarro-Sempere et al., 2018). We            ratio < 3.0). This is common in small nocturnal animals living in

Frontiers in Systems Neuroscience | www.frontiersin.org               6                                        March 2020 | Volume 14 | Article 10
Ibbotson and Jung Maps in Visual Cortex FIGURE 4 | The LGN-axon densities in V1. (A) The number of LGN cells is correlated to the size of area V1. Blue dotted line shows an exponential plot (y = 770x1.23 , R2 = 0.98). (B) Existence of pinwheels plotted against the LGN-axon density in V1. Red, no pinwheels; blue, pinwheels. The dotted vertical line shows the possible threshold between species with pinwheels and those without. Reproduced from Mazade and Alonso (2017) with permission from the copyright holder. FIGURE 5 | Retinal cell isodensity contour maps. (A) Mouse retina, (B) rhesus macaque retina, (C) cat retina, (D) bat retina, (E) wallaby retina, (F) goat retina, (G) agouti, and (H) rabbit. Parts A reproduced from Dräger and Olsen (1981), B from Perry and Cowey (1985), C from Hughes (1975), D from Pettigrew (1986), E from Wimborne et al. (1999), F from Gonzalez-Soriano et al. (1997), G from Silveira et al. (1989), and H from Oyster et al. (1981) with permission from the copyright holder. scrubland, such as mice, rats, and guinea pigs (Figure 5A). Others two types of VS design. Some mammals have a VS in which cell have moderate ganglion cell densities but the centroperipheral density is consistent along the entire horizon, such as rabbits and density gradient remains low (30). This final category, movements (Hughes, 1977). The second type of VS occurs in a which is most often associated with primates, offers very high wide variety of mammals. In this case there is a horizontal streak visual acuity in the central visual field (Figure 5B and Table 1). but the region of the retina that points directly forward has a Instead of circular isodensity contours in the retina, many zone of particularly high cell density (Figures 5D–F). In cats the species have an elongated, horizontal region of the retina that has adult eye divergence from the frontal axis is around 8 degrees relatively high cell density, referred to as a VS. However, there are (Olson and Freeman, 1978). The region of higher density in Frontiers in Systems Neuroscience | www.frontiersin.org 7 March 2020 | Volume 14 | Article 10
Ibbotson and Jung                                                                                                                                        Maps in Visual Cortex

TABLE 1 | Relationship between retinal ganglion cell arrangement and orientation map design.

Species                                     Center of retinal         Temporal             Nasal periphery     Retinal design          Centro-        Pinwheel        Total
                                             specialization           periphery             (cells/sq. mm)                            peripheral       density     pinwheels
                                            density (cells/sq.      (cells/sq. mm)                                                     density         (mm2 )         in V1
                                                  mm)

Rat (R. norvegicus)                               >6000                  4250                   4250                  AC                  1.4              –             –
Mouse (genus Mus)                                 >8000                  1500                   4500                  AC                  2.7              –             –
Rabbit (Oryctolagus cuniculus)                    >4000                  1500                   1500                  VS                  2.7              –             –
Ground squirrel (Spermophilus beecheyi)          >24,000                 7500                   7500                  VS                  3.2              –             –
Tree shrews                                      >19,000                 2500                   2500              AC and VS               7.6             9.4          564
Ferret (M. putorius)                              >5500                   500                   500               AC and VS              11.0             5.5          429
Cat (Felis catus)                                >10,000                  150                   400               AC and VS              36.4             3.0          1140
Bush baby (galgos)                               >11,000                  250                   250               AC and VS              44.0             6.4          890
Owl monkey (Simia trivirgata)                     >7000                   150                   150                  Fovea               46.7             7.4          2124
Rhesus macaque (Macaca mulatta)                  >30,000                  500                   500                  Fovea               60.0             8.0         10,152
Agouti (Dasyprocta)                               >5000                  125*                   1750                  VS                  2.9              ?             ?
Fruit bat (Pteropus spp.)                         >9000                  2000                   2000                  AC                  4.5              ?             ?
Sheep (Ovis aries)                                >5000                   375                   750               AC and VS               8.9              ?             ?
Wallaby (Macropus eugenii)                        >5000                   250                   250               AC and VS               20               ?             ?

Shading shows data from animals suggested for future research. Retinal ganglion cell values for mouse: Dräger and Olsen (1981); rat: Jeffery (1985); rabbit: Oyster et al.
(1981); Ground squirrel: Long and Fisher (1983); tree shrew: DeBruyn (1983); ferret: Vitek et al. (1985); cat: Hughes (1975); bush baby: DeBruyn et al. (1980); owl monkey:
Webb and Kaas (1976); Rhesus Macaque: Perry and Cowey (1985); agouti: Silveira et al. (1989); fruit bat: Pettigrew (1986); sheep: Hebel (1976); and wallaby: Wimborne
et al. (1999). Except for ferret, all pinwheel densities are from Xu et al. (2004), which are averages calculated from the following sources: bush baby: Bosking et al. (1996);
owl monkey: Xu et al. (2004); squirrel monkey: Blasdel and Campbell (2001); macaque monkey: Obermayer and Blasdel (1997); tree shrew: Bosking et al. (1997); and
cat: Müller et al. (2000). Ferret pinwheel density is from Rao et al. (1997). *For agouti, only the cell density from the nasal side is used in calculating the CP ratio because
very few iso-density lines are on the temporal side of the retina.

their VS is concomitantly displaced laterally by around 8 degrees                          close to primates (CP ratio of 36), the orientation columns are
in each eye to maximize visual acuity frontally. In the case of                            unexpectedly broad (3 pinwheels per mm2 ) (Figure 6).
the cat, most authors state that they have an AC but in reality                                Tree shrews and ferrets have moderate CPs and they have
they have a combination of a VS and an AC. Similarly, in the                               orientation columns but they seem to be intermediate between
sheep/goat retina, the lateral region of the VS has very high cell                         species that have pinwheels and those without. In the ferret
density at the point associated with frontal vision (Clarke and                            the CP ratio is 11, which is much lower than the cat, but its
Whitteridge, 1976; Hebel, 1976). We do not have a contour map                              pinwheel density is closer to that of a primate (5.5 pinwheels
from the sheep but instead provide one from the goat retina                                per mm2 ). Similarly, in the tree shrew the CP ratio is
Ibbotson and Jung Maps in Visual Cortex
FIGURE 6 | Relationship between retinal ganglion cell arrangement and orientation map design. (A) Existence of pinwheels plotted against the CP ratios. Red, no
pinwheels; blue, pinwheels. Circles show results from intrinsic optical imaging. Stars show results obtained only from single-cell recording. The dotted vertical arrow
shows the possible threshold between species with pinwheels and those without. The double-headed vertical arrows show wallaby and bat CP ratios – it is not yet
known if they have pinwheels. TS, tree shrew; NHP, non-human primates (including bush baby, owl monkey, macaque). (B) For cat and primates, the pinwheel
density (per mm2 ) is plotted as a function of CP ratio. The linear regression is shown as a blue dashed line (R = 0.8553).
particularly as the electrophysiology data support this notion
(Clarke et al., 1976). Also, recall that the sheep has a large
cell count in visual cortex, which also supports the idea of
a pinwheel map structure (Figure 3). (4) Fruit bats have a
centralized retinal input to the cortex, but their CP ratio of
4.5 is low so it will be interesting to know if they have a
pinwheel map structure. It is worth noting that while the CP
ratio is low in bats, unlike most mammals the drop-off in the
periphery is mild, so while the CP ratio is low it is because
the peripheral cell density is usually high, compared to the
central cell density.
Interestingly, a study was conducted in which nose length and
retinal design were compared in dogs (McGreevy et al., 2004). All
FIGURE 7 | Mammalian phylogenetic tree. Mammalian order names in blue
of the dogs were from the same species (Canis lupus familiaris)
have pinwheels. Order names in red have salt-and-pepper. Order names in but were from different man-reared breeds. It was found that
gray are those without optical imaging data. Asterisks are those that we dogs with short noses and frontal eyes (e.g. pugs) had a retinal
suggest should be investigated in future studies: wallaby (Marsupial), fruit bat design best described as an AC, while dogs with long noses and
(Chiroptera), sheep (Artiodactyla), and agouti (Rodents). The dotted lines show
lateral eyes (e.g. greyhound) had VSs not dissimilar to rabbits.
where the mammalian clades diverge. MYA, millions of years ago.
This finding shows that there may well be a close link between
the genetics controlling head configuration and retinal design.
Alternatively, being born with eyes that point either frontally or
structure is not known. Based on our CP theory, we would expect laterally might promote a developmental predisposition toward
it to have a pinwheel structure. However, the wallaby has an a particular retinal design. Unfortunately, it was not possible in
intermediate number of cells in cortex (3.5 M, Figure 3) that sits McGreevy et al.’s (2004) post-mortem study to investigate cortical
between the squirrel and rabbit, which would suggest a salt-and- design in the various dog breeds. While probably impossible to
pepper structure based on the “more cells more structure” theory do based on the sensitivity of the community to research on
(Weigand et al., 2017). (2) Evidence from electrophysiological, dogs, an obvious experiment to establish the importance of retinal
rather than optical, recording suggests that the agouti may have design on cortical organization would be to record cortical maps
a salt-and-pepper OS map (Ferreiro, 2018), and it has a low CP in dog breeds that have VSs compared to those with an AC. Such
ratio of 2.9. We are reasonably confident that the agouti will an experiment has the natural control that all animals are from
not have a pinwheel map. (3) The sheep/goat has a mixture of the same species.
a VS and a small, temporally located “AC” (Shinozaki et al.,
2010). They have high retinal cell density and a CP ratio close
to 9. Sheep have surprisingly good visual acuity that exceeds Understanding Cortical Maps Through
that of domestic cats (Clarke and Whitteridge, 1976). We cannot Phylogeny
predict with certainty at this point whether the sheep will have Figure 7 provides a visual guide to mammalian phylogeny
pinwheel maps, but we think the evidence favors this prediction, (Springer et al., 2003; Luo et al., 2011). Virtually everything we
Frontiers in Systems Neuroscience | www.frontiersin.org 9 March 2020 | Volume 14 | Article 10Ibbotson and Jung Maps in Visual Cortex know about visual cortex in mammals comes from work on found in primates (Pettigrew, 1986). While the retinotopy of fruit rodents, rabbits, members of the order Carnivora, and primates. bat visual cortex has been studied and reveals a strong cortical These species comprise an extremely small subset (
Ibbotson and Jung                                                                                                                                             Maps in Visual Cortex

Collin, S. P. (1999). “Behavioural ecology and retinal cell topography,” in Adaptive           Hughes, A. (1971). Topographical relationships between the anatomy and
    Mechanisms in the Ecology of Vision, eds S. N. Archer, M. B. A. Djamgoz,                       physiology of the rabbit visual system. Doc. Ophthalmol. 30, 33–159. doi: 10.
    E. R. Loew, J. C. Partridge, S. Vallerga (Dordrecht: Springer), 509–535. doi:                  1007/bf00142518
    10.1007/978-94-017-0619-3_17                                                               Hughes, A. (1975). A quantitative analysis of the cat retinal ganglion
Collin, S. P. (2008). A web-based archive for topographic maps of retinal cell                     cell topography. J. Comp. Neurol. 163, 107–128. doi: 10.1002/cne.90163
    distribution in vertebrates. Clin. Exp. Optom. 91, 85–95. doi: 10.1111/j.1444-                 0107
    0938.2007.00228.x                                                                          Hughes, A. (1977). “The topography of vision in mammals of contrasting life style:
DeBruyn, E., Wise, V., and Casagrande, V. (1980). The size and topographic                         comparative optics and retinal organisation,” in The Visual System in Vertebrates
    arrangement of retinal ganglion cells in the galago. Vision Res. 20, 315–327.                  Handbook of Sensory Physiology, ed. F. Crescitelli, (Berlin: Springer), 613–756.
    doi: 10.1016/0042-6989(80)90018-8                                                              doi: 10.1007/978-3-642-66468-7_11
DeBruyn, E. J. (1983). The Organization and Central Terminations of Retinal                    Ibbotson, M. R., and Mark, R. F. (2003). Orientation and spatiotemporal tuning
    Ganglion Cells in the Tree Shrew (Tupaia glis). Ph.D. Dissertation, Vanderbilt                 of cells in the primary visual cortex of an Australian marsupial, the wallaby
    University, Nashville, TN.                                                                     Macropus eugenii. J. Comp. Physiol. A 189, 115–123. doi: 10.1007/s00359-002-
Dräger, U. C., and Olsen, J. F. (1981). Ganglion cell distribution in the retina of the            0379-6
    mouse. Invest. Ophthalmol. Vis. Sci. 20, 285–293.                                          Ibbotson, M. R., Mark, R. F., and Maddess, T. L. (1994). Spatiotemporal response
Durbin, R., and Mitchison, G. (1990). A dimension reduction framework for                          properties of direction-selective neurons in the nucleus of the optic tract and
    understanding cortical maps. Nature 343, 644–647. doi: 10.1038/343644a0                        dorsal terminal nucleus of the wallaby, Macropus eugenii. J. Neurophysiol. 72,
Ellis, E. M., Gauvain, G., Sivyer, B., and Murphy, G. J. (2016). Shared and distinct               2927–2943. doi: 10.1152/jn.1994.72.6.2927
    retinal input to the mouse superior colliculus and dorsal lateral geniculate               Illing, R.-B., and Wässle, H. (1981). The retinal projection to the thalamus in the
    nucleus. J. Neurophysiol. 116, 602–610. doi: 10.1152/jn.00227.2016                             cat: a quantitative investigation and a comparison with the retinotectal pathway.
Espinosa, J. S., and Stryker, M. P. (2012). Development and plasticity of the primary              J. Comp. Neurol. 202, 265–285. doi: 10.1002/cne.902020211
    visual cortex. Neuron 75, 230–249. doi: 10.1016/j.neuron.2012.06.009                       Jeffery, G. (1985). The relationship between cell density and the nasotemporal
Feldman, D. E., and Brecht, M. (2005). Map plasticity in somatosensory cortex.                     division in the rat retina. Brain Res. 347, 354–357. doi: 10.1016/0006-8993(85)
    Science 310, 810–815. doi: 10.1126/science.1115807                                             90198-2
Ferreiro, D. N. (2018). Orientation Selectivity of Neurons and their Spatial Layout            Kaas, J. H. (2017). “Changing concepts of visual cortex organization in primates,” in
    in Cat and Agouti Primary Visual Cortex. Natal: Universidade Federal do Rio                    Neuropsychology of Visual Perception, ed. J. W. Brown (Didcot: Taylor & Francis
    Grande do Norte.                                                                               group), 3–32.
Gonzalez-Soriano, J., Mayayo-Vicente, S., Martinez-Sainz, P., Contreras-                       Kaschube, M., Schnabel, M., Lowel, S., Coppola, D. M., White, L. E., and Wolf, F.
    Rodriguez, J., and Rodriguez-Veiga, E. (1997). A quantitative study                            (2010). Universality in the evolution of orientation columns in the visual cortex.
    of ganglion cells in the goat retina. Anat. Histol. Embryol. 26, 39–44.                        Science 330, 1113–1116. doi: 10.1126/science.1194869
    doi: 10.1111/j.1439-0264.1997.tb00101.x                                                    Kennedy, H., Martin, K., and Whitteridge, D. (1983). Receptive field characteristics
Goodhill, G. J. (2007). Contributions of theoretical modeling to the understanding                 of neurones in striate cortex of newborn lambs and adult sheep. Neuroscience
    of neural map development. Neuron 56, 301–311. doi: 10.1016/j.neuron.2007.                     10, 295–300. doi: 10.1016/0306-4522(83)90134-3
    09.027                                                                                     Koch, E., Jin, J., Alonso, J. M., and Zaidi, Q. (2016). Functional implications of
Goodhill, G. J., and Löwel, S. (1995). Theory meets experiment: correlated                         orientation maps in primary visual cortex. Nat. Commun. 7:13529. doi: 10.1038/
    neural activity helps determine ocular dominance column periodicity. Trends                    ncomms13529
    Neurosci. 18, 437–439. doi: 10.1016/0166-2236(95)94490-v                                   Kondo, S., Yoshida, T., and Ohki, K. (2016). Mixed functional microarchitectures
Grinvald, A., Lieke, E., Frostig, R. D., Gilbert, C. D., and Wiesel, T. N. (1986).                 for orientation selectivity in the mouse primary visual cortex. Nat. Commun.
    Functional architecture of cortex revealed by optical imaging of intrinsic                     7:13210. doi: 10.1038/ncomms13210
    signals. Nature 324, 361–364. doi: 10.1038/324361a0                                        Koulakov, A. A., and Chklovskii, D. B. (2001). Orientation preference patterns in
Harris, K. D., and Mrsic-Flogel, T. D. (2013). Cortical connectivity and sensory                   mammalian visual cortex. Neuron 29, 519–527. doi: 10.1016/s0896-6273(01)
    coding. Nature 503, 51–58. doi: 10.1038/nature12654                                            00223-9
Harrison, T. C., Ayling, O. G., and Murphy, T. H. (2012). Distinct cortical circuit            Kremkow, J., and Alonso, J.-M. (2018). Thalamocortical circuits and functional
    mechanisms for complex forelimb movement and motor map topography.                             architecture. Annu. Rev. Vis. Sci. 4, 263–285. doi: 10.1146/annurev-vision-
    Neuron 74, 397–409. doi: 10.1016/j.neuron.2012.02.028                                          091517-034122
Hebel, R. (1976). Distribution of retinal ganglion cells in five mammalian species             Kremkow, J., Jin, J., Wang, Y., and Alonso, J. M. (2016). Principles underlying
    (pig, sheep, ox, horse, dog). Anat. Embryol. 150, 45–51.                                       sensory map topography in primary visual cortex. Nature 533, 52–57. doi:
Heesy, C. P. (2004). On the relationship between orbit orientation and binocular                   10.1038/nature17936
    visual field overlap in mammals. Anat. Rec. 281A, 1104–1110. doi: 10.1002/ar.a.            Lee, K.-S., Huang, X., and Fitzpatrick, D. (2016). Topology of ON and OFF inputs
    20116                                                                                          in visual cortex enables an invariant columnar architecture. Nature 533, 90–94.
Hemmi, J. M., and Mark, R. F. (1998). Visual acuity, contrast sensitivity and                      doi: 10.1038/nature17941
    retinal magnification in a marsupial, the tammar wallaby (Macropus eugenii).               Long, K. O., and Fisher, S. K. (1983). The distributions of photoreceptors and
    J. Comp. Physiol. A Sens. Neural Behav. Physiol. 183, 379–387. doi: 10.1007/                   ganglion cells in the California ground squirrel, Spermophilus beecheyi. J. Comp.
    s003590050264                                                                                  Neurol. 221, 329–340. doi: 10.1002/cne.902210308
Hore, V. R., Troy, J. B., and Eglen, S. J. (2012). Parasol cell mosaics                        Luo, Z.-X., Yuan, C.-X., Meng, Q.-J., and Ji, Q. (2011). A Jurassic eutherian
    are unlikely to drive the formation of structured orientation maps in                          mammal and divergence of marsupials and placentals. Nature 476, 442–445.
    primary visual cortex. Vis. Neurosci. 29, 283–299. doi: 10.1017/s095252381200                  doi: 10.1038/nature10291
    0338                                                                                       Markram, H., Muller, E., Ramaswamy, S., Reimann, M. W., Abdellah, M., Sanchez,
Horton, J. C., and Adams, D. L. (2005). The cortical column: a structure without a                 C. A., et al. (2015). Reconstruction and simulation of neocortical microcircuitry.
    function. Philos. Trans. R. Soc. B Biol. Sci. 360, 837–862. doi: 10.1098/rstb.2005.            Cell 163, 456–492.
    1623                                                                                       Mazade, R., and Alonso, J. M. (2017). Thalamocortical processing in vision. Vis.
Hubel, D. H., Wiesel, T. N., and LeVay, S. (1977). Plasticity of ocular dominance                  Neurosci. 34:E007. doi: 10.1017/s0952523817000049
    columns in monkey striate cortex. Philos. Trans. R. Soc. Lond. B Biol. Sci. 278,           McGreevy, P., Grassi, T. D., and Harman, A. M. (2004). A strong correlation exists
    377–409. doi: 10.1098/rstb.1977.0050                                                           between the distribution of retinal ganglion cells and nose length in the dog.
Hübener, M., Shoham, D., Grinvald, A., and Bonhoeffer, T. (1997). Spatial                          Brain Behav. Evol. 63, 13–22. doi: 10.1159/000073756
    relationships among three columnar systems in cat area 17. J. Neurosci. 17,                Miller, K. (1994). A model for the development of simple cell receptive fields and
    9270–9284. doi: 10.1523/jneurosci.17-23-09270.1997                                             the ordered arrangement of orientation columns through activity-dependent

Frontiers in Systems Neuroscience | www.frontiersin.org                                   11                                                   March 2020 | Volume 14 | Article 10
Ibbotson and Jung Maps in Visual Cortex competition between ON- and OFF-center inputs. J. Neurosci. 14, 409–441. Reid, R. C. (2012). From functional architecture to functional connectomics. doi: 10.1523/jneurosci.14-01-00409.1994 Neuron 75, 209–217. doi: 10.1016/j.neuron.2012.06.031 Moore, B. A., Kamilar, J. M., Collin, S. P., Bininda-Emonds, O. R. P., Dominy, N. J., Ringach, D. L. (2004). Haphazard wiring of simple receptive fields and orientation Hall, M. I., et al. (2012). A novel method for comparative analysis of retinal columns in visual cortex. J. Neurophysiol. 92, 468–476. doi: 10.1152/jn.01202. specialization traits from topographic maps. J. Vis. 12:13. doi: 10.1167/12. 2003 12.13 Rosa, M. G. P., Schmid, L. M., Krubitzer, L. A., and Pettigrew, J. D. (1993). Müller, T. M., Stetter, M., Hübener, M., Sengpiel, F., Bonhoeffer, T., Gödecke, I., Retinotopic organization of the primary visual cortex of flying foxes (Pteropus et al. (2000). An analysis of orientation and ocular dominance patterns in the poliocephalus and Pteropus scapulatus). J. Comp. Neurol. 335, 55–72. doi: 10. visual cortex of cats and ferrets. Neural Comput. 12, 2573–2595. doi: 10.1162/ 1002/cne.903350105 089976600300014854 Samollow, P. B. (2008). The opossum genome: insights and opportunities from an Muly, E., and Fitzpatrick, D. (1992). The morphological basis for binocular and alternative mammal. Genome Res. 18, 1199–1215. doi: 10.1101/gr.065326.107 ON/OFF convergence in tree shrew striate cortex. J. Neurosci. 12, 1319–1334. Scholl, B., Pattadkal, J. J., Rowe, A., and Priebe, N. J. (2017). Functional doi: 10.1523/jneurosci.12-04-01319.1992 characterization and spatial clustering of visual cortical neurons in the Nakagama, H., Saito, T., and Tanaka, S. (2000). Effect of imbalance in activities predatory grasshopper mouse Onychomys arenicola. J. Neurophysiol. 117, 910– between ON- and OFF-center LGN cells on orientation map formation. Biol. 918. doi: 10.1152/jn.00779.2016 Cybern. 83, 85–92. doi: 10.1007/s004220000148 Scholl, B., Tan, A. Y. Y., Corey, J., and Priebe, N. J. (2013). Emergence of orientation Nauhaus, I., and Nielsen, K. J. (2014). Building maps from maps in primary visual selectivity in the mammalian visual pathway. J. Neurosci. 33, 10616–10624. cortex. Curr. Opin. Neurobiol. 24, 1–6. doi: 10.1016/j.conb.2013.08.007 doi: 10.1523/jneurosci.0404-13.2013 Nauhaus, I., Nielsen, K. J., Disney, A. A., and Callaway, E. M. (2012). Schottdorf, M., Eglen, S. J., Wolf, F., and Keil, W. (2014). Can retinal ganglion cell Orthogonal micro-organization of orientation and spatial frequency in dipoles seed Iso-orientation domains in the visual cortex? PLoS One 9:e86139. primate primary visual cortex. Nat. Neurosci. 15, 1683–1690. doi: 10.1038/nn. doi: 10.1371/journal.pone.0086139 3255 Schummers, J., Mariño, J., and Sur, M. (2002). Synaptic integration by V1 neurons Nauhaus, I., and Ringach, D. L. (2007). Precise alignment of micromachined depends on location within the orientation map. Neuron 36, 969–978. doi: electrode arrays with V1 functional maps. J. Neurophysiol. 97, 3781–3789. doi: 10.1016/s0896-6273(02)01012-7 10.1152/jn.00120.2007 Seelke, A. M. H., Dooley, J. C., and Krubitzer, L. A. (2012). The emergence of Navarro-Sempere, A., Segovia, Y., and García, M. (2018). Comparative somatotopic maps of the body in S1 in rats: the correspondence between analysis of retinal ganglion cell topography and behavioral ecology in functional and anatomical organization. PLoS One 7:e32322. doi: 10.1371/ Australian marsupials. Int. J. Morphol. 36, 248–257. doi: 10.4067/s0717- journal.pone.0032322 95022018000100248 Shinozaki, A., Hosaka, Y., Imagawa, T., and Uehara, M. (2010). Topography of Obermayer, K., and Blasdel, G. (1993). Geometry of orientation and ocular ganglion cells and photoreceptors in the sheep retina. J. Comp. Neurol. 518, dominance columns in monkey striate cortex. J. Neurosci. 13, 4114–4129. doi: 2305–2315. doi: 10.1002/cne.22333 10.1523/jneurosci.13-10-04114.1993 Silveira, L. C. L., Picanço-Diniz, C. W., and Oswaldo-Cruz, E. (1989). Distribution Obermayer, K., and Blasdel, G. G. (1997). Singularities in primate orientation maps. and size of ganglion cells in the retinae of large Amazon rodents. Vis. Neurosci. Neural Comput. 9, 555–575. doi: 10.1162/neco.1997.9.3.555 2, 221–235. doi: 10.1017/s0952523800001140 Ohki, K., Chung, S., Chng, Y. H., Kara, P., and Reid, R. C. (2005). Functional Soodak, R. E., Shapley, R. M., and Kaplan, E. (1987). Linear mechanism of imaging with cellular resolution reveals precise micro-architecture in visual orientation tuning in the retina and lateral geniculate nucleus of the cat. cortex. Nature 433, 597–603. doi: 10.1038/nature03274 J. Neurophysiol. 58, 267–275. doi: 10.1152/jn.1987.58.2.267 Olson, C. R., and Freeman, R. D. (1978). Development of eye alignment in cats. Springer, M. S., Murphy, W. J., Eizirik, E., and Obrien, S. J. (2003). Placental Nature 271, 446–447. doi: 10.1038/271446a0 mammal diversification and the cretaceous-tertiary boundary. Proc. Natl. Acad. Oyster, C., Takahashi, E., and Hurst, D. (1981). Density, soma size, and regional Sci. 100, 1056–1061. doi: 10.1073/pnas.0334222100 distribution of rabbit retinal ganglion cells. J. Neurosci. 1, 1331–1346. doi: Stevens, C. F. (2001). An evolutionary scaling law for the primate visual system and 10.1523/jneurosci.01-12-01331.1981 its basis in cortical function. Nature 411, 193–195. doi: 10.1038/35075572 Paik, S.-B., and Ringach, D. L. (2011). Retinal origin of orientation maps in visual Swindale, N. V. (1996). The development of topography in the visual cortex: a cortex. Nat. Neurosci. 14, 919–925. doi: 10.1038/nn.2824 review of models. Network 7, 161–247. doi: 10.1088/0954-898x_7_2_002 Pantev, C., Bertrand, O., Eulitz, C., Verkindt, C., Hampson, S., Schuierer, G., Tischbirek, C. H., Noda, T., Tohmi, M., Birkner, A., Nelken, I., and Konnerth, et al. (1995). Specific tonotopic organizations of different areas of the human A. (2019). In vivo functional mapping of a cortical column at single- auditory cortex revealed by simultaneous magnetic and electric recordings. neuron resolution. Cell Rep. 27, 1319–1326.e5. doi: 10.1016/j.celrep.2019. Electroencephalogr. Clin. Neurophysiol. 94, 26–40. doi: 10.1016/0013-4694(94) 04.007 00209-4 Van Hooser, S. D., Alexander, J. F. H., Sooyoung, C., Sacha, B. N., and Louis, J. T. Perry, V., and Cowey, A. (1984). Retinal ganglion cells that project to the superior (2005). Orientation selectivity without orientation maps in visual cortex of a colliculus and pretectum in the macaque monkey. Neuroscience 12, 1125–1137. highly visual mammal. J. Neurosci. 25, 19–28. doi: 10.1523/jneurosci.4042-04. doi: 10.1016/0306-4522(84)90007-1 2005 Perry, V. H., and Cowey, A. (1985). The ganglion cell and cone distributions in the Vidyasagar, T. R., and Eysel, U. T. (2015). Origins of feature selectivities and monkeys retina: implications for central magnification factors. Vision Res. 25, maps in the mammalian primary visual cortex. Trends Neurosci. 38, 475–485. 1795–1810. doi: 10.1016/0042-6989(85)90004-5 doi: 10.1016/j.tins.2015.06.003 Pettigrew, J. (1986). Flying primates? Megabats have the advanced pathway from Vidyasagar, T. R., Wye-Dvorak, J., Henry, G. H., and Mark, R. F. (1992). eye to midbrain. Science 231, 1304–1306. doi: 10.1126/science.3945827 Cytoarchitecture and visual field representation in area 17 of the tammar Picanço-Diniz, C. W., Rocha, E. G., Silveira, L. C. L., Elston, G., and Oswaldo-Cruz, wallaby (macropus eugenii). J. Comp. Neurol 325, 291–300. doi: 10.1002/cne. E. (2011). Cortical representation of the horizon in V1 and peripheral scaling in 903250211 mammals with lateral eyes. Psychol. Neurosci. 4, 19–27. doi: 10.3922/j.psns.2011. Vitek, D. J., Schall, J. D., and Leventhal, A. G. (1985). Morphology, central 1.004 projections, and dendritic field orientation of retinal ganglion cells in the ferret. Ramachandran, V. S., Clarke, P. G. H., and Whitteridge, D. (1977). Cells selective J. Comp. Neurol. 241, 1–11. doi: 10.1002/cne.902410102 to binocular disparity in the cortex of newborn lambs. Nature 268, 333–335. Wang, W., Arora, R., Livescu, K., and Bilmes, J. (2015). “On deep multi-view doi: 10.1038/268333a0 representation learning,” in Proceedings of the International Conference on Rao, S. C., Toth, L. J., and Sur, M. (1997). Optically imaged maps of orientation Machine Learning, Lille, 1083–1092. preference in primary visual cortex of cats and ferrets. J. Comp. Neurol. 387, Wässle, H., Boycott, B. B., and Illing, R. B. (1981). Morphology and mosaic of on- 358–370. doi: 10.1002/(sici)1096-9861(19971027)387:33.0. and off-beta cells in the cat retina and some functional considerations. Proc. R. co;2-# Soc. Lond. Ser. B Biol. Sci. 212, 177–195. doi: 10.1098/rspb.1981.0033 Frontiers in Systems Neuroscience | www.frontiersin.org 12 March 2020 | Volume 14 | Article 10
Ibbotson and Jung                                                                                                                                   Maps in Visual Cortex

Webb, S., and Kaas, J. (1976). The sizes and distribution of ganglion cells in        Zepeda, A., Arias, C., and Sengpiel, F. (2004). Optical imaging of intrinsic signals:
   the retina of the owl monkey, Aotus trivirgatus. Vision Res. 16, 1247–1254.           recent developments in the methodology and its applications. J. Neurosci.
   doi: 10.1016/0042-6989(76)90049-3                                                     Methods 136, 1–21. doi: 10.1016/j.jneumeth.2004.02.025
Weigand, M., Sartori, F., and Cuntz, H. (2017). Universal transition from
   unstructured to structured neural maps. Proc. Natl. Acad. Sci. 114, E4057–         Conflict of Interest: The authors declare that the research was conducted in the
   E4064. doi: 10.1073/pnas.1616163114                                                absence of any commercial or financial relationships that could be construed as a
Wimborne, B., Mark, R., and Ibbotson, M. (1999). Distribution                         potential conflict of interest.
   of retinogeniculate cells in the Tammar wallaby in relation to
   decussation at the optic chiasm. J. Comp. Neurol. 405, 128–140. doi:               Copyright © 2020 Ibbotson and Jung. This is an open-access article distributed
   10.1002/(sici)1096-9861(19990301)405:13.0.co;2-h                    under the terms of the Creative Commons Attribution License (CC BY). The use,
Xu, X., Bosking, W., Sáry, G., Stefansic, J., Shima, D., and Casagrande,              distribution or reproduction in other forums is permitted, provided the original
   V. (2004). Functional organization of visual cortex in the owl                     author(s) and the copyright owner(s) are credited and that the original publication
   monkey. J. Neurosci. 24, 6237–6247. doi: 10.1523/jneurosci.1144-04.                in this journal is cited, in accordance with accepted academic practice. No use,
   2004                                                                               distribution or reproduction is permitted which does not comply with these terms.

Frontiers in Systems Neuroscience | www.frontiersin.org                          13                                                   March 2020 | Volume 14 | Article 10
You can also read