Vascular Fractality and Alimentation of Cancer - Scientific ...
←
→
Page content transcription
If your browser does not render page correctly, please read the page content below
International Journal of Clinical Medicine, 2021, 12, 279-296
                                                                                                   https://www.scirp.org/journal/ijcm
                                                                                                               ISSN Online: 2158-2882
                                                                                                                 ISSN Print: 2158-284X

Vascular Fractality and Alimentation of Cancer

Andras Szasz

Department of Biotechnics, St. Istvan University, Budaors, Hungary

How to cite this paper: Szasz, A. (2021)         Abstract
Vascular Fractality and Alimentation of Can-
cer. International Journal of Clinical Medi-     Background: The basal metabolic rate has a scaling by tumor mass on the
cine, 12, 279-296.                               exponent of 3/4, while a simple surface-supplied volume of the mass would
https://doi.org/10.4236/ijcm.2021.127025         have a lower exponent, 2/3. The higher exponent can be explained by opti-
Received: June 3, 2021
                                                 mizing the overall energy distribution in the tumor, assuming that the target
Accepted: July 13, 2021                          is four-dimensional. There are two possible ways of approximating the me-
Published: July 16, 2021                         tabolic rate of the malignant tumor: 1) the volume blood-supply remains, but
                                                 the surface and the length of the vessel network are modified; or 2) assuming
Copyright © 2021 by author(s) and
                                                 that the malignant cell clusters try to maximize their metabolic rate to energ-
Scientific Research Publishing Inc.
This work is licensed under the Creative         ize their proliferation by the longer length of the vessels. Our objective is to
Commons Attribution International                study how vascular fractality changes due to the greater demand for nutrients
License (CC BY 4.0).                             due to the proliferation of cancerous tissue. Results: It is shown that when a
http://creativecommons.org/licenses/by/4.0/
                                                 malignant tumor remains in expected four-dimensional volumetric condi-
                Open Access
                                                 tions, it has a lower metabolic rate than the maximal metabolic potential in
                                                 the actual demand of the proliferating cancer tissue. By maximizing the me-
                                                 tabolic rate in malignant conditions, the allometric exponent will be smaller
                                                 than 3/4, so the observed “dimensionality” of the metabolic rate versus mass
                                                 becomes greater than four. The first growing period is exponential and keeps
                                                 the “four-dimensional volume”, but the growth process turns to the sigmoidal
                                                 phase in higher metabolic demand, and the tumor uses other optimizing
                                                 strategies, further lowering the scaling exponent of metabolic rate. Conclu-
                                                 sion: It is shown that a malignant cellular cluster changes its metabolic scal-
                                                 ing exponent when maximizing its energy intake in various alimentary condi-
                                                 tions.

                                                 Keywords
                                                 Allometry, Metabolism, Fractal Dimensions, Optimization, Cancer,
                                                 Vascularity

                                               1. Introduction
                                               The highly organized living systems are energetically open and far from thermal

DOI: 10.4236/ijcm.2021.127025         Jul. 16, 2021                279                      International Journal of Clinical Medicine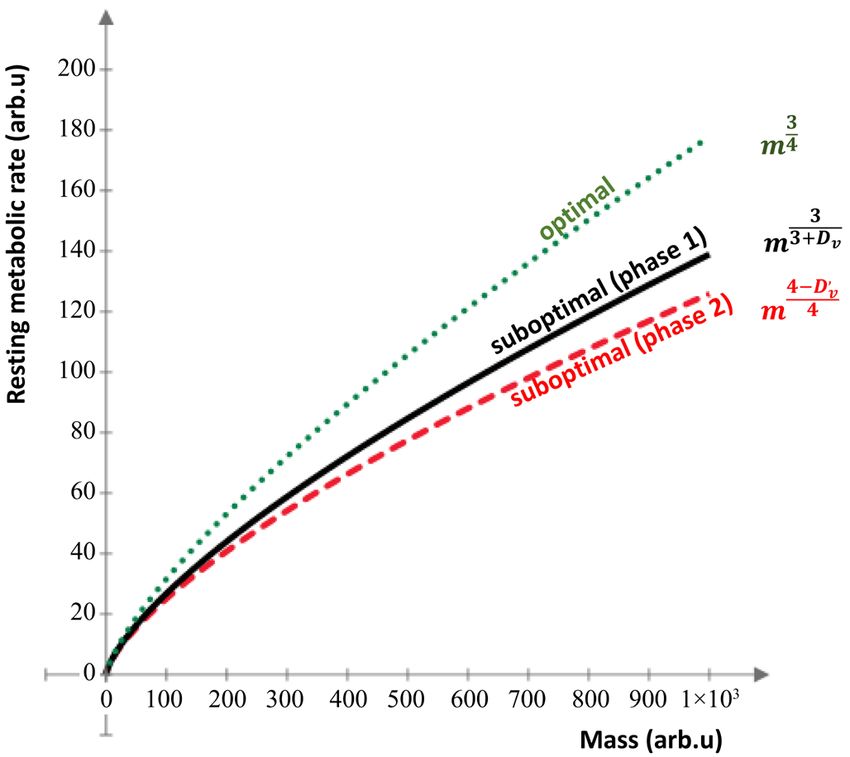
A. Szasz

                                equilibrium [1]. Its physical phenomena are collective and have strong physical
                                roots [2]. Structures built up by anabolism and store information in the open
                                system [3]. The living matter is heterogeneous, having numerous different elec-
                                trolytes engulfed by specialized tissues or lipids enveloping isolated aqueous
                                electrolytes in definite structures. The isolating layers control the chemical and
                                physical reactions between the electrolytes and regulate the complex interactions.
                                The fundamental division of electrolytes is between the cytosol (the intracellular
                                electrolyte) and the Extracellular Matrix (ECM). The membrane is a complexly
                                organized multifunctioning part. This double lipid layer regulates the informa-
                                tion and ionic exchange between the intra and extracellular reagents, having a
                                vital role in the energy distribution and production of the entire system. The
                                mass of the living object is volume dependent (scaling by 3), while the surface is
                                scaled only by 2. Consequently, we expect an exponent for mass-dependence of
                                energy exchange (metabolism) as 2/3, the ratio of the cell surface to the cell vo-
                                         r2
                                lume ( ∝    =r 2 3 ). So the expected metabolic power ( Pmet ) in rest state (Basal
                                         r3
                                Metabolic Power, BMP) dependence vs. mass (M) is expected:
                                                                                    2
                                                             Pmet = BMP ∝ M 3 = M α                                      (1)

                                   However, the experiments show a variation of exponents, the α = 2 3 is not
                                shared. When the metabolism is concentrated on surfaces, the α ≈ 2 3 well
                                approaches reality. On the other hand, when it is centered on the energy re-
                                sources, the exponent is close to α ≈ 3 4 . When the whole mass of the organ-
                                ism is involved in the metabolic energy exchange, the exponent is near to α ≈ 1 .
                                In complete demand, the actual body-part (organ or whole-body) needs max-
                                imally available energy supply, proportional to its mass, so the scaling exponent
                                is α = 1 in this case [4]. In this case, the actual demand decides about the me-
                                tabolic power and not the geometry. Of course, both the extremes are not ideal
                                for the living object and could not follow evolutional requests. What is optimal?
                                Despite the different exponential power, one feature is strictly common, all the
                                experiments show power-scale (called scaling) in a few orders of magnitudes of
                                the parameters, which is linear in the double logarithmic plot:
                                                              ln ( Pmet ) ∝ α ⋅ ln ( M )                                 (2)

                                   The scaling behavior is the consequence of the self-similarity of the living ob-
                                jects [5] [6]. The fundamental phenomenon behind it is the relative proportional
                                change of the parameters [7]. The fundamental principle was oriented on the
                                changes of the same organism, which has to grow in collective harmony, so the
                                relative growth of parts must have balanced growth [8]. The structure and regu-
                                lation of biosystems are complex. Various modern approaches have been devel-
                                oped in the last few decades to describe this complexity. The description of sta-
                                tistics of complex systems is far from the normal (Gaussian) distribution. Usual-
                                ly, power-law-tailed distributions (with a general exponent α) are applied:
                                                                   f ( x ) = xα                                         (3)

DOI: 10.4236/ijcm.2021.127025                        280                          International Journal of Clinical Medicine
A. Szasz
There are various phenomena, including social, economic, physical, chemical,
and biological, to be described by this function [9] [10] [11] [12] [13]. Despite
the somewhat different fields of applications of the power law, it has a common
root in complex systems: self-organization. The simplest fingerprint of the
self-organized complexity is the self-similar or scale-free structures characterized
by a power function. This power-function relation magnifies the f ( x ) by a
constant only, m-dependent Ξ =mα value at any m magnification of x:
f ( mx ) =
( mx ) = Ξf ( x )
α
mα xα =
Ξxα = (4)
Self-organization explains the evolution of the system [14], expressed in
non-linear dynamics [15].
The objective of this present article focuses on analyzing the metabolic ali-
mentation of the healthy tissues in normal conditions and the developing tu-
mors in two different conditions:
1) When the tumor metabolizes as a homeostatic organized unit, the theoreti-
cally expected allometric exponent corresponds with the optimal healthy allo-
metry;
2) When the tumor metabolism is not in such an “ideal” optimization of the
metabolic supply, its alimentation is suboptimal, using the observed fractal be-
havior of its angio-structure.
2. Method
Fractal physiology describes the structural and dynamical properties of living
organisms and their parts [16] [17], based on physical principles [18]. The
self-similar behavior could be described by the normalized relative change of the
magnitudes, similarly to the Weber-Fechner law [19] in psychophysics like:
∆f ∆x
=α (5)
f x
where α is a constant fitting factor. By integration, we get the (3):
ln ( f )= α ln ( x ) → f ( x )= xα (6)
The self-similar functional relation makes a “scale-invariance” feature due to
the independence of the magnification, which is the fundamental behavior of the
fractal structures, too [20].
The power function is the central description of the scaling in (1), which bases
the allometry of living organisms [21]. The original allometry idea was recog-
nized almost a hundred years ago [22], but the exciting question of the energiz-
ing of the life phenomena explained in connection of allometry is a half-century-old
knowledge [23]. The connection between the homeostatic energizing level and
the basal metabolic rate (B0) as a self-similar function of mass (m) of living ob-
jects is [24]:
B0 = amα (7)
DOI: 10.4236/ijcm.2021.127025 281 International Journal of Clinical MedicineA. Szasz
where the two parameters are determined experimentally; a is the allometric
coefficient, and α is the allometric exponent, and (7) is usually called bioscaling
[25]. The usual regression analysis uses the logarithmic transformation of (7):
ln B0 α ln ( m ) + ln ( a )
= (8)
which allows high linear accuracy and fits both parameters a and α well [26].
The literature has numerous debates about the theoretical allometric relation
based on fractal calculus and the empirical fits based on probability calculus [27].
The B0 of living objects shows allometric scaling to its mass, which refers to the
energy supply of the living mass of the volume. The (7) function gives a correct
mathematical and biological framework for the complex bio-systems fractal stu-
dies [28]. The scaling power function of the mass describes it, and it has been
shown valid in a broad category of living structures and processes [29]. The
scaling considerations are applied not only in biology but broader, in the com-
plete biosystem as well [30]. The importance of understanding the challenges of
the complexity of human medicine was recognized on this basis [31] [32].
In a simple formulation, metabolic processes are surface-dependent, while the
mass is proportional to the volume. Therefore, the exponent of their ratio mir-
rors their dimensionality, and consequently, the exponent is 2/3 [33]. Complex
living allometry most likely shows the exponent as 3/4 instead of 2/3 in a broad
spectrum of living objects [34], or at least have no linearity in a double-logarithmic
plot [35]. However, the large data-mining does not show an overall validity of
the 3/4 exponent over 2/3 [36]. The curvature could be size-dependent in devel-
oping clusters by their size [37]. The 3/4 exponent could be described as a rela-
tion between the three-dimensional surface and the four-dimensional volume
[38]. The explanation of the fourth dimension is based on the fractal structure of
microcirculation [39], which supplies the energy demand according to a ho-
meostatic equilibrium (B0) in the living complexity. Life in this meaning is
“four-dimensional”. Its metabolic exchange processes proceed on fractal surfaces,
maximizing the available energy consumption, scaling even the fluctuation of
the metabolic power in the universal scaling law as well [40].
The optimization of energy consumption was formulated rigorously by the
scaling idea and discussed in a universal frame, even on the energy-consumption
subcellular level, including the mitochondria and respiratory complexes [41].
The allometry shows a structural, geometrical constraint for living organisms in
homeostatic equilibrium.
The metabolic scaling in cancer development is critical [42]. Contrary to the
homeostatic homogeneity of the healthy tissue [43]; the functional heterogeneity
of the solid tumor allows an abnormal organ self-possession of multiple cell-types
and electrolytes like the Extracellular Matrix (ECM) lymph and blood-transports
[44]. The tumor metabolism is based on the blood transport to the tumor. The
logarithm of wet-weight of the tumor ( mwet ) and the tumor blood-flow ( Bt )
have linear dependence [45], which was observed in model xenografts of ovarian
cancer, so they have a bioscaling relation:
DOI: 10.4236/ijcm.2021.127025 282 International Journal of Clinical MedicineA. Szasz
log ( Bt ) =
−0.808log ( mwet ) − 0.436, r 2 =
0.79, p < 0.001
(9)
Bt 0.6466 ⋅ mwet
= −0.808
where the exponent is close to 3/4.
The allometric scaling supposes three geometrical variables to define the op-
timization of the circulatory system in living objects:
• The average length of the blood circulatory network (l);
• The surface of the relevant material exchange of the blood circulation system
(s);
• The volume of the blood (v).
Furthermore, we suppose that these parameters are represented by the
self-similar, self-organized functions of the L value, which is characteristic of a
given organ. Hence:
l ∝ Lal , s ∝ Las , v ∝ Lav (10)
Using the theoretical fractal explanation, the conditions are: al ≥ 1 , as ≥ 2
and av ≥ 3 , from where:
l ∝ L10+ε l , s ∝ L20+ε s , v ∝ L30+ε v (11)
where 0 ≤ ε l ≤ 1 , 0 ≤ ε s ≤ 1 , and L0 is the characteristic length. The first rela-
tion limits the pattern of the circulatory system to the maximum that could be
planar, while the second is limited to a maximum, filling up a three-dimensional
space. The third exponent ε v could be calculated because the exponents are
not independent. The volume is proportional to the product of the surface and
length:
v ∝ s×l (12)
consequently
ε=
v εl + ε s (13)
Using these conditions, we obtain from (11):
1 2 +ε s
3+ ε v 3+ ε v
L0 ∝ v →s∝v (14)
Furthermore, the actual volume of the blood is proportional to the actual mass
of the given system or organ:
v ∝ L30+ε v ∝ m1 (15)
Considering (14) and (15), now we have:
2 +ε s
s ∝ m 3+ ε l + ε s (16)
The metabolism is a surface-controlled mechanism, so ( BMR ) ∝ s , conse-
quently:
2 +ε s
3+ ε l + ε s
B0 ∝ m (17)
If the living structure is geometric in conventional Euclidean meaning, then
DOI: 10.4236/ijcm.2021.127025 283 International Journal of Clinical MedicineA. Szasz
ε=l ε=
s ε=
v 0 and therefore a= l a=s av ; consequently, the scaling is
2 + εs
( BMR ) ∝ mα , where
= α = 2 3 . When at least one of the ε l ≠ 0 ,
3 + εl + ε s
α ≠ 2 3 , which modifies the common simple dimensional approach of the me-
tabolic processes.
3. Results
The allometry gives a possibility to describe the development of the tumor [46].
It is valid for the primary cancer lesions but not always applicable in metastases
[47]. We are dealing with primary tumors only. There are two ways of approx-
imating the allometric metabolic rate of a tumor:
1) The theoretical approach accepts that a healthy life has a four-dimensional
behavior connected to the highly self-organized, consequently self-similar hie-
rarchic order [48], we fix the exponent to 3/4.
2) The experimental approach assumes that the cell cluster tries to maximize
its metabolic rate [49], and this way, it modifies the scaling exponent from the
value of 3/4.
Both approaches depend on the environmental conditions of the tumor,
mainly on the nourishment of the cells.
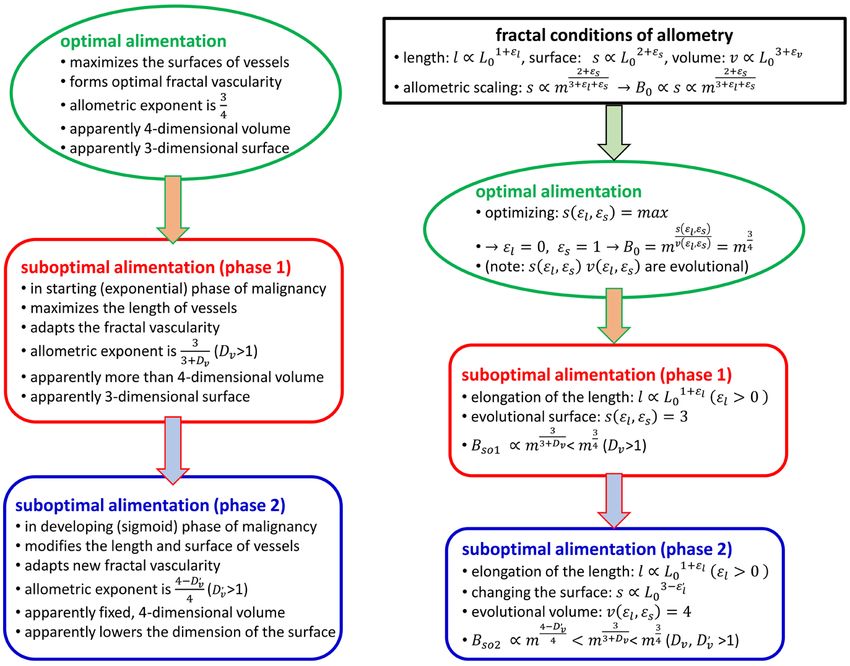
3.1. Optimal Alimentation to Maximum Metabolic Rate
Evolution maximized the surface where the nutrients are transferred from the
blood to the cells, ensuring the best conditions of the living object, so:
s ( ε l , ε s ) = max (18)
This task is equivalent to the minimizing of the reciprocal value of the expo-
nent in (16):
3 + εl + ε s
= min (19)
2 + εs
with constraint conditions of:
0 ≤ ε l ≤ 1, 0 ≤ ε s ≤ 1 (20)
(19) can be transformed into
3 + εl + ε s 1 + εl
=
1+ =
min (21)
2 + εs 2 + εs
Hence, considering (20), the minimum condition demands that:
ε l 0,=
= εs 1 (22)
Substituting (22) into (11), the exponents of the self-similar structures are:
l ∝ L10 , s ∝ L30 , v ∝ L40 (23)
Consequently, in cases of ideal alimentation, these exponents are the fractal
dimensions of the parameters of the network, and while the length is one di-
mensional, the surface is three, and the volume is four [38]. Because metabolism
DOI: 10.4236/ijcm.2021.127025 284 International Journal of Clinical MedicineA. Szasz
is a surface-regulated process, s ∝ ( BMR ) , the scaling exponent of the meta-
bolic rate versus mass using (16) is 3/4:
2 +ε s 3
3+ ε l + ε s
B0 ∝ s ∝ m =m4 (24)
and so B0 in the unit mass
1
B0 −
∝m 4 (25)
m
Primarily the blood stream provides the metabolic supply, so the fractality of
the vascular network could be decisional in its allometric evaluation. The condi-
tion of (24) maximizes the blood flow energizing all the parts of the volume for
their optimum, providing a maximum metabolic rate.
In consequence of (24), the life prefers the large masses as more effective
energy-consumers in a unit volume shown in (25). However, on another side
this process could lead to the loss of complex information, developing higher in-
stability of the system, arguing that this is a negative tendency manifest the “ag-
ing of life’s algorithm as a whole” [50]. The model could be applied by guessing
when the energy supply is optimal, so the developed active surface cannot supply
the actual demands. Two different sources are possible to create such a situation
(1) the length of the supplier system changes (the constructional template dif-
fers), or (2) the volume of transport exchange is limited despite the growing de-
mands. Various irregularities originate both challenges could be a symptom of
disease, like cancer [51].
3.2. Suboptimal Alimentation for Tumor
The malignancy usually demands a higher energy input from its healthy envi-
ronment than the available. The tumor supply is suboptimal. The higher energy
demand (usually exponential in starting phase [52]) forces to increase the length
of the vessel network. In cancerous clusters, contrary to (22), the vascular fractal
dimension ( Dv ) of the supplying blood-vessel network ( l ∝ LD0 v ) is larger than 1,
( Dv ≥ 1 ) [51]; consequently ε l ≠ 0 in the relation of (11). Dv could be meas-
ured by the box-counting method [51].
According to (11), the actual active surface is evolutionary normal for
self-organizing of healthy tissues ( s ∝ L30 ). The extra energy demand of the in-
tensive proliferation changes the exponents of parameters in (11). In this case,
the surface of the supply follows the evolution-requested exponent of 3 ( ε s = 1
from (22)) in the self-similar conditions, but the requested length changes:
l ∝ L10+ε l = LD0 v , s ∝ L30 (26)
where ε l > 0 modifies the power of the transport measures, so the fractal or-
ganization of the transport lines is different. This type of change could be
formed by neoangiogenesis satisfying the higher energy demand in cancerous
tissues and could cause abnormalities as inflammation, thrombosis, varicose
veins modification of the arteries, etc. The corresponding power-law for the ac-
DOI: 10.4236/ijcm.2021.127025 285 International Journal of Clinical MedicineA. Szasz
tual metabolic rate at the longer length of vessels, so the suboptimal metabolic
rate in this phase ( Bso1 ) from (24) is:
2 +ε s 3 3
3+ ε l + ε s
Bso1 ∝ m =m 4 +εl =m 3+ Dv (27)
The apparent “dimension” of the reaction request for volume is ( 4 + ε l ) > 4 ,
the dimension increases. According to l ∝ L10+ε l the measurable fractal dimen-
sion of the blood vessel network is Dv = 1 + ε l . In this way the ε l is measurable
by the fractal dimension of the vessel structures [53], for example, with the
box-counting method [51]. When Dv = 1.3 [53], ε l = 0.3 , and the scaling ex-
ponent is α ≅ 0.7 > 2 3 . The Microvessel Fractal Dimension (MFD) (which is
equivalent with ( 1 + ε l ) for renal cell carcinoma ranges between 1.30 - 1.66 [54],
and correlates well with the tumor Microvessel Density (MVD) [54]. From (27)
we know, when ε l = 0.478 , the scaling exponent describes a non-fractal-like
structure, α = 2 3 .
When the tumor growth is so intensive that the available length of the vessel
network cannot deliver appropriate energy, then another possible deviation from
the homeostatic self-organization happens. In this case, the volume of the deli-
vered energy remains constant, which limits the energy supply. The tu-
mor-growth turns to sigmoidal this stage [55], usually follows Weibull distribu-
tion due to the self-similar development [6]. This could happen in severe hy-
poxia, low oxygen saturation in blood, anemia, various hematological diseases.
In this case, the volume of the supply follows the evolution-requested exponent
of 4 ( ε v = 1 ) (23), in the self-similar conditions in [53], but the requested length
and surface is not enough for the proper work, so ε l′ > 1 and ε s < 1 . The
self-similar conditions differ from (22) due to (13):
l ∝ L10+ε l′ , s ∝ L30−ε l′ , v ∝ L40 (28)
Consequently, at fixed four-dimensional volume, the metabolic surface reac-
tions behave by power-law of suboptimal metabolic rate in this phase:
2 +ε s 3 −ε l′ 4 − Dv′
3 + ε l′ + ε s
Bso 2 ∝ m =m 4 =m 4 (29)
Here the volume “dimension” of the reaction request is 4, but the actual con-
ditions are worse than optimal. The ε l′ again here also is measurable by the
fractal dimension of the structures [56], in this case, the fractal dimension of the
vessel system is Dv′ = 1 + ε l′ . For example, measuring the vascular fractal dimen-
sion in one disease as Dv′ = 1.41 [51], we use ε l′ = 0.41 , so the scaling exponent
is α = 0.65 . When ε l′ = 0.28 [56], the scaling exponent is p = 0.68 . At
ε l′ = 0.33 , the scaling exponent is the well-known α = 2 3 .
The exponents of the active transport surface in the two suboptimal supplies
3 3 3 − ε l′ 4 − Dv′
=α = α′ =
and= (30)
4 + ε l 3 + Dv 4 4
Both these exponents are smaller than the optimal, and the exponent in the
second phase of growth is the smallest (Figure 1).
DOI: 10.4236/ijcm.2021.127025 286 International Journal of Clinical MedicineA. Szasz
Figure 1. The allometric development with the various exponents.
The initial phase of tumor growth is exponential, and the allo-
metric scale follows the phase1 curve, while the intensive de-
velopment further decreases the exponent, which turns to a
sigmoid phase in a tumor-specific time.
Following the idea of “4-dimensionality”, the volume dimension changes in
α , while the active surface in α ′ . Both exponents are ≤3/4 because of the
length fractal dimension >1. The mechanisms which cause this modification are
different. The same exponent could be only in Euclidean non-fractal case, when
D=
v D=′ 1 . Due to Dv < 3 and Dv′ < 3 , hence α > 0.5 and α ′ > 0.25 . The
v
Mandelbrot calculated 2.7 for the fractal dimension of the arterial tree of the
lung [57], which was supported by experiments later [58], the relevant changes
are α ≈ 0.526 and α ′ ≈ 0.325 . Both values are smaller than α = 2 3 .
Both non-optimal situations (defect of the length of transport way or limited
transport against the demands) make the tissue under-energized, and the expo-
nent of the power-relation scaling down-regulated. In such a way, measuring the
scaling exponent of metabolism and the fractal dimension of the supplying mi-
crovessels have a diagnostic value about the actual deviations from normal.
4. Discussion
The optimal alimentation in a healthy system makes the energy distribution ba-
lanced, supplying all requirements of the homeostatic state. The exponent 3/4
has a strong predominance on a theoretical and empirical basis [59] in healthy
homeostatic basal metabolic activity. The ideal nutrition supply supports onto-
genic growth. However, at least at larger sizes, the cancer growth never happens
with an optimal nutrition supply; the cells compete intensively for the available
energy sources.
The cancer is out of the overall homeostatic balance. The tumor development
certainly has a higher energy supply due to its proliferation than its healthy
DOI: 10.4236/ijcm.2021.127025 287 International Journal of Clinical MedicineA. Szasz
counterpart needs. Due to the extra-large energy demand, the tumor develop-
ment’s alimentation in most cases is far from optimal, so the tumor is in a per-
manent energy deficiency. When the oxygen supply is limited, the first attempt
to produce more ATP is the massive fermentative use of glucose, a simple and
quick production mechanism. The cell extends its ATP production to fermenta-
tion by non- mitochondrial respiration, abandoning the more complicated
Kerbs-cycle in the mitochondria [60].
While the mitochondrial metabolism is always aerobic, its scaling exponent is
nearly α = 3 4 [30]. However, the scaling of metabolic activity is also different
in mitochondrial and non-mitochondrial processes [61]. The metabolic power
not only depends on the active surface of the transport but also on the transport
rate at the same active surface size. Due to the transport modifications at the
changed metabolic pathway, the deviation from the 3/4 exponent could be re-
markable. The allometric scaling exponent of fermentative processes decreases
to nearly 2/3. This last scaling exponent shows that the cell-membrane directly
regulates the fermentation, and the surface/volume ratio controls the complete
process, which could be anticipated from the direct linear dependence of the
lactate production ( VL ) on the glucose-intake ( VG ) with a slope of ≅1 [45]:
+0.977 log (VG ) + 0.108, r 2 =
log (VL ) = 0.72, p < 0.001 (31)
while the bioscaling of the oxygen ( VO2 ) and glucose ( VG ) intake [45] are even
lower than 2/3, −0.570, and −0.523, respectively.
Not only does the malignancy need an intensive extra metabolism. For exam-
ple, the benthic invertebrates (n = 215) have the lowest average scaling exponent
( α mean = 0.63 , [near to 2/3], CI mean = 0.18 ), which metabolizes in an anaerobic
way [62]. No regulative factor exists when the cells are entirely independent, and
the available alimentation is unlimited (like in most in vitro experiments). The
metabolic rate is linearly proportional to the mass, so the exponent is α ≅ 1 [30].
The metabolic transformation of the cells [63] is one of the well-recognized
hallmarks of malignancy [64] that has an emerging intensive interest in the field
of oncology [65], as the core hallmark of cancer [66]. The adaptation of mito-
chondria in energy-limited conditions is the focus of the research [67]. The tu-
mor forces the development of the angiogenetic processes [68] and overcomes
the energy limitations. The vascularity is promoted [69], and the rapid develop-
ment by intensive proliferation supports the changes of the scaling behavior [70].
Without extra angiogenesis (starting clusters), only the ready-made capacity of
the delivery is available, so the tumor has a suboptimal alimentation. In the be-
ginning, its fractal structure was developed, which is similar to the healthy
structure, so the four-dimensional scaling remains valid (28).
When the tumor develops, the fractal structure of vascularity changes. Con-
sequently, its fractal dimension changes too. The forced angiogenesis [68] tries
to provide a sufficient supply to the hypoxic (insufficiently supported) tumor,
and the structure changes rapidly, broadening the scaling exponent in a wide
range [71]. The missing supply suppresses the scaling exponent, shown in (27).
DOI: 10.4236/ijcm.2021.127025 288 International Journal of Clinical MedicineA. Szasz
Still, the angiogenetic pool changes the trend, approaching linearity. The unli-
mited availability of nutrients for every cell realizes the linearity measured in vi-
tro [48], limited to ~0.9 in vivo by insufficient oxygen transport [72]. However,
the angiogenesis is usually not fast enough to supply the faster-growing larger
tumors, so the inner part of the tumor becomes necrotic, forming a smaller liv-
ing mass to supply, easing the energy distribution [68]. The essential message of
the cases of insufficient alimentation from the calculations above is that when
the fractal dimension of the supplying network grows, the scaling exponent de-
creases. The four-dimensionality and the allometry with the evolutional opti-
mizing request are not the same approaches: further evolution conditions have a
higher than four-dimensional allometric scaling. The tumor mass is a somewhat
indefinite parameter because the whole environment of the tumor suffers from
suboptimal alimentation. Consequently, we tried to find a more fundamental
networking condition parameter published elsewhere [73].
There is a vast number of researches about the vascular development of the
tumor progression, calculating the fractal dimension of the vascularity. The in
silico modeling of the growing tumor vessel architecture in high-grade gliomas
[74] shows that the fractal dimension is less than 1 in the avascular state and
growing linearly by time, reaching Dt = 2760 h ≅ 1.2 at t = 2760 h , by slope ap-
proximately ≅ 6.2 × 10⁻⁴ . In a longer time, the development of the fractal di-
mension drastically changes, follows a less rapid development (slope ≅ 2.5 × 10⁻⁴ )
until Dt = 4000 h ≅ 1.48 . We may assume that the fractal dimension 1.2 characte-
rizes the finally developed vessel structure inside the tumor, followed by
neo-angiogenetic processes reaching the tumor-surface, changing the vascular
architecture, growing slower to the higher values of the fractal dimension.
In optimal alimentation, the allometric scaling shows exponent 3/4 (24); which
supposes the l ∝ L10 , so the vascular fractal dimension in this case is Dva = 1 .
However Dva > 1 by the growing vessel network, so α < 3 4 in the allometric
scaling of tumor-vascularity due to the suboptimal energy supply, which triggers
the angiogenesis. Using the results from in silico model-calculations, the internal
2.8 3
growth of the vessels have ( B0 )i1 ∝ m 4 =
m0.700 , or ( B0 )i 2 ∝ m 4.2 =
m0.714 ,
according to the assumption of suboptimal alimentation by maximal metabolic
rate (case 1) or by the metabolic rate forced four-dimensional “optimizing” con-
cept (case 2). When the external angiogenesis is developing, the allometry
2.52 3
changes: ( B0 )e1 ∝ m 4 =
m0.63 , and ( B0 )e 2 ∝ m 4.48 =
m0.67 . So, the optimizing
of the suboptimal energy availability in extended angiogenetic cases realizes the
allometry, which fits the simple geometrical expectations α = 2 3 well.
The measurements of vascular fractal dimensions in various tumors show a
lower scaling exponent than the ideal 3/4, depending on the conditions of the
tumor-angiogenesis development. For example, when the epithelial-connective
tissue interfaces with a malignant tumor in the oral mucosa, it is Dva ≥ 1.41
[75], the scaling exponent in suboptimal alimentation situations in cases 1 and 2
DOI: 10.4236/ijcm.2021.127025 289 International Journal of Clinical MedicineA. Szasz
are α ≅ 0.64 and α = 0.68 . The last one (optimal distribution of the subopti-
mally available energy) is near the “conventional” 2/3. Another microscopic
evaluation of angio-structures [76] shows lower values of α , like the fractal di-
mension of the normal and malignant tissues are Dhealthy ≅ 1.65 and
Dmalignant ≅ 1.74 , respectively [77]; resulting in low α values. In other evalua-
tions, the vascular structure’s dimensionality grows to 1.9, which provides the
maximal energy usage of the suboptimal alimentation, and the exponent became
as low as α = 0.525 .
It is interesting to see the effect of various anti-tumor treatments on the vas-
cular fractal dimension. The treatment changes the vascularization and sup-
presses the fractal dimension forms 1.135 1.037, 0.933, 0.982 by Photodynamic
Therapy (PDT); Cysteine Proteases Inhibitors (CPI), combined therapy, PDT
and CPI [78]; which corresponds in cases when the maximalizing of the ener-
gy-supply is equivalent to the allometric exponents of 0.716, 0.741, 0.767 and
0.755, respectively (the optimal distribution of the suboptimal availability would
be 0.726, 0.743, 0.763, and 0.753). By treating VEGF165, the fractal dimension
increases from 1.65 to 1.69, decreasing the allometric exponent [79] [80]. In ma-
trigel inoculated human umbilical vein endothelial cells (HUVEC) treated by
docetaxel, the fractal dimension of the vascular structure has decreased from 1.2
to 1.09, corresponding in case 1 α control ≅ 0.70; α treated ≅ 0.73 , and in case 2
α control ≅ 0.71; α treated ≅ 0.73 [81]. The fractal analysis is a successful and rather
accurate method for monitoring the efficacy of angiogenic consequences of
therapies [82].
(a) (b)
Figure 2. The summary of the structure of calculation. (a) The biophysical considerations
(b) The mathematical description.
DOI: 10.4236/ijcm.2021.127025 290 International Journal of Clinical MedicineA. Szasz
5. Summary
We had shown that the allometric relation of basal metabolic rate and the tumor
mass depends on the fractal dimension of the vascular structure. Due to the
desperate need for energy supply and the intensive proliferation of the malignant
tumor, cancer does not have an optimal alimentation. Two strategies could dis-
tribute the available (not sufficient) energy by the main transport of it, the vas-
cular network:
1) Assuming that the cell cluster tries to maximize its metabolic rate by the
surface transports and lowers the scaling exponent from the value of 3/4;
2) Accepting that in the case of a four-dimensional volumetric behavior limits
the energy supply. The tumor optimizes the energy distribution in its volume in
among these conditions.
The structure of the biophysical considerations and their mathematical steps
are summarized in Figure 2.
The two strategies in consequent phases of tumor growth optimize the availa-
ble energy by different allometric scalings. The organized optimum of the sub-
optimal availability of energy gives lowered allometric scaling exponents.
Acknowledgements
This work was supported by the Hungarian National Research Development and
Innovation Office PIACI KFI grant: 2019-1.1.1-PIACI-KFI-2019-00011.
Conflicts of Interest
The author declares no conflicts of interest regarding the publication of this pa-
per.
References
[1] Barge, L.M., Branscomb, E., Brucato, J.R., Cardoso, S.S.S., Cartwright, J.H.E., Da-
nielache, S.O., et al. (2017) Thermodynamics, Disequilibrium, Evolution: Far-From-
Equilibrium Geological and Chemical Considerations for Origin-Of-Life Research.
Origins of Life and Evolution of the Biospheres. The journal of the International
Society for the Study of the Origin of Life, 47, 39-56.
https://doi.org/10.1007/s11084-016-9508-z
[2] Goldenfeld, N. and Woese, C. (2011) Life Is Physics: Evolution as a Collective Phe-
nomenon Far from Equilibrium. Annual Review of Condensed Matter Physics, 2,
375-399. https://doi.org/10.1146/annurev-conmatphys-062910-140509
[3] Schrodinger, E. (1944) What Is Life? The Physical Aspect of the Living Cell. Cam-
bridge University Press, Cambridge.
[4] Glazier, D.S. (2008) Effects of Metabolic Level on the Body Size Scaling of Metabolic
Rate in Birds and Mammals. Proceedings of the Royal Society B: Biological Sciences,
275, 1405-1410. https://doi.org/10.1098/rspb.2008.0118
[5] Szasz, O., Szigeti, G.P. and Szasz, A. (2017) On the Self-Similarity in Biologyical
Processes. Open Journal of Biophysics, 7, 183-196.
https://doi.org/10.4236/ojbiphy.2017.74014
[6] Szasz, O. and Szasz, A. (2020) Parametrization of Survival Measures, Part I: Conse-
DOI: 10.4236/ijcm.2021.127025 291 International Journal of Clinical MedicineA. Szasz
quences of Self-Organizing. International Journal of Clinical Medicine, 11, 316-347.
https://doi.org/10.4236/ijcm.2020.115031
[7] Huxley, J.S. and Teissier, G. (1936) Terminology of Relative Growth. Nature, 137,
780-781. https://doi.org/10.1038/137780b0
[8] Huxley, J.S. (1932) Problems of Relative Growth. Book Review by C.H.K. in Gahan:
New Parasitic Ilymenoplera, Lincoln Mac Veagh—The Dial Press, New York, 757.
[9] Newman, M.E.J. (2005) Power Laws, Pareto Distributions and Zipf’s Law. Contem-
porary Physics, 46, 323-351. https://doi.org/10.1080/00107510500052444
[10] Mitzenmacher, M. (2004) A Brief History of Generative Models for Power Law and
Lognormal Distributions. Internet Mathematics, 1, 226-251.
https://doi.org/10.1080/15427951.2004.10129088
[11] Fisher, M.E. (1998) Renormalization Group Theory: Its Basis and Formulation in
Statistical Physics. Reviews of Modern Physics, 70, 653-681.
https://doi.org/10.1103/RevModPhys.70.653
[12] Barabasi, A. and Albert, R. (1999) Emergence of Scaling in Random Networks.
Science, 286, 509-512. https://doi.org/10.1126/science.286.5439.509
[13] Chignola, R., Sega, M., Stella, S., Vyshemirsky, V. and Milotti, E. (2014) From Sin-
gle-Cell Dynamics to Scaling Laws in Oncology. Biophysical Reviews and Letters, 9,
273-284. https://doi.org/10.1142/S1793048014300035
[14] Kauffman, S.A. (1992) The Origins of Order: Self-Organization and Selection. In:
Varela, F.J. and Dupuy, J.P., Eds., Understanding Origin, Vol. 130, Springer, Dor-
drecht, 153-181. https://doi.org/10.1007/978-94-015-8054-0_8
[15] Walleczek, J. (Ed.) (2000) Self-Organized Biological Dynamics & Nonlinear Con-
trol. Cambridge Univesity Press, Cambridge.
https://doi.org/10.1017/CBO9780511535338
[16] Bassingthwaighte, J.B., Leibovitch, L.S. and West, B.J. (1994) Fractal Physiology.
Springer, New York. https://doi.org/10.1007/978-1-4614-7572-9
[17] Deering, W. and West, B.J. (1992) Fractal physiology. IEEE Engineering in Medi-
cine and Biology, 11, 40-46. https://doi.org/10.1109/51.139035
[18] Musha, T. and Sawada, Y., Eds. (1994) Physics of the Living State. IOS Press, Ams-
terdam.
[19] Fechner, G.T., Howes, D.H. and Boring, E.G., Eds. (1966) Elements of Psychophysics.
Volume 1, Adler, H.E., Trans., Holt, Rinehart and Winston, New York.
[20] Mandelbrot, B.B. (1967) How Long Is the Coast of Britain? Statistical Self-Similarity
and Fractional Dimension. Science, 156, 636-638.
https://doi.org/10.1126/science.156.3775.636
[21] West, B.J. and West, D. (2012) Fractional Dynamics of Allometry. Fractional Cal-
culus & Applied Analysis, 15, 70-96. https://doi.org/10.2478/s13540-012-0006-3
[22] Huxley, J.S. (1932) Problems of Relative Growth. Johns Hopkins University Press,
Methuen, London, 273.
[23] Kleiber, M. (1961) The Fire of Life: An Introduction to Animal Energetics. Wiley,
New York.
[24] Savage, Van M., Allen, A.P., Brown, J.H., Gillooly, J.F., Herman, A.B., Woodruff,
W.H. and West, G.B. (2007) Scaling of Number, Size, and Metabolic Rate of Cells
with Body Size in Mammals. Proceedings of the National Academy of Sciences of
the United States of America, 104, 4718-4723.
https://doi.org/10.1073/pnas.0611235104
DOI: 10.4236/ijcm.2021.127025 292 International Journal of Clinical MedicineA. Szasz
[25] Brown, J.H. and West, G.B., Eds. (2000) Scaling in Biology. Oxford University
Press, Oxford.
[26] Mascaro, J., Litton, C.M., Hughes, R.F., Uowolo, A. and Schnitzer, S.A. (2014) Is
Logarithmic Transformation Necessary in Allometry? Ten, One-Hundred, One-
Thousand-Times Yes. Biological Journal of the Linnean Society, 111, 230-233.
https://doi.org/10.1111/bij.12177
[27] West, D. and West, B.J. (2012) On Allometry Relations. International Journal of
Modern Physics B, 26, Article ID: 1230010.
https://doi.org/10.1142/S0217979212300101
[28] Brown, J.H., West, G.B. and Enquis, B.J. (2005) Yes, West, Brown and Enquist’s
Model of Allometric Scaling Is Both Mathematically Correct and Biologically Rele-
vant. Functional Ecology, 19, 735-738.
https://doi.org/10.1142/S0217979212300101
[29] Calder III, W.A. (1984) Size, Function and Life History. Dover Publications Inc.,
Mineola, New York.
[30] West, G.B. and Brown, J.H. (2005) The Origin of Allometric Scaling Laws in Biolo-
gy from Genomes to Ecosystems: Towards a Quantitative Unifying Theory of Bio-
logical Structure and Organization. Journal of Experimental Biology, 208, 1575-1592.
https://doi.org/10.1242/jeb.01589
[31] West, B.J. (2006) Where Medicine Went Wrong: Rediscovering the Path to Com-
plexity. Vol. 11, World Scientific Publishing Co. Pte. Ltd., New Jersey, London.
https://doi.org/10.1142/6175
[32] West, B.J. (1990) Fractal Physiology and Chaos in Medicine. World Scientific, Sin-
gapore, London.
[33] White, C.R. and Seymour, R.S. (2003) Mammalian Basal Metabolic Rate Is Proportional
to Body Mass2/3. Proceedings of the National Academy of Sciences of the United
States of America, 100, 4046-4049.
https://doi.org/10.1073/pnas.0436428100
[34] Moses, M.E., Hou, C., Woodruff, W.H., West, G.B., Nekola, J.C., Wenyun Zuo, et
al. (2008) Revisiting a Model of Ontogenic Growth: Estimating Model Parameters
from Theory and Data. American Naturalist, 171, 632-645.
https://doi.org/10.1086/587073
[35] Kolokotrones, T., Savage, Van M., Deeds, E.J. and Fontana, W. (2010) Curvature in
Metabolic Scaling. Nature, 464, 753-755. https://doi.org/10.1086/587073
[36] Dodds, P.S., Rothman, D.H. and Weitz, J.S. (2001) Re-Examination of the “3/4-Law”
of Metabolism. Journal of Theoretical Biology, 209, 9-27.
https://doi.org/10.1006/jtbi.2000.2238
[37] Milotti, E., Vyshemirsky, V., Stella, S., Dogo, F. and Chignola, R. (2017) Analysis of
the Fluctuations of the Tumour/Host Interface. Physica A. Statistical Mechanics and
its Applications, 486, 587-594. https://doi.org/10.1016/j.physa.2017.06.005
[38] West, G.B., Brown, J.H. and Enquist, B.J. (1999) The Four Dimension of Life: Frac-
tal Geometry and Allometric Scaling of Organisms. Science, 284, 1677-1679.
https://doi.org/10.1126/science.284.5420.1677
[39] West, G.B., Brown, J.H. and Enquist, B.J. (1997) A General Model for the Origin of
Allometric Scaling Laws in Biology. Science, 276, 122-126.
https://doi.org/10.1126/science.276.5309.122
[40] Labra, F.A., Marquet, P.A. and Bozinovic, F. (2007) Scaling Metabolic Rate Fluctua-
tions. Proceedings of the National Academy of Sciences of the United States of
America, 104, 10900-10903. https://doi.org/10.1073/pnas.0704108104
DOI: 10.4236/ijcm.2021.127025 293 International Journal of Clinical MedicineA. Szasz
[41] West, G.B., Woodruff, W.H. and Brown, J.H. (2002) Allometric Scaling of Metabolic
Rate from Molecules and Mitochondria to Cells and Mammals. Proceedings of the
National Academy of Sciences of the United States of America, 99, 2473-2478.
https://doi.org/10.1073/pnas.012579799
[42] Guiot, C., Delsanto, P.P.P., Carpinteri, A., Pugno, N., Mansury, Y. and Deisboeck,
T.S. (2006) The Dynamic Evolution of the Power Exponent in a Universal Growth
Model of Tumors. Journal of Theoretical Biology, 240, 459-463.
https://doi.org/10.1016/j.jtbi.2005.10.006
[43] Puliafito, A., Primo, L. and Celani, A. (2017) Cell-Size Distribution in Epithelial
Tissue Formation and Homeostasis. Journal of The Royal Society Interface, 14, Ar-
ticle ID: 20170032. https://doi.org/10.1098/rsif.2017.0032
[44] Egeblad, M., Nakasone, E.S. and Werb, Z. (2010) Tumors as Organs: Complex Tis-
sues That Interface with the Entire Organism. Developmental Cell, 18, 884-901.
https://doi.org/10.1016/j.devcel.2010.05.012
[45] Kallinowski, F., Schlenger, K.H., Runkel, S., Kloes, M., Stohrer, M., Okunieff, P. and
Vaupel, P. (1989) Blood Flow, Metabolism, Cellular Microenvironment, and Growth
Rate of Human Tumor Xenografts. Cancer Research, 49, 3759-3764.
[46] Guiot, C., Degiorgis, P.G, Delsanto, P.P., Gabriele, P. and Deisboeck, T.S. (2003)
Does Tumor Growth Follow a “Universal Law”? Journal of Theoretical Biology,
225, 147-151. https://doi.org/10.1016/S0022-5193(03)00221-2
[47] Moatemed, F., Sahimi, M. and Naeim, F. (1998) Fractal Dimension of the Bone
Marrow in Metastatic Lesions. Human Pathology, 29, 1299-1303.
https://doi.org/10.1016/S0046-8177(98)90261-1
[48] West, G.B. and Brown, J.H. (2004) Life’s Universal Scaling Laws. Physics Today, 57,
36-44. https://doi.org/10.1063/1.1809090
[49] West, G.B., Brown, J.H. and Enquist, B.J. (2001) A General Model for Ontogenic
Groth. Nature, 413, 628-631. https://doi.org/10.1038/35098076
[50] Makarieva, A.M., Nefiodov, A.V. and Li, B.-L. (2020) Life’s Energy and Information:
Contrasting Evolution of Volume versus Surface-Specific Rates of Energy Con-
sumption. Entropy, 22, Article No. 1025.
https://doi.org/10.3390/e22091025
[51] Baish, J.W. and Jain, R.K. (2000) Fractals and Cancer. Cancer Research, 60,
3683-3688.
[52] Tubiana, M. (1989) Tumor Cell Proliferation Kinetics and Tumor Growth Rate.
Acta Oncologica, 28, 113-121. https://doi.org/10.3109/02841868909111193
[53] Gazit, Y. (1996) Fractal Vasculature and Vascular Network Growth Modeling in
Normal and Tumor Tissue. PhD Thesis, Massachusetts Institute of Technology,
Cambridge, MA.
[54] Sabo, E., Boltenko, A., Sova, Y., Stein, A., Kleinhaus, S. and Resnick, M.B. (2001)
Microscopic Analysis and Significance of Vascular Architectural Complexity in
Renal Cell Carcinoma. Clinical Cancer Research, 7, 533-537.
[55] Herman, A.B., Savage, V.M. and West, G.B. (2011) A Quantitative Theory of Solid
Tumor Growth, Metabolic Rate and Vascularization. PLoS ONE, 6, e22973.
https://doi.org/10.1371/journal.pone.0022973
[56] Bauer, W. and Mackenzie, C.D. (1995) Cancer Detection via Determination of
Fractal Cell Dimension. arXiv:patt-sol/9506003.
[57] Mandelbrot, B.B. and Wheeler, J.A. (1983) The Fractal Geometry of Nature. American
Journal of Physics, 51, 286-287. https://doi.org/10.1119/1.13295
[58] Huang, W., Yen, R.T., McLaurine, M. and Bledsoe, G. (1996) Morphometry of the
DOI: 10.4236/ijcm.2021.127025 294 International Journal of Clinical MedicineA. Szasz
Human Pulmonary Vasculature. Journal of Applied Physiology, 81, 2123-2133.
https://doi.org/10.1152/jappl.1996.81.5.2123
[59] Savage, Van M., Gillooly, J.F., Woodruff, W.H., West, G.B., Allen, A.P., Enquist, B.J.
and Brown, J.H. (2014) The Predominance of Quarter-Power Scaling in Biology.
Functional Ecology, 18, 257-282. https://doi.org/10.1111/j.0269-8463.2004.00856.x
[60] Szigeti, G.P., Szasz, O. and Hegyi, G. (2017) Connections between Warburg’s and
Szentgyorgyi’s Approach about the Causes of Cancer. Journal of Neoplasm, 1, 1-13.
[61] Voet, D., Voet, J.G. and Pratt, C.W. (2006) Fundamentals of Biochemistry. 2nd Edi-
tion, John Wiley and Sons, Inc., Hoboken, 547, 556.
[62] Pamatmat, M.M. (2005) Measuring Aerobic and Anaerobic Metabolism of Benthic
Infauna under Natural Conditions. Journal of Experimental Zoology, 228, 405-413.
https://doi.org/10.1002/jez.1402280303
[63] Costello, L.C. and Franklin, R.B. (2006) Tumor Cell Metabolism: The Marriage of
Molecular Genetics and Proteomics with Cellular Intermediary Metabolism; Proceed
with Caution! Molecular Cancer, 5, Aticle No. 59.
https://doi.org/10.1186/1476-4598-5-59
[64] Warburg, O. (1956) On the Origin of Cancer Cells. Science, 123, 309-314.
https://doi.org/10.1126/science.123.3191.309
[65] Jeon, S.-M. and Hay, N. (2018) Expanding the Concepts of Cancer Metabolism. Ex-
perimental & Molecular Medicine, 50, 1-3.
https://doi.org/10.1038/s12276-018-0070-9
[66] Ward, P.S. and Thompson, C.B. (2012) Metabolic Reprogramming: A Cancer
Hallmark Even Warburg Did Not Anticipate. Cancer Cell, 21, 297-308.
https://doi.org/10.1016/j.ccr.2012.02.014
[67] Hand, S.V. and Menze, M.A. (2008) Commentary Mitochondria in Energy-Limited
States: Mechanisms That Blunt the Signaling of Cell Death. The Journal of Experi-
mental Biology, 211, 1829-1840. https://doi.org/10.1242/jeb.000299
[68] Szasz, O., Vincze, G., Szigeti, G.P., Benyo, Z. and Szasz, A. (2018) An Allometric
Approach of Tumor-Angiogenesis. Medical Hypotheses, 116, 74-78.
https://doi.org/10.1016/j.mehy.2018.03.015
[69] Tannock, I.F. (1968) The Relation between Cell Proliferation and the Vascular Sys-
tem in a Transplanted Mouse Mammary Tumour. British Journal of Cancer, 22,
258-273. https://doi.org/10.1038/bjc.1968.34
[70] Milotti, E., Vyshemirsky, V., Sega, M. and Chignola, R. (2012) Interplay between
Distribution of Live Cells and Growth Dynamics of Solid Tumours. Scientific Re-
ports, 2, Article No. 990. https://doi.org/10.1038/srep00990
[71] Milotti, E., Vyshemirsky, V., Sega, M. and Chignola, R. (2013) Metabolic Scaling in
Solid Tumours. Scientific Reports, 3, Article No. 1938.
https://doi.org/10.1038/srep01938
[72] Painter, P.R. (2005) Allometric Scaling of the Maximum Metabolic Rate of Mammals:
Oxygen Transport from the Lungs to the Heart Is a Limiting Step. Theoretical Biol-
ogy and Medical Modelling, 2, Article No. 31.
https://doi.org/10.1186/1742-4682-2-31
[73] Szasz, O. and Szigeti, Gy.P. (2020) Allometric Scaling by the Length of the Circulatory
Network. Frontiers in Physiology Fractal and Network Physiology. (Under Review)
[74] Shim, E.B., Kim, Y.S. and Deisboeck, T.S. (2007) 2D FEM Tumor Angiogenesis
Model 1 Analyzing the Dynamic Relationship between Tumor Growth and Angi-
ogenesis in a Two Dimensional Finite Element Model.
https://arxiv.org/ftp/q-bio/papers/0703/0703015.pdf
DOI: 10.4236/ijcm.2021.127025 295 International Journal of Clinical MedicineA. Szasz
[75] Landini, G. and Rippin, J.W. (1993) Fractal Dimensions of the Epithelial-Connective
Tissue Interfaces in Premalignant and Malignant Epithelial Lesions of the Floor of
the Mouth. Analytical and Quantitative Cytology and Histology, 15, 144-149.
[76] McDonald, M.D. and Choyke, P.L. (2003) Imaging of Angiogenesis from Microscope
to Clinic. Nature Medicine, 9, 713-725.
https://doi.org/10.1038/nm0603-713
[77] Ichim, L. and Dobrescu, R. (2013) Characterization of Tumor Angiogenesis Using
Fractal Measures. 19th International Conference on Control Systems and Computer
Science, Bucharest, 29-31 May 2013, 345-349. https://doi.org/10.1109/CSCS.2013.18
https://www.researchgate.net/publication/261092279
[78] Jurczyszyn, K., Osiecka, B.J. and Ziołkowski, P. (2012) The Use of Fractal Dimen-
sion Analysis in Estimation of Blood Vessels Shape in Transplantable Mammary
Adenocarcinoma inWistar Rats after Photodynamic Therapy Combined with
Cysteine Protease Inhibitors. Computational and Mathematical Methods in Medi-
cine, 2012, Article ID: 793291. https://doi.org/10.1155/2012/793291
[79] Avakian, A., Kalina, R.E., Sage, E.H., Rambhia, A.H., Elliott, K.E., Chuang, E.L.,
Clark, J.I., Hwang, J.N. and Parsons-Wingerter, P. (200) Fractal Analysis of Re-
gion-Based Vascular Change in the Normal and Non-Proliferative Diabetic retina.
Current Eye Research, 24, 274-280.
https://doi.org/10.1076/ceyr.24.4.274.8411
[80] Parsons-Wingerter, P., Chandrasekharan, U.M., McKay, T.L., Radhakrishnan, K.,
DiCorleto, P.E., Albarran, B. and Farr, A.G. (2006) A VEGF165-Induced Phenotypic
Switch from Increased Vessel Density to Increased Vessel Diameter and Increased
Endothelial NOS Activity. Microvascular Research, 72, 91-100.
https://doi.org/10.1016/j.mvr.2006.05.008
[81] Guidolin, D., Vacca, A., Nussdorfer, G.G. and Ribatti, D. (2004) A New Image
Analysis Method Based on Topological and Fractal Parameters to Evaluate the An-
giostatic Activity of Docetaxel by Using the Matrigel Assay in Vitro. Microvascular
Research, 67, 117-124. https://doi.org/10.1016/j.mvr.2003.11.002
[82] Mancardi, D., Varetto, G., Bucci, E., Maniero, F. and Guiot, C. (2008) Fractal Para-
meters and Vascular Networks: Facts & Artifacts. Theoretical Biology and Medical
Modelling, 5, Article No. 12. https://doi.org/10.1186/1742-4682-5-12
DOI: 10.4236/ijcm.2021.127025 296 International Journal of Clinical MedicineYou can also read