A simple parametrization of mélange buttressing for calving glaciers
←
→
Page content transcription
If your browser does not render page correctly, please read the page content below
The Cryosphere, 15, 531–545, 2021
https://doi.org/10.5194/tc-15-531-2021
© Author(s) 2021. This work is distributed under
the Creative Commons Attribution 4.0 License.

A simple parametrization of mélange buttressing
for calving glaciers
Tanja Schlemm1,2 and Anders Levermann1,2,3
1 PotsdamInstitute for Climate Impact Research, Potsdam, Germany
2 Institute
         of Physics and Astronomy, University of Potsdam, Potsdam, Germany
3 Lamont-Doherty Earth Observatory, Columbia University, New York, USA

Correspondence: Anders Levermann (anders.levermann@pik-potsdam.de)

Received: 12 February 2020 – Discussion started: 17 February 2020
Revised: 1 December 2020 – Accepted: 14 December 2020 – Published: 3 February 2021

Abstract. Both ice sheets in Greenland and Antarctica are          and Kanagaratnam, 2006). Because surface melt increased
discharging ice into the ocean. In many regions along the          faster than glacier speed, calving was responsible for a third
coast of the ice sheets, the icebergs calve into a bay. If the     of the mass loss of the Greenland ice sheet between 2009 and
addition of icebergs through calving is faster than their trans-   2012 (Enderlin et al., 2014). In the future, enhanced warming
port out of the embayment, the icebergs will be frozen into        (Franco et al., 2013) and the melt elevation feedback (Weert-
a mélange with surrounding sea ice in winter. In this case,        man, 1961; Levermann and Winkelmann, 2016) will further
the buttressing effect of the ice mélange can be considerably      increase surface melt but also intensify the flow of ice into
stronger than any buttressing by mere sea ice would be. This       the ocean. Calving accounts for roughly half the ice loss of
in turn stabilizes the glacier terminus and leads to a reduction   the Antarctic ice shelves; the rest is lost by basal melt (De-
in calving rates. Here we propose a simple parametrization         poorter et al., 2013).
of ice mélange buttressing which leads to an upper bound              It is clear that calving plays an important role in past and
on calving rates and can be used in numerical and analytical       present ice loss and is therefore very likely to play an impor-
modelling.                                                         tant role for future ice loss. However, by just calving off ice-
                                                                   bergs into the ocean and considering them eliminated from
                                                                   the stress field of the ice sheet–ice shelf system, most stud-
                                                                   ies neglect the buttressing effect of a possible ice mélange,
1   Introduction                                                   which can form within the embayment into which the glacier
                                                                   is calving. This study provides a simple parametrization that
Ice sheets gain mass by snowfall and freezing of seawater          accounts for the buttressing effect of ice mélange on calving
and lose mass through calving of icebergs and melting at the       on a large spatial scale and that can be used for continental-
surface and the bed. Currently the ice sheets in Antarctica        scale ice sheet modelling. Such simulations are typically run
and Greenland have a net mass loss and contribute increas-         on resolutions of several kilometres and over decadal to mil-
ingly to sea level rise (Rignot et al., 2014; Shepherd et al.,     lennial timescales. Any mélange parameterization needs to
2018b; WCRP Global Sea Level Budget Group, 2018; Rig-              be combined with a large-scale calving parameterization, of
not et al., 2019; Mouginot et al., 2019). The ice sheet’s fu-      which there are some. Benn et al. (2007) proposed a crevasse-
ture mass loss is important for sea level projections (Church      depth calving criterion assuming that once a surface crevasse
et al., 2013; Ritz et al., 2015; Golledge et al., 2015; De-        reaches the water level, an iceberg calves off. This does not
Conto and Pollard, 2016; Mengel et al., 2016; Kopp et al.,         give a calving rate but rather the position of the calving front.
2017; Slangen et al., 2017; Golledge et al., 2019; Levermann       It has been implemented in a flow-line model by Nick et al.
et al., 2020). For the Greenland ice sheet, calving accounted      (2010). Further calving parametrizations are a strain-rate-
for two-thirds of the ice loss between 2000 and 2005, while        dependent calving rate for ice shelves (Levermann et al.,
the rest was lost due to enhanced surface melting (Rignot

Published by Copernicus Publications on behalf of the European Geosciences Union.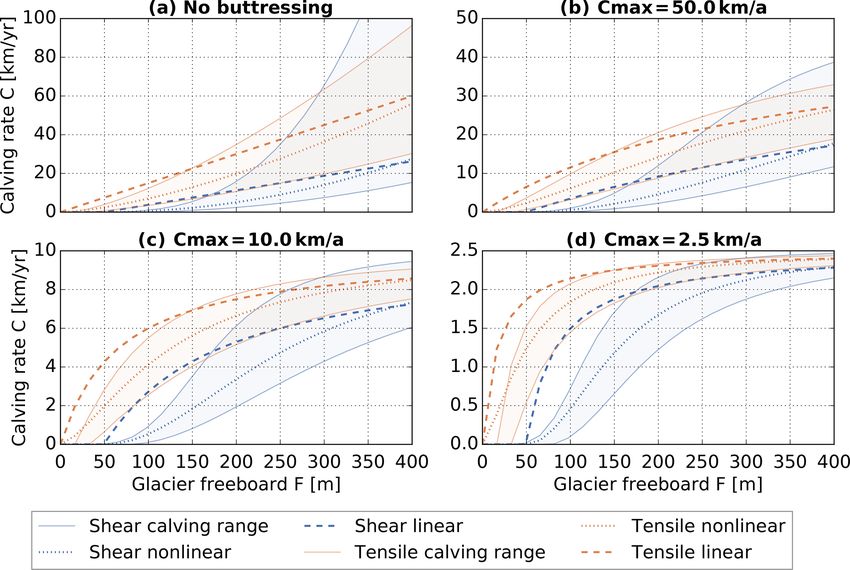
532                                                                    T. Schlemm and A. Levermann: Mélange buttressing

2012), a calving rate parametrization based on von Mises
stress and glacier flow velocity (Morlighem et al., 2016), and
a calving rate for a grounded glacier based on tensile fail-
ure (Mercenier et al., 2018). In addition to calving caused by
crevasses, another calving mechanism called cliff calving has
first been proposed by Bassis and Walker (2011), who found
that ice cliffs with a freeboard (ice thickness minus water
depth) larger than 100 m are inherently unstable due to shear
failure. Cliff calving was implemented as an almost step-like
calving rate by Pollard et al. (2015) and DeConto and Pollard
(2016), while Bassis et al. (2017) implemented cliff calving
as a criterion for the calving front position. Finally, Schlemm
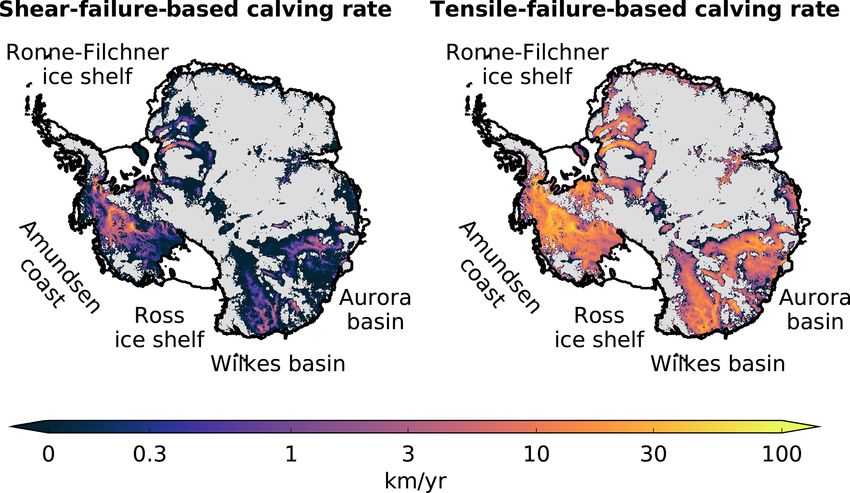
and Levermann (2019) derived a cliff calving rate dependent        Figure 1. Potential shear-failure-based calving rates (Eq. 16) and
on glacier freeboard and water depth by analysing stresses         tensile-failure-based calving rates (Eq. 15) in the grounded, marine
close to the glacier terminus and using a Coulomb failure          regions of the Antarctic ice sheet. Floating ice is shown in white
criterion.                                                         and grounded ice above sea level in grey. In the marine regions,
   Mélange buttressing is likely to have a stabilizing effect      ice is assumed to be at floatation thickness, which gives a minimal
on possible ice sheet instabilities. First, the so-called ma-      estimate of the potential calving rates. Estimates for shear calving
rine ice sheet instability (MISI; Mercer, 1978; Schoof, 2007;      rates go up to 65 km a−1 , and estimates for tensile calving rates
Favier et al., 2014) can unfold if the grounding line is sit-      go up to 75 km a−1 . If the grounding line retreat is faster than the
uated on a reverse-sloping bed. Secondly, if the ice shelves       speed with which the glacier terminus thins to floatation, calving
buttressing the grounding line have disintegrated due to calv-     rates could be even larger. Imposing an upper bound on the calving
                                                                   rates is necessary to prevent unrealistic, runaway ice loss.
ing or melting, and large ice cliffs become exposed, run-
away cliff calving might lead to the marine ice cliff instabil-
ity (MICI; Pollard et al., 2015). DeConto and Pollard (2016)
carried out past and future simulations of the Antarctic ice       ing crevasse propagation and reducing calving rates or pre-
sheet with cliff calving implemented as a step function with       venting calving completely. There is a large uncertainty in
a discussed but rather ad hoc upper limit of 5 km a−1 as           the value of mélange back stresses; values given in the
well as an additional hydrofracturing process that attacks the     literature range between 0.02–3 MPa (Walter et al., 2012;
ice shelves. Edwards et al. (2019) did further analysis and        Krug et al., 2015; Todd et al., 2018). Mélange back stress
compared the simulations of mid-Pliocene ice retreat (about        increases with L/W , the ratio of mélange length to the
3 million years ago), where sea level was 5–20 m higher than       width of the confining channel (Robel, 2017; Burton et al.,
present day, to observations. Given the uncertainty in many        2018; Amundson and Burton, 2018). The presence of pin-
ice sheet parameters, uncertainties in air and ocean temper-       ning points where the mélange grounds can also increase
ature forcing as well as uncertainty in determining Pliocene       the back pressure. Seasonality of basal and surface melting
sea level, agreement between simulations and observations          and resulting thinning of the ice mélange are other impor-
could be achieved even without MICI. Calving rates larger          tant parameters for mélange back stress. In addition to the
than 5 km a−1 were not considered, but it is clear that us-        reduced stresses caused by the back stress of the mélange,
ing one of the recently derived calving parametrizations with      the presence of mélange may prevent a full-thickness ice-
calving rates up to at least 65 km a−1 (see Fig. 1) would re-      berg from rotating away from the terminus, especially if the
sult in too much and too fast ice retreat. An upper limit on       glacier is thicker than floatation thickness (Amundson et al.,
the calving rates appears to be necessary.                         2010). Tensile-failure-based calving (Mercenier et al., 2018)
   So far, the calving rate cut-off has been an ad hoc assump-     is likely to produce full-thickness icebergs and may be hin-
tion. However, this upper limit should correspond to some          dered significantly by mélange. Shear-failure-based calving
physical process that is responsible for limiting calving rates.   (Schlemm and Levermann, 2019) is more likely to produce
We propose that ice mélange, a mix of icebergs and sea ice         many smaller icebergs (break-up occurs through many small,
that is found in many glacial embayments, gives rise to a neg-     interacting fractures at the foot of the terminus) and might
ative feedback on calving rates.                                   be less influenced by mélange. Ice mélange is also relevant
   Observations in Store Glacier and Jakobshavn Glacier in         for calving from ice shelves in Antarctica: the presence of
Greenland have shown that in the winter, when sea ice is           mélange stabilizes rifts in the ice shelf and can prevent tab-
thick, ice mélange prevents calving (Walter et al., 2012;          ular icebergs from separating from the ice shelf (Rignot and
Xie et al., 2019). This has also been reproduced in mod-           MacAyeal, 1998; Khazendar et al., 2009; Jeong et al., 2016).
elling studies of grounded marine glaciers (Krug et al., 2015;        We propose a negative feedback between calving rate and
Todd et al., 2018, 2019): back stresses from the mélange           mélange thickness: a glacier terminus with high calving rates
reduce the stresses in the glacier terminus, thereby limit-        produces a lot of icebergs, which become part of the ice

The Cryosphere, 15, 531–545, 2021                                                        https://doi.org/10.5194/tc-15-531-2021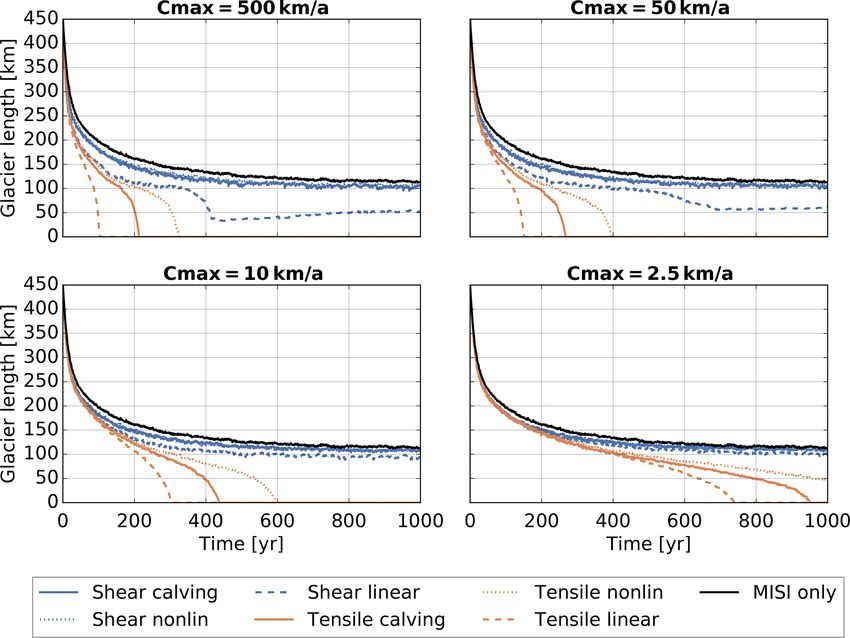
T. Schlemm and A. Levermann: Mélange buttressing                                                                               533

mélange in front of the glacier. The thicker the mélange is,         by Wcf , and its width at the exit by Wex . The calving rate C
the stronger it buttresses the glacier terminus, leading to re-      is assumed to be equal to the ice flow ucf so that the calv-
duced calving rates. In Sect. 2, we show that with a few sim-        ing front remains at a fixed position. As the mélange thins
ple assumptions, this negative feedback between calving rate         on its way to the embayment exit, it has an exit thickness dex
and mélange thickness leads to an upper limit on the calv-           and an exit velocity uex at which mélange and icebergs are
ing rates. Section 3 shows that the model can extend beyond          transported away by ocean currents (see also Appendix B).
the steady state. Application to two calving parametrizations        We consider a mélange volume V = Aem d, where d is the
and possible simplifications are discussed in Sect. 4, and in        average mélange thickness. The overall rate of change in the
Sect. 5 the mélange-buttressed calving rates are applied in an       mélange volume is given by
idealized glacier set-up.
                                                                     dV
                                                                        = Wcf H C − Wex dex uex − mAem ,                        (2)
                                                                     dt
2   Derivation of an upper limit to calving rates due to
                                                                     where the first term corresponds to mélange production at the
    mélange buttressing
                                                                     calving front, the second term corresponds to mélange exit-
Mélange can prevent calving in two ways: first, in the win-          ing into the ocean, and the third term corresponds to mélange
ter, additional sea ice stiffens and fortifies the mélange and       loss through melting (assuming an average melt rate m). As-
can thus inhibit calving, for example of Greenland glaciers          suming a steady state of mélange production and loss re-
(Amundson et al., 2010; Todd and Christoffersen, 2014;               sulting in a constant mélange geometry (dV /dt = 0), we can
Krug et al., 2015). Secondly, a weaker mélange can still pre-        solve Eq. (2) for dex :
vent a full-thickness iceberg from rotating out (Amundson                    Wcf H C − mAem
et al., 2010) and thus prevent further calving. Ice sheet mod-       dex =                  .                                   (3)
                                                                                  Wex uex
els capable of simulating the whole Greenland or Antarctic
ice sheet over decadal to millennial timescales cannot resolve       This equation only has a physical solution if mAem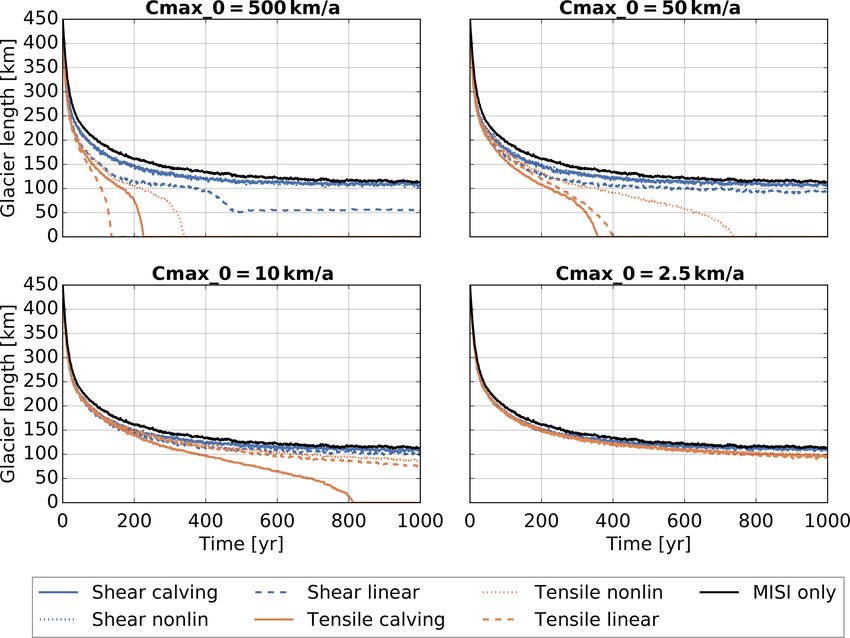
534 T. Schlemm and A. Levermann: Mélange buttressing
According to Eqs. (5) and (7), the limit on calving rates is
a function of embayment geometry and mélange properties:
Lem −1
Wex
Cmax = b0 + b1 µ0 γ uex . (8)
Wcf W
Since Cmax is proportional to Wex /Wcf , embayments that be-
come narrower at some distance from the calving front expe-
rience stronger mélange buttressing and consequently have
smaller upper limits than embayments that are widening to-
wards the ocean. Also the longer the embayment is com-
pared to the average embayment width (Lem /W ), the smaller
the upper limit is, even though friction between the mélange
and the embayment walls has not been taken explicitly into
account. Previous studies have already shown this for the
mélange back stress (Burton et al., 2018; Amundson and
Burton, 2018). Fast ocean currents or strong wind forcing
at the embayment exit may lead to fast export of mélange
(fast exiting velocities uex ) and hence reduced mélange but-
tressing. Melting of the mélange from below will also reduce
mélange buttressing and hence increase Cmax . The stronger
the internal friction of the mélange (µ0 ), the larger the but-
Figure 2. Geometry of the glacier terminus, ice mélange, and em- tressing effect.
bayment as a side view and a top view. The side view shows the ice It can be instructive to consider the force per unit width
thickness H , the calving front thickness dcf , and exit thickness dex at the calving front as given by Eq. (10) in Amundson and
of the ice mélange as well as the calving rate C and the mélange
Burton (2018) with the mélange thickness given by Eq. (5)
exit velocity uex . The plan view shows the embayment width at the
derived above:
calving front Wcf and the embayment exit width Wex as well as the
length of the embayment Lem . The mélange does not necessarily
F 1 ρi dex 2
need to extend all the way to the embayment exit: if it is shorter, = ρi 1 − 1− dcf
W 2 ρw dcf
then Lem donates the mélange length and Wex the width of the em-
1 ρi Lem
bayment at the position where the mélange ends. = ρi 1 − b0 + b1 µ 0 −1
2 ρw W
2
H C ∗ W mA
cf em
This function is linear, C ≈ C ∗ , for small unbuttressed calv- − . (9)
ing rates (C ∗
Cmax = e a −1 ), and the buttressed calving rate 1 + C ∗ WexWγcfuex b0 + b1 µ0 Lem Wex uex Wex uex
W
C saturates at an upper limit Cmax = e a −1 for large unbut-
∗
tressed calving rates (C
Cmax = e −1
a ). This means that
3 Beyond a steady-state solution
the parameter e a can be considered to be the inverse maxi-
mum calving rate, Cmax = e a −1 , which is dependent on the The mélange buttressing model derived in Sect. 2 assumes
embayment geometry, mélange flow properties, and the em- mélange to be in a steady state with a fixed mélange geome-
bayment exit velocity. If the unbuttressed calving rate, C ∗ , try. This implies a fixed calving front position. This assump-
is small compared to the upper bound Cmax , there is little tion is not fulfilled if glacier retreat is considered. There-
buttressing. If C ∗ is of the same order of magnitude or larger fore it is worthwhile to go beyond the steady-state solution.
than Cmax , there is significant buttressing (see Fig. 5). Includ- If the mélange geometry changes in time, the change in the
ing melt of the mélange leads to higher calving rates because mélange volume can be expressed as
melting thins the mélange and weakens the buttressing it pro-
vides to the calving front. ZL(t)
Rather than imposing an upper bound on the calving dV d
= dx W (x) d(x, t), (10)
rates as an ad hoc cut-off as done by DeConto and Pollard dt dt
0
(2016) and Edwards et al. (2019), mélange buttressing gives
a natural upper bound on the calving rate, which is reached where L(t) is the distance between the embayment exit and
smoothly. The value of the upper bound can be different for the calving front, W (x) is the width of the embayment at a
each glacier depending on the embayment geometry and may distance x from the embayment exit, d(x, t) is the mélange
change seasonally in accord with mélange properties. thickness, and the embayment exit is fixed at x = 0. This ex-
pression is equal to the sum of mélange production and loss
The Cryosphere, 15, 531–545, 2021 https://doi.org/10.5194/tc-15-531-2021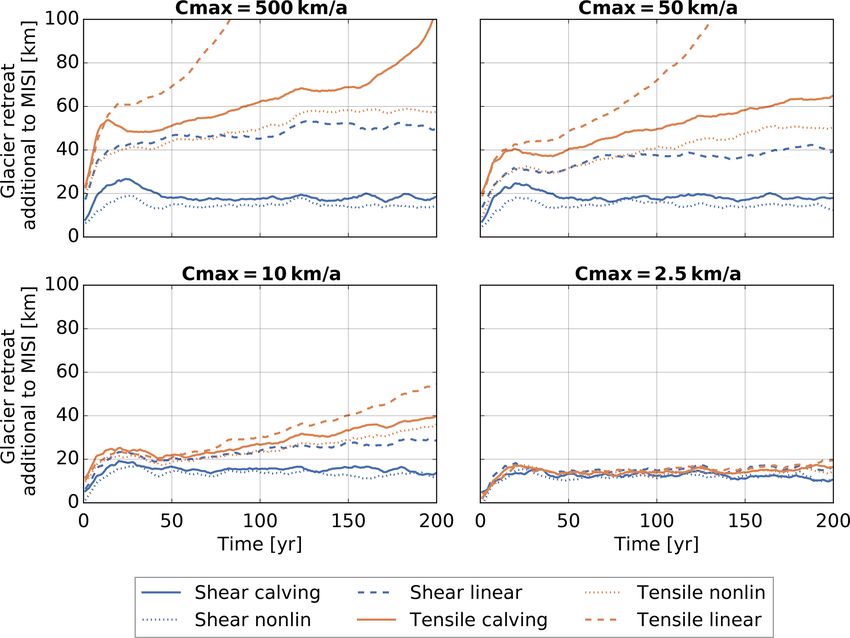
T. Schlemm and A. Levermann: Mélange buttressing 535
terms given in Eq. (2). By applying the Leibniz integral rule
to the volume integral of Eq. (10) as rewriting the mélange
production and loss terms as functions of time and calving
front position, Eq. (2) becomes
ZL
d
WL H C − W0 d0 uex − m dx W (x) = WL βd0 · L
dt
0
L
Z
d
+ dx W (x) · βd0 , (11)
dt
0
with L = L(t), H = H (L(t)), C = C(t), d0 = d(0, t), W0 =
W (0), WL = W (L(t)), and β = β(L(t)). The first three
terms on the left-hand side are the mélange production
through calving, the mélange loss at the embayment exit, and Figure 3. Panels (a) and (b) show the numerical solutions of force
the mélange melting, respectively, and the right-hand side is per unit width, F (t)/W , and mélange thickness at the embay-
the rewritten volume integral. If the embayment geometry ment exit, d(0, t), given by Eqs. (11)–(14) if mélange length is as-
W (x) and the ice thickness at the calving front H (L(t)) are sumed to be constant. Two scenarios are considered: without melt-
known, the calving rate C(t) is given by ing (blue line) and with melting (orange). Panels (c) and (d) show
the mélange thickness at the calving front, d(L(t), t), and the re-
β(L(t))d(0, t) sulting buttressed calving rate, C(t). The solution with free evolu-
C(t) = 1 − C∗, (12) tion of the mélange geometry (continuous line) is contrasted with
γ H (L(t))
the steady-state solution obtained by plugging the mélange length,
and if an equation for the evolution of the mélange length L(t), into Eqs. (5) and (6), respectively (dashed line), showing equi-
L(t) is assumed, this differential equation for d(0, t) can be libration of the mélange in less than a year.
solved. We consider two cases for the evolution of L(t): first,
a constant mélange length where the mélange retreats with
a steady-state solution, but the mélange equilibrates quickly,
the calving front, and second, mélange pinned to the embay-
with the free-evolution solution reaching the constant steady-
ment exit so that the mélange length grows with the rate of
state solution in less than 6 months of simulation time. If
the glacier retreat. We now consider an idealized set-up with
melting is included, the mélange is thinner, and hence the
constant ice thickness, H (x) = H , as well as constant em-
final calving rate is slightly larger. The force per unit width
bayment width, W (x) = W . Equations (11)–(14) are solved
is small compared to other mélange models (Amundson and
numerically for the parameter values H = 1000 m, W =
Burton, 2018; Burton et al., 2018), but it is not an integral
10 km, µ = 0.3, γ = 0.2, C ∗ = 3 km a−1 , uex = 100 km a−1 ,
part of the model, rather only a diagnostic. A force of about
b0 = 1.11, and b1 = 1.21 and the initial conditions L(0) =
107 N m−1 (Amundson et al., 2010) prevents icebergs from
10 km and d(0) = 10 m. We consider a scenario without
rotating out and would inhibit calving. A weaker mélange
mélange melting, m = 0, and a scenario with mélange melt-
merely reduces calving rates as seen here. Also the set-up
ing, where the melt rate is set to m = 10 m a−1 .
here is of a rather short mélange (L/W = 1), and hence the
3.1 Constant mélange length mélange is not very thick.
3.2 Mélange pinned to embayment exit
First, we assume a constant mélange length:
d Second, we assume that the mélange is pinned to the embay-
L(t) = 0. (13) ment exit; hence the mélange length grows with the rate of
dt
glacier retreat:
This might be either because the calving front does not move
d
(ice flow equals calving rate) or because the mélange is not L(t) = C(t) − ucf (t), (14)
pinned to the embayment exit and retreats with the calving dt
front, keeping a constant length. where the ice flow velocity at the calving front, ucf (t), de-
The solutions for the force per unit width at the calving pends on the bed topography and the ice dynamics. In this
front (F (t)/W ), mélange thickness at the embayment exit simplified set-up, we neglect ice flow by setting ucf = 0. The
(d(0, t)), mélange thickness at the calving front (d(L(t), t)), solutions for mélange length (L(t)), mélange thickness at the
and the resulting buttressed calving rate (C(t)) are shown in embayment exit (d(0, t)), mélange thickness at the calving
Fig. 3. The initial conditions chosen do not correspond to front (d(L(t), t)), and the resulting buttressed calving rate
https://doi.org/10.5194/tc-15-531-2021 The Cryosphere, 15, 531–545, 2021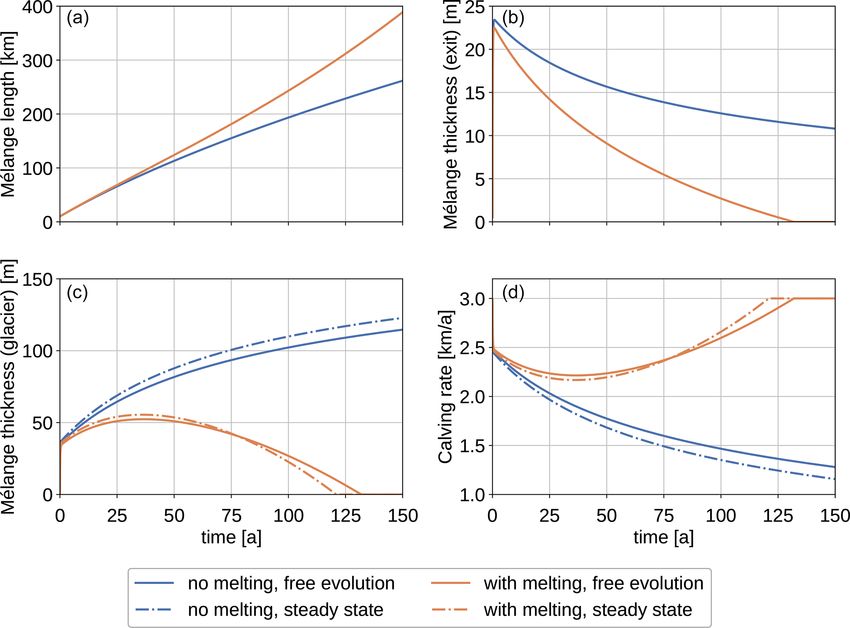
536                                                                            T. Schlemm and A. Levermann: Mélange buttressing

                                                                         failure-based calving parametrization for calving fronts with
                                                                         freeboards exceeding the stability limit.

                                                                         4.1    Tensile-failure-based calving

                                                                         A calving relation based on tensile failure was derived by
                                                                         Mercenier et al. (2018), who used the Hayhurst stress as a
                                                                         failure criterion to determine the position of a large crevasse
                                                                         that would separate an iceberg from the glacier terminus and
                                                                         calculated the timescale of failure using damage propagation.
                                                                         The resulting tensile calving rate is given by

                                                                         Ct∗ = B · 1 − w2.8
                                                                                                                       r
                                                                             · (0.4 − 0.45(w − 0.065)2 ) · ρi gH − σth · H,         (15)

Figure 4. Panels (a) and (b) show the numerical solutions of             with effective damage rate B = 65 MPa−r a−1 , stress thresh-
mélange length, L(t), and mélange thickness at the embayment             old for damage creation σth = 0.17 MPa, constant exponent
exit, d(0, t), given by Eqs. (11)–(14). Two scenarios are consid-        r = 0.43, ice density ρi = 1020 kg m−3 , gravitational con-
ered: without melting (blue line) and with melting (orange). Pan-
                                                                         stant g = 9.81 m s−2 , and the relative water depth w = D/H .
els (c) and (d) show the mélange thickness at the calving front,
d(L(t), t), and the resulting buttressed calving rate, C(t). The solu-
                                                                         This calving relation was derived for glacier fronts with a
tion with free evolution of the mélange geometry (continuous line)       glacier freeboard smaller than the stability limit.
is contrasted with the steady-state solution obtained by plugging the
mélange length, L(t), into Eqs. (5) and (6), respectively, (dashed       4.2    Shear-failure-based calving
line).
                                                                         An alternative calving relation based on shear failure of an
                                                                         ice cliff was derived in Schlemm and Levermann (2019),
                                                                         where shear failure was assumed in the lower part of an ice
(C(t)) are shown in Fig. 4. In the scenario without melt-
                                                                         cliff with a freeboard larger than the stability limit. The re-
ing, mélange length and thickness at the calving front in-
                                                                         sulting shear calving rate is given by
crease, while mélange thickness at the embayment exit and
buttressed calving rate decrease. If melting of mélange is
                                                                                      F − Fc s

considered, the mélange thickness at the calving front in-               Cs∗ = C0 ·                                                (16)
                                                                                         Fs
creases initially and then decreases until the embayment is
mélange-free since the volume of mélange melted increases                 Fs = 114.3(w − 0.3556)4 + 20.94 m                        (17)
with mélange area. A comparison between these solutions,
                                                                         Fc = (75.58 − 49.18 w) m                                  (18)
where the mélange geometry is free to evolve, and the corre-
sponding steady-state solution for mélange thickness at the               s = 0.1722 · exp(2.210 w) + 1.757,                       (19)
calving front and the calving front, obtained by plugging
                                                                         with relative water depth w ≡ D/H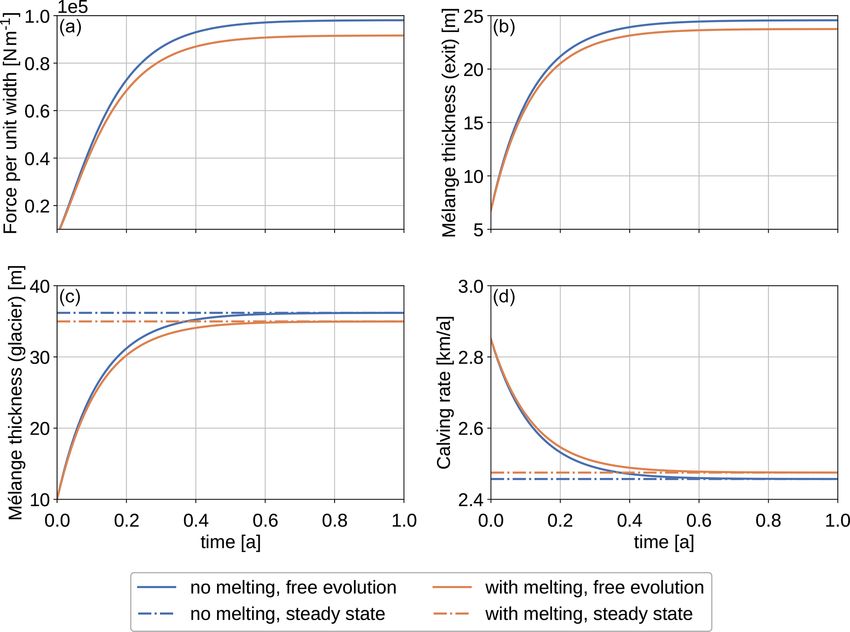
T. Schlemm and A. Levermann: Mélange buttressing                                                                                    537

then the buttressed calving rate is

            C
            es
Cs =                 .                                     (21)
       1
            + CC
                 e
       C0      max

Then if 1  C,
            e
                  2
                 Cmax
Cs = Cmax −           .                                    (22)
                 CC
                 e 0

For small Ce the choice of scaling parameter C0 influences
the final calving rate C, but for large C,
                                         e the upper bound
Cmax determines the resulting calving rate. Since the scaling
parameter C0 is difficult to constrain and has little influence
on the mélange-buttressed calving rate, it makes sense to use      Figure 5. Calving rates as a function of glacier freeboard (ice thick-
a fixed value, e.g. C0 = 90 m a−1 , and treat only the upper       ness – water depth) in the unbuttressed case and for a range of upper
bound Cmax as a free parameter (which is dependent on the          bounds Cmax . Shear calving and tensile calving rates depend also
embayment geometry and mélange properties).                        on the water depth: two lines are shown for each configuration, the
                                                                   lower line for a dry cliff (w = 0.0) and the upper line for a cliff at
4.3    Comparison of the calving parametrizations                  floatation (w = 0.8). This spans the range of possible calving rates
                                                                   for a given freeboard. Also shown are the nonlinear (dotted line)
A comparison of the two stress-based calving rates can be          and linear (dashed lines) approximations to these calving laws. In
divided into four parts (see Fig. 5a):                             the tensile case, calving commences with freeboard F = 0, while
                                                                   shear calving only happens for freeboards larger Fc ≈ 50 m.
 1. According to the calving parametrizations considered
    here (Eqs. 15 and 16), glacier fronts with very small
    freeboards (< ≈ 20 m) do not calve.                            the larger calving rate. Since it is likely that in nature large
                                                                   ice cliffs fail due to a combination of failure modes, it also
 2. For glacier freeboards below the stability limit of ≈          seems reasonable to use a combination of tensile and shear
    100 m, there is only tensile calving with calving rates        calving rates.
    up to ≈ 10 km a−1 and no shear calving.                           In the context of the Marine Ice Cliff Instability (MICI)
 3. Above the stability limit, shear calving rates increase        hypothesis, one would expect a sudden and large increase in
    slowly at first but speed up exponentially and equal the       calving rates for ice cliffs higher than the stability limit. De-
    tensile calving rates at freeboards between 200–300 m          spite a nonlinear increase in calving rates in the unbuttressed
    and calving rates between 15–60 km a−1 . There is a            case, neither of the two stress-based calving parametrizations
    spread in these values because both calving rates de-          (Mercenier et al., 2018; Schlemm and Levermann, 2019) nor
    pend on the water depth as well as the freeboard.              a combination of them shows discontinuous behaviour at the
                                                                   stability limit.
 4. For even larger freeboards, shear calving rates have a
    larger spread than tensile calving rates and much larger       4.4   Simplified calving relations
    values for cliffs at floatation.
                                                                   There are uncertainties in both calving laws because a domi-
A comparison of the buttressed calving rates can be classified     nating failure mode is assumed (shear and tensile failure, re-
in the same way (see Fig. 5b–d), where the only difference         spectively), while in reality failure modes are likely to inter-
is that large calving rates converge to a value just below the     act. Also, in the calving laws ice is assumed to be previously
upper limit Cmax , and hence the difference between tensile        undamaged, whereas a glacier is usually heavily crevassed
and shear calving rates for large freeboards is smaller.           and therefore weakened near the terminus. In addition, shear
   Summarizing, there are two different calving parametriza-       calving has a large uncertainty with respect to the time to fail-
tions based on tensile and shear failure and derived for glacier   ure, which leads to uncertainty in the scaling parameter C0 .
freeboards below and above the stability limit, respectively.      These uncertainties, together with the observation that the
It might seem obvious that one should simply use each calv-        upper limit Cmax seems to have a stronger influence on re-
ing law in the range for which it was derived. However, that       sulting calving rates than the choice of calving law, provide
would lead to a large discontinuity in the resulting calving       a good reason to consider simplifying these calving laws.
rate because the tensile calving rate is much larger at the sta-   The important distinction between shear and tensile calving
bility limit than the shear calving rate. Another possibility is   is that shear calving has a much larger critical freeboard: for
to use each parametrization in the range for which it gives        small freeboards (F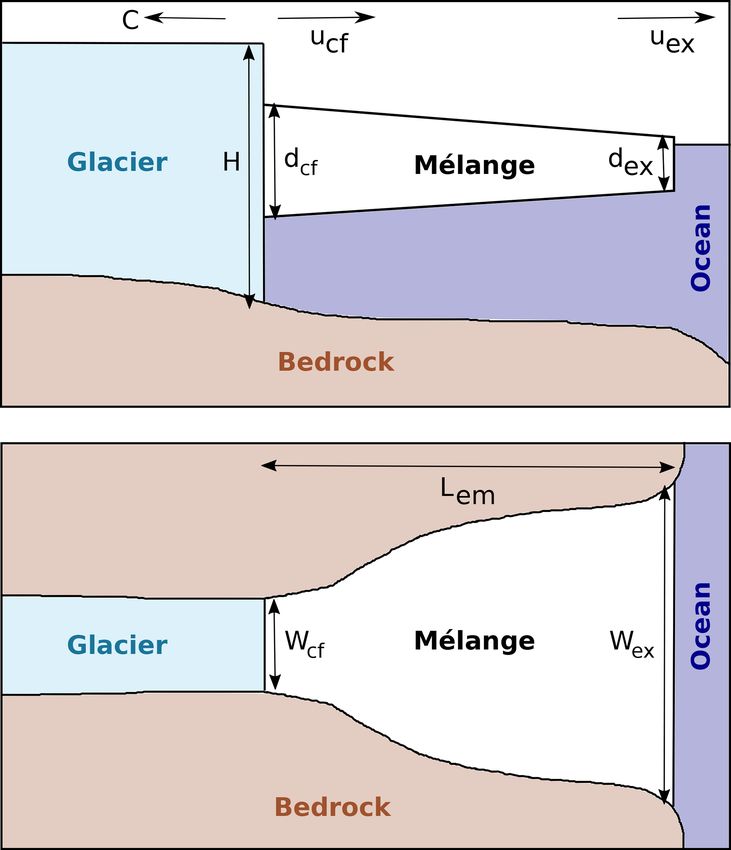
538                                                                      T. Schlemm and A. Levermann: Mélange buttressing

shear calving. Since the mélange-buttressed calving rate is        relations to compare: one that begins calving immediately
linear in the calving rates for small calving rates, this dis-     and one that only calves off cliffs larger than a certain criti-
tinction remains in the buttressed calving rates (see Fig. 5).     cal freeboard. For both we have a linear approximation that
However, for larger freeboards the calving rates approach the      overestimates small calving rates and a nonlinear approxima-
upper limit no matter which calving law was chosen. This           tion that lies well within the original spread of calving rates
distinction should be conserved in the simplified calving re-      (see Fig. 5).
lations. The dependence of the calving rate on water depth
is important in the unbuttressed case (see Fig. 5a): there is a
large range between calving rates for the same freeboard and       5     Mélange-buttressed calving in an idealized glacier
different relative water depths because larger relative water            set-up
depth implies a larger overall depth. For the same glacier
                                                                   We consider a Marine Ice Sheet Model Intercomparison
freeboard, this means a larger ice thickness and therefore
                                                                   Project (MISMIP+)-like glacier set-up (Cornford et al.,
larger stresses in the ice column, implying a larger calv-
                                                                   2020) that is symmetric about x = 0 and has periodic bound-
ing rate. But in the mélange-buttressed case, large calving
                                                                   ary conditions on the fjord walls. The glacial valley has an
rates are more strongly buttressed than small calving rates.
                                                                   average bedrock depth of 200 m and a width of 40 km and ex-
Thus the large range of possible calving rates for a given
                                                                   periences a constant accumulation of 1.5 m a−1 (see Fig. 6).
glacier freeboard is transformed into a much smaller range
                                                                   The set-up has rocky fjord walls, and where the bedrock
so that water depth becomes less important (see Fig. 5b–d).
                                                                   wall is below sea level, there is grounded ice resting on it.
Therefore we consider simplifications of the calving relations
                                                                   This grounded ice does not retreat during the calving exper-
where we average over the water depth and further simplify.
                                                                   iments and forms the embayment. Ice flow is concentrated
This is done mostly for illustrative purposes.
                                                                   in the middle of the channel, where the bedrock is signif-
   Take the shear calving relation:
                                                                   icantly deeper. Since there is no ice reservoir at the top of
             F − Fc s                                              the glacier, this set-up can also be considered to be a model

Cs∗ = C0 ·             ,                                  (23)     for a mountain glacier. The experiments were done with the
                Fs
                                                                   Parallel Ice Sheet Model (PISM; Bueler and Brown, 2009;
where C0 = 90 m a−1 , s(w) ∈ [1.93, 3.00], Fc (w) ∈                Winkelmann et al., 2011), which uses the shallow ice ap-
[30.9, 75.0] m, and Fs (w) ∈ [21.0, 31.1] m. In choosing           proximation (Hutter, 1983) and the shallow shelf approxi-
round values within these intervals, we can simplify the           mation (Weis et al., 1999). We use Glen’s flow law in the
relation.                                                          isothermal case and a pseudoplastic basal friction law (the
                                                                   PISM authors, 2018). A spin-up simulation was run until
                           F − 50 m 2

Cs,∗ nonlin = 90 m a−1 ·                            (24)           it reached a steady-state configuration with an attached ice
                             20 m                                  shelf. During the experiment phase of the simulation, all
Because the exponent s is on the smaller end of the possible       floating ice is removed at each time step. When the ice shelf
values, we chose a smaller value for Fs to get an approxi-         is removed, the marine ice sheet instability (MISI) kicks
mation that lies well within the range of the full-cliff calving   in because of the slightly retrograde bed topography, and
relation, though it lies at the lower end (see Fig. 5). An even    the glacier retreats. Calving accelerates this retreat. Exper-
simpler linear approximation                                       iments were made with no calving (MISI only), mélange-
                                                                   buttressed shear calving, and its nonlinear and linear approx-
Cs,∗ lin = 75 a−1 · (F − 50 m)                             (25)    imation as well as mélange-buttressed tensile calving and
                                                                   its two approximations. The initial upper bound was varied,
overestimates the calving rates for small freeboards
                                                                   Cmax = [2.5, 10.0, 50.0, 500.0] km a−1 , where the last upper
(F 600 m).
                                                                   nearly match the unbuttressed calving rates.
  The tensile calving relation can be written as
Ct∗ = a(w)(b(w)F − σth )0.43 · F ≈ c · F 1.5               (26)    5.1    Constant upper bound on calving rates

and can be fitted with a power function                            In this experiment, the upper bound was kept constant even
                                                                   though the glacier retreated and embayment length increased.
Ct,∗ nonlin = 7 m−0.5 a−1 · F 1.5                          (27)    The buttressing Eq. (7) was derived assuming a steady-state
                                                                   mélange geometry, which implies a fixed mélange geome-
or a linear function
                                                                   try. This is the case in this idealized set-up if we assume that
Ct,∗ lin = 150 a−1 · F.                                    (28)    mélange length is fixed, and mélange retreats with the calv-
                                                                   ing front, as in Sect. 3.1.
Here we neglect the small offset in freeboard that tensile
calving has. This gives us two kinds of simplified calving

The Cryosphere, 15, 531–545, 2021                                                       https://doi.org/10.5194/tc-15-531-2021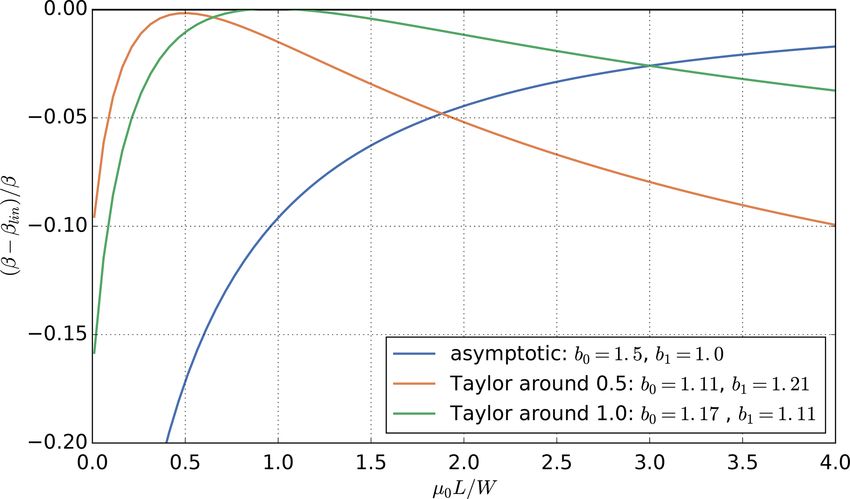
T. Schlemm and A. Levermann: Mélange buttressing                                                                                       539

Figure 6. Set-up of the idealized glacier experiments. Only half of
the set-up is shown; the glacier is connected to an identical copy on
the left to ensure periodic boundary conditions at the ice divide.

   Figure 7 shows the simulated glacier retreat. Even without
calving in the MISI-only experiment, there is a significant
retreat after removing the ice shelves because of the buttress-         Figure 7. Glacier length time series. Upper left panel shows runs
ing loss and slightly retrograde bed of the glacier. The glacier        with an upper limit of Cmax = 500 km a−1 , which is essentially
                                                                        equivalent to the unbuttressed calving rates. Then we have decreas-
retreats from a front position at 440 to 200 km in the first
                                                                        ing upper limits, and consequently the glacier retreat slows down.
100 years, after which the retreat decelerates, and the glacier
stabilizes at a length of about 130 km. Adding calving leads
to additional retreat: the higher the upper bound on the calv-
ing rates, the faster the retreat. Shear calving causes less addi-
tional retreat than tensile calving because it has small calving
rates for freeboards below 150 m. Since the channel is rather
shallow, the freeboards are generally small. Only the linear
approximation of shear calving has a significant ice retreat
because even though it starts only with a freeboard of 50 m,
it grows much faster than the actual shear calving or the non-
linear approximation. But it also reaches a stable glacier po-
sition when the ice thickness is smaller than the critical free-
board condition. The assumption of tensile calving causes
the glacier to retreat much faster. The linear approximation,
which has higher calving rates for small freeboards, leads to
a faster retreat. For the nonlinear approximation the glacier is
close to floatation for most of its retreat, which corresponds
to the upper half of the tensile calving range. This approxi-           Figure 8. Time series of glacier retreat in addition to the MISI re-
mation gives smaller calving rates and hence slower retreat.            treat, i.e. retreat caused by calving.
None of the tensile calving relations allow the glacier to sta-
bilize. That is to say the minimum freeboard below which an
ice front is stable for shear calving is ultimately the stabiliz-       sition of the embayment exit remains fixed so that the
ing factor in these simulations.                                        mélange length grows with the same rate with which the
   Figure 8 shows that the effect of mélange buttressing be-            glacier retreats. We assume an initial upper bound Cmax0 =
comes relevant for small values of the export of ice out of             [2.5, 10.0, 50.0, 500.0] km a−1 at t = 0 and update Cmax each
the embayment, i.e. for small values of Cmax . In this limit of         simulation year. We perform the same experiments as de-
strong buttressing, i.e. where the parameterization of Eq. (7)          scribed above. This adaptive approach leads to much smaller
is relevant, the glacier retreat becomes almost independent of          calving rates and slows down the glacier retreat signifi-
the specific calving parameterization.                                  cantly (compare Fig. 9 to Fig. 7). In the case with Cmax0 =
                                                                        10 km a−1 and Cmax0 = 2.5 km a−1 , the adaptive approach
5.2   An adaptive upper limit on calving rates                          prevents the complete loss of ice. Due to the increase in em-
                                                                        bayment length, the upper bound in calving rate is reduced
Assuming that mélange equilibration is faster than glacier              down to 30 % of its original value (see Fig. 10).
retreat, the upper bound Cmax can be calculated as a func-
tion of mélange length Lem . This is further justified by
the discussion in Sect. 3. Here we assume that the po-

https://doi.org/10.5194/tc-15-531-2021                                                            The Cryosphere, 15, 531–545, 2021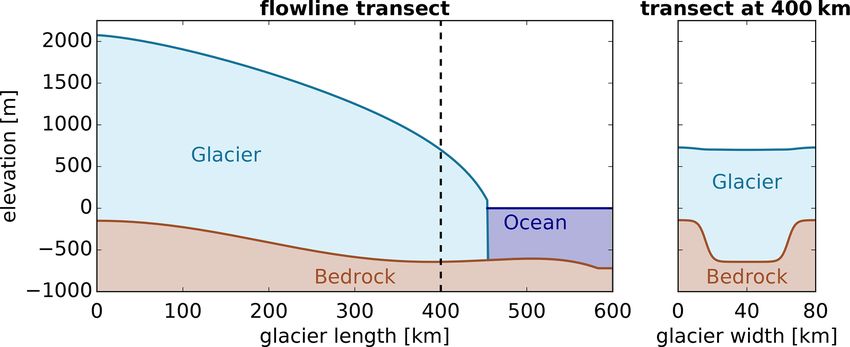
540                                                                        T. Schlemm and A. Levermann: Mélange buttressing

                                                                       increases with the length-to-width ratio, and that is also a
                                                                       feature found here in Eq. (8). The buttressing is described in
                                                                       the form of a reduced calving rate which is a function of the
                                                                       maximum calving rate as it is derived for the ice front with-
                                                                       out mélange buttressing. First, we assumed that calving rates
                                                                       decrease linearly with the mélange thickness. Secondly, we
                                                                       assume a steady state between mélange production through
                                                                       calving and mélange loss through melting and exit from the
                                                                       embayment. This implies a fixed calving front position. Us-
                                                                       ing these two assumptions, we derived a mélange-buttressed
                                                                       calving rate, Eq. (7), that is linear for small calving rates
                                                                       and converges to an upper limit Cmax , which depends on the
                                                                       embayment geometry, mélange flow properties, and the em-
                                                                       bayment exit velocity. We also went beyond the steady-state
                                                                       solution of mélange buttressing and considered an evolving
                                                                       mélange geometry. We found that mélange equilibration is
Figure 9. Glacier length time series with an adaptive calving limit.   faster than glacier retreat, which justifies the use of an adap-
                                                                       tive approach in which the upper limit Cmax is dependent on
                                                                       the mélange geometry.
                                                                          This framework can be applied to any calving parametriza-
                                                                       tion that gives a calving rate rather than the position of the
                                                                       calving front. We investigated its application to a tensile-
                                                                       failure-based calving rate and to a shear-failure-based calv-
                                                                       ing rate. For small calving rates, the differences between
                                                                       the parametrizations persist in the buttressed case. However,
                                                                       large calving rates converge to the upper limit, and the choice
                                                                       of calving parametrization becomes less important. This sug-
                                                                       gest that it is possible to simplify the calving parametriza-
                                                                       tions further, but we show that the simplifications differ for
                                                                       small calving rates, and those differences persist. We illus-
                                                                       trated this with a simulation of an idealized glacier. Choice
                                                                       of calving parametrization and choice of upper limit deter-
Figure 10. Reduction in the upper limit on calving rates as a func-    mine the retreat velocity. Following the adaptive approach,
tion of mélange length and glacier length.                             glacier retreat leads to a larger embayment and hence larger
                                                                       mélange buttressing and smaller calving rates.
                                                                          Embayment geometry plays an important role in determin-
6   Conclusions                                                        ing how susceptible glaciers facing similar ocean conditions
                                                                       are to rapid ice retreat: Pine Island Glacier and Thwaites
We considered mélange buttressing of calving glaciers to be            Glacier in West Antarctica face similar ocean conditions in
a complement to previously derived calving relations. These            the Amundsen Sea, where the warming ocean (Shepherd
calving relations can lead to unrealistically large calving            et al., 2004, 2018a) leads to the retreat and rifting of their but-
rates. This is a problem with the calving relations and should         tressing ice shelves (Jeong et al., 2016; Milillo et al., 2019),
be further investigated. Backed by evidence for mélange but-           and might be susceptible to both MISI and MICI. Pine Is-
tressing in observations and numerical simulations, we pro-            land terminates in an embayment about 45 km wide, cur-
pose that mélange buttressing may be one mechanism that                rently filled by an ice shelf of roughly 60 km length. The
prevents calving rates from growing too large. The approach            upper part of the glacier lies in a straight narrow valley with
here is to provide an equation that uses simple and transpar-          a width of about 35 km (distances measured on topography
ent assumptions to yield a non-trivial relation. The central as-       and ice thickness maps provided by Fretwell et al., 2013). If
sumption is that the reduction in calving rates is linear with         Pine Island Glacier lost its current shelf, it would have a long
mélange thickness. Other important factors determining the             and narrow embayment holding the ice mélange and would
mélange buttressing are the strength of the sea ice bonding            therefore experience strong mélange buttressing. In contrast,
the icebergs together (Robel, 2017) and possibly also iceberg          Thwaites Glacier is more than 70 km wide, and its ice shelf
size distribution. The continuum rheology model (Amundson              spreads into the open ocean. It has currently no embayment
and Burton, 2018) adapted here agrees with discrete models             at all, and once it retreats, it lies in a wide basin that can pro-
(Burton et al., 2018; Robel, 2017) that mélange buttressing            vide little mélange buttressing. Hence, Thwaites Glacier has

The Cryosphere, 15, 531–545, 2021                                                            https://doi.org/10.5194/tc-15-531-2021
T. Schlemm and A. Levermann: Mélange buttressing 541 a much larger potential for large calving rates and runaway The mélange buttressing model proposed here does not de- ice retreat (MICI) than Pine Island Glacier. pend on the specific calving mechanism, and it is not com- Ocean temperatures off the coast of Antarctica are mostly prehensive, especially since it is not derived from first prin- sub-zero, with 0.5–0.6 ◦ C warming expected by 2100, while ciples but from a macroscopic perspective. The advantage of the ocean temperatures off the coast of Greenland are sub- the equation proposed here is the very limited number of pa- zero in the north but up to 4 ◦ C in the south, with an ex- rameters. pected 1.7–2.0 ◦ C warming by 2200 (Yin et al., 2011). This leads to increased mélange melting in Greenland compared to Antarctica and therefore higher upper limits on calving rates in Greenland glaciers that have geometries comparable to Antarctic glaciers. Future ocean warming and intrusion of warm ocean water under the ice mélange increase melting rates and the upper limit on calving rates. This could be an- other mechanism by which ocean warming increases calving rates. The concept of cliff calving and a cliff calving instabil- ity is not without criticism. According to Clerc et al. (2019), the lower part of the glacier terminus, where shear failure is assumed to occur (Bassis and Walker, 2011; Schlemm and Levermann, 2019), is actually in a regime of thermal soften- ing with a much higher critical stress and thus remains sta- ble for large ice thicknesses. Tensile failure may occur in the shallow upper part of the cliff and initiate failure in the lower part of the cliff (Parizek et al., 2019). The critical subaerial cliff height at which failure occurs depends on the timescale of the ice shelf collapse: for collapse times longer than 1 d, the critical cliff height lies between 170–700 m (Clerc et al., 2019). https://doi.org/10.5194/tc-15-531-2021 The Cryosphere, 15, 531–545, 2021
542 T. Schlemm and A. Levermann: Mélange buttressing
Appendix A: Mélange thickness gradient
In Sect. 2, the mélange thickness was assumed to thin linearly
along the embayment length with dcf = βdex . Amundson and
Burton (2018) give an implicit exponential relation for the
mélange thickness:
Lem dcf − dex
dcf = dex exp µ0 + , (A1)
W 2dcf
where µ0 is the coefficient of internal friction of the mélange
and ranges from about 0.1 to larger than 1. The embayment
width, W , is assumed to be constant along the embayment in
Amundson and Burton (2018); here we can replace it with Figure A1. The relative difference between β given by Eq. (A3)
the average embayment width. In a linear approximation, and different linear approximations of β.
Eq. (A1) becomes
Lem dcf − dex Appendix B
dcf = dex 1 + µ0 + . (A2)
W 2dcf
Overview of the variables used in Sect. 2. The embayment
This equation has one physical solution for dcf : and mélange geometry is illustrated in Fig. 2.
1 H ice thickness
dcf = dex ·
4
s C∗, C unbuttressed and buttressed calving rates
L L
L
2 γ fraction of the ice thickness
3 + 2µ0 em + 1 + 12µ0 em + 4 µ0 em dcf mélange thickness at the calving front
W W W
dex mélange thickness at the embayment exit
≈ βdex . (A3) d average mélange thickness
V mélange volume
The parameter β can be linearized to take the form given in Wcf embayment width at the calving front
Eq. (4), where the parameters b0 and b1 are determined by Wex embayment width at the embayment exit
the way of obtaining the linear approximation: completing W average embayment width
the square under the square root gives the asymptotic up- Lem embayment (mélange) length
per limit with b0 = 1.5, b1 = 1.0. Taylor expansion can be Aem embayment (mélange) area
used to get a more accurate approximation around a specific ucf ice flow velocity at the calving front
value of µ0 L/W : expansion around µ0 L/W = 0.5 gives uex mélange exit velocity
b0 = 1.11, b1 = 1.21, while expansion around µ0 L/W = 1.0 m average mélange melt rate
gives b0 = 1.17, b1 = 1.11. The choice of linearization pa- β mélange thinning gradient
rameters b0 and b1 should depend on the expected range of µ0 mélange internal friction
values for µ0 L/W . Figure A1 shows that each of the linear dm mélange thickness lost due to melting
approximations given in the text overestimates β slightly but a mélange buttressing parameter
that it is possible to achieve a small error (T. Schlemm and A. Levermann: Mélange buttressing 543
Code and data availability. Data and code are available from the nikrishnan, A. S.: Sea-Level Rise by 2100, Science, 342, 1445,
authors upon request. https://doi.org/10.1126/science.342.6165.1445-a, 2013.
Clerc, F., Minchew, B. M., and Behn, M. D.: Marine Ice Cliff Insta-
bility Mitigated by Slow Removal of Ice Shelves, Geophys. Res.
Author contributions. Both authors conceived the study and anal- Lett., 46, 12108–12116, https://doi.org/10.1029/2019GL084183,
ysed the data. TS developed the basic equations, carried out the ex- 2019.
periments, and wrote the manuscript. AL contributed to the writing Cornford, S. L., Seroussi, H., Asay-Davis, X. S., Gudmundsson,
of the manuscript. G. H., Arthern, R., Borstad, C., Christmann, J., Dias dos San-
tos, T., Feldmann, J., Goldberg, D., Hoffman, M. J., Humbert,
A., Kleiner, T., Leguy, G., Lipscomb, W. H., Merino, N., Du-
Competing interests. The authors declare that they have no conflict rand, G., Morlighem, M., Pollard, D., Rückamp, M., Williams,
of interest. C. R., and Yu, H.: Results of the third Marine Ice Sheet Model
Intercomparison Project (MISMIP+), The Cryosphere, 14, 2283–
2301, https://doi.org/10.5194/tc-14-2283-2020, 2020.
DeConto, R. M. and Pollard, D.: Contribution of Antarctica
Financial support. Tanja Schlemm was funded by a doctoral
to past and future sea-level rise, Nature, 531, 591–597,
scholarship of the Heinrich Böll foundation.
https://doi.org/10.1038/nature17145, 2016.
Depoorter, M. A., Bamber, J. L., Griggs, J. A., Lenaerts, J. T. M.,
The publication of this article was funded by the
Ligtenberg, S. R. M., van den Broeke, M. R., and Moholdt, G.:
Open Access Fund of the Leibniz Association.
Calving fluxes and basal melt rates of Antarctic ice shelves, Na-
ture, 502, 89–92, https://doi.org/10.1038/nature12567, 2013.
Edwards, T. L., Brandon, M. A., Durand, G., Edwards, N. R.,
Review statement. This paper was edited by Kerim Nisancioglu and Golledge, N. R., Holden, P. B., Nias, I. J., Payne, A. J.,
reviewed by Douglas Benn and two anonymous referees. Ritz, C., and Wernecke, A.: Revisiting Antarctic ice loss
due to marine ice-cliff instability, Nature, 566, 58–64,
https://doi.org/10.1038/s41586-019-0901-4, 2019.
Enderlin, E. M., Howat, I. M., Jeong, S., Noh, M.-J., Ange-
References len, J. H., and Broeke, M. R.: An improved mass budget for
the Greenland ice sheet, Geophys. Res. Lett., 41, 866–872,
Amundson, J. M. and Burton, J. C.: Quasi-Static Granular Flow https://doi.org/10.1002/2013GL059010, 2014.
of Ice Mélange, J. Geophys. Res.-Earth, 123, 2243–2257, Favier, L., Durand, G., Cornford, S. L., Gudmundsson, G. H.,
https://doi.org/10.1029/2018JF004685, 2018. Gagliardini, O., Gillet-Chaulet, F., Zwinger, T., Payne, A. J.,
Amundson, J. M., Fahnestock, M., Truffer, M., Brown, J., Lüthi, and Le Brocq, A. M.: Retreat of Pine Island Glacier controlled
M. P., and Motyka, R. J.: Ice mélange dynamics and implications by marine ice-sheet instability, Nat. Clim. Change, 4, 117–121,
for terminus stability, Jakobshavn Isbræ, Greenland, J. Geophys. https://doi.org/10.1038/nclimate2094, 2014.
Res.-Earth, 115, F01005, https://doi.org/10.1029/2009JF001405, Franco, B., Fettweis, X., and Erpicum, M.: Future projections of the
2010. Greenland ice sheet energy balance driving the surface melt, The
Bassis, J. N. and Walker, C. C.: Upper and lower limits on Cryosphere, 7, 1–18, https://doi.org/10.5194/tc-7-1-2013, 2013.
the stability of calving glaciers from the yield strength en- Fretwell, P., Pritchard, H. D., Vaughan, D. G., Bamber, J. L., Bar-
velope of ice, P. Roy. Soc. Lond. A. Mat., 468, 913–931, rand, N. E., Bell, R., Bianchi, C., Bingham, R. G., Blanken-
https://doi.org/10.1098/rspa.2011.0422, 2011. ship, D. D., Casassa, G., Catania, G., Callens, D., Conway, H.,
Bassis, J. N., Petersen, S. V., and Mac Cathles, L.: Hein- Cook, A. J., Corr, H. F. J., Damaske, D., Damm, V., Ferracci-
rich events triggered by ocean forcing and modu- oli, F., Forsberg, R., Fujita, S., Gim, Y., Gogineni, P., Griggs,
lated by isostatic adjustment, Nature, 542, 332–334, J. A., Hindmarsh, R. C. A., Holmlund, P., Holt, J. W., Jacobel,
https://doi.org/10.1038/nature21069, 2017. R. W., Jenkins, A., Jokat, W., Jordan, T., King, E. C., Kohler,
Benn, D. I., Hulton, N. R., and Mottram, R. H.: J., Krabill, W., Riger-Kusk, M., Langley, K. A., Leitchenkov,
“Calving laws”, “sliding laws” and the stability G., Leuschen, C., Luyendyk, B. P., Matsuoka, K., Mouginot,
of tidewater glaciers, Ann. Glaciol., 46, 123–130, J., Nitsche, F. O., Nogi, Y., Nost, O. A., Popov, S. V., Rignot,
https://doi.org/10.3189/172756407782871161, 2007. E., Rippin, D. M., Rivera, A., Roberts, J., Ross, N., Siegert,
Bueler, E. and Brown, J.: Shallow shelf approximation M. J., Smith, A. M., Steinhage, D., Studinger, M., Sun, B.,
as a “sliding law” in a thermomechanically coupled Tinto, B. K., Welch, B. C., Wilson, D., Young, D. A., Xiangbin,
ice sheet model, J. Geophys. Res.-Earth, 114, F03008, C., and Zirizzotti, A.: Bedmap2: improved ice bed, surface and
https://doi.org/10.1029/2008JF001179, 2009. thickness datasets for Antarctica, The Cryosphere, 7, 375–393,
Burton, J. C., Amundson, J. M., Cassotto, R., Kuo, C.-C., and Den- https://doi.org/10.5194/tc-7-375-2013, 2013.
nin, M.: Quantifying flow and stress in ice mélange, the world’s Golledge, N. R., Kowalewski, D. E., Naish, T. R., Levy, R. H., Fog-
largest granular material, P. Natl. Acad. Sci. USA, 115, 5105– will, C. J., and Gasson, E. G. W.: The multi-millennial Antarc-
5110, https://doi.org/10.1073/pnas.1715136115, 2018. tic commitment to future sea-level rise, Nature, 526, 421–425,
Church, J. A., Clark, P. U., Cazenave, A., Gregory, J. M., Jevrejeva, https://doi.org/10.1038/nature15706, 2015.
S., Levermann, A., Merrifield, M. A., Milne, G. A., Nerem, R. S.,
Nunn, P. D., Payne, A. J., Pfeffer, W. T., Stammer, D., and Un-
https://doi.org/10.5194/tc-15-531-2021 The Cryosphere, 15, 531–545, 2021544 T. Schlemm and A. Levermann: Mélange buttressing Golledge, N. R., Keller, E. D., Gomez, N., Naughten, K. A., Advances, 5, eaau3433, https://doi.org/10.1126/sciadv.aau3433, Bernales, J., Trusel, L. D., and Edwards, T. L.: Global envi- 2019. ronmental consequences of twenty-first-century ice-sheet melt, Morlighem, M., Bondzio, J., Seroussi, H., Rignot, E., Larour, Nature, 566, 65–72, https://doi.org/10.1038/s41586-019-0889-9, E., Humbert, A., and Rebuffi, S.: Modeling of Store 2019. Gletscher’s calving dynamics, West Greenland, in response to Hutter, K.: Theoretical Glaciology, D. Reidel Publish- ocean thermal forcing, Geophys. Res. Lett., 43, 2659–2666, ing Company/Terra Scientific Publishing Company, https://doi.org/10.1002/2016GL067695, 2016. https://doi.org/10.1007/978-94-015-1167-4, 1983. Mouginot, J., Rignot, E., Bjørk, A. A., van den Broeke, M., Mil- Jeong, S., Howat, I. M., and Bassis, J. N.: Accelerated lan, R., Morlighem, M., Noël, B., Scheuchl, B., and Wood, ice shelf rifting and retreat at Pine Island Glacier, M.: Forty-six years of Greenland Ice Sheet mass balance from West Antarctica, Geophys. Res. Lett., 43, 11720–11725, 1972 to 2018, P. Natl. Acad. Sci. USA, 116, 9239–9244, https://doi.org/10.1002/2016GL071360, 2016. https://doi.org/10.1073/pnas.1904242116, 2019. Khazendar, A., Rignot, E., and Larour, E.: Roles of marine Nick, F., van der Veen, C., Vieli, A., and Benn, D.: A physically ice, rheology, and fracture in the flow and stability of the based calving model applied to marine outlet glaciers and im- Brunt/Stancomb-Wills Ice Shelf, J. Geophys. Res.-Earth, 114, plications for the glacier dynamics, J. Glaciol., 56, 781–794, F04007, https://doi.org/10.1029/2008JF001124, 2009. https://doi.org/10.3189/002214310794457344, 2010. Kopp, R. E., DeConto, R. M., Bader, D. A., Hay, C. C., Horton, Parizek, B. R., Christianson, K., Alley, R. B., Voytenko, D., R. M., Kulp, S., Oppenheimer, M., Pollard, D., and Strauss, Vaňková, I., Dixon, T. H., Walker, R. T., and Holland, D. M.: B. H.: Evolving Understanding of Antarctic Ice-Sheet Physics Ice-cliff failure via retrogressive slumping, Geology, 47, 449– and Ambiguity in Probabilistic Sea-Level Projections, Earth’s 452, https://doi.org/10.1130/G45880.1, 2019. Future, 5, 1217–1233, https://doi.org/10.1002/2017EF000663, PISM: PISM, a Parallel Ice Sheet Model, available at: https:// 2017. pism-docs.org (last access: 13 June 2020), 2018. Krug, J., Durand, G., Gagliardini, O., and Weiss, J.: Mod- Pollard, D., DeConto, R. M., and Alley, R. B.: Potential elling the impact of submarine frontal melting and ice Antarctic Ice Sheet retreat driven by hydrofracturing and mélange on glacier dynamics, The Cryosphere, 9, 989–1003, ice cliff failure, Earth. Planet. Sc. Lett., 412, 112–121, https://doi.org/10.5194/tc-9-989-2015, 2015. https://doi.org/10.1016/j.epsl.2014.12.035, 2015. Levermann, A. and Winkelmann, R.: A simple equation for the Rignot, E. and MacAyeal, D. R.: Ice-shelf dynamics near melt elevation feedback of ice sheets, The Cryosphere, 10, 1799– the front of the Filchner-Ronne Ice Shelf, Antarctica, re- 1807, https://doi.org/10.5194/tc-10-1799-2016, 2016. vealed by SAR interferometry, J. Glaciol., 44, 405–418, Levermann, A., Albrecht, T., Winkelmann, R., Martin, M. A., https://doi.org/10.3189/S0022143000002732, 1998. Haseloff, M., and Joughin, I.: Kinematic first-order calving law Rignot, E. and Kanagaratnam, P.: Changes in the Velocity Struc- implies potential for abrupt ice-shelf retreat, The Cryosphere, 6, ture of the Greenland Ice Sheet, Science, 311, 986–990, 273–286, https://doi.org/10.5194/tc-6-273-2012, 2012. https://doi.org/10.1126/science.1121381, 2006. Levermann, A., Winkelmann, R., Albrecht, T., Goelzer, H., Rignot, E., Mouginot, J., Morlighem, M., Seroussi, H., and Golledge, N. R., Greve, R., Huybrechts, P., Jordan, J., Leguy, G., Scheuchl, B.: Widespread, rapid grounding line retreat of Pine Martin, D., Morlighem, M., Pattyn, F., Pollard, D., Quiquet, A., Island, Thwaites, Smith and Kohler glaciers, West Antarc- Rodehacke, C., Seroussi, H., Sutter, J., Zhang, T., Van Breedam, tica, from 1992 to 2011, Geophys. Res. Lett., 41, 3502–3509, J., Calov, R., DeConto, R., Dumas, C., Garbe, J., Gudmunds- https://doi.org/10.1002/2014GL060140, 2014. son, G. H., Hoffman, M. J., Humbert, A., Kleiner, T., Lipscomb, Rignot, E. Mouginot, J., Scheuchl, B., van den Broeke, W. H., Meinshausen, M., Ng, E., Nowicki, S. M. J., Perego, M., M., van Wessem, M. J., and Morlighem, M.: Four Price, S. F., Saito, F., Schlegel, N.-J., Sun, S., and van de Wal, decades of Antarctic Ice Sheet mass balance from R. S. W.: Projecting Antarctica’s contribution to future sea level 1979–2017, P. Natl. Acad. Sci. USA, 116, 1095–1103, rise from basal ice shelf melt using linear response functions of https://doi.org/10.1073/pnas.1812883116, 2019. 16 ice sheet models (LARMIP-2), Earth Syst. Dynam., 11, 35– Ritz, C., Edwards, T. L., Durand, G., Payne, A. J., Peyaud, V., and 76, https://doi.org/10.5194/esd-11-35-2020, 2020. Hindmarsh, R. C. A.: Potential sea-level rise from Antarctic ice- Mengel, M., Feldmann, J., and Levermann, A.: Linear sheet instability constrained by observations, Nature, 528, 115– sea-level response to abrupt ocean warming of major 118, https://doi.org/10.1038/nature16147, 2015. West Antarctic ice basin, Nat. Clim. Change, 6, 71–74, Robel, A. A.: Thinning sea ice weakens buttressing force of ice- https://doi.org/10.1038/nclimate2808, 2016. berg mélange and promotes calving, Nat. Commun., 8, 14596, Mercenier, R., Lüthi, M. P., and Vieli, A.: Calving relation https://doi.org/10.1038/ncomms14596, 2017. for tidewater glaciers based on detailed stress field analy- Schlemm, T. and Levermann, A.: A simple stress-based sis, The Cryosphere, 12, 721–739, https://doi.org/10.5194/tc-12- cliff-calving law, The Cryosphere, 13, 2475–2488, 721-2018, 2018. https://doi.org/10.5194/tc-13-2475-2019, 2019. Mercer, J. H.: West Antarctic ice sheet and CO2 green- Schoof, C.: Ice sheet grounding line dynamics: Steady states, sta- house effect: a threat of disaster, Nature, 271, 321–325, bility, and hysteresis, J. Geophys. Res.-Earth, 112, F03S28, https://doi.org/10.1038/271321a0, 1978. https://doi.org/10.1029/2006JF000664, 2007. Milillo, P., Rignot, E., Rizzoli, P., Scheuchl, B., Mouginot, J., Shepherd, A., Wingham, D., and Rignot, E.: Warm ocean is erod- Bueso-Bello, J., and Prats-Iraola, P.: Heterogeneous retreat ing West Antarctic Ice Sheet, Geophys. Res. Lett., 31, L23402, and ice melt of Thwaites Glacier, West Antarctica, Science https://doi.org/10.1029/2004GL021106, 2004. The Cryosphere, 15, 531–545, 2021 https://doi.org/10.5194/tc-15-531-2021
You can also read


