CEP Discussion Paper No 1530 February 2018 Teacher Turnover: Does it Matter for Pupil Achievement? Stephen Gibbons Vincenzo Scrutinio Shqiponja Telhaj
←
→
Page content transcription
If your browser does not render page correctly, please read the page content below
ISSN 2042-2695

   CEP Discussion Paper No 1530
           February 2018

         Teacher Turnover:
Does it Matter for Pupil Achievement?

          Stephen Gibbons
         Vincenzo Scrutinio
          Shqiponja Telhaj
Abstract
Recent research has established that teachers matter for student achievements, albeit because of dimensions
of ‘teacher quality’ that are largely unexplained. A less closely investigated issue is whether teacher
turnover directly harms student academic achievement. In this paper, we examine whether teacher turnover
affects academic achievement of 16 year old state secondary school students using a unique data set of
linked students and teachers in England. Identification comes from either: a school fixed effects design
which exploits year-on-year variation in turnover in different subject groups, within schools; or student
fixed effect design that where the variation comes from the cross sectional variation in turnover in different
subjects, in the same school, experienced by a student. Both methods give similar results, suggesting that a
higher teacher entry rate reduces students’ test scores, albeit by small amounts.
Key words: teachers, turnover, student attainment, schools
JEL: H4; I2; J24
This paper was produced as part of the Centre’s Education and Skills Programme. The Centre for
Economic Performance is financed by the Economic and Social Research Council.
We would like to thank seminar participants at the Centre for Economic Performance, London School of
Economics; Universities of Bristol; Padua; Maastricht; Educational Governance workshop, Oslo; Richard
Blundell, Simon Burgess, Jonah Rockoff, Sarah Smith, and many others for comments on an earlier
version of this paper.
Stephen Gibbons, London School of Economics and Centre for Economic Performance, London
School of Economics. Vincenzo Scrutinio, Centre for Economic Performance, London School of
Economics. Shqiponja Telhaj, University of Sussex and Centre for Economic Performance, London School
of Economics.
Published by
Centre for Economic Performance
London School of Economics and Political Science
Houghton Street
London WC2A 2AE
All rights reserved. No part of this publication may be reproduced, stored in a retrieval system or
transmitted in any form or by any means without the prior permission in writing of the publisher nor be
issued to the public or circulated in any form other than that in which it is published.
Requests for permission to reproduce any article or part of the Working Paper should be sent to the editor
at the above address.
S. Gibbons, V. Scrutinio and S. Telhaj, submitted 2018.1. Introduction
Recent research has established that teachers matter for student achievements, albeit because of
dimensions of ‘teacher quality’ that are largely unexplained. On the basis of this evidence, recent
policy in the US has, sometimes controversially, moved towards hiring and firing teachers on the
basis of measurable impacts on student test scores (see for example, Thomsen 2014, and discussion
in Hanushek 2009, Adnott et al 2016, Rothstein 2015). These kinds of hiring/firing policies, self-
evidently, have limited aggregate implications if the supply of teachers is constrained (Rothstein,
2015). However, turnover has potential benefits, on aggregate, because it is the mechanism by
which: teachers gain a variety of experience; new ideas are brought into schools; and productive
teacher-school matches are formed. On the other hand, there are also potential costs for individual
students, schools, and, on aggregate, from the disruptive effects of turnover. New arrivals take
time to assimilate, leavers take school-specific knowledge and experience with them, and different
teachers have different teaching styles causing a lack of continuity. These disruptive effects from
teacher turnover could potentially offset any of its advantages (Ronfeldt at al 2013), but have
received relatively little empirical attention, despite their importance in the context of school policy
on hiring, firing and retention. In England, the US and elsewhere, despite a lack of much hard
evidence, there is a presumption that turnover has, on average, adverse impacts. Turnover of
teachers is also perennial concern for parents particularly when it occurs during the period when
students are studying for important exams. 1
Our paper adds to the rather limited existing international evidence on the causal impacts of
teacher turnover. We focus on the impact of teacher entry into school-subject-year specific groups
on student achievement in qualifications in those subjects, at the end of compulsory schooling. By
causal impacts, we mean the average gap in achievements between students experiencing a high
turnover of teachers and students experiencing a low turnover of teachers, in a hypothetical
1 A browse of the mumsnet.com website confirms this.
2experiment in which teachers, their entry probabilities, their exit probabilities and their students
are all randomly assigned. The analysis is based on a unique large administrative dataset of teacher
workforce records linked by school and subject categories to students’ achievement records in
England. The main research design identifies the effects of turnover on achievement from school-
subject-year specific turnover shocks in the final year before the end of school tests. Estimation is
implemented with high dimensional fixed effects regressions to control for school-by-year and
subject-by-year unobservable factor which might drive teacher turnover. We demonstrate that
through a range of placebo, balancing and robustness tests that we can treat turnover as random,
conditional on these fixed effects. Turnover is likely to have very different impacts depending on
the quality of teachers who are entering and leaving. Thus, we devote considerable attention to the
effects of different types of mover, as well as to identifying the average causal effect across all
types.
The only previous study directly comparable to ours is Ronfeldt et al (2013), which looks at
teacher turnover on 4th and 5th grade student performance in New York elementary schools. Their
study finds that teacher turnover reduces achievement in both Maths and English, particularly for
students in schools with a high proportion of low performing and black students. The fixed effects
estimation strategy is similar to ours, but exploits within-school variation in turnover between
grades and years. A potential problem with looking at grade-specific variation in turnover is that
students are themselves moving between grades, and will typically experience a change in teachers
regardless of levels of turnover. Therefore, any estimates of turnover based on this design will
omit effects due to disruption in the continuity of teaching experienced by students. Our study, in
contrast, looks at turnover in subject groups during a two year period where students are preparing
for their crucial end of school exams, and where disruption is often thought to be particularly
important. We are, therefore, more likely to capture these effects, alongside any effects related to
incoming teachers having no teaching experience specific to that school. We are also able to
improve on the research design by a student fixed effects specification that exploits variation in
3turnover in different subjects, which is infeasible when looking at differences across grades. Arnodt
et al. (2016) also study the effects of turnover on achievement, but are interested in the effects of
exits in context of a policy environment in which encouraged exits of low performing teachers
(the IMPACT programme). They find, unsurprisingly, that exits of underperforming teachers raise
student achievement, but their study is silent on the impact of disruption caused in new entrants.
Similar findings appear in Chetty et al. (2014) who document too that: entry of good teachers raises
achievement; entry of bad teachers lowers achievement; exit of good teachers lowers achievement;
and exit of bad teachers raised achievement (where quality is based on teachers’ previous history
of generating high test scores).
Our research contributes to a broader literature on teacher turnover, most of which looks into
the factors that cause teachers to enter and leave schools and investigating the consequences of
sorting for the composition of the teaching workforce (e.g. Ingersoll 2001; Dolton and Newson
2003; Allen, Burgess and Mayo 2012). The typical finding is that schools serving disadvantaged
young people have higher turnover than other schools. From amongst this literature, Hanushek
and Rivkin (2011) argue that turnover is potentially beneficial, because bad teachers leave and good
teachers tend to stay in their sample of schools in Texas, though the aggregate implications are not
very clear if teachers are just moving to and from schools elsewhere. They also focus only on the
effects attributable to changes in composition, rather than any disruptive impacts.
Our key finding is that students experiencing high teacher turnover do less well in their end of
school exams. The effects are quite small, though non-negligible relative to other factors that have
been found to affect student achievement. A 10 percentage point increase in teacher annual entry
rates (relative to a mean of 14% percent, and around 60% of one standard deviation) reduces
student point scores (a kind of GPA) by just under 0.5% of one standard deviation. This is a
standardised effect size of 0.8 standard deviations. Interestingly, this effect is of a comparable
order of magnitude to the external effects of turnover on other dimensions of the educational
system that have been investigated – similar to the externalities from the turnover of students in
4schools (Gibbons and Telhaj, 2011; Hanushek, Kain and Rivkin 2004) and slightly larger than the
effects of turnover of students in neighbourhoods (Gibbons, Silva and Weinhardt 2015). Evidently,
teachers entering and leaving matters, but is no more disruptive to education than turnover
amongst a student’s peers. We provide a number of tests to demonstrate that our results appear
to be causal, showing that conditional on our fixed effects design, teacher turnover is uncorrelated
with student demographics (‘balancing’), that we do not observe effects on groups of students who
we would not expect to be affected (‘placebo’) and that observed impacts relate quite precisely to
achievement in the years in which we observe the turnover (‘event study’). In this way we go come
way beyond the previous literature on this topic.
The rest of the paper is structured as follows: Our empirical strategy is discussed in Section 2.
Section 3 describes the education institutional setting in the UK and the data set. Section 4 presents
our main regression results, with Section 5 investigating the robustness of the analysis and Section
6 taking a more nuanced look at the variation in the effects across different types of teacher,
student and subject. Section 7 provides concluding remarks.
2. Empirical Strategy
Our aim is to estimate the average causal impact that turnover of teachers in schools has on the
academic achievement of their students. Conceptually, the idea is to understand the impact of
randomly increasing the rate at which teachers enter and/or leave a school, holding other
characteristics of the workforce, school and student body constant.
There are several basic empirical issues. Firstly, there are various ways to define and measure
turnover. In line with previous work on student and teacher mobility (Hanushek and Rivkin 2004,
Gibbons and Telhaj 2011, Ronfeldt at al 2013) we focus the entry rate in a given year to represent
turnover. The reasons for focussing on entry are elaborated at the end of this section. However,
we also consider exit rates. Secondly, there are obvious potential endogeneity problems. Entry
rates (and other measures of turnover) will be, in part, determined by the characteristics of the
5school, its students and the characteristics of stock of teachers, since these factors will affect the
exit rate (and hence the number of vacancies) and how attractive a school is to potential applicants.
Moreover, sorting implies that teachers entering a school, the teachers in the stock and the teachers
leaving are not likely to be identical, so entry and exit rates can change the composition of the
school workforce. All of these factors may have direct effects on achievement and are only partially
observed.
To address these endogeneity issues, we implement a fixed effects design that identifies
turnover effects from variation in teacher entry rates in different teaching subject categories in the
same school. Student test outcomes in the final year of compulsory schooling (Year 11, age 16) are
linked to teachers by school, subject category and year and we construct teacher entry rate variables
at school-by-subject-by-year level. The details of our institutional setting and data construction are
set out in the next section.
In one version of this design, identification comes from year-to-year changes in entry rates
within school-subject categories, conditional on school-by-year and subject-by-year fixed effects.
The specification in this case is:
=
qualsisqt β mobsqt + xi′γ + zsqt
′ λ + aqt + bst + cqs + ε isqt (1)
Where qualsisqt is an index of individual achievement in age-16 qualifications (in school s, subject
q and year t), and mobsqt is the entry rate (or other turnover measure) in each school-subject-year
group. Coefficient β, the coefficient of interest, is the expected change in student test scores
associated with an exogenous increase in turnover in the year in which a student takes their age-
16 exams (we consider the relevance of lagged entry rates in the empirical analysis in Section Error!
Reference source not found.). The vector of optional student-specific control variables, xi,
includes: prior age-11 primary school test scores; Free School Meal (FSM) eligibility; gender; and
ethnicity (white/others). Unobservable factors aqt, bst, cqs, are treated as fixed effects and partialled
6out during estimation. 2 The optional vector of control variables at school-subject-year or school-
year level, zsqt, includes at school-subject-year level: the pupil-teacher ratio; proportion of female
students; proportion FSM eligible students; proportion of white British students; number of
teachers in current and past academic year; average age and experience of teachers; share of female
teachers and average log annual salary for teachers. This rich set of control variables allows us to
net out time-varying confounders correlated with turnover and to test for the relevance of the
effects of turnover-related sorting on the composition of the workforce.
In an extension to this design we control for student fixed effects, and subject-by-year fixed
effects so identification comes purely from variation in entry rates across subjects experienced by
a student in a given school and year.
=
qualsisqt
′ λ + aqt + di + ε isqt
β mobsqt + zsqt (2)
In other words, we examine whether students who face higher teacher mobility in, say,
mathematics than in English have lower academic performance in subject mathematics than in
English. This between-subject, within-student design has featured in several previous papers, Dee
(2005), Clotfelter et al. (2010), Slater et al. (2010) Altinok and Kingdon (2012), Lavy et al. (2012),
Nicoletti and Rabe (2017). The key difference between the strategies in (1) and (2) is that the latter
eliminates any time series variation within school-subject groups, and identification is based purely
on cross sectional variation across subjects within students (and schools) in a given year.
The identifying assumption underlying these strategies is that teacher entry into a school-
subject-year group is determined by the choices of teachers outside the school with only limited
information about the characteristics of the students, the other staff and the school environment
in general. This is especially true because teachers almost always join at the beginning of the school
2 We use within-groups estimation, or the numerical procedure of Correia (2017) as implemented in the command
reghdfe in Stata (Sergio Correia, 2017. reghdfe: Stata module for linear and instrumental-variable/gmm regression
absorbing multiple levels of fixed effects. Statistical Software Components s457874, Boston College Department of
Economics.)
7year when they would have no information about the future KS4 performance of the student-
subject group they are joining. Teachers’ decisions about entry are, therefore, largely dependent
on persistent or time-varying school level and subject level factors. School-subject-year specific
entry rates can therefore be rendered plausibly exogenous by appropriate conditioning on fixed
effects and observable school characteristics. We assess the credibility of this identifying
assumption by showing that these subject-school-year specific shocks to turnover rates are largely
uncorrelated with observable school, teacher and student characteristics, and by various ‘placebo’
tests.
The above considerations make it clear why entry rates are preferred to exit rates as measures
of turnover. End of year exit rates from a school-subject-year group are determined by the choices
of teachers inside the school, with perfect information about the school, the department they are
working in and the cohort of students they have been teaching. It is, therefore, implausible a priori
that end of year exit rates are unrelated to the unobserved (to us) characteristics of the students in
that group in that year, to the student-teacher match quality and, hence, to student attainment in
that year. Exit rates act as a signal of shocks that are unobserved to us but observed by the
incumbent teaching staff. Using lagged exit rates does not help, because if exit rates are
endogenous in year t, they are also endogenous in year t-1 in a short panel with group fixed effects.
An exception to this is the special case where exit is forced by retirement, when it could be plausibly
unrelated to unobserved school-subject-year group characteristics. This line of reasoning suggests
that pension age rules provide potential instruments for exit rates – and hence for entry rates, since
retirees need to be replaced. We use of retirement age as an instrument for entry and exit rates in
some robustness tests, while noting that this informs us about the effects of a rather specific driver
of entry rates, rather than turnover in general.
It is also worth noting at the outset that there is one identification issue which we cannot
address when focussing on entry rates: an increase in the entry rate is equivalent to an increase in
the share of teachers with zero years of school tenure, so necessarily implies a reduction in average
8teacher tenure. The effects of entry and the reduction in average tenure it induces are, therefore,
conceptually equivalent and not separately identified.
3. Institutional Setting and Data
Our study focuses on secondary school students and teachers in state-maintained secondary
schools in England between 2008/09 and 2012/13. 3 Compulsory education in state schools 4 in
England is organised into five “Key Stages”. The Primary phase, from ages 4-11 spans the
Foundation Stage to Key Stage 2 (Years 1-6, where Years are the English terminology for Grades).
At the end of Key Stage 2, when pupils are aged 10/11, children leave the Primary phase and go
on to Secondary school from ages 11-16, where they progress through to Key Stage 3 (Years 7-9)
and to Key Stage 4 (Year 10-11). At the end of each Key Stage, prior to age-16, pupils are assessed
on the basis of standard national tests (though the Key Stage 3 tests stopped in 2008). Our study
is focuses on students in Year 11, which is their last year of compulsory schooling. During Key
Stage 4 (Years 10 and 11), students study for and take assessments in a range of subjects, leading
to their final qualifications at age 16. The most common qualification is the General Certificate of
Secondary Education (GCSE), and we focus on these GCSE educational outcomes of students by
subject. Assessment for GCSEs during our study period was generally carried out by a mixture of
coursework during Year 10 and Year 11 and final summer exams in Year 11, with greater weight
generally placed on the final exams. However, the structure of assessment varied between subjects,
with some subjects such as Art being assessed purely on coursework.
The data construction for the analysis is quite complex and requires data on student
performance and on teachers’ career histories. Our main sources are student-level data from the
3 We base our analysis on 2008/09-2012/13 period because during this period teachers are precisely assigned to
subjects they teach. However, results using earlier periods, where assignment of teachers to subjects is based solely on
their qualification, are very similar.
4 State schools in England account for around 93 percent of the population of students.
9Department for Education’s National Pupil Database (NPD) and teacher records from the
Schools Workforce Census (SWC), supplemented with the Database of Teacher Records (DTR).
The NPD data contains information on students’ socioeconomic characteristics and
attainment scores in the Key Stage tests, and Key Stage 4 qualifications. These data come from
school returns made in January each year. Student point scores (a form of GPA) at Key Stage 4 –
our main outcome measure – are taken from the NPD, along with scores for the Key Stage 2
primary school exam as a measure of prior achievement. The national pupil database also reports
information on other student characteristics such as age, sex, Free School Meal eligibility (FSM)
and ethnicity.
The School Workforce Census has run from 2010/11, and is also based on returns from
schools, providing information on teachers, their qualifications, salaries, contract type, number of
hours, subjects they teach and other characteristics. We use SWC data up to 2012/13 and
supplement it with information from the DTR for to extend the data back to 2008/9. The DTR
is used in the administration of the national teachers’ pension system and also provides a range of
information on teachers, their salaries and their qualifications. 5
Schools are identified as individual entities that are consistent over time from the “Edubase”
dataset, which holds information on basic school characteristics like school phase, type, location
in each year. Starting from the universe of secondary schools in UK, we exclude Independent
(private) and Special Schools (for children with special needs). We construct unique school
identifiers with information available on the Edubase database concerning school conversions.
Schools formed from the merger of two or more schools, or schools resulting from the division
of a school are treated as new schools.
Our data does not permit us to know exactly which teachers teach each student. However, we
are able to link students to teachers by the subjects the student takes in a school at Key Stage 4
5
Our data stops in 2012/13 because after that point there were significant reforms to the GCSE qualifications and
their assessment format, which makes comparisons with earlier years potentially problematic.
10(Years 10/11) and the subjects a teacher in that school is teaching. The SWC data provides
information on the hours a teacher teaches in each subject. In the DTR, this information is
unavailable, but we infer their main subject from the teachers’ degree qualification. We form 18
subject groups: Mathematics; English; Science; history; Modern Foreign Languages; sports;
Biology; Chemistry; Physics; Art; IT; Social Science; Design; Business and Economics; Home
Economics; Media; Humanities and Engineering. These are aggregated from the 114 original
subject codes, in such a way that makes it feasible to assign mean teacher characteristics in these
subject groups to students, based on which teachers the students are likely to encounter given the
subjects they are studying. A full list of the Teacher subjects and their grouping is reported in the
appendix in Table A1. These subject groups are, in effect, approximately equivalent to school
teaching departments. Note that this aggregation does not imply we are introducing measurement
error in terms of the entry rates and other measures of mobility: we are over-aggregating our
explanatory variable, not introducing noise. It does imply an issue with standard errors, so we
cluster standard errors at school level. We also estimated regressions where we aggregate all the
data to form a school-subject-year group panel but the findings are broadly similar to those
reported in the empirical section below and we do not report them.
As discussed in Section 2, we use teacher entry rates as the main measure of turnover, but we
also look at exit rates. Entry and exit rates are constructed on school-by-subject-by-year groups,
and also broken down by teacher characteristics (e.g. gender and salary quintiles). We also
determine whether a teacher is moving from one school to another, or appears as a new entrant
into the system, or whether they are leaving the system (based on whether we observed them in
previous or subsequent years). 6
6
To simplify our methodology and decrease the effect of possible misreporting, we do not consider exit from the
profession if the teacher is not observed in the data for a few years but eventually is reported again. This concerns
5.6% of the total number of teachers.
11The entry rate in a school-subject-year group is computed as the share of teachers present in
the school-subject group during the current academic year (t) who were not present in that school-
subject group in the previous year (t-1). The exit rate for the current year (t) is the share of stock
teachers who were present in the previous year (t-1), but are no longer present in the school in the
current year. Data from the DTR/SWC for 2007/9 and 2013/14 is used to compute these
variables at the beginning and end of our 2008/9 to 2012/13 study period. Entry is necessarily
missing for the first year after the school opening. 7 A limitation of this approach to defining entry
is that it does not distinguish the year group (i.e. grade) in which teachers are teaching. In part of
our analysis we use a refined measure of teacher entry based on the share of total hours taught by
incoming teachers in Year 11, the year of students’ final qualification exams, and Year 10, the first
year of the Key Stage 4 curriculum phase. In this way we can say more about the importance of
timing of teacher entry relative to the timing of assessments, although missing data on subject
teaching hours reduces the estimation sample size.
Ultimately, we end up with data on teachers, their characteristics and the turnover variables
aggregated to school by subject group by year cells. These school-subject-year variables are
then merged with student-level data from the NPD. After cleaning and matching, the final sample
spans 5 years, has 18 subject groups, approximately 2,750 schools, 2,305,500 distinct students,
202,500 school-subject-year groups and a dataset with a total of around 13,500,000 student-subject
observations (the exact numbers in the regressions vary according to specification).
Descriptive statistics related to this sample are presented in Appendix A, Table A2. Annual
turnover of teachers is around 12% with entry rates (14%) slightly higher than exit rates (10%).
Around 40% of the entry is due to teachers new to the profession (or entering from outside the
English state school system), and the rest due to movement between schools.
7 We ignore the small proportion (4.5%) of teachers recorded as moving within school across departments.
124. Main regression results
To begin the empirical analysis of turnover on students’ KS4 (Year 11) attainment, Table 1 reports
the coefficients and standard errors from baseline regression estimates of equations (1) and (2),
with overall entry rates as the turnover variable. As we move left to right across the table, the
specifications control for fixed effects at finer levels of granularity, with Columns 1 and 2
controlling only for year dummies, and Columns 7 and 8 controlling for student fixed effects and
subject-group by year fixed effects. In order to test for and control for other possible confounding
factors, each fixed effect specification is reported with and without additional time-varying control
variables. Odd-numbered columns have no additional control variables; even-numbered columns
include a rich set of control variables for student characteristics, plus teacher and student
characteristics aggregated to school-subject-year group cells (see table notes for details). Standard
errors are clustered at school level. Note, teacher entry rates are defined on subject-school-year
cells so they represent a Year 11 student’s potential exposure to teacher mobility in a school
department as a whole in a given academic year, rather than actual exposure to mobility of teachers
specifically assigned to teaching in their year group. The coefficients are therefore best interpreted
as a type of ‘intent to treat’ effects, which avoid selection issues that could arise through strategic
assignment of new teachers into different year groups. In Section 5.1 we look at alternative
definitions of treatment that more closely capture students’ actual exposure to teacher entry.
In all specifications, higher entry rates are associated with lower KS4 scores. With no control
variables or fixed effects in Column 1, the coefficient of 0.057 implies that a 10 percentage-point
increase in entry (about 70% of a standard deviation) is associated with a 0.57% standard deviation
reduction KS4 scores. When we add in controls for observable student, teacher and school
attributes in Column 2, the coefficient becomes much more negative. It is the inclusion of variables
describing the existing teacher stock that leads to this change. However, when we more fully
control for unobserved confounders with fixed effects at school-by- year and subject-by- year level
in Column 3, the coefficient is reduced again to -0.053 and is now much less sensitive to the
13inclusion of control variables in Column 4. The magnitude remains relatively stable with the
inclusion of additional fixed effects. In Column 5 and 6 we control in addition for school-by-
subject fixed effects, implying identification is based purely on variation in entry rates over time
within these school-by-subject groups, conditional on time-varying factors affecting entry rates at
school level and at subject level. In Columns 7 and 8 we introduce student fixed effects. Here
identification comes from variation across subjects taken by each student. Note that school-by-
year fixed effects are not identified within pupil, so are omitted. The estimates from this
specification are broadly similar to those in Columns 3-6 and are again fairly insensitive to the
inclusion of time varying control variables. The insensitivity of the estimates to control variables
in the specifications that control for school-subject specific unobservables, time-varying school
and subject specific shocks, or student specific unobservables suggest that entry rate variation in
these specifications is effectively random. ‘Balancing’ regressions in which we regress the entry
rate on mean student characteristics in school-subject-year cells also demonstrate that the entry
rates are uncorrelated with these student characteristics (see Appendix Table A3). We go on to test
this assumption in greater detail in subsequent analysis. In the remainder of the empirical analysis,
we focus on the more conservative estimates based on year to year shocks in mobility in the
specification of Column 6.
Taken together, the estimates in Table 1 suggest that an increase in the entry rate of 10
percentage points reduces attainment by around 0.4-0.6 percent of one standard deviation, with
our preferred estimate at just under 0.5 percent of one standard deviation. This implies that a one
standard deviation increase in annual turnover (16.7 percentage points) during the two years of
preparation for end of school qualifications reduces attainment by around 0.8 percent of one
standard deviation. This is not a huge effect size, but is non-negligible compared to many school
interventions and similar to the effects sizes of other turnover-related externalities in schools. The
magnitude is close to that from the turnover of students in schools (Gibbons and Telhaj, 2011;
14Hanushek, Kain and Rivkin 2004) and slightly larger than the effects of turnover of students in
neighbourhoods (Gibbons, Silva and Weinhardt 2015).
5. Robustness checks
To assess the robustness of our results, we run a series of checks including placebo treatments,
controlling for additional confounding factors, checking the robustness of our definition of
exposure to teacher entry, and showing the timing of effects in an event study. Then, we move to
an instrumental variable strategy exploiting turnover generated by exogenous statutory retirement
age rules. In both settings, the negative effects of teacher turnover are supported by the evidence.
5.1 Confounding trends, shocks
The estimates of our effect of interest in Table 1 appeared robust to the inclusion of a wide range
of controls and fixed effects. However, as in any difference-in-difference style analysis, it is still
possible that some unobserved pre-existing trends or time varying contemporaneous (to entry)
shocks are driving our results. Table 2 first presents the results of a number of checks related to
these threats. .
Column 1 reports the coefficient for our preferred baseline specification with school-by-
subject, school-by-year, and subject-by-year fixed effects from Table 1, Column 6. Column 2
includes two years lead of the measure of entry (t+2): if entry reflects a general trend of the school,
then a higher turnover in the future might be associated with lower grades in the current year. The
inclusion of this measure of future entry, however, does not have any effect on students’
attainment in the current year and our main effect of interest is largely unaffected by the inclusion
of this measure of future turnover. Our estimates do not seem to reflect general trends in the
school-subject performance. A similar reasoning is applied in Column 3 where we include a
measure of turnover in other subject groups within the school in the same year, and where we
exclude other subjects taken by the student in order to avoid any possibilities of spillovers across
15subjects. Again in this case, the effect of entry is robust and the entry in other subject groups does
not have an independent effect on students’ scores. Column 4 includes lagged school-by-subject
KS4 achievement, as a proxy for unobservables that are correlated with past performance. Doing
so again makes little difference to the magnitude or statistical significance of the effect of teacher
entry. Column 5 further checks the robustness of the estimates by controlling for school-subject
group specific linear trends to partial out trends in mobility and performance in these groups. This
very demanding specification makes little difference to the estimates of the effects of entry rates.
5.2 Student exposure to teacher entry
As noted in Section 4, our main measure of teacher entry captures entry into school
departments as a whole, rather than into the year groups (10 and 11) specifically relevant for KS4
study. This is avoids endogeneity issues posed by strategic selection of teachers into ‘low-risk’ year
groups, but masks potentially informative patterns related to timing of entry. Column 6 of Table
2 uses instead a more refined measure of turnover (discussed in Section 3) in which we define
entry rates by the share of hours taught by incoming teachers in different years (Year 10 or Year
11). 8
We report three different entry effects based on this hours-based entry rate definition: the
effects of entry to Year 11 teaching on the current Year 11 cohort’s GCSE results; the effects of
entry to current Year 10 teaching on the current Year 11 cohort’s GCSE results; and the effects
of entry to Year 10 teaching in the previous academic year when the current Year 11 cohort was
in Year 10. What matters in these specifications is entry rates in Year 11, when students are in their
final examination year, though the effect is only slightly larger (-0.067, s.e. 0.024) in magnitude
than our baseline estimates (-0.046, s.e. 0.01) although statistically comparable. The implication of
8 The sample size is much smaller due to missing data on subject teaching hours, although this is of little consequence:
if we re-run our baseline specification on this sample we obtain a coefficient on overall entry rates of -0.05 (s.e. 0.014).
This refined measure also takes account of the hours teachers who teach multiple subjects spend teaching each subject
so also acts as a test of robustness to misallocation of teachers to subjects.
16this result is that there is little lost from using department-wide entry rates, and if anything our
main results are overly conservative. The zero-insignificant coefficient on Year 10 entry rates
reinforce the ‘placebo’ tests of Columns 2 and 3: New teachers entering in a given academic year
have no effect on GCSE results if they are not actually teaching the students taking these exams.
The coefficient on entry into Year 10 when students taking GCSEs were actually in Year 10 is
negative, but also small and insignificant. This has two possible interpretations: either turnover in
Year 10 doesn’t impact on students, because it comes at the beginning of teaching on their GCSE
course programmes so involves no disruption to continuity in teaching; or it has an impact on
student performance, but there is little or no persistence in the effects of teacher turnover across
years. With no recorded information on Year 10 achievement we are unable to distinguish between
these hypotheses.
5.3 Event study estimates
Expanding and refining the placebo tests of Column 2 in Table 2, Figure 1 presents the results
of an ‘event study’ style of analysis where we show the estimated coefficients from regressions
which include further leads and lags of entry rates. The figure shows the coefficients (and 95%
confidence intervals) for the effects of entry in a particular year on the attainment of students
qualifying in that year as circles. In line with the results tabulated above, the coefficient is always
negative with a magnitude of around -0.05. The triangles indicate the coefficient on lagged or leads
of the entry rate. So, for example, the triangle corresponding to the lead of 2, is comparable to the
estimate presented in Column 2 of Table 2. Evidently, the effects of the leads are never large or
significant, indicating, as we would expect, that teachers entering after a students’ KS4 exams have
no impact on their exam performance. The one year lagged entry rates imply an impact on KS4
performance that is around half that of entry in the year of the KS4 exams. Again this is to be
expected, because students study for two years for their KS4 qualifications, so these one year
lagged entry rates correspond to the first year of this period of study. There is, however, no impact
17from turnover in years preceding the KS4 study period. These results justify our focus on entry
rates in the year of the KS4 qualifications and suggest there is no need to consider cumulative
entry over the whole of a student’s preceding years of secondary education.
5.4 Exit rates and instrumental variable approach
The previous section provided some supporting evidence that our results are not driven by trends
in turnover and grades at school level. It might still be possible that subject-by-school-by-year
shocks might be driving our results, if potential incomers have inside information about factors
affecting the expected performance of the students and subject groups in the school where they
will be teaching. Another reason for endogenous teacher entry is that entry of new teachers
typically follows exit of others, and, as discussed in Section 2, exit rates are unequivocally
endogenous. For example, incumbent teachers’ inside information and anticipation of a shock
adversely affecting performance in the following year might drive some of them to leave. This, in
turn, could lead to a higher entry rate in the following year through recruitment. Alternatively, if
high exit rates at the end of year (t-1) are due to an adverse shock in year (t-1), this could lead to
high entry rates at the beginning in year t, coinciding with a positive performance shock due to
mean reversion (especially since we condition on group fixed effects, so all the variation is relative
to groups means over the 5 year study period). Given these endogeneity issues, simply including
exit rates in our regressions is a poor strategy (it is also difficult to interpret the effects of entry
conditional on exit, as this implies changes in the number of teachers). 9
Instead, to further address this issue of endogenous exit and entry in response to unobserved
school-subject-year shocks, we implement the instrumental variable procedure described in
Section 2. We instrument exit rates, or entry rates, with the share of teachers in the group in the
9 If we do add exit rates to the regressions, the effects of exit rates unconditional on entry rates are generally zero and
insignificant. The effects of exit rates conditional on entry tend to be positive, and the coefficients on entry rates
become around 50% larger.
18previous year (t-1) who reached requirement pensionable retirement age by the start of academic
year t. These teachers will be forced to leave, so their departure (and the entry of new teachers)
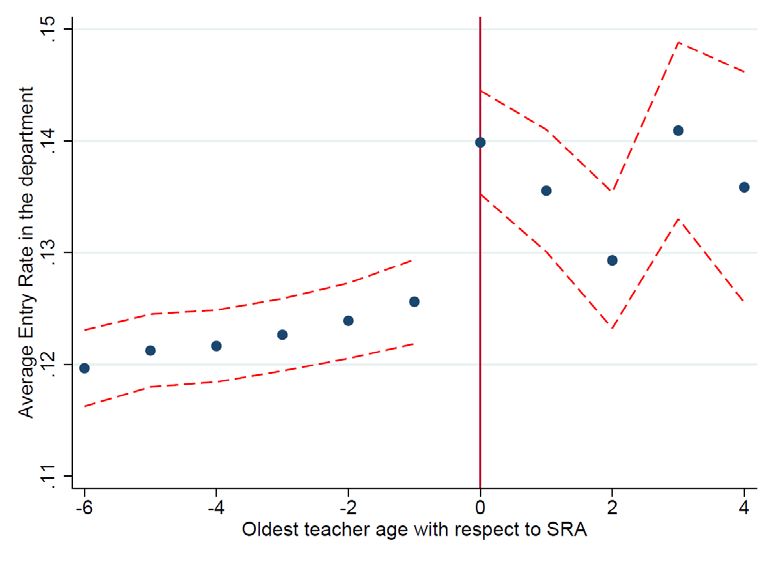
can, surely, be treated as exogenous. Figure 2 graphically illustrates the principle of the first stage
using this instrument, showing the relationship between entry rates in year t and the age of the
oldest teacher in year (t-1) relative to the statutory pension age threshold. As can be seen, entry
rates experience a substantial jump in the year in which a teacher is due to retire.
The instrumental variables estimates are reported in Table 3. Column 1 exhibits the first stage
regression of exit rates on the proportion retiring to demonstrate the instrument relevance. The
first stage coefficient is significant (although small) and the F-statistic is high. Column 2 reports
the OLS-fixed effects estimates for the impact of exit rates in (t-1) on student attainment (in year
t). In contrast to the main results we reported in previous tables, there is no large or statistically
significant relationship between exit rates and attainment. However, as discussed above, the OLS
coefficient on exit rates is uninterpretable in any causal sense due to inherent endogeneity issues.
Column 3 reports the IV estimates. The estimated effect of exit is now much larger – by a factor
of 5 – than our baseline effects of entry, implying that a 10 percentage point increase in the exit
rate reduces attainment at KS4 by around 2.7% of one standard deviation.
The question of how this translates into entry rate effects is explored in Columns 4-5. For
comparison, Column 6 repeats our baseline coefficient estimate for entry rates, from Table 1,
Column 6. The first stage regression in Column 4 indicates that retirement share is also a relevant
instrument for entry rates, as we would expect. The IV point estimate of the effect of entry on
attainment in Column 5 are similar to that for exit rates in Column 2, and both suggest that our
baseline estimates of the effects of turnover could be attenuated lower bounds to the true causal
impact. However, the IV estimate is very imprecisely measured making it somewhat uninformative.
It is also possible that the large IV coefficients are specific to exit and entry driven by retirement
(i.e. the IV is a Local Average Treatment Effect), which may be especially large as experienced
teachers are replaced by new ones (though we control for teacher experience in the regressions,
19and show in Column 6 that, if anything, entry of less experienced teachers causes less disruption).
We repeated these IV regressions using an indicator that the oldest teacher has reached retirement
(i.e. as in Figure 2) and results are similar to those using the share of retiree teachers, so we do not
report them.
The general conclusion from this IV exercise is that our baseline fixed effects estimates are
unlikely to be exaggerated by the endogenous departure of teachers in response to performance-
related shocks.
6. Heterogeneity in the effects of teacher entry
So far, the analysis focused on the identification of the average effect of turnover on test scores
and we have demonstrated that entry rates are exogenous, in the sense that they are uncorrelated
with incumbent teacher, school and student characteristics, and school-subject specific shocks.
Nevertheless, it is still possible that the effects of entry we have estimated arise because incoming
teachers are different from the incumbent teachers, causing changes in the average quality of the
workforce at the school-subject level. It is also possible that the magnitude of the disruptive effects
of new teachers is heterogeneous along a number of dimensions. Firstly, the amount of disruption
may depend directly on incoming teachers’ skills and experience, irrespective of whether they differ
from the incumbent workforce, or their skills of incomers may interact with those in the incumbent
workforce. Allen (2017) for example highlights the potential costs imposed on students in schools
that take on large numbers of newly qualified teachers. Secondly, there are potential interactions
between entering teacher types and student characteristics, if students respond to a change in
teachers in different ways depending on students’ ability to adapt to new styles of teaching or to a
less structured program. Lastly, the effect could also depend on the groups of subjects taught by
new teachers. In this section we investigate these heterogeneous effects of turnover.
206.1 Incoming and incumbent teachers
In order to explore the effect of entry of teachers with different characteristics, we repeat our
preferred fixed effect specification from Table 1, Column 6, but splitting the entry rate into
different components according to incoming teacher characteristics. Table 4 presents the results
of this regression. The coefficients for the different groups of teachers are all of a similar order of
magnitude, indicating that all groups cause disruption. However, the patterns point towards less
senior teachers causing less disruption: the coefficients increase with age, salary and experience (up
to the 3rd quartile), and are marginally less for incomers from outside the profession than those
moving between schools. A possible explanation is that younger, less experienced teachers may be
more adaptable then older teachers, so worries about the costs imposed by new inexperienced
teachers seem unsupported by these results. Gender differences play a role, with entry of male
teachers having a much more detrimental effect than female teachers. We also looked at whether
teachers coming from better/worse schools based on school-subject specific scores in the KS4
exam in the previous year had less disruptive impacts, 10 but found no difference. Additional
regressions in which we interact entry rates with the characteristics of incumbent teachers also
revealed no strongly significant interactions or systematic patterns, so we do not report them here.
11
10 A teacher defined as coming from a better school if the average grades in the origin school-subject cell in (t-1) were
higher than grades attained in the destination school-subject in (t).
11 We also looked at the effects of exit rates in these groups. KS4 attainment generally has no association with exit
rates, unconditional on entry, though we find positive associations with exit of the lowest paid teachers (bottom
quartile) and those with the most experience (10 years +). If we control for both entry and exit, the effects of entry
become around 50% bigger and the differences across incoming teacher types less marked. The coefficients on exit,
conditional on entry are generally positive, but show no systematic patterns across incoming teacher types. As noted
in the text, we do not trust these exit rates results because of the inherent endogeneity of exit rates.
216.2 Students
Table 5 looks at heterogeneity in response of different types of students. The regressions are our
usual fixed effects specifications, with entry rates interacted with dummy indicators for different
student categories. As the results of Table 5 show, we find no evidence that that disruption affects
disadvantaged students more than others, the effects being broadly similar for different types of
student. The effects are marginally less for low income (FSM) students, marginally bigger for
students in the middle of the distribution of prior achievement (KS2), and no different for non-
white ethnic groups. The most striking finding is for gender: male students are more adversely
affected than females by teacher turnover. The coefficient for males implies that a 10 percentage
point increase in teacher-entry reduces attainment by 0.75 percent of one standard deviation (a
standardised effect size of about 1.25 percent of one standard deviation). The effect for girls is
only one third as big. This is in line with a recurrent theme in the educational literature, where boys
generally seem to come of worse (see Gibbons, Silva and Weinhardt (2015), for example).
Disruption from teacher turnover appears to be one contributory factor (albeit a small one) to the
gender gap between boys and girls in England’s schools.
6.3 Subjects
Finally, we move to heterogeneous effects of turnover across subject groups, which is important
because some subjects are more relevant than others for future students’ careers. A lower score in
core GCSE English, Mathematics and Science exams, may bar students from pursing these
subjects in the later stages of education. Also, core subjects contribute to what is known as the
‘English Baccalaureate’ a group of GCSEs which are considered especially important and on which
school performance is, in part, assessed.
To investigate these differences, we run our preferred specification with interactions between
entry rates and indicators whether or not the subject is in what we define as a core or non-core
category. Core subjects include mathematics, English, any science, history and geography (in line
22with the English Baccalaureate). The findings in Table 6 are quite striking. All of the general effects
of entry are coming from the non-core subject group. There are at least two potential explanations
for this finding: firstly, we might expect differences across subjects because of differences in the
way teaching is organised and the continuity required e.g. if students have substantial pieces of
coursework or art portfolios in non-core courses that benefit from consistent supervision;
secondly, schools can also respond in different ways to turnover and a likely explanation for the
take more urgent action to avoid or mitigate the impacts in courses that are a high priority.
7. Conclusion
Our study investigated the impact of teacher entry on student achievement in England using fixed
effects regression designs which control carefully for unobserved school-by-year, subject-by-year
shocks and school-by-subject or individual unobservables. The key finding is that students in the
final year of compulsory secondary school score less well in their final assessments if they are
exposed to higher rates of teacher entry in the subjects they are studying. Boys are more severely
affected than girls. Less senior incoming teachers seem to cause less disruption than those who
are more senior, although the differences are subtle. Entry in the final year in which students take
their final GCSE assessments seems crucially important, implying that disruption to final
qualifications from new teachers could be minimised by assigning them to year groups with less
high-stakes assessment. The magnitudes are, however, quite small, with a 10 percentage point
increase in entry rates reducing scores in final qualifications by just under 0.5 percent of a standard
deviation. This figure is almost exactly the same as that found for entry of teachers in primary
schools in the US (Ronfeldt et al 2013), suggesting that the effects are potentially quite general and
not dependent on context. This size of impact is economically meaningful compared to many
other educational interventions. For instance, the literature on teacher quality suggests that a one
standard deviation increase in overall teacher quality – where ‘quality’ means everything about
teachers that is correlated with persistently higher value-added scores – only raises individual
23student achievement by around 0.11 standard deviations (see for example Hanushek 2009). Our
standardised effect is about 0.8 percent of one standard deviation from a one standard deviation
increase in entry rates, so clearly considerably smaller than this, though not negligible, and
comparable or larger to the estimates of other forms of educational externality in student groups.
248. References
Allen, Rebecca (2017) Assessing the use and misuse of Newly Qualified Teachers , blog post
Education Data Lab, London https://educationdatalab.org.uk/2017/06/assessing-the-use-
and-misuse-of-newly-qualified-teachers/
Altinok, N, and G. Kingdon (2012), New Evidence on Class Size Effects: A Pupil Fixed Effects
Approach”, Oxford Bulletin of Economics and Statistics, 74(20): 203-234.
Clotfelter, C.T., H.F. Ladd and J.L. Vigdor (2010), Teacher Credentials and Student
Achievement in High School. A Cross-Subject Analysis with Student Fixed Effects”, Journal of
Human Resources 45(3): 655-681.
Dee, T.S. (2005), A Teacher Like Me: Does Race, Ethnicity, or Gender Matter?” American
Economic Review Papers and Proceedings 95(2): 158-165.
Hanushek, E. and S.G. Rivkin (2010) Constrained job matching: Does teacher job search harm
disadvantaged urban schools? NBER working paper, Nr. 15816.
Hanushek, E., K, J.F. and S.G. Rivkin (1999) Do higher salaries buy better teachers, NBER
working paper, Nr. 7082.
Ingersoll, R. (2001) Teacher turnover and teacher shortages: An organisational analysis,
American Education Research Journal, 38 (3): pp.499-534
Lavy, Victor, Silva Olmo, and Weinhardt Felix (2012). “The Good, the Bad, and the Average:
Evidence on Ability Peer Effects in Schools.” Journal of Labor Economics, 30, 367–414.
Nicoletti, Cheti and Birgitta Rabe (2017) ‘The effect of school spending on student achievement:
addressing biases in value-added models’ Journal of the Royal Statistical Society: Series A
(Statistics in Society), pp. 1-29.
Ronfeldt, Matthew, Susanna Loeb and James Wyckoff (2013) How Teacher Turnover Harms
Student Achievement, American Educational Research Journal 50 (1) 4-36
25Slater H., Davies N.M., and S. Burgess (2010), Do Teachers Matter? Measuring the Variation
in Teacher Effectiveness in England", Oxford Bulletin of Economics and Statistics, 74 (5),
629-645.
Adnot, Melinda, Thomas Dee, Veronica Katz, James Wyckoff (2016) Teacher Turnover,
Teacher Quality, and Student Achievement in DCPS NBER Working Paper No. 21922
Jesse Rothstein (2015) Teacher Quality Policy When Supply Matters, American Economic
Review 105 (1) 100-130
Chetty, Raj, John N. Friedman, Jonah E. Rockoff (2014) Measuring the Impacts of Teachers I:
Evaluating Bias in Teacher Value-Added Estimates, American Economic Review 2014, 104(9):
2593–2632
Hanushek, Eric A. (2009). ‘Teacher Deselection’, Chapter 8 in Creating a New Teaching
Profession, Dan Goldhaber and Jane Hannaway eds., 165–180. Washington, DC: Urban
Institute Press
Thomsen,
26Figure 1: Event study of effects of entry rates on KS4 attainment
27Figure 2: First stage effect of age of oldest teacher in school-subject group (department) in
year t-1 on entry in year t. Zero is Statutory Retirement Age
28Table 1: Baseline results for effect of teacher entry rates on KS4 point scores
(1) (2) (3) (4) (5) (6) (7) (8)
Overall entry rate -0.057*** -0.242*** -0.053*** -0.069*** -0.039*** -0.046*** -0.040*** -0.049***
(0.013) (0.018) (0.011) (0.014) (0.008) (0.010) (0.008) (0.011)
Observations 13,524,806 13,087,183 13,524,805 13,087,182 13,524,621 13,087,013 13,506,279 13,067,939
R-squared 0.000 0.036 0.209 0.232 0.440 0.461 0.577 0.578
Year FE Y Y N N N N N N
School x Year FE N N Y Y Y Y N N
Subject x Year FE N N Y Y Y Y Y Y
School x Subj FE N N Y N Y Y Y Y
Student FE N N N N N N Y Y
Control variables N Y N Y N Y N Y
Notes: Dependent variable is the average standardized point score in the KS4 exams by student, subject and year. Standard
errors clustered at school level. Control variables. Teacher characteristics at school-subject level include: average age of
teacher; average experience; share of female teachers and average log salary. Student characteristics include: normalized prior
test scores; Free School Meal (FSM) eligibility; gender; ethnicity (white/others). School-subject specific characteristics are:
pupil teacher ratio; proportion of female students; proportion of FSM; proportion of white; number of teachers in current
and past academic year. Level of significance: 10% *; 5% **; 1% ***.
29You can also read