Grid-independent high-resolution dust emissions (v1.0) for chemical transport models: application to GEOS-Chem (12.5.0) - GMD
←
→
Page content transcription
If your browser does not render page correctly, please read the page content below
Geosci. Model Dev., 14, 4249–4260, 2021
https://doi.org/10.5194/gmd-14-4249-2021
© Author(s) 2021. This work is distributed under
the Creative Commons Attribution 4.0 License.

Grid-independent high-resolution dust emissions (v1.0) for chemical
transport models: application to GEOS-Chem (12.5.0)
Jun Meng1,2,a , Randall V. Martin2,1,3 , Paul Ginoux4 , Melanie Hammer2,1 , Melissa P. Sulprizio5 , David A. Ridley6 , and
Aaron van Donkelaar1,2
1 Department  of Physics and Atmospheric Science, Dalhousie University, Halifax, Nova Scotia, B3H 4R2, Canada
2 Department  of Energy, Environmental & Chemical Engineering, Washington University in St. Louis,
St. Louis, Missouri 63130, USA
3 Smithsonian Astrophysical Observatory, Harvard-Smithsonian Center for Astrophysics, Cambridge, MA 02138, USA
4 NOAA Geophysical Fluid Dynamics Laboratory, Princeton, New Jersey 08540, USA
5 School of Engineering and Applied Science, Harvard University, Cambridge, MA 02138, USA
6 California Environmental Protection Agency, Sacramento, CA 95814, USA
a now at: Department of Atmospheric & Oceanic Sciences, University of California, 520 Portola Plaza, Los Angeles,

California 90095, USA

Correspondence: Jun Meng (jun.meng@ucla.edu)

Received: 19 November 2020 – Discussion started: 11 December 2020
Revised: 24 May 2021 – Accepted: 10 June 2021 – Published: 6 July 2021

Abstract. The nonlinear dependence of the dust saltation           climatology. The offline high-resolution dust emissions are
process on wind speed poses a challenge for models of vary-        easily implemented in chemical transport models. The source
ing resolutions. This challenge is of particular relevance for     code and global offline high-resolution dust emission inven-
the next generation of chemical transport models with nim-         tory are publicly available.
ble capability for multiple resolutions. We develop and apply
a method to harmonize dust emissions across simulations of
different resolutions by generating offline grid-independent
dust emissions driven by native high-resolution meteorolog-        1   Introduction
ical fields. We implement into the GEOS-Chem chemical
transport model a high-resolution dust source function to          Mineral dust, as one of the most important natural aerosols
generate updated offline dust emissions. These updated of-         in the atmosphere, has significant impacts on weather and
fline dust emissions based on high-resolution meteorologi-         climate by absorbing and scattering solar radiation (Bergin
cal fields strengthen dust emissions over relatively weak dust     et al., 2017; Kosmopoulos et al., 2017), on atmospheric
source regions, such as in southern South America, southern        chemistry by providing surfaces for heterogeneous reaction
Africa and the southwestern United States. Identification of       of trace gases (Chen et al., 2011; Tang et al., 2017), on the
an appropriate dust emission strength is facilitated by the res-   biosphere by fertilizing the tropical forest (Bristow et al.,
olution independence of offline emissions. We find that the        2010; Yu et al., 2015) and ocean (Jickells et al., 2005; Guieu
performance of simulated aerosol optical depth (AOD) ver-          et al., 2019; Tagliabue et al., 2017), and on human health
sus measurements from the AERONET network and satel-               by increasing surface fine particulate matter (PM2.5 ) con-
lite remote sensing improves significantly when using the          centrations (De Longueville et al., 2010; Fairlie et al., 2007;
updated offline dust emissions with the total global annual        Zhang et al., 2013). Dust emissions are primarily controlled
dust emission strength of 2000 Tg yr−1 rather than the stan-       by surface wind speed to the third or fourth power, vegeta-
dard online emissions in GEOS-Chem. The updated simula-            tion cover, and soil water content. The principal mechanism
tion also better represents in situ measurements from a global     for natural dust emissions is saltation bombardment (Gillette
                                                                   and Passi, 1988; Shao et al., 1993), in which sand-sized par-

Published by Copernicus Publications on behalf of the European Geosciences Union.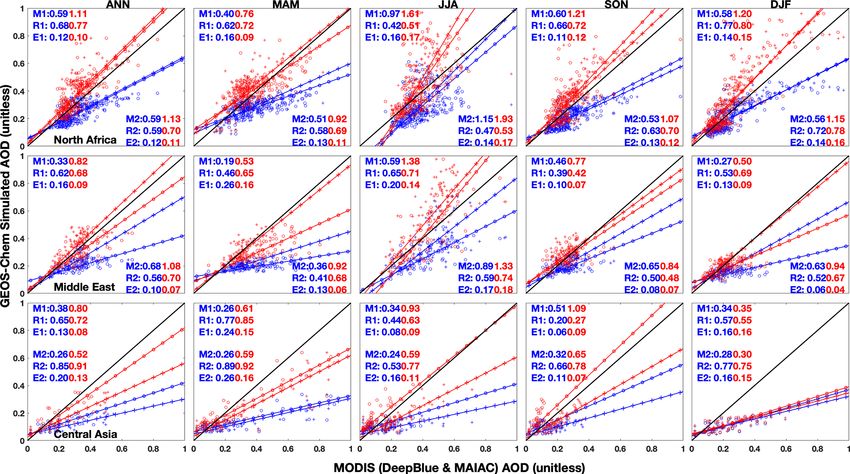
4250                                                   J. Meng et al.: Grid-independent high-resolution dust emissions (v1.0)

ticles creep forward and initiate the suspension of smaller         We apply this new capability to assess the source strength
dust particles when the surface wind exceeds a threshold. The       that best represents observations.
nonlinear dependence of dust emissions on meteorology in-
troduces an artificial dependence of simulations upon model
resolution (Ridley et al., 2013). For example, dust emissions       2     Materials and methods
in most numerical models are parameterized with an empir-
ical method (e.g., Ginoux et al., 2001; Zender et al., 2003),       2.1    Description of observations
which requires a critical wind threshold to emit dust parti-
cles. Smoothing meteorological fields to coarse resolution          We use both ground-based and satellite observations to eval-
can lead to wind speeds falling below the emission threshold        uate our GEOS-Chem simulations. AERONET is a global
in regions that do emit dust. Methods are needed to address         ground-based remote sensing aerosol monitoring network of
the artificial dependence of simulations upon model resolu-         sun photometers with direct sun measurements every 15 min
tion that arises from nonlinearity in dust emissions.               (Holben et al., 1998). We use Level 2.0 Version 3 data
   Addressing this nonlinearity is especially important for the     that have improved cloud screening algorithms (Giles et al.,
next generation of chemistry transport models that is emerg-        2019). Aerosol optical depth (AOD) at 550 nm is interpolated
ing with nimble capability for a variety of resolutions at the      based on the local Ångström exponent at the 440 and 670 nm
global scale. For example, the high-performance version of          channels.
GEOS-Chem (GCHP) (Eastham et al., 2018) currently offers               Twin Moderate-Resolution Imaging Spectroradiometer
simulation resolutions that vary by over a factor of 100 from       (MODIS) instruments aboard both the Terra and Aqua
C24 (∼ 4◦ × 4◦ ) to C360 (∼ 0.25◦ × 0.25◦ ), with progress to-      NASA satellite platforms provide near-daily measurements
ward even finer resolution and toward a variable stretched          globally. We use the AOD at 550 nm retrieved from Collec-
grid capability (Bindle et al., 2020). Resolution-dependent         tion 6.1 (C6) of the MODIS product (Sayer et al., 2014). We
mineral dust emissions would vary by a factor of 3 from             use AOD from the Deep Blue (DB) retrieval algorithm (Hsu
C360 to C24 (Ridley et al., 2013). Such large resolution-           et al., 2013; Sayer et al., 2014) designed for bright surfaces,
dependent biases would undermine applications of CTMs to            and the Multi-Angle Implementation of Atmospheric Cor-
assess dust effects and would lead to large within-simulation       rection (MAIAC) algorithm (Lyapustin et al., 2018), which
inconsistency for stretched grid simulations that can span          provides global AOD retrieved from MODIS C6 radiances at
the entire resolution range simultaneously. Grid-independent        a resolution of 1 km. The MAIAC AOD used in this study is
high-resolution dust emissions offer a potential solution to        interpolated to the AOD value at 550 nm.
this issue.                                                            We use ground-based surface fine dust concentration mea-
   An important capability in global dust evaluation is             surements over the US from the Interagency Monitoring of
ground-based and satellite remote sensing. The Aerosol              Protected Visual Environments (IMPROVE, http://vista.cira.
Robotic Network (AERONET), a global ground-based re-                colostate.edu/Improve/, last access: 8 June 2020) network.
mote sensing aerosol monitoring network of Sun photome-             The IMPROVE network provides 24 h average fine dust con-
ters (Holben et al., 1998), has been widely used to evaluate        centration data every third day over the national parks in the
dust simulations. Satellite remote sensing provides additional      United States. We also include a climatology of dust surface
crucial information across arid regions where in situ observa-      concentration measurements over 1981–2000 from indepen-
tions are sparse (Hsu et al., 2013). Satellite aerosol retrievals   dent dust measurement sites across the globe (Kok et al.,
have been used extensively in previous studies to either eval-      2020). We use those sites (12 in total) (Fig. S1 in the Supple-
uate the dust simulation (Ridley et al., 2012, 2016) or con-        ment) that are either in the dust belt across Northern Hemi-
strain the dust emission budget (Zender et al., 2004). Satel-       sphere or sites relatively close to the weak emission regions
lite aerosol products have been used to identify dust sources       in the Southern Hemisphere to evaluate our dust simulation.
worldwide (Ginoux et al., 2012; Schepanski et al., 2012;               We compare the simulated AOD and dust concentrations
Yu et al., 2018), especially for small-scale sources (Gillette,     with measurements using reduced major axis linear regres-
1999).                                                              sion. We report root mean square error (E), correlation (R)
   The objective of this study is to develop a method to mit-       and slope (M).
igate the large inconsistency of total dust emissions across
different resolutions of simulations by generating and archiv-      2.2    Dust mobilization module
ing offline dust emissions using native high-resolution mete-
orological fields. We apply this method to the GEOS-Chem            We use the dust entrainment and deposition (DEAD) scheme
chemical transport model. As part of this effort, we im-            (Zender et al., 2003) in the GEOS-Chem model to calculate
plement an updated high-resolution satellite-identified dust        dust emissions. The saltation process is dependent on the
source function into the dust mobilization module of GEOS-          critical threshold wind speed, which is determined by sur-
Chem to better represent the spatial structure of dust sources.     face roughness, soil type and soil moisture. Dust aerosol is
                                                                    transported in four size bins (0.1–1.0, 1.0–1.8, 1.8–3.0, and

Geosci. Model Dev., 14, 4249–4260, 2021                                             https://doi.org/10.5194/gmd-14-4249-2021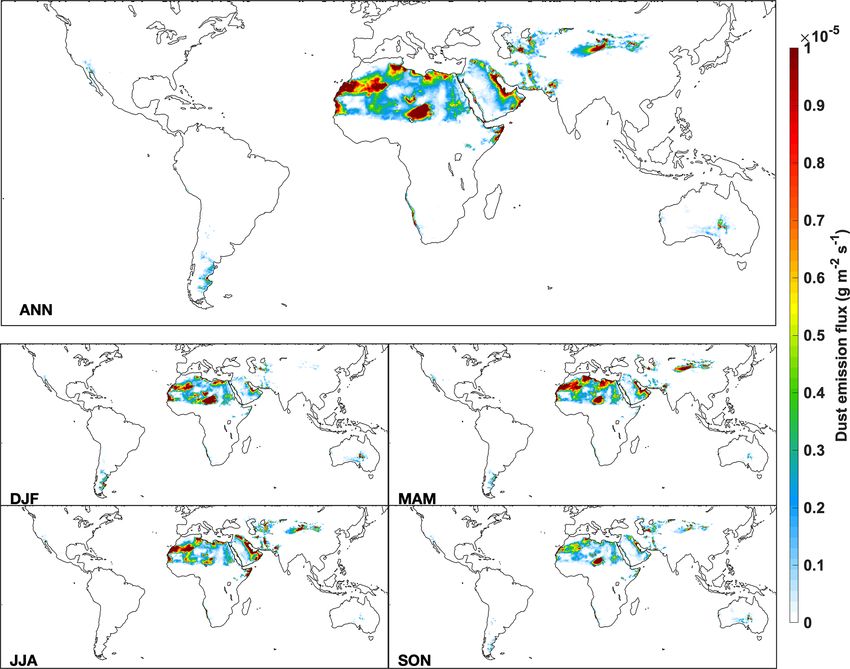
J. Meng et al.: Grid-independent high-resolution dust emissions (v1.0)                                                       4251

3.0–6.0 µm radius). Detailed description of the dust emission      of the NASA Global Modelling and Assimilation Office
parameterization is in Sect. S1 in the Supplement.                 (GMAO). The GEOS-Chem aerosol simulation includes
   The fractional area of land with erodible dust is repre-        the sulfate–nitrate–ammonium (SNA) aerosol system (Foun-
sented by a source function. The dust source function used         toukis and Nenes, 2007; Park et al., 2004), carbonaceous
in the dust emission module plays an important role in deter-      aerosol (Hammer et al., 2016; Park et al., 2003; Wang et al.,
mining the spatial distribution of dust emissions. The stan-       2014), secondary organic aerosols (Marais et al., 2016; Pye
dard GEOS-Chem model (version 12.5.0) uses a source func-          et al., 2010), sea salt (Jaeglé et al., 2011) and mineral dust
tion at 2◦ × 2.5◦ resolution from Ginoux et al. (2001) as im-      (Fairlie et al., 2007) with updates to aerosol size distribu-
plemented by Fairlie et al. (2007). We implement an updated        tion (Ridley et al., 2012; Zhang et al., 2013). Aerosol optical
high-resolution version of the dust source function in this        properties are based on the Global Aerosol Data Set (GADS)
study at 0.25◦ × 0.25◦ resolution (Sect. S2 in the Supple-         as implemented by Martin et al. (2003) for externally mixed
ment). Figure S2 in the Supplement shows a map of the orig-        aerosols as a function of local relative humidity with up-
inal and updated version of the dust source function. The up-      dates based on measurements (Drury et al., 2010; Latimer
dated source function exhibits more spatially resolved infor-      and Martin, 2019). Wet deposition of dust, including the pro-
mation due to its finer spatial resolution resulting in a higher   cesses of scavenging from convection and large-scale pre-
fraction of erodible dust over in the eastern Arabian Penin-       cipitation, follows Liu et al. (2001). Dry deposition of dust
sula, the Bodélé depression, and the central Asian deserts.        includes the effects of gravitational settling and turbulent re-
The dust module dynamically applies this source function           sistance to the surface, which are represented with deposition
together with information on soil moisture, vegetation, and        velocities in the parameterization, implemented into GEOS-
land use to calculate hourly emissions using the Harmonized        Chem by Fairlie et al. (2007).
Emissions Component (HEMCO) module described below.                   The original GEOS-Chem simulation used online dust
                                                                   emissions by coupling the dust mobilization module online.
2.3   Offline dust emissions at the native meteorological          We develop the capability to use offline dust emissions based
      resolution                                                   on the archived fields described in Sect. 2.3. We conduct
                                                                   global simulations with GEOS-Chem (version 12.5.0) at a
HEMCO (Keller et al., 2014) is a stand-alone software mod-         horizontal resolution of 2◦ by 2.5◦ for the year 2016. Simu-
ule for computing emissions in global atmospheric models.          lations using the online and offline dust emissions are con-
We run the HEMCO standalone version using native meteo-            ducted to evaluate the offline dust emissions. We conduct
rological resolution (0.25◦ × 0.3125◦ ) data for wind speed,       two simulations using online dust emissions with different
soil moisture, vegetation, and land use to archive the of-         dust source functions. The first is with the original version of
fline dust emissions at the same resolution as the meteoro-        the dust source function, hereafter noted as the original on-
logical data. The computational time required for calculat-        line dust simulation. The other is with the updated version of
ing offline dust emission fluxes at 0.25◦ × 0.3125◦ resolu-        source function, in which the updated fine-resolution source
tion is around 6 h for 1 year of offline dust emissions on a       function is interpolated to 2◦ by 2.5◦ resolution. The annual
compute node with 32 cores on 2 Intel CPUs at 2.1 GHz. In          total emissions for the online dust emissions are at the orig-
this study, we generate two offline dust emission datasets at      inal value of 909 Tg yr−1 . We conduct another four sets of
0.25◦ × 0.3125◦ resolution. One, referred to as the default        simulations using offline dust emissions. The first uses the
offline dust emissions, uses the existing dust source func-        default offline dust emissions with annual total dust emission
tion in the GEOS-Chem dust module; the other, referred to          of 909 Tg yr−1 . The remaining sets use the updated offline
as the updated offline dust emissions, uses the updated dust       dust emissions with the annual total dust emission scaled to
source function implemented here. Both datasets are at the         1500, 2000 and 2500 Tg yr−1 , which are in the range of the
hourly resolution of the parent meteorological fields. The         current dust emission estimates of over 514–4313 Tg yr−1
archived native-resolution offline dust emissions can be con-      (Huneeus et al., 2011). We focus on the simulation with
servatively regridded to coarser resolution for consistent in-     2000 Tg yr−1 , which better represents observations as will be
put to chemical transport models at multiple resolutions. We       shown below.
use the GEOS-Chem model to evaluate the dust simulations
and the emission strength.
                                                                   3     Results and discussion
2.4   GEOS-Chem chemical transport model and
      simulation configurations                                    3.1    Spatial and seasonal variation of the offline dust
                                                                          emissions
GEOS-Chem (Bey et al., 2001; The International GEOS-
Chem User Community, 2019) is a three-dimensional chem-            Figure 1 shows the spatial distribution of the annual and sea-
ical transport model driven by assimilated meteorological          sonal dust emission flux rate for the updated offline dust
data from the Goddard Earth Observation System (GEOS)              emissions. The annual dust emission flux rate is high over

https://doi.org/10.5194/gmd-14-4249-2021                                             Geosci. Model Dev., 14, 4249–4260, 2021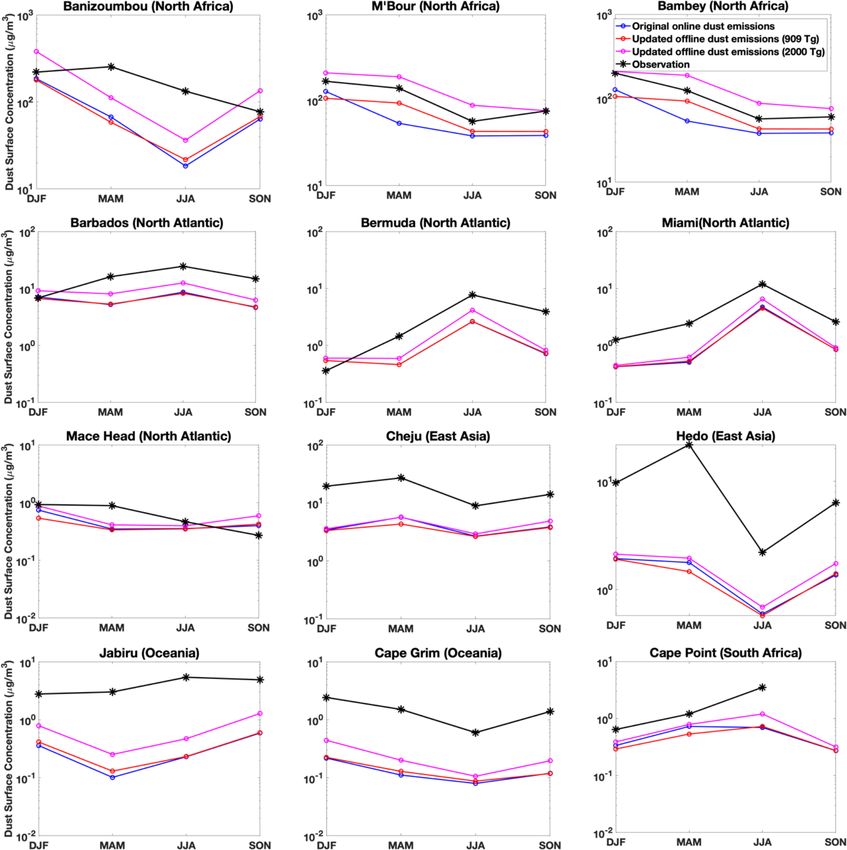
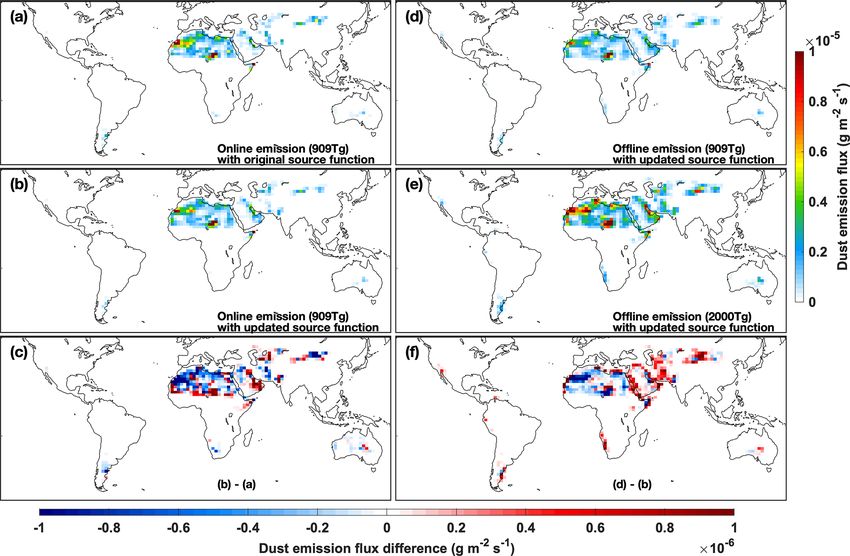
4252                                                    J. Meng et al.: Grid-independent high-resolution dust emissions (v1.0)

Figure 1. Annual and seasonal mean dust emission flux rate for the offline high-resolution dust emissions with updated dust source function
and updated annual total dust emission of 2000 Tg.

major deserts, such as the northwestern Sahara, the Bodélé              in Fig. 2f, can be considered the error in the online approach
Depression in northern Chad, the eastern Arabian Penin-                 arising from coarse-resolution meteorological fields. The of-
sula, and central Asian Taklimakan and Gobi deserts. There              fline dust emissions based on native-resolution meteorologi-
are also hotspots of dust emission flux rate over relatively            cal fields have lower dust emission flux rates over northwest
smaller deserts, such as the Mojave Desert of the south-                Africa, but higher dust emission flux rates over the Middle
western United States, the Atacama desert of southern South             East and central Asia. Higher annual dust emission flux rates
America, the Kalahari desert on the west coast of southern              over the southwestern United States, southern South Amer-
Africa and the deserts of central Australia. Those features re-         ica, the west coast of southern Africa and central Australia in
flect the fine resolution of the updated dust source function           the offline dust emissions reflect that the native-resolution of-
and of the offline dust emissions. Seasonally, the dust emis-           fline dust emissions are strengthened over relatively weaker
sion flux rate resembles the annual distribution, but with a            dust emission regions. Generally, coastal and minor desert
lower dust emission flux rate over the Bodélé Depression in             regions emit more dust when calculating emissions at the na-
northern Chad in summer and higher dust emission flux rate              tive meteorological resolution.
over the Middle East and central Asian deserts in spring and               Figures S3–S6 in the Supplement show the seasonal vari-
summer.                                                                 ations of dust emission flux rates for online and offline emis-
   Figure 2 shows the spatial distribution of the annual dust           sions. The offline dust emissions have lower emission flux
emission flux rate for the online and offline dust emissions            rates than the online dust emissions during spring (March,
with the original and updated dust source functions with                April and May) (MAM) and winter (December, January and
original and updated global total dust source strengths. All            February) (DJF) over North Africa. The offline dust emis-
simulations exhibit high dust emission flux rates over ma-              sion flux rate is higher than the online dust emission flux
jor desert regions, such as the North African, Middle East-             rate over the Middle East and central Asian deserts during
ern and central Asian deserts, with local enhancements over             spring and summer (June, July and August) (JJA). Emission
the western Sahara and northern Chad. The simulation with               flux rates are low over central Asian deserts during winter.
the updated source function exhibits stronger emissions in              The strengthening of offline dust emissions over weaker dust-
the Sahara and Persian Gulf regions (Fig. 2c). The differ-              emitting regions persists throughout all seasons.
ence between the online and offline dust emissions, shown

Geosci. Model Dev., 14, 4249–4260, 2021                                                  https://doi.org/10.5194/gmd-14-4249-2021
J. Meng et al.: Grid-independent high-resolution dust emissions (v1.0) 4253
Figure 2. Annual mean dust emission flux rate for 2016. (a) The original online dust emissions with original dust source function and annual
total dust emissions of 909 Tg. (b) Online dust emissions with updated dust source function. (c) Difference of flux rate between online dust
emissions using original and updated dust source functions. (d) Offline dust emissions with updated dust source function. (e) Offline dust
emissions with updated dust source function and updated annual total dust emissions of 2000 Tg. (f) Difference of flux rate between offline
and online dust emissions. The online dust emissions are in 2◦ × 2.5◦ resolution. The offline dust emissions shown in (b, d, f) are regridded
from 0.25◦ × 0.3125◦ resolution to 2◦ × 2.5◦ for comparison with online dust emissions.
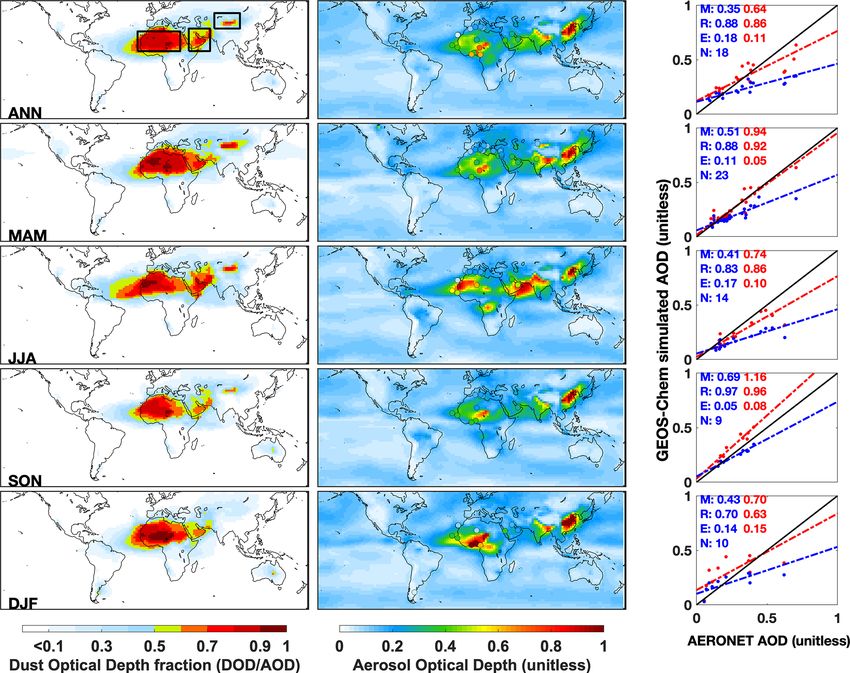
3.2 The performance of AOD simulations over desert We further evaluate the performance of simulated AOD
regions over major desert regions using the MODIS DB and MAIAC
AOD products. Figure 4 shows annual and seasonal scatter
Figure 3 shows simulated AOD using the updated offline dust plots comparing GEOS-Chem-simulated AOD using origi-
emissions. Difference maps of simulated AOD between on- nal online dust emissions and updated offline dust emissions
line and offline dust emissions are shown in Fig. S7 in the against retrieved AOD from MODIS DB and MAIAC satel-
Supplement. We select for evaluation the AERONET sites lite products over the three major desert regions outlined in
where the ratio of simulated dust optical depth (DOD) to Fig. 3. Figure S8 in the Supplement shows the annual and
simulated total AOD exceeds 0.5 in the simulation using the seasonal AOD distribution from MODIS DB and MAIAC.
updated offline dust emissions with annual dust strength of Annually, the simulation using updated offline dust emis-
2000 Tg. Annually, the simulated DOD has the highest value sions exhibits greater consistency with satellite AOD than
over the Bodélé Depression. This feature persists in all sea- the simulation using original online dust emissions across
sons except summer, when DOD has the highest values over all three desert regions. The simulation using updated offline
the western Sahara and eastern Arabian Peninsula. The scat- dust emission performs better across all three desert regions
ter plots show that annually the simulated AOD from both and in all four seasons except for North Africa in summer,
simulations are highly correlated with AERONET measure- during which AOD is overestimated. Both simulations un-
ments across the dust regions (R = 0.86–0.88). The simu- derestimate AOD over central Asian deserts during winter,
lation with updated offline dust emissions has an improved when dust emissions are low and other sources may be more
slope and smaller root mean square error than the simula- important. Overall, the simulation using original online dust
tion using the original online dust emissions. AOD from the emissions underestimates AOD over all three major desert
simulation with updated offline dust emissions is also more regions, especially over the Middle East and central Asian
consistent with the measurements in different seasons, espe- deserts. The simulation using updated offline dust emissions
cially in the spring (MAM) and fall (SON) with slopes close exhibits greater consistency with satellite observations with
to unity and R exceeding 0.9. higher slopes and correlations.
https://doi.org/10.5194/gmd-14-4249-2021 Geosci. Model Dev., 14, 4249–4260, 2021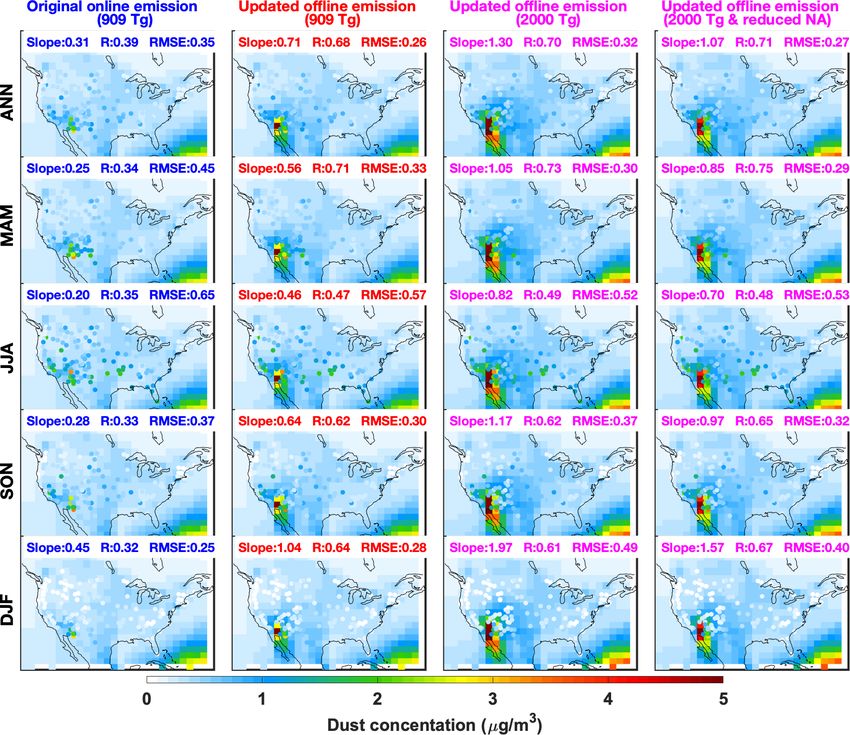
4254                                                      J. Meng et al.: Grid-independent high-resolution dust emissions (v1.0)

Figure 3. Annual and seasonal mean simulated dust optical depth (DOD) fraction (left column) and aerosol optical depth (AOD) (middle
column) from GEOS-Chem simulations for 2016, and AERONET measured AOD at sites where the ratio of simulated DOD and AOD
exceeds 0.5, which are shown as filled circles in the middle column. Boxes in the left top panel outline the three major deserts examined in
Fig. 4. The right column shows the corresponding scatter plot with root mean square error (E), correlation coefficient (R) and slope (M)
calculated with reduced major axis linear regression. N is the number of valid ground-based monitoring records. The results for the simulation
using the original dust emissions are shown in blue; the results for the simulation using updated dust emissions with dust strength of
2000 Tg yr−1 are shown in red. The best-fit lines are dashed. The 1 : 1 line is solid.

3.3    Evaluation of the simulations against surface dust                and density of the dust measurements, and the disconnect
       concentration measurements                                        of North American dust emissions from the global source,
                                                                         we conduct an additional sensitivity simulation with North
We also evaluate our simulations using different dust emis-              American dust emissions reduced by 30 %. The right column
sions against measurements of surface dust concentrations.               shows that the annual slope in the resultant simulation versus
Figure 5 shows the comparison of modeled fine dust sur-                  observations improves to 1.07, minor improvements to an-
face concentration against the fine dust concentration obser-            nual and seasonal correlations. Future efforts should focus on
vation from the IMPROVE network. The simulations using                   better representing the seasonal variation of dust emissions.
the updated offline dust emissions can better represent the                 Figure 6 shows the comparison of seasonally averaged
observed surface fine dust concentration measurements than               modeled and measured surface dust concentrations from
the simulation using the original online dust emissions with             12 independent sites across the globe. The simulation us-
higher correlations and slopes across all seasons. Annually,             ing the updated offline dust emissions with dust strength of
the correlation between the simulation and observation in-               2000 Tg yr−1 is more consistent with the observations at al-
creases from 0.39 to 0.68, and the slope increases from 0.31             most all sites. The remaining bias at sites distant from source
to 0.71 when using the updated offline dust emissions with               regions, for example sites in the Southern Hemisphere and
annual dust strength of 909 Tg compared to the simulation                East Asia, likely reflects the remaining uncertainty in repre-
using the original online dust emissions. Scaling the annual             senting dust deposition. Further research is needed to address
dust strength to 2000 Tg yr−1 marginally improves the per-               the remaining knowledge gaps, such as better representing
formance of the model simulation of fine dust concentrations             the dust size distribution and deposition during transport.
in all seasons except winter, during which the surface fine
dust concentrations are overestimated. Given the specificity

Geosci. Model Dev., 14, 4249–4260, 2021                                                    https://doi.org/10.5194/gmd-14-4249-2021
J. Meng et al.: Grid-independent high-resolution dust emissions (v1.0) 4255
Figure 4. Scatter plots and statistics of comparing GEOS-Chem simulated AOD with satellite AOD over desert regions annually (the first
column) and seasonally (the right four columns). The results for the North African, Middle Eastern and central Asian deserts are shown in
the top, middle and bottom rows, respectively. The results for the simulation using the original dust emissions are shown in blue; the results
for the simulation using updated dust emissions with dust strength of 2000 Tg yr−1 are shown in red. Open circles represent the comparison
with MODIS Deep Blue AOD; the plus signs represent the comparison with MAIAC AOD. Correlation coefficient (R), root mean square
error (E) and slope (M) are reported, in which R1, E1 and M1 show the results of the comparison with MODIS Deep Blue AOD; R2, E2 and
M2 show the results of the comparison with MAIAC AOD. The best-fit lines are dashed lines with corresponding marker signs and colors.
The 1 : 1 line solid black line.
3.4 Discussion of the dust source strength tral Asian deserts given the paucity of in situ measurements.
More dust-specific observations are needed to constrain dust
emissions for the Asian deserts region and other deserts. Ad-
One of the advantages of the offline dust emissions is that the
ditional development and evaluation should be conducted to
same dust source strength can be readily applied to all model
further narrow the uncertainty of dust emissions, especially
resolutions, facilitating evaluation of dust source strength in-
at the regional scale.
dependent of resolution. We have found that the simulation
Although the main purpose of this paper is to develop and
with global total annual dust emission scaled to 2000 Tg bet-
evaluate an offline grid-independent inventory, it is worth
ter represents observations than the default simulation with
noting that online models have the capability to scale to a tar-
global total annual dust emissions of 909 Tg. We also evalu-
get source strength. In that context the global source strength
ate simulations with global total annual dust emission scaled
identified here may be of use for global online models to
to 1500 and 2500 Tg. Figure S9 in the Supplement indicates
scale to the global source strength, with the caveat that dif-
that the simulation with global total annual dust emission
ferences in dust parameterization, dust optics and deposition
scaled to 2000 Tg is more consistent with satellite observa-
may affect performance.
tions over North Africa and the Middle East. Although the
central Asian deserts and regions with AERONET observa-
tions (Fig. S10 in the Supplement) are better represented by 3.5 Advantages of high-resolution offline dust
the simulation with global total annual dust emission scaled emissions for model development
to 2500 Tg, since North Africa has the highest dust emis-
sions (Huneeus et al., 2011), and AOD over North Africa Uncertainty remains in the estimated global annual total
is most likely dominated by dust, we scale global total an- dust emissions. Direct dust emission flux observations are
nual dust emissions to best match this source region robustly. few. Current atmospheric models apply a global-scale fac-
We refrain from applying a regional-scale factor to the cen- tor to optimize with a specific set of ground observations.
https://doi.org/10.5194/gmd-14-4249-2021 Geosci. Model Dev., 14, 4249–4260, 20214256 J. Meng et al.: Grid-independent high-resolution dust emissions (v1.0)
Figure 5. Annual and seasonal mean simulated fine dust concentrations from GEOS-Chem simulations with different dust emissions for
2016, and IMPROVE fine dust measurements, which are shown as filled circles. Root mean square error (E), correlation coefficient (R) and
slope (M) calculated with reduced major axis linear regression are reported. The results for the simulation using the original dust emissions
are shown in blue (left column). The results for the simulation using updated dust emissions with dust strength of 909 Tg yr−1 are shown in
red (second column). The results for the simulation using updated dust emissions with dust strength of 2000 Tg yr−1 are shown in magenta
(third column). The right column is the sensitivity simulation with North America dust emission reduced by 30 %.
Because of the non-linear dependence on resolution of the olution promotes consistency of dust emissions across dif-
dust emissions, the source strength has historically depended ferent model resolutions. We take advantage of the capa-
upon model resolution, which inhibits general evaluation. bility of the HEMCO standalone module to calculate dust
The native-resolution offline dust emissions facilitate consis- emission offline at native meteorological resolution using
tent evaluation and application across all model resolutions. the DEAD dust emission scheme combined with an updated
Such consistency is particularly important for stretched-grid high-resolution dust source function. We evaluate the perfor-
simulations with the capability for variation in resolution by mance of the simulation with native-resolution offline dust
factors of over 100 within a single simulation (Bindle et al., emissions and an updated dust source function with source
2020). strength of 2000 Tg yr−1 . We find better agreement with
measurements, including satellite and AERONET AOD, and
surface dust concentrations. The offline fine-resolution dust
4 Summary and conclusions emissions strengthen the dust emissions over smaller desert
regions. The independence of source strength from simula-
The nonlinear dependence of dust emission parameteriza- tion resolution facilitates evaluation with observations. Sen-
tions upon model resolution poses a challenge for the next sitivity simulations with an annual global source strength of
generation of chemical transport models with nimble capa- either 1500 or 2500 Tg generally degraded the performance.
bility for multiple resolutions. The method explored here to A sensitivity simulation with North American emissions re-
calculate offline dust emissions at native meteorological res-
Geosci. Model Dev., 14, 4249–4260, 2021 https://doi.org/10.5194/gmd-14-4249-2021J. Meng et al.: Grid-independent high-resolution dust emissions (v1.0) 4257
Figure 6. Comparison of modeled and measured seasonally averaged surface dust concentrations at 12 independent globally distributed sites
for the years 1981–2000. Nine sites are in the dust belt across Northern Hemisphere. The remaining 3 sites are relatively close to the weak
dust emission regions in Southern Hemisphere. The results for the simulation using the original dust emissions are shown in blue. The results
for the simulation using updated dust emissions with dust strength of 909 Tg yr−1 are shown in red. The results for the simulation using
updated dust emissions with dust strength of 2000 Tg yr−1 are shown in magenta. The measurements are in black.
duced by 30 % improved the annual mean slope versus obser- README.md file in the GitHub repository. The global high-
vations. Future work should continue to develop and evaluate resolution (0.25◦ × 0.3125◦ ) dust emission inventory is available
the representation of dust deposition and regional seasonal on Zenodo (https://doi.org/10.5281/zenodo.4060248, Meng et al.,
variation. 2020a), containing NetCDF format files of the global gridded
hourly mineral dust emission flux rate. Currently, the dataset
(version1.0) is available for the year 2016. The dataset for other
years since 2014 will be available in future versions.
Code and data availability. The source code for generating the
The base GEOS-Chem source code in version 12.5.0 is avail-
offline dust emissions is available on GitHub (https://github.com/
able on GitHub (https://github.com/geoschem/geos-chem/tree/12.
Jun-Meng/geos-chem/tree/v11-01-Patches-UniCF-vegetation,
5.0, last access: 8 November 2020) and in a Zenodo repository
last access: 8 November 2020) and in a Zenodo repository
(https://doi.org/10.5281/zenodo.3403111, The International GEOS-
(https://doi.org/10.5281/zenodo.4062003) (Meng et al., 2020b).
Chem User Community, 2019). The GEOS-Chem simulation out-
The instructions on how to generate the emission files are in the
https://doi.org/10.5194/gmd-14-4249-2021 Geosci. Model Dev., 14, 4249–4260, 20214258 J. Meng et al.: Grid-independent high-resolution dust emissions (v1.0)
put data and AOD observations used to evaluate the model per- and Particulate Air Pollution, Environ. Sci. Tech. Let., 4, 339–
formance, including MODIS Deep Blue, MODIS MAIAC and 344, https://doi.org/10.1021/acs.estlett.7b00197, 2017.
AERONET AOD, can be accessed via this Zenodo repository Bey, I., Jacob, D. J., Yantosca, R. M., Logan, J. A., Field,
(https://doi.org/10.5281/zenodo.4312944) (Meng et al., 2020c). B. D., Fiore, A. M., Li, Q., Liu, H. Y., Mickley, L.
J., and Schultz, M. G.: Global modeling of tropospheric
chemistry with assimilated meteorology: Model description
Supplement. The supplement related to this article describes the and evaluation, J. Geophys. Res.-Atmos., 106, 23073–23095,
details of the dust emission scheme used in this project, the up- https://doi.org/10.1029/2001JD000807, 2001.
dated high-resolution dust source function and additional figures Bindle, L., Martin, R. V., Cooper, M. J., Lundgren, E. W., East-
described in the main text. The supplement related to this article ham, S. D., Auer, B. M., Clune, T. L., Weng, H., Lin, J.,
is available online at: https://doi.org/10.5194/gmd-14-4249-2021- Murray, L. T., Meng, J., Keller, C. A., Pawson, S., and Ja-
supplement. cob, D. J.: Grid-Stretching Capability for the GEOS-Chem
13.0.0 Atmospheric Chemistry Model, Geosci. Model Dev. Dis-
cuss. [preprint], https://doi.org/10.5194/gmd-2020-398, in re-
Author contributions. RVM and JM conceived the project. JM de- view, 2020.
veloped the dust emission dataset using data and algorithms from Bristow, C. S., Hudson-Edwards, K. A., and Chappell, A.:
DAR, PG, MH, AvD, and MPS. JM prepared the paper with contri- Fertilizing the Amazon and equatorial Atlantic with
butions from all coauthors. All authors helped revise the paper. West African dust, Geophys. Res. Lett., 37, L14807,
https://doi.org/10.1029/2010GL043486, 2010.
Chen, H., Navea, J. G., Young, M. A., and Grassian, V. H.: Het-
erogeneous Photochemistry of Trace Atmospheric Gases with
Competing interests. The authors declare that they have no conflict
Components of Mineral Dust Aerosol, J. Phys. Chem. A, 115,
of interest.
490–499, https://doi.org/10.1021/jp110164j, 2011.
De Longueville, F., Hountondji, Y.-C., Henry, S., and Ozer, P.: What
do we know about effects of desert dust on air quality and human
Disclaimer. Publisher’s note: Copernicus Publications remains health in West Africa compared to other regions?, Sci. Total En-
neutral with regard to jurisdictional claims in published maps and viron., 409, 1–8, https://doi.org/10.1016/j.scitotenv.2010.09.025,
institutional affiliations. 2010.
Drury, E., Jacob, D. J., Spurr, R. J. D., Wang, J., Shinozuka,
Y., Anderson, B. E., Clarke, A. D., Dibb, J., McNaughton,
Acknowledgements. Jun Meng was partially supported by a Nova C., and Weber, R.: Synthesis of satellite (MODIS), aircraft
Scotia Research and Innovation Graduate Scholarship. Ran- (ICARTT), and surface (IMPROVE, EPA-AQS, AERONET)
dall V. Martin acknowledges partial support from NASA AIST-18- aerosol observations over eastern North America to improve
0011. We are grateful to Compute Canada and Research Infrastruc- MODIS aerosol retrievals and constrain surface aerosol concen-
ture Services in Washington University in St. Louis for computing trations and sources, J. Geophys. Res.-Atmos., 115, D14204,
resources. The meteorological data (GEOS-FP) used in this study https://doi.org/10.1029/2009JD012629, 2010.
have been provided by the Global Modeling and Assimilation Of- Eastham, S. D., Long, M. S., Keller, C. A., Lundgren, E., Yan-
fice (GMAO) at NASA Goddard Space Flight Center. We thank tosca, R. M., Zhuang, J., Li, C., Lee, C. J., Yannetti, M., Auer,
Jasper Kok and Longlei Li for providing the compilation of inde- B. M., Clune, T. L., Kouatchou, J., Putman, W. M., Thompson,
pendent surface dust concentrations measurements. We thank the M. A., Trayanov, A. L., Molod, A. M., Martin, R. V., and Ja-
four anonymous reviewers for their constructive comments and sug- cob, D. J.: GEOS-Chem High Performance (GCHP v11-02c):
gestions. All figures were produced with the MATLAB software. a next-generation implementation of the GEOS-Chem chemi-
cal transport model for massively parallel applications, Geosci.
Model Dev., 11, 2941–2953, https://doi.org/10.5194/gmd-11-
Financial support. This research has been supported by the Natural 2941-2018, 2018.
Sciences and Engineering Research Council of Canada, Discovery Fairlie, T. D., Jacob, D. J., and Park, R. J.: The impact of transpacific
Grant(grant no. RGPIN-2019-04670), and the National Aeronautics transport of mineral dust in the United States, Atmos. Environ.,
and Space Administration Science Mission Directorate (grant no. 41, 1251–1266, https://doi.org/10.1016/j.atmosenv.2006.09.048,
AIST-18-0011). 2007.
Fountoukis, C. and Nenes, A.: ISORROPIA II: a computa-
tionally efficient thermodynamic equilibrium model for K+ –
2−
Review statement. This paper was edited by Havala Pye and re- Ca2+ –Mg2+ –NH+ + − −
4 –Na –SO4 –NO3 –Cl –H2 O aerosols, At-
viewed by four anonymous referees. mos. Chem. Phys., 7, 4639–4659, https://doi.org/10.5194/acp-7-
4639-2007, 2007.
Giles, D. M., Sinyuk, A., Sorokin, M. G., Schafer, J. S., Smirnov,
A., Slutsker, I., Eck, T. F., Holben, B. N., Lewis, J. R., Campbell,
References J. R., Welton, E. J., Korkin, S. V., and Lyapustin, A. I.: Advance-
ments in the Aerosol Robotic Network (AERONET) Version 3
Bergin, M. H., Ghoroi, C., Dixit, D., Schauer, J. J., and Shindell, database – automated near-real-time quality control algorithm
D. T.: Large Reductions in Solar Energy Production Due to Dust
Geosci. Model Dev., 14, 4249–4260, 2021 https://doi.org/10.5194/gmd-14-4249-2021J. Meng et al.: Grid-independent high-resolution dust emissions (v1.0) 4259 with improved cloud screening for Sun photometer aerosol op- I., and Torres, R.: Global Iron Connections Between Desert tical depth (AOD) measurements, Atmos. Meas. Tech., 12, 169– Dust, Ocean Biogeochemistry, and Climate, Science, 308, 67– 209, https://doi.org/10.5194/amt-12-169-2019, 2019. 71, https://doi.org/10.1126/science.1105959, 2005. Gillette, D. A.: A qualitative geophysical explanation for hot Keller, C. A., Long, M. S., Yantosca, R. M., Da Silva, A. spot dust emitting source regions, Contributions to Atmospheric M., Pawson, S., and Jacob, D. J.: HEMCO v1.0: a ver- Physics, 72, 67–77, 1999. satile, ESMF-compliant component for calculating emissions Gillette, D. A. and Passi, R.: Modeling dust emission caused in atmospheric models, Geosci. Model Dev., 7, 1409–1417, by wind erosion, J. Geophys. Res.-Atmos., 93, 14233–14242, https://doi.org/10.5194/gmd-7-1409-2014, 2014. https://doi.org/10.1029/JD093iD11p14233, 1988. Kok, J. F., Adebiyi, A. A., Albani, S., Balkanski, Y., Checa- Ginoux, P., Chin, M., Tegen, I., Prospero, J. M., Holben, Garcia, R., Chin, M., Colarco, P. R., Hamilton, D. S., Huang, B., Dubovik, O., and Lin, S.-J.: Sources and distri- Y., Ito, A., Klose, M., Leung, D. M., Li, L., Mahowald, N. M., butions of dust aerosols simulated with the GOCART Miller, R. L., Obiso, V., Pérez García-Pando, C., Rocha-Lima, model, J. Geophys. Res.-Atmos., 106, 20255–20273, A., Wan, J. S., and Whicker, C. A.: Improved representation https://doi.org/10.1029/2000JD000053, 2001. of the global dust cycle using observational constraints on dust Ginoux, P., Prospero, J. M., Gill, T. E., Hsu, N. C., and properties and abundance, Atmos. Chem. Phys., 21, 8127–8167, Zhao, M.: Global-scale attribution of anthropogenic and nat- https://doi.org/10.5194/acp-21-8127-2021, 2021. ural dust sources and their emission rates based on MODIS Kosmopoulos, P. G., Kazadzis, S., Taylor, M., Athanasopoulou, E., Deep Blue aerosol products, Rev. Geophys., 50, RG3005, Speyer, O., Raptis, P. I., Marinou, E., Proestakis, E., Solomos, S., https://doi.org/10.1029/2012RG000388, 2012. Gerasopoulos, E., Amiridis, V., Bais, A., and Kontoes, C.: Dust Guieu, C., Azhar, M. A., Aumont, O., Mahowald, N., Levy, M., impact on surface solar irradiance assessed with model simula- Ethé, C., and Lachkar, Z.: Major Impact of Dust Deposition on tions, satellite observations and ground-based measurements, At- the Productivity of the Arabian Sea, Geophys. Res. Lett., 46, mos. Meas. Tech., 10, 2435–2453, https://doi.org/10.5194/amt- 6736–6744, https://doi.org/10.1029/2019GL082770, 2019. 10-2435-2017, 2017. Hammer, M. S., Martin, R. V., van Donkelaar, A., Buchard, V., Latimer, R. N. C. and Martin, R. V.: Interpretation of measured Torres, O., Ridley, D. A., and Spurr, R. J. D.: Interpreting the aerosol mass scattering efficiency over North America using a ultraviolet aerosol index observed with the OMI satellite in- chemical transport model, Atmos. Chem. Phys., 19, 2635–2653, strument to understand absorption by organic aerosols: implica- https://doi.org/10.5194/acp-19-2635-2019, 2019. tions for atmospheric oxidation and direct radiative effects, At- Liu, H., J. Jacob, D., Bey, I., and Yantosca, R.: Constraints from mos. Chem. Phys., 16, 2507–2523, https://doi.org/10.5194/acp- 210Pb and 7Be on wet deposition and transport in a global three- 16-2507-2016, 2016. dimensional chemical tracer model driven by assimilated mete- Holben, B. N., Eck, T. F., Slutsker, I., Tanré, D., Buis, J. orological fields, J. Geophys. Res.-Atmos., 106, 12109–12128, P., Setzer, A., Vermote, E., Reagan, J. A., Kaufman, Y. https://doi.org/10.1029/2000JD900839, 2001. J., Nakajima, T., Lavenu, F., Jankowiak, I., and Smirnov, Lyapustin, A., Wang, Y., Korkin, S., and Huang, D.: MODIS Collec- A.: AERONET—A Federated Instrument Network and Data tion 6 MAIAC algorithm, Atmos. Meas. Tech., 11, 5741–5765, Archive for Aerosol Characterization, Remote Sens. Envi- https://doi.org/10.5194/amt-11-5741-2018, 2018. ron., 66, 1–16, https://doi.org/10.1016/S0034-4257(98)00031-5, Marais, E. A., Jacob, D. J., Jimenez, J. L., Campuzano-Jost, P., 1998. Day, D. A., Hu, W., Krechmer, J., Zhu, L., Kim, P. S., Miller, Hsu, N. C., Jeong, M.-J., Bettenhausen, C., Sayer, A. M., C. C., Fisher, J. A., Travis, K., Yu, K., Hanisco, T. F., Wolfe, Hansell, R., Seftor, C. S., Huang, J., and Tsay, S.-C.: En- G. M., Arkinson, H. L., Pye, H. O. T., Froyd, K. D., Liao, J., hanced Deep Blue aerosol retrieval algorithm: The sec- and McNeill, V. F.: Aqueous-phase mechanism for secondary or- ond generation, J. Geophys. Res.-Atmos., 118, 9296–9315, ganic aerosol formation from isoprene: application to the south- https://doi.org/10.1002/jgrd.50712, 2013. east United States and co-benefit of SO2 emission controls, At- Huneeus, N., Schulz, M., Balkanski, Y., Griesfeller, J., Prospero, mos. Chem. Phys., 16, 1603–1618, https://doi.org/10.5194/acp- J., Kinne, S., Bauer, S., Boucher, O., Chin, M., Dentener, F., 16-1603-2016, 2016. Diehl, T., Easter, R., Fillmore, D., Ghan, S., Ginoux, P., Grini, Martin, R. V., Jacob, D. J., Yantosca, R. M., Chin, M., and Ginoux, A., Horowitz, L., Koch, D., Krol, M. C., Landing, W., Liu, P.: Global and regional decreases in tropospheric oxidants from X., Mahowald, N., Miller, R., Morcrette, J.-J., Myhre, G., Pen- photochemical effects of aerosols, J. Geophys. Res.-Atmos., 108, ner, J., Perlwitz, J., Stier, P., Takemura, T., and Zender, C. S.: 4097, https://doi.org/10.1029/2002JD002622, 2003. Global dust model intercomparison in AeroCom phase I, At- Meng, J., Martin, R. V., Ginoux, P., Ridley, D. A., and Sul- mos. Chem. Phys., 11, 7781–7816, https://doi.org/10.5194/acp- prizio, M. P.: Global High Resolution Dust Emission In- 11-7781-2011, 2011. ventory for Chemical Transport Models (Version 2020_v1.0), Jaeglé, L., Quinn, P. K., Bates, T. S., Alexander, B., and Lin, J.-T.: https://doi.org/10.5281/zenodo.4060248, 2020a. Global distribution of sea salt aerosols: new constraints from in Meng, J., Martin, R. V., and Ridley, D. A.: Of- situ and remote sensing observations, Atmos. Chem. Phys., 11, fline_Dust_Emissions_SourceCode_2020_v1.0, 3137–3157, https://doi.org/10.5194/acp-11-3137-2011, 2011. https://doi.org/10.5281/zenodo.4062003, 2020b. Jickells, T. D., An, Z. S., Andersen, K. K., Baker, A. R., Berga- Meng, J., Martin, R. V., Hammer, M., van Donkelaar, A., Ginoux, metti, G., Brooks, N., Cao, J. J., Boyd, P. W., Duce, R. A., P., and Ridley, D.: Observations of AOD and GEOS-Chem sim- Hunter, K. A., Kawahata, H., Kubilay, N., laRoche, J., Liss, ulation model output dataset (Version v1.0) [Data set], Zenodo, P. S., Mahowald, N., Prospero, J. M., Ridgwell, A. J., Tegen, https://doi.org/10.5281/zenodo.4312944, 2020c. https://doi.org/10.5194/gmd-14-4249-2021 Geosci. Model Dev., 14, 4249–4260, 2021
4260                                                     J. Meng et al.: Grid-independent high-resolution dust emissions (v1.0)

Park, R. J., Jacob, D. J., Chin, M., and Martin, R. V.: Sources        Tang, M., Huang, X., Lu, K., Ge, M., Li, Y., Cheng, P., Zhu, T.,
  of carbonaceous aerosols over the United States and implica-           Ding, A., Zhang, Y., Gligorovski, S., Song, W., Ding, X., Bi, X.,
  tions for natural visibility, J. Geophys. Res.-Atmos., 108, 4355,      and Wang, X.: Heterogeneous reactions of mineral dust aerosol:
  https://doi.org/10.1029/2002JD003190, 2003.                            implications for tropospheric oxidation capacity, Atmos. Chem.
Park, R. J., Jacob, D. J., Field, B. D., Yantosca, R. M., and            Phys., 17, 11727–11777, https://doi.org/10.5194/acp-17-11727-
  Chin, M.: Natural and transboundary pollution influences on            2017, 2017.
  sulfate-nitrate-ammonium aerosols in the United States: Im-          The International GEOS-Chem User Community: geoschem/geos-
  plications for policy, J. Geophys. Res.-Atmos., 109, D15204,           chem: GEOS-Chem 12.5.0 (Version 12.5.0), Zenodo,
  https://doi.org/10.1029/2003JD004473, 2004.                            https://doi.org/10.5281/zenodo.3403111, 2019.
Pye, H. O. T., Chan, A. W. H., Barkley, M. P., and Seinfeld, J.        Wang, Q., Jacob, D. J., Spackman, J. R., Perring, A. E., Schwarz,
  H.: Global modeling of organic aerosol: the importance of reac-        J. P., Moteki, N., Marais, E. A., Ge, C., Wang, J., and Bar-
  tive nitrogen (NOx and NO3 ), Atmos. Chem. Phys., 10, 11261–           rett, S. R. H.: Global budget and radiative forcing of black car-
  11276, https://doi.org/10.5194/acp-10-11261-2010, 2010.                bon aerosol: Constraints from pole-to-pole (HIPPO) observa-
Ridley, D. A., Heald, C. L., and Ford, B.: North African                 tions across the Pacific, J. Geophys. Res.-Atmos., 119, 195–206,
  dust export and deposition: A satellite and model                      https://doi.org/10.1002/2013JD020824, 2014.
  perspective, J. Geophys. Res.-Atmos., 117, D02202,                   Yu, H., Chin, M., Yuan, T., Bian, H., Remer, L. A., Prospero,
  https://doi.org/10.1029/2011JD016794, 2012.                            J. M., Omar, A., Winker, D., Yang, Y., Zhang, Y., Zhang,
Ridley, D. A., Heald, C. L., Pierce, J. R., and Evans, M. J.: Toward     Z., and Zhao, C.: The fertilizing role of African dust in
  resolution-independent dust emissions in global models: Impacts        the Amazon rainforest: A first multiyear assessment based
  on the seasonal and spatial distribution of dust, Geophys. Res.        on data from Cloud-Aerosol Lidar and Infrared Pathfinder
  Lett., 40, 2873–2877, https://doi.org/10.1002/grl.50409, 2013.         Satellite Observations, Geophys. Res. Lett., 42, 1984–1991,
Ridley, D. A., Heald, C. L., Kok, J. F., and Zhao, C.: An ob-            https://doi.org/10.1002/2015GL063040, 2015.
  servationally constrained estimate of global dust aerosol            Yu, Y., Kalashnikova, O. V., Garay, M. J., Lee, H., and No-
  optical depth, Atmos. Chem. Phys., 16, 15097–15117,                    taro, M.: Identification and Characterization of Dust Source Re-
  https://doi.org/10.5194/acp-16-15097-2016, 2016.                       gions Across North Africa and the Middle East Using MISR
Sayer, A. M., Munchak, L. A., Hsu, N. C., Levy, R. C.,                   Satellite Observations, Geophys. Res. Lett., 45, 6690–6701,
  Bettenhausen, C., and Jeong, M.-J.: MODIS Collection 6                 https://doi.org/10.1029/2018GL078324, 2018.
  aerosol products: Comparison between Aqua’s e-Deep Blue,             Zender, C. S., Bian, H., and Newman, D.: Mineral Dust En-
  Dark Target, and “merged” data sets, and usage recom-                  trainment and Deposition (DEAD) model: Description and
  mendations, J. Geophys. Res.-Atmos., 119, 13965–13989,                 1990s dust climatology, J. Geophys. Res.-Atmos., 108, 4416,
  https://doi.org/10.1002/2014JD022453, 2014.                            https://doi.org/10.1029/2002JD002775, 2003.
Schepanski, K., Tegen, I., and Macke, A.: Comparison of satellite      Zender, C. S., Miller, R. L. R. L., and Tegen, I.: Quan-
  based observations of Saharan dust source areas, Remote Sens.          tifying mineral dust mass budgets: Terminology, con-
  Environ., 123, 90–97, https://doi.org/10.1016/j.rse.2012.03.019,       straints, and current estimates, Eos, 85, 509–512,
  2012.                                                                  https://doi.org/10.1029/2004EO480002, 2004.
Shao, Y., Raupach, M. R., and Findlater, P. A.: Effect                 Zhang, L., Kok, J. F., Henze, D. K., Li, Q., and Zhao,
  of saltation bombardment on the entrainment of dust                    C.: Improving simulations of fine dust surface concentra-
  by wind, J. Geophys. Res.-Atmos., 98, 12719–12726,                     tions over the western United States by optimizing the par-
  https://doi.org/10.1029/93JD00396, 1993.                               ticle size distribution, Geophys. Res. Lett., 40, 3270–3275,
Tagliabue, A., Bowie, A. R., Boyd, P. W., Buck, K. N.,                   https://doi.org/10.1002/grl.50591, 2013.
  Johnson, K. S., and Saito, M. A.: The integral role
  of iron in ocean biogeochemistry, Nature, 543, 51–59,
  https://doi.org/10.1038/nature21058, 2017.

Geosci. Model Dev., 14, 4249–4260, 2021                                                 https://doi.org/10.5194/gmd-14-4249-2021
You can also read