Portsmouth Climate Change Risks

2040 - 2100

Portsmouth Climate Action Board
March 2021
←
→
Page content transcription
If your browser does not render page correctly, please read the page content below
Portsmouth Climate Change Risks 2040 - 2100 Portsmouth Climate Action Board March 2021

Contents

1.0 Introduction
        1.1 Global context
        1.2 Regional context

2.0 Built environment
       2.1 Flooding
       2.2 Heat

3.0 Natural environment
       3.1 Green space
       3.2 Biodiversity
       3.3 Water

4.0 Residents
       4.1 Health
       4.2 Wellbeing
       4.3 Air quality

5.0 Economy
       5.1 Productivity
       5.2 Infrastructure and buildings
       5.3 Tourism
       5.4 Global supply

6.0 Conclusion
       6.1 COVID-19
       6.2 Concluding remarks
The gas is on full, but the kettle takes a few minutes to boil. We're
  still waiting for the earth to start simmering, but by 2020 the
                      bubbles will be appearing.
                      -Tim Radford, 2004
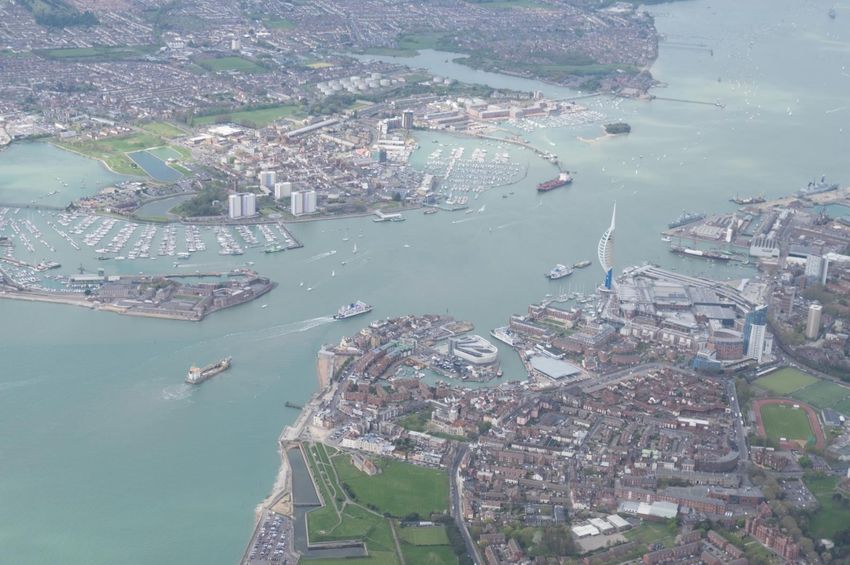
Executive summary
Built environment
Portsmouth is a flat and condensed city; it is one of the only two island cities in Europe and
is the second most densely populated city in the UK. This makes Portsmouth uniquely
vulnerable to extreme weather events. If CO2 continues to be emitted at its current rate the
sea surrounding Portsmouth is likely to rise by 0.37m to 0.59m by 2059. While new sea
defences are due to be constructed, they could struggle to protect the city if carbon
emissions are not curtailed.

By 2050 the maximum average summer temperature is forecasted to increase by 3-5°C. The
dense urban environment makes Portsmouth particularly vulnerable to high levels of heat.
The abundance of concrete means that heat from the sun is readily absorbed. Combined
with the additional human activity in a densely populated area, Portsmouth is vulnerable to
prolonged and intense heat waves.

Natural environment
Green space and trees play an important role in cooling the urban environment and
mitigating the impact of flooding. Green space in Portsmouth is sparse, particularly in lower-
income areas, with a canopy cover of just 9.8%. Increasing heat will worsen this situation if
drought starts to erode green space. As one of the most southern cities in the UK, and home
to a major international port, Portsmouth will also be at risk to the introduction of vector-
borne diseases from mosquitoes and invasive species.

Residents
By 2050 higher temperatures will have an increasing impact on vulnerable residents; this will
include those over 65 (born before 1985), those living in poor health and the socially isolated.
This will be exacerbated by the already high levels of air pollution. If the city continues to
maintain and increase its car use, by 2050 thousands of residents will have died from
cardiovascular and respiratory conditions linked to air pollution.

Economy
Shopping districts, institutions and businesses are already at risk of flooding in Portsmouth,
with an approximate 1% chance each year, or 25% chance over 30 years. Several train
stations, roads and transport hubs are equally at risk of flooding. The immediate cost of a
flood event in Portsmouth could be devastating. Business properties and assets could be
destroyed while supply chains in and out of the city, and the ability of workers to enter and
leave the city, could be affected for some time afterwards. In the long term, the constant
threat of a major flooding event could adversely affect the value of both business and
residential properties in the city.
1.0 Introduction
The world is complex, interconnected and volatile; each decision has a bearing on
predictions for the future. Risk assessments for climate change tend to assume that some
sort of action will be taken in the future to alleviate climate risks. The extent to which these
mitigation efforts will be successful is hard to predict. It relies on determining the global
political, economic, technological and sociological developments over the next 50 years; this
would be far beyond the scope of this report. Therefore this risk assessment focuses upon
the situation right now, not what we could, should or may plan to do in the future. The report
looks at the current climate risks in Portsmouth and extrapolates how these risks will
intensify. The scientific modelling and projections are clear that current climate risks will
become more intense if we do not reduce our emissions. However, the exact year these risks
will occur, and the level of intensity, is not clear. To mitigate these risks all governments,
institutions, businesses and citizens will need to take action to reduce carbon emissions.

1.1 Global context
The Intergovernmental Panel on Climate Change1 (IPCC) has warned we have until 2030 to
prevent global temperatures exceeding 1.5°C above pre-industrial levels (the mean
temperature between 1850 and 1900). To achieve this, global carbon emissions will need to
almost halve between 2010 and 2030, and reduce to net zero by 2050. If the Earth's
atmosphere exceeds this temperature the risk of climate disasters will increase exponentially.
Intense storms, extensive flooding, extreme heat and drought will happen much more
frequently1. If we do not take action to reduce our emissions by 2050 major cities like
Portsmouth could look drastically different. The one hundred million car trips2 taken in
Portsmouth each year would continue to worsen air pollution. Consequently, the air
pollution could force residents to avoid exercising outside during the summer months3. The
chances of a catastrophic flood striking Portsmouth will continue to increase; which could
leave tens of thousands of residents' homeless and businesses destroyed. Extreme heat
could exacerbate existing health conditions leading to hundreds of heat related casualties.

The urgency of this situation has been reflected in the term 'climate emergency', which
conveys the existential threat climate change poses both to ourselves and future
generations. The nature of this emergency means we need to take immediate action to avert
irreversible harms. The imperative of this target is compounded by the risk of climate
feedback loops. The Earth is a complex and interconnected system; each action has an
impact on countless events and processes 4. For example, while the Earth's oceans absorb
about 30% of CO2, the warming of the ocean itself damages vital carbon absorbing
organisms5.

1
    The IPCC was formed by the United Nations and works to coordinate work from scientists around the world.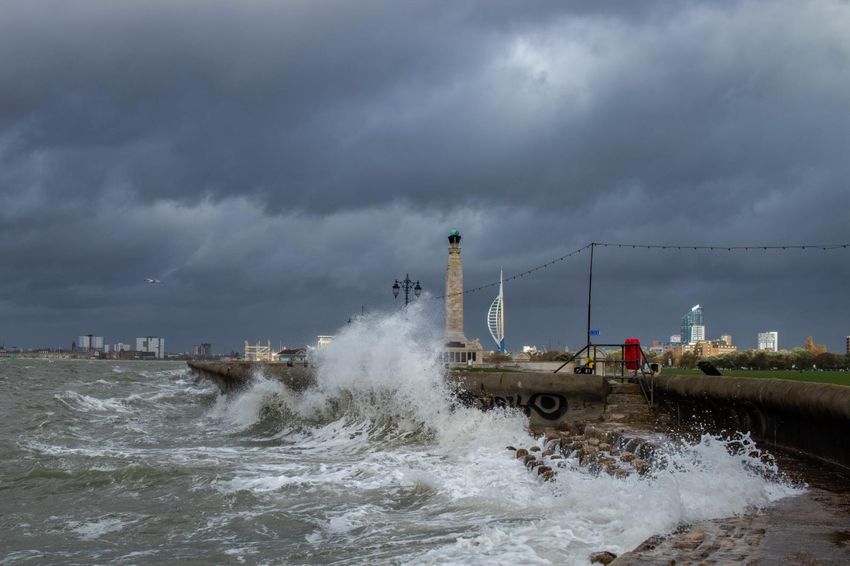
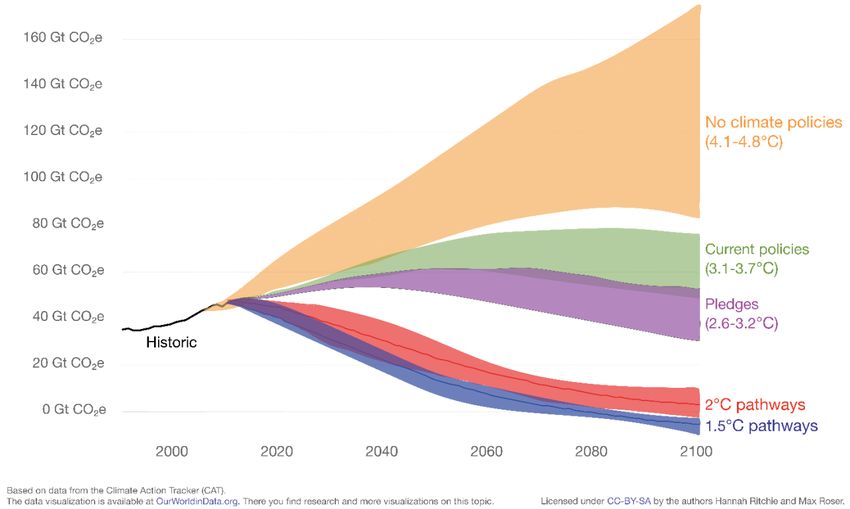
Figure 1 - Projections sourced from the Committee on Climate Change (CCC)
It is therefore unclear if the same level of carbon absorption will continue if the temperature
of the ocean increases. For this reason, there is a risk that feedback loops could lead to a
tipping point in which the climate warms exponentially and the damage to the climate is
irreversible6. Inertia in the Earth’s climate system also means that, even if carbon emissions
were to stop today, temperatures will continue to rise in the immediate future 7. It is therefore
imperative that we stop emitting carbon as soon as possible and prepare for a changing
climate.

To address this global and existential threat in 2015 political leaders signed The Paris Climate
Agreement. The Paris Climate Agreement proposes an international carbon reduction plan,
which aims to keep the global average temperature below 1.5°C8. While countries are
commended for signing up to the agreement, the international community is not on track
to meet its long-term climate targets9. Consequently, the global temperature is likely to
reach 3-4°C warming in 80 years; far exceeding the target of

Portsmouth have not yet made significant changes to their lives to reduce carbon emissions.
For instance, the emissions from transport in Portsmouth have remained constant for almost
10 years. Despite Portsmouth being one of the most condensed, flattest and temperate cities
in the UK; transport emissions in 2017 were higher than larger cities like Southampton,
Brighton and Oxford.

                            Portsmouth emission sectors 2005-2017 (BEIS)
             450.0

             400.0

             350.0

             300.0

             250.0
   Kt 17.7

             200.0

             150.0

             100.0

              50.0

                 -
                     2005    2006   2007   2008   2009    2010    2011    2012   2013   2014      2015   2016   2017
                                                                   Year
                        Industry and Commercial Electricity                Industry and Commercial Gas
                        Industrial and Commercial Other Fuels              Domestic Electricity
                        Domestic Gas                                       Road Transport

Figure 3 - BEIS: CO2 emitted within the city boundaries (scope 1) and from the national grid (scope 2).

                            Portsmouth greenhouse gas emissions (Kt 17.7
                                                e) 2017
                               Stationary energy Transportation Waste

                                                      17.7

                                            350.1

                                                                 682 .1

Figure 4 - SCATTER Cities: Greenhouse gases emitted within the city boundary (scope 1) from the national
grid (scope 2) and sites outside of the city (scope 3).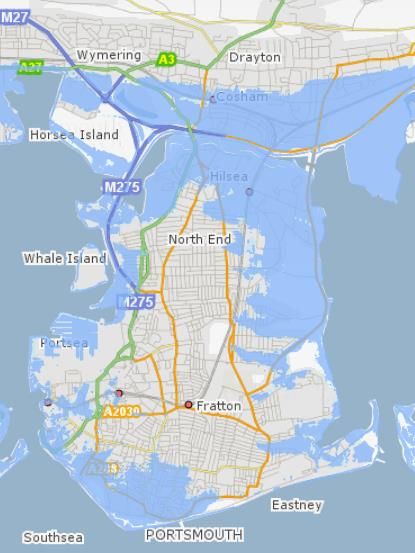
2.0 Built environment
2.1 Flooding
Portsmouth is the second most densely populated city in the UK; with 5,724 people per km²,
90,000 dwellings, 7,500 businesses and 65,000 sqm of employment space. As an island city
we are limited in our ability to relocate away from areas at risk of flooding. Flooding will not
only impact local people and businesses, the city is also home to major industries in
aerospace, defence, maritime and tourism. There are numerous important assets
concentrated on our small and exposed island city.
© Ordnance Survey - data derived from OS Premium.
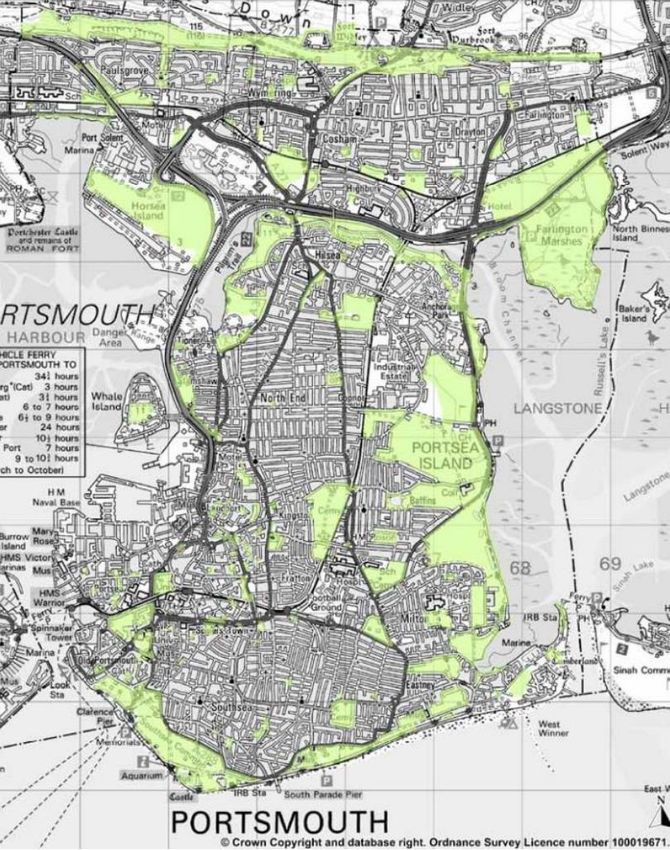
Figure 5 - Partnership for Urban South Hampshire: Projected flood risk zones for the year 2055 15
As an island city the most noticeable risk to Portsmouth is the rising sea level. Since 1900
the mean sea level around the UK has risen by about 16cm. It is predicted that the sea level
will rise by 0.37m to 0.6m16 in the 2050s and by 1m in 100 years17. However, in a worst case
scenario the sea level could rise by over 1.4m 18 in the 2080s, that is, if we take no action to
tackle climate change and climate feedback loops intensify19. Similarly, extreme wave height
is predicted to increase by 5% by 2050 and 10% by 2080. For this reason over £100 million
is being spent improving the sea defences in Portsmouth. This is an ambitious and far
reaching project which should be commended for its scope. However, while the sea defenceswill significantly improve our resilience, their effectiveness will be undermined if we do not reduce our carbon emissions. If we continue to emit carbon at our current rate, the new sea defences surrounding Portsmouth could struggle to withstand the sea level height by 2080 20. Our existing sea defences are prepared for a 1 in 100 year flood event, in which multiple factors coordinate to cause a surge in the water level; for example a high tide, strong winds and heavy rain. The 1 in 100 year terminology equates to a 1% chance of a major flood event happening in Portsmouth every year; however this does not mean that it is only likely to happen once in 100 years. Over 30 years there is an approximate 25% chance of a 1 in 100 year flood event occurring. For example, Somerset suffered a 1 in 100 year flood in both 2012 and 2014. The new sea defences in North Portsea are designed to withstand a 1 in 500 year flood event; the planned Southsea defences are designed to provide protection against a 1 in 200 year flood event until 2115 21. Unfortunately, climate change makes flooding predictions incredibly difficult. Overtopping, heavy rain and storm events can cause even the most robust defences to fail. The US city of Houston has been hit by three 1 in 500 year flood events in three years22, while Ellicott City in Maryland has suffered from two 1 in 1000 year flood events in two years23. We are already seeing more frequent and powerful storms; the UK has experienced a major flood almost every year since 2007 24. These intense storms could strike the UK with increasing frequency in the future, a 1 in 100 year flood event could become a 1 in 50 year flood event within the next century if we do not reduce our carbon emissions25. While the rising sea level is one of the most noticeable threats, rainfall can cause similarly damaging flood events. Since 2010 both summers and winters in the UK are over 12% wetter; compared to the 1961-1990 period26. Because warmer air holds more water vapour the rainfall in Portsmouth will continue to increase; however, this will not be gradual or evenly distributed across the month. It is expected that shorter heavier events of rain will increase the risk of flash floods; by 2050 the intensity of rainfall is expected to increase by up to 20%. Despite the precautions and work implemented by Portsmouth City Council and Southern Water; the low topography of Portsmouth makes surface water flooding a particular issue. The south of the island was previously muddy marshland; also known as the Great Morass. This wet marshland was drained in 1886; however, the bowl like shape leaves a residual risk of flooding from rainfall (see figure 5). Portsea Island is also bounded by the sea, so flood water will not drain away easily. 2.2 Heat The MET Office has reported that the UK’s ten hottest years on record have all happened since 200227. Days of extreme heat in South East England have also risen from once every 1000 days to as often as once every 200 days 28. The increase in temperature is continuing, with 2019 recording both the highest summer temperature (38.7°C) and winter temperature (21.2°C) on record29. Portsmouth's dense urban environment is particularly susceptible to increased levels of heat, this is because of the urban heat island effect. The centre of a built urban area can be several degrees warmer than the surrounding rural areas. This additional heat is caused by a combination of human activity and the presence of buildings in close proximity. The lack of green space and canopy cover means that heat from the sun is more readily absorbed by the urban fabric; like concrete, tarmac and stone. These factors
combined contribute to the urban heat island effect and therefore increased temperatures
in cities like Portsmouth.

Figure 6 - The Economist: Global projected temperature change under low (RCP* 2.6), medium (RCP 4.5), high
(RCP 6.0) and business as usual (RCP 8.5) emissions scenarios to 2100.

*The Representative Concentration Pathways (RCP) show scenarios resulting from different
atmospheric concentrations of CO2. The scenarios provide a standardised projection for
future climate pathways to 2100. RCP 2.6 shows the projection if there is a major turnaround
in climate policies within the next few years. RCP 4.5 assumes emissions will peak around
2050 and then stabilise. RCP 6.0 assumes that emissions will peak around 2080. RCP 8.5
shows a similar trajectory to our current pathway, that is, CO2 emissions continue to grow
and are not curtailed.
Figure 7 - Projections sourced from the Environment Agency: Climate Impacts Tool. These values show the
national averages consistent with a 4°C rise in global mean temperature by 2100. *The sea level relative to
1900 is an approximation.
3.0 Natural environment
3.1 Green space
Trees and green space play an important role in cooling the urban environment and
mitigating flood risk. Firstly, trees provide shade for people, buildings and surfaces. Secondly,
trees and greenery reduce the air temperature through a process called evapotranspiration
(evaporation and transpiration). When the sun's rays hit a trees leaves it causes stored water
to evaporate. Evapotranspiration therefore cools the plant and surrounding area, in a similar
way to how sweating cools the human body. Thirdly, trees help to mitigate flooding; 1.3
million trees can 'catch' about 7 billion tonnes of rainwater30.

The current tree canopy cover in Portsmouth is 9.8% 31; this is low relative to similar cities like
Southampton (18.5%32), Plymouth (18%33) and London (21%34). Figure 8 shows the protected
open spaces in the city; excluding cemeteries, there is sparse coverage in the centre of the
island. There is also a general correlation between lower-income areas and an absence of
green space. As mentioned, the lack of green space contributes to the urban heat island
effect. This lack of greenery in lower-income areas could therefore exacerbate the impact of
climate change on those least able to afford to mitigate it.

Figure 8 - Portsmouth City Council: protected open spaces in Portsmouth35
Because of the minimal amount of farming taking place in the city, climate change is unlikely
to have a significant impact on agriculture in Portsmouth. However, there could be impacts
on national and global agriculture which could impact the availability of food36. Global
transport routes are likely to become increasingly disrupted. This could lead to increases in
food prices in Portsmouth, which will disproportionately impact those in lower-income
groups.

3.2 Biodiversity
The milder winters, hotter summers and more extreme weather will have a direct impact on
biodiversity in Portsmouth. Increased heat could lead to greater instances of drought and
less water available for vegetation. This would lead to a shift in species composition as the
local wildlife would need to adapt to less hospitable conditions. The change in species
composition could also be affected by invasive species from continental Europe. Increased
temperatures are already allowing more mosquitoes and ticks to enter the UK37. This also
increases the risk of new vector-borne diseases entering the UK including Zika, dengue, West
Nile fever and Chikungunya38. Portsmouth's geography, as one of the most southern points
of the UK, means it could be at the forefront of species arriving from continental Europe. The
climate is not the only factor that could increase the presence of mosquitos in Portsmouth.
Shipping and the movement of goods provides an opportunity for mosquitoes to travel into
Portsmouth through the international port 39.

3.3 Water
The average Portsmouth Water customer consumes 140 litres of water a day 40. Most of the
water supply relies on groundwater, springs and rivers. A warming climate will impact these
supplies by reducing the amount of groundwater through evaporation and reducing river
flows. By 2079 rainfall in south east England could decrease by 40% during the summer
months. Portsmouth has the cheapest water in England and Wales and most customers are
not charged by the amount of water they use. As the water is cheap, and use of water meters
low, there is no real incentive for residents to reduce their water usage. The warming climate
will increase the demand for water from people, wildlife and the natural environment. The
access to cheap water could therefore make it difficult to change resident's behaviour in
response to a warming induced drought.
4.0 Residents
4.1 Health
In 2003 there were over 2000 heat related deaths across the UK in just 10 days, this is
expected to more than double to 7000 deaths a year by 2050 41. In recent years there has
been a linear relationship between temperature and mortality rate; with an estimated 75
extra heat deaths a week for each degree of increased temperature 42. By 2040 it is predicted
that intense heat waves could strike every other year. If we continue emitting carbon dioxide
at our current rate, by 2060-2079 summer temperatures could increase by 3-4°C. While this
may seem like a small amount this will push far more days to exceed the heat wave threshold
(32°C during the day and 18°C during the night). Residents over 65 (born before 1985), those
living in poor health and the isolated will be most susceptible to heat deaths by 2050.
However, part of this increased risk is attributable to increased air pollution and its effect on
respiratory illnesses.

Southern England is predicted to be one of the regions most impacted by increased UV
radiation. This increase will be exacerbated by climate change and could increase the rates
of melanoma by 20% by 208043. Children are the most at risk to UV radiation both in
increased risk to skin cancer and damage to the cornea and lens of the eye44. Workers
engaged in outdoor occupations are also likely to be at a greater risk of heat stress and UV
exposure. This will therefore disproportionately impact lower income groups in the
community.

A positive aspect of the higher temperatures will be warmer winters. Days which will require
heating in the home (those below 18°C) in south England are projected to reduce by 50% in
2080 compared to the 1961-1990 period. This should reduce the amount of winter deaths
and reduce the heating energy demand in the city. Likewise, the warmer weather could make
physical activity more appealing, however this would likely be offset by increased air
pollution, motor traffic and UV radiation45.

4.2 Wellbeing
The disruption and displacement caused by extreme weather events will have a significant
and long-lasting impact on residents. This will range from the immediate psychological
stress from the event and the ongoing stress from being displaced. Living in an area with an
increased risk of flooding could also cause financial stress for residents. The risk of flooding
could make the area less attractive for investment and residency; consequently the value of
houses would decrease.
Since 2016 UK homeowners have been protected by the Flood Re insurance scheme. Flood
Re was setup up in 2016 by the government to subsidise flooding insurance for properties
in flood risk areas. While the scheme has helped to keep insurance affordable the scheme is
due to be discontinued in 2039; at which time flooding insurance will be charged at the full
market price. This could lead to economic hardship for thousands of people in Portsmouth
if they cannot afford the higher insurance premiums. House prices could also decrease as
more people recognise the threat posed by climate change and rising sea levels.
4.3 Air quality
Increased heat will worsen air pollution in the city. Heatwaves are typically accompanied by
smog, which can lead to higher concentrations of nitrogen dioxide and particulate matter 46.
Similarly, heatwave conditions and sunlight increase the levels of ground-level ozone. While
stratospheric ozone helps to protect the planet from UV rays; at the ground level reactions
with pollutants make it damaging to human health47. The risk to those with health conditions
in the city; like asthma, cardiovascular diseases, hay fever and other allergies, will therefore
increase. This could lead to an increase in respiratory and cardiovascular mortality for
residents in Portsmouth. Portsmouth already experiences higher incidence of several health
conditions compared to the national average (see figure 9). Almost 100 deaths a year in
Portsmouth can already be attributed to NO2 air pollution alone. The impact of air pollution
on mortality and morbidity is only likely to increase while the city's residents are reliant on
motor vehicle transport.

                             England                      Brighton
   Health condition                          Oxford                      Southampton         Portsmouth
                             average                      & Hove
 Percentage of adults
 classified as
 overweight or obese           62.3%         48.9%          50.5%             63.7%             66.5%
 (2018-2019)
 Fraction of mortality
 attributable to
                               5.2%           5.9%           5.8%             6.1%               6.7%
 particulate air
 pollution (2018)
 Mortality rate for
 under 75s from all          71.7 per       66.9 per       71.7 per         80.3 per           85.1 per
 cardiovascular              100,000        100,000        100,000          100,000            100,000
 diseases (2016-2018)
 Number of people
 killed or seriously         42.6 per       35.6 per       55.9 per          45.8 per          52.3 per
 injured on roads            100,000        100,000        100,000           100,000           100,000
 (2016-2018)
 Number of people
 killed on roads while       0.16 per        0 per          0 per             0 per            0.93 per
 cycling (2018)              100,000        100,000        100,000           100,000           100,000

 Percentage of people
 exposed to transport
 noise of 55 dB(A) or                         *not
                               8.5%                          8.9%             10.7%             14.9%
 more during the                            recorded
 night-time (2016)

Figure 9 - Figures sourced from Public Health England48, the Department for Transport49 and the Office for
National Statistics50
While everyone in the city has to breathe the same air, air pollution and climate change will
disproportionately impact lower-income communities. Figure 9 not only shows the health
conditions that could worsen with increased heat, but also the issues of inequality in the city.
While Portsmouth is geographically ideal for walking and cycling, figure 9 shows how
dangerous the roads can be for vulnerable road users. Likewise, motor vehicle traffic is one
of the main contributors to air pollution and disproportionately impacts lower-income areas.
This is despite lower-income groups being significantly less likely to own a car than medium
and higher income groups. Lower-income households are also less able to make adaptations
to their homes structure or purchase additional devices, like air conditioning units, to
alleviate extreme heat. Although transport noise will disrupt sleep and wellbeing; lower-
income households are still more likely to open their windows to cool their homes, which
could increase their exposure to air pollution 51. Conversely the effect of higher income
households installing air conditioning will increase the overall heat of the city. This is because
the warm air exhausted by air-conditioning units will increase the air temperature,
contributing to the urban heat island effect52.
Census data © Crown Copyright Office of National Statistics.
Contains Ordnance Survey data © Crown copyright & database right 2014-5.
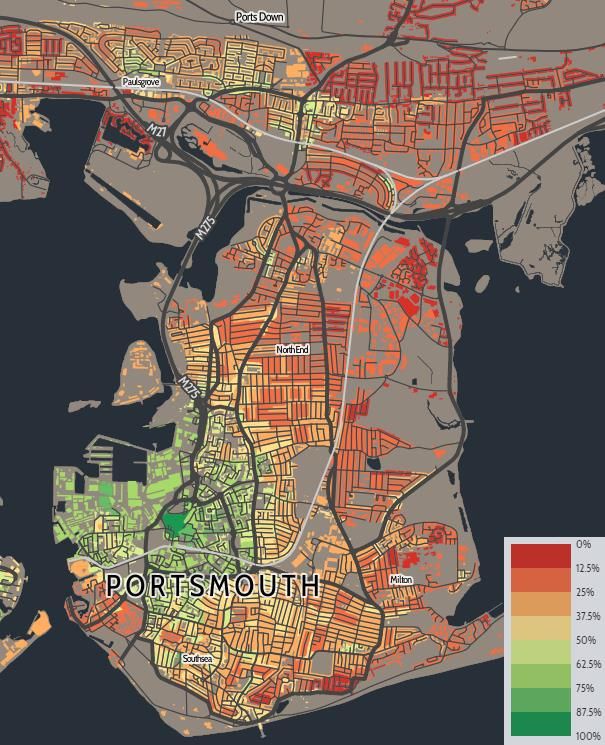
Figure 10: Map showing areas by car or van ownership based on the 2011 census; green colouring shows
areas where the majority of households do not own a car or van 53.5.0 Economy
5.1 Productivity
One of the direct impacts on businesses in the city if temperatures increase is reduced
productivity. Productivity in workers can decrease by 5% once temperatures reach 28°C, with
higher temperatures further lowering output 54. As well as decreased productivity higher
temperatures increase absenteeism. A 1°C ten-day average increase in temperature can
increase absenteeism by up to 5%55. While air conditioning could be utilised to mitigate
some of these issues, it is an expensive and energy intensive utility. As mentioned, the
emissions and heat caused by air conditioning units will further contribute to the urban heat
island effect; and has a minimal impact on reducing absenteeism.

Figure 11 - McKinsey & Company: The impact of heat on outdoor labour productivity. *Wet-bulb temperature
indicates the temperature felt when damp skin is exposed to the air.

For the past 100 years Portsmouth has benefited from a relatively stable and temperate
climate. There have been instances of storms and flooding, however these have not been
frequent enough to cause catastrophic disruption. Therefore supply chains and business
procedures are able to prioritise efficiency over resilience. While these efficient systems have
benefitted the city they have not been optimised for high levels of strain. Consequently,
climate change could cause widespread and frequent disruption56. This additional strain on
supply chains will cause a range of knock-on effects throughout the local economy.

While larger companies are beginning to prepare for climate risks, most businesses in
Portsmouth are small and medium-sized enterprises (SMEs); with 89% employing fewer than
10 employees57. SMEs are less likely to have produced a business continuity plan for an
extreme weather event58. The most common reason is that the cost of producing a business
continuity plan often outweighs the immediate benefit of conducting one 59. Consequently,
SMEs frequently rely solely on their insurance cover 60. However, the extent of cover for
extreme weather events needs to be considered in detail to ensure the policy holder is fully
protected.

5.2 Infrastructure and buildings
Like homes, businesses in Portsmouth will be affected by the increased cost of protecting
their properties against flooding. It could become increasingly difficult to insure against
flooding as policy costs increase and flooding becomes more frequent. Major shopping
districts (like Palmerston Road, Albert Road and Gunwharf Quays), institutions and
businesses (like the University of Portsmouth, Lakeside North Harbour, and Hilsea Industrial
Estate) are likely to face a residual risk of flooding if carbon emissions continue to increase.
Flooding could also cause damage and disruption to core infrastructure links; this could
include railway stations like Portsmouth Harbour, Portsmouth & Southsea, Hilsea and
Cosham. As an island city Portsmouth is at a particular risk to traffic and transport disruption.
Two of the three main roads connecting the island to the mainland are located in flood
zones. This could result in significant disruption to supply chains entering and leaving the
city. This would include the restriction of access for commuters, businesses and residents,
which averages approximately 90,000 trips a day into the city 61.

Figure 12 - McKinsey & Company: The impact of floodwater on a UK train station, based on the average cost
of a new-build train station. *$20 million equates to approximately £15 million.
5.3 Tourism
Portsmouth hosts hundreds of thousands of tourists each summer, the increased
temperatures could therefore provide a short-term boost to this industry. However, this
increased temperature will affect the whole of Europe; therefore it is difficult to predict the
long term impact on tourism in the city. For example some models have predicted that by
2080 the south of England will have a reduced market share from both international and
domestic tourists; while Scotland, Wales and northern England will increase their share 62. The
positive effects of warmer weather could also be counteracted by increased rainfall. Extreme
weather events would become more frequent if the global temperatures increase; tourists
may therefore become less willing to seek a long stay in the city.

5.4 Global supply
If carbon emissions continue at their current rate there will be a serious reduction in global
economic growth and a possible decline by 2050. By 2030 the reduction in productivity from
heat alone is predicted to cost the global economy over £1.5 trillion63. The economic impact
will be felt in some regions of the world by 2030, parts of the developing world are already
being affected now.

Figure 13 - Ministry of Defence: The impact of different rates of warming on the global economy (data sourced
from the International Climate Initiative)

Climate change will have far reaching, and difficult to predict, global consequences. Intense
storms and rising sea levels could disrupt global shipping and transportation. Rising
temperatures could lead to railway lines buckling and tarmac melting on roads. Flooding
could affect the use of roads, tunnels and railway lines across the globe 64. Further political
upheaval could lead to a scarcity of resources and chokepoints on major trade routes, which
will further disrupt supply chains. There are a range of businesses operating in Portsmouth
and each will be affected differently by these global disruptions. From the local independent
businesses struggling to insure their properties and attract custom, to global enterprises
facing a shortage of parts in their supply chains. The knock-on effects could be similar to
other economic shocks including a reduction in sales and custom, and an increase in
unemployment.
6.0 Conclusion
6.1 COVID-19
While this report was being prepared the world was overwhelmed by a deadly pandemic.
Millions of people have been infected with COVID-19 and hundreds of thousands of people
have died. The UK has been one of the worst effected countries with over 100,000 deaths
directly attributed to the virus65. By 30th July 2020 the UK recorded the third most deaths in
the world, and the most deaths in Europe, as a direct result of COVID-1966. Although the UK
has world class universities, cutting-edge research facilities, modern and efficient
infrastructure and a stable government; the COVID-19 pandemic has caused widespread
disruption.
The COVID-19 pandemic has shown that even a predictable event can devastate the most
prepared and resilient countries. Less than six months before the outbreak of COVID-19 the
UK was ranked as the second most prepared country in the world for a global pandemic67.
At the end of March 2020 the government's Scientific Advisory Group for Emergencies
(SAGE) stated that a reasonable worst-case scenario could see 50,000 deaths (caused as a
direct result of COVID-19) between 30th March and September 202068. It is therefore
prudent to consider the worst-case scenario when preparing for a disaster, as opposed to
focusing only on the most likely scenario.

The sudden impact of the COVID-19 pandemic, and the changes we were forced to adopt,
demonstrate the difficulty in predicting future risks. In our interconnected and globalised
society even the smallest changes can impact countries across the world. The complexity of
nature means that we will continue to be exposed to unknowable threats. Likewise human,
political and societal changes will change the trajectory of even the most thorough and
accurate climate models. The changes made throughout the near-global lockdown may help
to reduce global CO2 emissions over the long-term. Conversely, the economic recovery, and
the will of political leaders, may undo years of climate agreements and treaties.

COVID-19 in itself has caused a major health crisis, but it has also exposed numerous health
inequalities across the UK. The elderly, vulnerable and those living in lower-income areas are
most at risk from COVID-1969. As discussed throughout this report, those most at risk to
COVID-19 are similarly at risk to the harmful effects of climate change. Action will need to
be taken to improve health outcomes and wellbeing for all parts of the city. We cannot keep
working to the status quo, the city will have to show leadership and prioritise actions which
will benefit all residents of Portsmouth.

Climate change could have a similar impact as other natural disasters like pandemics,
earthquakes and volcanic eruptions70. For thousands of years humans had to prepare for the
worst, and hope for the best, when confronting these threats. However, climate change is
different as we have direct control over its severity. We can make changes to the way we live
our lives and the questions we ask of our leaders. The COVID-19 pandemic demonstrates
the fragility of our society, but also our resilience and propensity to adapt. Despite the bleak
outlook, and the challenges that lie ahead, the people of Portsmouth have shown that they
can adapt to the most disruptive and challenging events.
6.2 Concluding remarks
This risk assessment has outlined some of the reasonable worst-case scenarios which could
impact Portsmouth over the next few decades. By focusing on an intermediary between the
most-likely scenario and the worst-case scenario, this assessment seeks to prompt action
over deliberation. Too much faith in the most-likely scenario can lead to complacency and
inaction. Whereas naïve uncertainty can lead to despair and inaction. Therefore the value of
this risk assessment lies not in the accuracy of its forecast, but in the extent to which it
provokes action and progress.

Throughout this assessment it has been made clear that the future is chaotic and
unpredictable. There are no preordained pathways, the future is determined by the actions
we all take each day; this is particularly true for climate change. The decisions and actions
we take over the next decade will lay the foundations for all subsequent generations. It is for
this reason that climate change is such a distinct threat. The IPCC has stated we need to
halve our emissions by 2030 to prevent some of the most catastrophic climate impacts. While
this is a relatively simple target, to achieve it will require changes across all parts of society.
This will include each person making changes to their day to day lives; from using their cars
less to heating their homes more efficiently. It will include employers and businesses
accounting for their impact on the climate as well as their profit. Importantly, it will include
decisions makers; who will need to lead by example and implement changes which will
benefit not only today's society, but future generations as well.
A society grows great when old men plant trees under whose shade
                            they know they will never sit.

                               - Ancient Greek proverb

References
1
  European Strategy and Policy Analysis System (EPSAS), Global Trends to 2030,
http://espas.eu/orbis/document/global-trends-2030-can-eu-meet-challenges-ahead
2
  Google, Environmental Insights Explorer,
https://insights.sustainability.google/places/ChIJ6fEUGKRCdEgReTs3A-qDtkU/transportation
3
  Figueres. C and Rivett-Carnac. T, The Future We Choose: Surviving the Climate Crisis,
https://www.penguinrandomhouse.com/books/623543/the-future-we-choose-by-christiana-figueres-
and-tom-rivett-carnac/
4
  The Royal Society, Feedbacks on climate in the Earth system,
https://royalsocietypublishing.org/doi/10.1098/rsta.2014.0428
5
  Science, The Oceanic Sink for Anthropogenic CO2 from 1994 to 2007,
https://www.ncbi.nlm.nih.gov/pubmed/30872519
6
  Carbon Brief, Nine ‘tipping points’ that could be triggered by climate change,
https://www.carbonbrief.org/explainer-nine-tipping-points-that-could-be-triggered-by-climate-change
7
  Ministry of Defence, Global Strategic Trends, https://www.gov.uk/government/publications/global-
strategic-trends
8
  United Nations, The Paris Climate Agreement, https://unfccc.int/process-and-meetings/the-paris-
agreement/the-paris-agreement
9
  United Nations, Emissions Gap Report 2019, https://www.unenvironment.org/resources/emissions-
gap-report-2019
10 Committee on Climate Change (CCC), Net Zero – The UK’s contribution to stopping global warming, https://www.theccc.org.uk/publication/net-zero-the-uks-contribution-to-stopping-global-warming/ 11 World Meteorological Organisation, The Global Annual to Decadal Climate Update, https://public.wmo.int/en/media/press-release/new-climate-predictions-assess-global-temperatures- coming-five-years 12 Our World in Data, CO2 and Greenhouse Gas Emissions, https://ourworldindata.org/CO2-and-other- greenhouse-gas-emissions 13 Department for Business, Energy & Industrial Strategy (BEIS), UK local authority and regional carbon dioxide emissions, https://www.gov.uk/government/statistics/uk-local-authority-and-regional-carbon- dioxide-emissions-national-statistics-2005-to-2017 14 Office for National Statistics, Census 2011, https://www.nomisweb.co.uk/census/2011/ks404ew 15 Partnership for Urban South Hampshire, Climate Change 2055, https://www.portsmouth.gov.uk/SiteElements/Html/PUSHLive-Server.html 16 Environment Agency, Climate Impacts Tool, https://www.gov.uk/government/publications/climate- impacts-tool 17 Eastern Solent Coastal Partnership, Protecting the Future of North Portsea Island, http://www.escp.org.uk/coastal-schemes/portsmouth/protecting-future-north-portsea-island 18 CCC, UK Climate Change Risk Assessment 2017, https://www.theccc.org.uk/publication/sayers-for- the-asc-projections-of-future-flood-risk-in-the-uk/ 19 Government Office For Science, Future of the Sea, https://assets.publishing.service.gov.uk/government/uploads/system/uploads/attachment_data/file/663 885/Future_of_the_sea_-_sea_level_rise.pdf; Environment Agency, Thames Estuary 2100 Plan, https://assets.publishing.service.gov.uk/government/uploads/system/uploads/attachment_data/file/322 061/LIT7540_43858f.pdf 20 MET Office, UKCP18 Marine Report, https://www.metoffice.gov.uk/pub/data/weather/uk/ukcp18/science-reports/UKCP18-Marine- report.pdf; MET Office, UK Sea Level Projections to 2300, https://www.metoffice.gov.uk/research/news/2019/uk-sea-level-projections-to-2300 21 Southsea Costal Scheme, Climate Change and Sustainability, https://southseacoastalscheme.org.uk/wp-content/uploads/2018/04/3.-Climate-Change-and- Sustainability.pdf 22 National Geographic, After Harvey Are Epic Rains the New Normal?, https://www.nationalgeographic.com/news/2017/08/heavy-rain-harvey-houston/ 23 Bloomberg City Lab, In a Town Shaped by Water, the River Is Winning, https://www.bloomberg.com/news/articles/2019-05-24/a-historic-river-town-confronts-a-flooded- future 24 Met Office, Climate Observations 2019, https://www.metoffice.gov.uk/weather/learn-about/climate- and-climate-change/climate-change/climate-observations; Science Media Centre, Expert Reaction to UK Flooding, https://www.sciencemediacentre.org/expert-reaction-to-uk-flooding-climate-change-and- flood-defences/ 25 CCC, UK Climate Change Risk Assessment 2017 Evidence Report, https://www.theccc.org.uk/tackling- climate-change/preparing-for-climate-change/uk-climate-change-risk-assessment-2017/ 26 MET Office, Increasing influence of climate change on UK climate, https://www.metoffice.gov.uk/about-us/press-office/news/weather-and-climate/2020/state-of-the-uk- climate-report-2019 27 MET Office, Top Ten UK’s Hottest Years All Since 2002, https://www.metoffice.gov.uk/about-us/press- office/news/weather-and-climate/2019/state-of-the-uk-climate-2018 28 Nature Climate Change, Anthropogenic Contribution to Global Occurrence of Heavy-Precipitation and High-Temperature Extremes, https://www.nature.com/articles/nclimate2617
29
   Met Office, Climate Observations 2019, https://www.metoffice.gov.uk/weather/learn-about/climate-
and-climate-change/climate-change/climate-observations
30
   Faculty of Public Health/Natural England, How Our Natural Health Service
Uses Green Space To Improve Wellbeing,
http://www.champspublichealth.com/writedir/9ee3FPH%20green%20space%20briefing.pdf
31
   Portsmouth City Council, An Assessment of Tree Cover in Portsmouth,
https://www.portsmouth.gov.uk/ext/documents-external/pln-local-plan-an-assessment-of-tree-cover-
in-portsmouth.pdf
32
   Forest Research et al, Understanding the value of Southampton’s urban trees,
https://www.researchgate.net/publication/321329435_Understanding_the_value_of_Southampton's_urba
n_trees
33
   Plymouth City Council, Tree Canopy Cover Assessment,
https://www.plymouth.gov.uk/sites/default/files/PlymouthPolicyAreaTreeCanopyCoverAssessment.pdf
34
   London Assembly, Tree Canopy Cover Map, https://www.london.gov.uk/what-we-
do/environment/parks-green-spaces-and-biodiversity/trees-and-woodlands/tree-canopy-cover-map
35
   Portsmouth City Council, The Portsmouth Plan, https://www.portsmouth.gov.uk/ext/development-
and-planning/planning-policy/the-portsmouth-plan-adopted-2012
36
   Ministry of Defence, Global Strategic Trends, https://www.gov.uk/government/publications/global-
strategic-trends
37
   Environmental Health, Potential impact of climate change on emerging vector-borne and other
infections in the UK, https://ehjournal.biomedcentral.com/articles/10.1186/s12940-017-0326-1
38
   CCC, Progress in Preparing for Climate Change, https://www.theccc.org.uk/publication/progress-in-
preparing-for-climate-change-2019-progress-report-to-parliament/
39
   Parliamentary Office of Science & Technology, Climate Change and Vector-Borne Diseases in Humans
in the UK, https://post.parliament.uk/research-briefings/post-pn-0597/
40
   Portsmouth Water, Draft Water Resources Management Plan,
https://www.portsmouthwater.co.uk/news/publications/water-resources-planning/your-water-and-its-
future/
41
   CCC, UK Climate Change Risk Assessment 2017, https://www.theccc.org.uk/publication/sayers-for-
the-asc-projections-of-future-flood-risk-in-the-uk/
42
   Public Health England, Heatwave plan for England,
https://www.gov.uk/government/publications/heatwave-plan-for-england
43
   London Climate Change Partnership, Climate change risk assessment for London,
http://climatelondon.org/publications/climate-change-risk-assessment-for-london/
44
   Public Health England, Heatwave plan for England,
https://www.gov.uk/government/publications/heatwave-plan-for-england
45
   CCC, UK Climate Change Risk Assessment 2017, https://www.theccc.org.uk/publication/sayers-for-
the-asc-projections-of-future-flood-risk-in-the-uk/
46
   Public Health England, Heatwave plan for England,
https://www.gov.uk/government/publications/heatwave-plan-for-england
47
   The Royal Society, Ground-level ozone in the 21st century, https://royalsociety.org/topics-
policy/publications/2008/ground-level-ozone/
48
   Public Health England, Fingertips Public Health Profiles, https://fingertips.phe.org.uk/profile/health-
profiles
49
   Department for Transport, Road Traffic Statistics, https://roadtraffic.dft.gov.uk/custom-
downloads/road-accidents
50
   Office for National Statistics, Mid-Year Population Estimates,
https://www.ons.gov.uk/peoplepopulationandcommunity/populationandmigration/populationestimates
51
   Eames. M et al, Retrofitting Cities for Tomorrow's World, https://www.wiley.com/en-
gb/Retrofitting+Cities+for+Tomorrow%27s+World-p-9781119007234
52
   Journal of Geophysical Research, Anthropogenic heating of the urban environment due to air
conditioning, https://agupubs.onlinelibrary.wiley.com/doi/full/10.1002/2013JD021225
53
   Journal of Maps, Interactive mapping for large, open demographic data sets using familiar
geographical features, https://www.tandfonline.com/doi/full/10.1080/17445647.2015.1060183
54
   Lawrence Berkeley National Laboratory, Effect of Temperature on Task Performance in Office
Environment, https://escholarship.org/uc/item/9bw3n707
55
   Energy Policy Institute, The Impact of Temperature on Productivity and Labor Supply,
https://epic.uchicago.edu/research/the-impact-of-temperature-on-productivity-and-labor-supply-
evidence-from-indian-manufacturing/
56
   McKinsey & Company, Climate risk and response: Physical hazards and socioeconomic impacts,
https://www.mckinsey.com/business-functions/sustainability/our-insights/climate-risk-and-response-
physical-hazards-and-socioeconomic-impacts
57
   Office for National Statistics, Labour Market Profile - Portsmouth,
https://www.nomisweb.co.uk/reports/lmp/la/1946157284/report.aspx?town=portsmouth
58
   Lamond. J et al, Flood Hazards: Impacts and Responses for the Built Environment p. 276,
https://www.routledge.com/Flood-Hazards-Impacts-and-Responses-for-the-Built-
Environment/Lamond-Booth-Hammond-Proverbs/p/book/9781138118256
59
   Disaster Prevention and Management, Resilience and adaptation of small and medium-sized
enterprises to flood risk,
https://www.emerald.com/insight/content/doi/10.1108/09653561211256170/full/html
60
   Chartered Management Institute, Weathering the storm, https://www.bsigroup.com/Documents/iso-
22301/resources/Weathering-the-storm-CMI-UK-EN.pdf
61
   Google, Environmental Insights Explorer,
https://insights.sustainability.google/places/ChIJ6fEUGKRCdEgReTs3A-qDtkU/download
62
   Regional Environmental Change, The Impact of Climate Change on Tourism in Germany, The UK and
Ireland, https://link.springer.com/article/10.1007/s10113-007-0036-2
63
   European Strategy and Policy Analysis System, Global Trends to 2030,
http://espas.eu/orbis/document/global-trends-2030-can-eu-meet-challenges-ahead
64
   Ministry of Defence, Global Strategic Trends, https://www.gov.uk/government/publications/global-
strategic-trends
65
   Public Health England, Coronavirus in the UK, https://coronavirus.data.gov.uk/
66
   Financial Times, New deaths attributed to Covid-19 in the European Union,
https://ig.ft.com/coronavirus-chart
67
   Global Health Security Index, https://www.ghsindex.org/
68
   SAGE, Reasonable Worst-Case Planning Scenario,
https://www.gov.uk/government/publications/reasonable-worst-case-planning-scenario-29-march-
2020
69
   ONS, Deaths involving COVID-19 by local area and socioeconomic deprivation,
https://www.ons.gov.uk/peoplepopulationandcommunity/birthsdeathsandmarriages/deaths/bulletins/d
eathsinvolvingcovid19bylocalareasanddeprivation/deathsoccurringbetween1marchand31may2020
70
   National Bureau of Economic Research, Valuing the Global Mortality Consequences of Climate
Change Accounting for Adaptation Costs and Benefits, https://www.nber.org/papers/w27599
Portsmouth Climate Action Board           www.portsmouthclimateaction.org.uk

For further information please contact:

tristan.thorn@myport.ac.uk
You can also read