Alpine Tundra Contraction under Future Warming Scenarios in Europe - MDPI
←
→
Page content transcription
If your browser does not render page correctly, please read the page content below
atmosphere
Article
Alpine Tundra Contraction under Future Warming
Scenarios in Europe
José I. Barredo 1, * , Achille Mauri 1 and Giovanni Caudullo 2
 1   European Commission, Joint Research Centre, 21027 Ispra, Italy; achille.mauri@ec.europa.eu
 2   Arcadia SIT s.r.l., 27029 Vigevano, Italy; giovanni.caudullo@ext.ec.europa.eu
 *   Correspondence: jose.barredo@ec.europa.eu

 Received: 6 May 2020; Accepted: 25 June 2020; Published: 1 July 2020

 Abstract: The alpine tundra is the highest elevation belt of high mountains. This zone is an important
 reservoir of freshwater and provides habitat to unique species. This study assesses projected
 changes in the areal extent of the alpine tundra climate zone in three warming levels in European
 mountains. The alpine tundra was delineated using the Köppen-Geiger climate classification. We used
 11 regional climate model simulations from EURO-CORDEX disaggregated at a one-kilometre
 grid size representing the RCP4.5 and RCP8.5 scenarios in the 1.5, 2 and 3 ◦ C warming levels.
 Mitigation represented by the 1.5 ◦ C warming level reduces projected losses of the alpine tundra.
 However, even in this warming level the projected contraction is severe. In this case, the contraction
 in the Alps, Scandes and Pyrenees together is projected at between 44% and 48% of the present extent.
 The contraction is projected to climb in the 2 ◦ C warming to above 57%, while the 3 ◦ C warming
 would imply that the alpine tundra will be near to collapse in Europe with a contraction of 84%
 in the three regions, which host most of the alpine tundra in Europe. The projected changes have
 negative implications for a range of ecosystem services and biodiversity, such as habitat provision,
 water provision and regulation, erosion protection, water quality and recreational services.

 Keywords: alpine tundra; climate change; biodiversity; global warming

1. Introduction
     High mountain ecosystems provide vital services to humans, such as freshwater, water regulation
and release during the drier summer months from melting snow, habitat for biodiversity, and recreational
services. High mountains are characterised by a cold and harsh climate, high altitudes and complex
topography. Forest and grasslands often cover the lower slopes, but at higher elevations trees become
scarcer, giving place to alpine grasslands and scrub heath communities. Due to their steep gradients,
mountains comprise latitudinal life zones in a relatively small extent, therefore habitats and species
change rapidly with altitude. These characteristics explain the rich biodiversity and variety of habitats
present in mountain regions. For instance, two thirds of European plant species are present in
mountains [1,2].
     Anthropogenic climate change presents a major threat to mountain systems. Due to the tight
ecological-climatic bands in mountains, small changes could have major effects in these systems.
There is consensus that alpine habitats are showing a high sensitivity to climate change and will be
highly vulnerable to future changes [3,4]. Evidence indicates that in mountain regions the current and
future effects of global warming are likely to be amplified [4–12]. Therefore, projected climate-driven
impacts are greater at higher elevations [13,14].
     In Europe, alpine tundra occurs at the top of high mountains above the tree line ecotone, where alpine
grasslands and scrub heath communities dominate vegetation. The climate of the alpine tundra does
not support tree growth [15]. The nival zone is at the top of the alpine tundra, where snow is present

Atmosphere 2020, 11, 698; doi:10.3390/atmos11070698                          www.mdpi.com/journal/atmosphere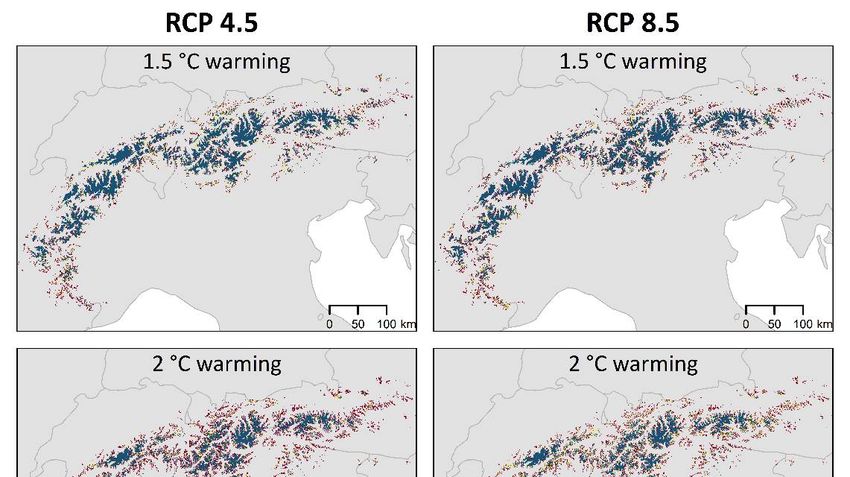
Atmosphere 2020, 11, 698                                                                               2 of 21

most of the year. The Alpine tundra is an important reservoir of freshwater resources and play a
key role in water release. Mountain ecosystems intercept water and store it as snow, glaciers and
reservoirs before delivering mostly in spring and summer. These ecosystems play a key role in water
provision for agriculture and human consumption and provide key ecosystem services such as habitat
to endemic species and alpine communities.
     Alpine tundra is present across Europe in several high elevation mountains. The most extended
zones are the high mountain ranges of the Pyrenees on the border between France and Spain; the Alps,
which stretch over France, Italy, Germany, Austria, Slovenia, Switzerland and Monaco; the Scandes
located between Sweden, Norway and Finland; and some less prominent zones, such as the Scottish
Highlands and Carpathians.
     The impacts of climate change in high mountain areas have been a subject of intensive research
in the last two decades. The Intergovernmental Panel on Climate Change’s (IPCC’s) Special Report
on Ocean and Cryosphere in a Changing Climate presents a comprehensive summary of available
findings [4]. Among the observed and projected changes in high mountains, the most notable are
the shrinking of glaciers [16,17], reductions in snow cover [7], increased permafrost temperature [18],
shifts in ranges of plant and animal species [10,11,14,19–21], and effects in ecosystem functions [22].
Nevertheless, the potential impact of climate change in the extent of the alpine tundra climate zone is
poorly understood. Therefore, better knowledge on this impact is necessary for appropriate adaptation
in alpine ecosystems. The aim of this study is to assess changes in the extent and distribution of the
alpine tundra climate in Europe under scenarios of climate change. Additionally, we discuss potential
impacts on biodiversity, ecosystem services, hydrology, and slope dynamics from available evidence.
     The results of this study are useful for mapping critical conservation areas and support decision
making on potential interventions, such as Green Infrastructure [23], and other adaptation options in
high mountain ecosystems.

2. Methods
      In this study, we mapped the European alpine tundra climate zone under historical climate
(reference period 1981–2010), and two Representative Concentration Pathways (RCPs) adopted by the
Intergovernmental Panel on Climate Change (IPCC) in its Fifth Assessment report, specifically RCP4.5
and RCP8.5 [24,25]. RCP4.5 is a trajectory projecting an increase in global mean temperature of 1.8 ◦ C
(likely range 1.1–2.6 ◦ C) relative to the period of 1986–2005 [26]. While RCP8.5 is a business as usual
(high emission) trajectory [24,25], projecting a + 3.7 ◦ C (likely range 2.6–4.8 ◦ C) world by the end of the
century relative to 1986–2005 [26].
      We used 11 Regional Climate Model (RCM) simulations for three warming levels, i.e., 1.5, 2 and
3 ◦ C, the latter reached only in RCP8.5. The warming levels represent 30-year periods centred on the
year when the driving general circulation model (GCM) projects a global 1.5, 2 and 3 ◦ C warming,
with respect to pre-industrial levels, according to the IMPACT2C [27] project. See the simulations used
and the 30-year time ranges in Table 1. Maps accounting for changes in the alpine tundra were created
for the 11 simulations, two scenarios and three periods.
      This study was implemented within the PESETA IV project [28], which aims at evaluating
potential impact of climate change in Europe for a number of sectors. A common set of climate
simulations and scenarios were used by all sectors with a focus on the biophysical dimension of
impacts, extreme events and the exploration of various adaptation options. Therefore, the baseline
period, scenarios, warming levels and simulations were selected according to the project guidance.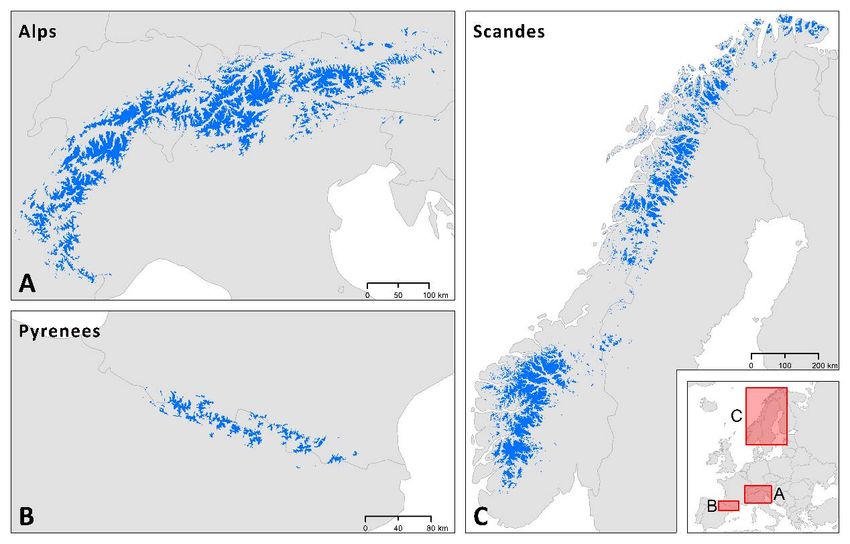
Atmosphere 2020, 11, 698                                                                                    3 of 21

      Table 1. Regional climate model (RCM) simulations used in this study with 30-year time ranges when
      the driving general circulation model (GCM) projects a global 1.5, 2 and 3 ◦ C warming according to
      IMPACT2C [27].

        Institute           RCM          Driving GCM         Scenarios    + 1.5 ◦ C    + 2 ◦C      + 3 ◦C
                                                              RCP4.5     2021–2050    2043–2072       -
    CLM-Community CCLM4-8-17         CNRM-CERFACS-CNRM-CM5
                                                              RCP8.5     2015–2044    2030–2059   2053–2082
                                                              RCP4.5     2019–2048    2042–2071       -
    CLM-Community CCLM4-8-17           ICHEC-EC-EARTH
                                                              RCP8.5     2012–2041    2027–2056   2052–2081
                                                              RCP4.5     2020–2049    2050–2079       -
    CLM-Community CCLM4-8-17           MPI-M-MPI-ESM-LR
                                                              RCP8.5     2014–2043    2030–2059   2053–2082
                                                              RCP4.5     2018–2047    2040–2069       -
          DMI              HIRHAM5     ICHEC-EC-EARTH
                                                              RCP8.5     2014–2043    2029–2058   2051–2080
                                                              RCP4.5     2009–2038    2028–2057       -
      IPSL-INERIS          WRF331F    IPSL-IPSL-CM5A-MR
                                                              RCP8.5     2008–2037    2021–2050   2040–2069
                                                              RCP4.5     2018–2047    2042–2071       -
         KNMI          RACMO22E        ICHEC-EC-EARTH
                                                              RCP8.5     2040–2069    2028–2057   2051–2080
                                                              RCP4.5     2021–2050    2043–2072       -
         SMHI               RCA4     CNRM-CERFACS-CNRM-CM5
                                                              RCP8.5     2015–2044    2030–2059   2053–2082
                                                              RCP4.5     2019–2048    2042–2071       -
         SMHI               RCA4       ICHEC-EC-EARTH
                                                              RCP8.5     2012–2041    2027–2056   2052–2081
                                                              RCP4.5     2009–2038    2028–2057       -
         SMHI               RCA4      IPSL-IPSL-CM5A-MR
                                                              RCP8.5     2008–2037    2021–2050   2040–2069
                                                              RCP4.5     2007–2036    2023–2052   2055–2084
         SMHI               RCA4      MOHC-HadGEM2-ES
                                                              RCP8.5     2004–2033    2016–2045   2037–2066
                                                              RCP4.5     2020–2049    2050–2079       -
         SMHI               RCA4       MPI-M-MPI-ESM-LR
                                                              RCP8.5     2014–2043    2030–2059   2053–2082

2.1. Climate Data
      We obtained high-resolution RCM simulations from the Coordinated Regional Downscaling
Experiment (CORDEX) of the World Climate Research Programme (WCRP). The EURO-CORDEX [29]
initiative provides regional climate projections for Europe at ~12.5 km horizontal resolution by
downscaling the global climate projections of the Coupled Model Intercomparison Project Phase
5 (CMIP5) [30]. We used simulations of daily air temperature for 11 RCMs, 2 RCP scenarios and
4 periods (reference period, 1.5, 2 and 3 ◦ C warming levels). Departing from daily data, we calculated
30-year monthly mean air temperature data sets. The spatial domain of this study covers the EU-28,
Switzerland and Norway.
      Given that the alpine tundra biome is located in high mountain areas, and that these are
characterised by complex topography and large elevational gradients, using RCM simulations at a
~12.5-km horizontal resolution for mapping alpine tundra is problematic. This is because horizontal
variations in temperature in high mountain areas cannot be captured properly at the resolution of
RCMs [31]. Aimed at alleviating this limitation we used the change factor approach for reduce model
bias and spatially disaggregate temperature fields from RCMs to a higher horizontal resolution of
1 km [31–35]. The resulting high resolution data set is appropriate for high mountain and biodiversity
studies [31,36].
      Anomalies (differences) of monthly mean temperature were computed from the RCM future
simulations (1.5, 2 and 3 ◦ C warming levels) and the reference period (1981–2010). Then, temperature
anomalies were interpolated using the spline method [37,38] to the 1-km spatial resolution of the
baseline data, i.e., CHELSA ver. 1.2 [39]. We used the regularised spline with a weight of 0.001
and 8 points. These parameters are well suited for the interpolation of RCM data according to
Barredo et al. [33]. Finally, temperature anomalies were added to the corresponding month of
the CHELSA dataset for producing high-resolution maps of future monthly mean air temperature.
The CHELSA dataset, which covers the period 1979–2013, approximates the reference period of this
study, which was agreed in the PESETA IV Project.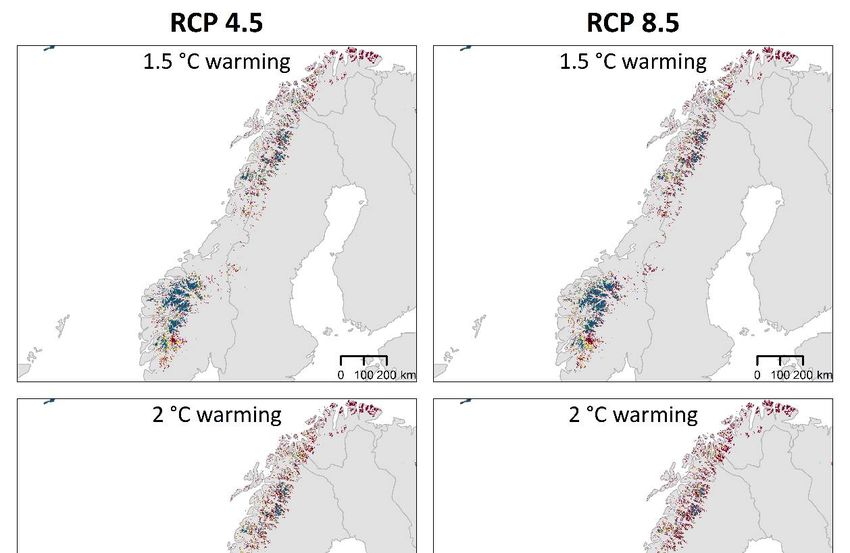
Atmosphere 2020, 11, 698                                                                                     4 of 21

2.2. Mapping Alpine Tundra Domain
      Alpine tundra was mapped using the Köppen-Geiger climate classification [40] following the
work of Diaz and Eischeid [6] and Kottek, et al. [41]. The alpine tundra domain (ATD) is equivalent to
the polar climates classified in Köppen-Geiger as E-type [6]. Polar climates are defined as occurring if
the mean temperature of the warmest month is less than 10 ◦ C. These include two Köppen-Geiger
sub-types, i.e., tundra climate (ET) and frost climate (EF). Tundra climate occurs where the mean
temperature of the warmest month is in the range of less than 10 and 0 ◦ C, and frost climate occurs
where the mean temperature of the warmest month is less than 0 ◦ C. No precipitation differentiation is
included in the Köppen-Geiger classification for these two sub-types. The EF sub-type is present in the
study domain in a few marginal areas. Therefore, we defined the ATD as equivalent of polar climates
(E-type) according to Diaz and Eischeid [6]. This analysis focuses on climatic impacts and maps the
ATD based solely on climatic criteria.
      Maps of the ATD were created for the reference period and for each scenario, period and simulation.
Thus, in addition to the map of the reference period created using CHELSA, we obtained 33 maps
(11 simulations times 3 periods) for RCP8.5 and 22 maps (11 simulations times 2 periods) for RCP4.5.
      Then, summary maps describing changes in the ATD containing three potential categories (stable,
contraction and expansion areas) were created between the reference period and the future. As a
result, we obtained one map of projected changes for each scenario/period. The category expansion
is absent in the summary maps and was therefore excluded from the assessment. The maps were
summarised according to Table 2 following Klausmeyer and Shaw [34]. Therefore, the number of
simulations predicting changes of the ATD (stable or contraction) was used to define the category of
change on each grid cell.

      Table 2. Categories of projected change of the alpine tundra domain (ATD) to the different scenarios and
      warming levels. Note that the category expansion was not included because none of the simulations
      project expansion of the ATD.

            Projected Change             Change Category            Number of Simulations (Out of 11)
                                             Confident                              10–11
                   Stable
                                              Likely                                 7–9
            Stable/contraction               Uncertain                               1–6
                                             Confident                              10–11
                Contraction
                                              Likely                                 7–9

     For example, if only six simulations project that a grid cell will remain within the ATD in the 3 ◦ C
warming level, then that grid cell is included in the uncertain category in the mentioned warming
level. Similarly, if 10 simulations project that a grid cell will remain within the ATD in the 3 ◦ C
warming level, then that grid cell is included in the stable category in the mentioned warming level.
We used equal-area projected maps for computing areal changes, taking the curvature of the earth
into consideration.

2.3. Validation of the Alpine Tundra Delineation
      We implemented a validation procedure to determine the ability of our methodology to reproduce
a faithful delineation of the ATD using an independent map of the alpine tundra biome. However,
lack of independent pan-European maps of alpine tundra with sufficient spatial detail to allow a fair
comparison with the ATD makes the validation challenging.
      Beside the very coarse maps of tundra biomes available, e.g., [42–44], to the best of our knowledge,
the only map representing the alpine tundra biome is the Map of the Natural Vegetation of Europe of
Bohn et al. [45]. The map of natural vegetation is well suited for comparison because it represents
the potential distribution of vegetation in Europe that is the vegetation that would occur without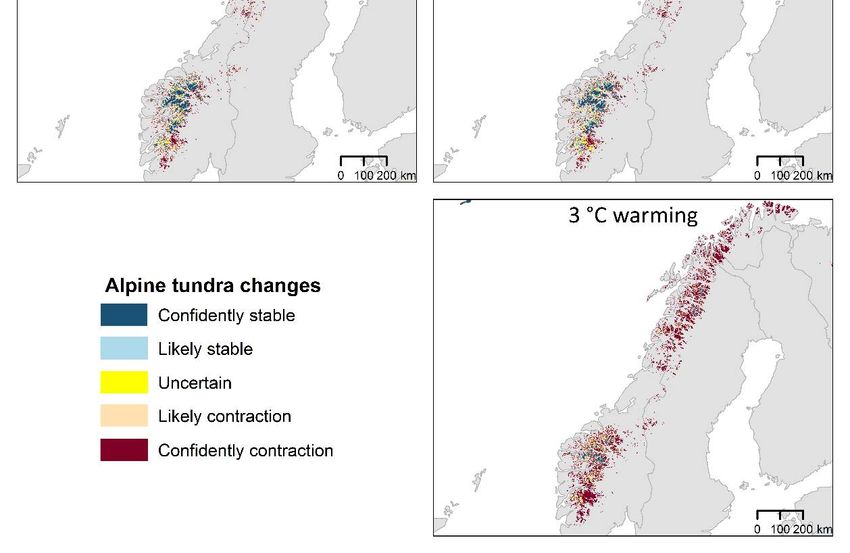
Atmosphere 2020, 11, 698                                                                           5 of 21

human intervention. This is similar to the climatic approach used in this study, where other effects
beyond climate are not taken into account for mapping the ATD. There is controversy regarding the
map of Bohn et al. [45] because it is not based on a quantitative analysis but on expert knowledge.
However, the map has proven to be robust in recent applications of simulated vegetation distribution
in Europe [46] and the degree of naturalness of European forests [47].
     In the validation, we used a map of the ATD created using WorldClim data (Version 1.4) at a
one-kilometre grid size [48] instead of the CHELSA dataset. This is because the reference period of
WorldClim v1.4 (1960–1990) is in agreement with the map of Bohn et al. [45], which refers to around
the same period. The validation is aimed to assess the capacity of the method for mapping the ATD,
independently of the climate data set used.
     We assumed that the ATD approximates the alpine tundra biome represented by the subunits
subnival vegetation of high mountains (A.2), alpine vegetation (B.2) and glaciers as described in the Map
of the Natural Vegetation of Europe [45]. The alpine vegetation formation includes alpine grasslands,
low creeping shrub, dwarf shrub and shrub vegetation, rock and scree vegetation. These subunits
occur above the tree line in high mountain regions, where trees are completely absent, similarly as in
the ATD.
     For the comparison, the biome map was cropped to the extent of the ATD map. Then, we calculated
a buffer of five kilometres from the alpine tundra categories of the two maps to avoid that a large
number of background grid cells are counted as agreement, therefore biasing the validation towards
agreement. As result, we obtained two binary maps where grid cells with 1 represents the ATD and
alpine tundra biome, respectively, in both maps, and grid cells with 0 the background within the five
kilometres buffer. The validation was implemented independently in three mountain regions, i.e.,
Alps, Scandes and Pyrenees.
     The level of agreement between the maps generated was assessed using the Kappa statistic [49,50]
and overall accuracy [51]. The Kappa statistic measures the degree of agreement between categorical
maps, ranging from zero (total disagreement) to one (perfect agreement) [52]. Overall accuracy is a
simple technique for map comparison. It is computed by dividing the number of coincident grid cells
by the total number of grid cells.

2.4. Sensitivity Analysis
      A sensitivity analysis was carried out to assess the level of agreement between the different
simulations in mapping projected losses of the ATD. We computed projected areal losses of the ATD
relative to the reference period using the maps of the ATD for the different combinations of scenarios
and warming levels. Then, projected losses, i.e., areas where the ATD is projected to disappear,
were represented in box-and-whisker plots per region, scenario and warming level for comparison.

2.5. Climate Parameters
     The projected changes in climate parameters were computed for both scenarios and the three
warming levels in the ATD. We computed changes of mean monthly temperature and mean monthly
precipitation in the summer half of the year (April to September), winter half of the year (October to
March) and annually. In addition, the temperature of the warmest month of the year was also computed
because it is the parameter defining the ATD. We computed the changes within the ATD delimited in
the map of the reference period.

3. Results
     In Europe (excluding Iceland), the extent of the ATD in the reference period is around 87,000 km2 .
This is close to the size of Austria or Portugal. Of this extent, 98% is found in the Alps, Scandes and
Pyrenees, representing around 25,000 km2 , 59,200 km2 and 1800 km2 , respectively (Figure 1). A few
isolated areas of ATD are present in the Scottish Highlands, Tatra Mountains, Carpathians and
Apennines in central Italy.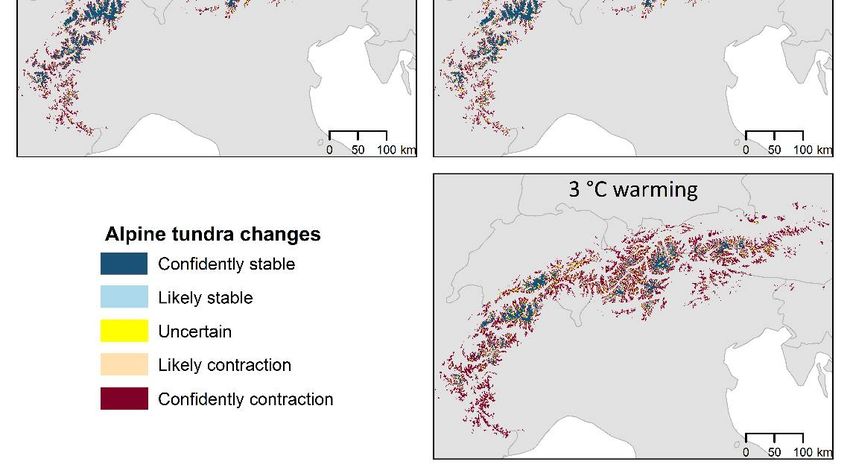
In Europe (excluding Iceland), the extent of the ATD in the reference period is around 87,000
km2. This is close to the size of Austria or Portugal. Of this extent, 98% is found in the Alps, Scandes
and Pyrenees, representing around 25,000 km2, 59,200 km2 and 1800 km2, respectively (Figure 1). A
few isolated areas of ATD are present in the Scottish Highlands, Tatra Mountains, Carpathians6 of
Atmosphere 2020, 11, 698
                                                                                                     and
                                                                                                       21
Apennines in central Italy.

     Figure
     Figure 1.  Extent of
             1. Extent  of the
                           the alpine
                               alpine tundra
                                       tundra domain
                                              domain (ATD)
                                                      (ATD) according
                                                            according to
                                                                       to the
                                                                          the Köppen-Geiger
                                                                              Köppen-Geiger definition
                                                                                              definition using
                                                                                                         using
     CHELSA     data  [39] in the reference period (1981–2010) in the (A) Alps, (B) Pyrenees
     CHELSA data [39] in the reference period (1981–2010) in the Alps, Scandes and Pyrenees. and  (C) Note
                                                                                                      Scandes.
                                                                                                           the
     Note  the different
     different            scale
                scale in the    in the boxes.
                             boxes.

3.1. Validation of Alpine Tundra Delineation
3.1. Validation of Alpine Tundra Delineation
     Despite differences in the methodology for mapping alpine tundra between the climatic approach
      Despite differences in the methodology for mapping alpine tundra between the climatic
used in this study and the expert knowledge approach used in the map of Bohn et al. [45], the results of
approach used in this study and the expert knowledge approach used in the map of Bohn et al. [45],
the validation indicates a level of agreement above 70% between both maps (Table 3). A commonly cited
the results of the validation indicates a level of agreement above 70% between both maps (Table 3).
interpretation of the Kappa statistic suggests slight agreement in the range 0.01–0.20, fair agreement
A commonly cited interpretation of the Kappa statistic suggests slight agreement in the range 0.01–
0.21–0.40, moderate agreement 0.41–0.60, substantial agreement 0.61–0.80 and almost perfect agreement
0.20, fair agreement 0.21–0.40, moderate agreement 0.41–0.60, substantial agreement 0.61–0.80 and
0.81–0.99 [52].
almost perfect agreement 0.81–0.99 [52].
      The match
     Table         is moderate
            3. Degree             in the
                       of agreement      Alps and
                                      between        Pyrenees
                                                the alpine tundrawhere
                                                                   domainKappa  and
                                                                            (ATD)    overallusing
                                                                                   mapped    accuracy   are above
                                                                                                  WorldClim
0.42 data
      and (Version
           78%, respectively.     The  maps    in  Figure  2 reveal   that the delineation  of  the ATD   is more
                    1.4) at a 1-km grid size [48] versus the alpine tundra biome (alpine vegetation, subnival
     vegetation of high mountains and glaciers) according to Bohn et al. [45], using Cohen’s Kappa statistic
     and overall accuracy.

                                     Alpine Tundra Domain (ATD) Versus Alpine Tundra Biome [45]
               Region
                                                 Kappa                         Overall Accuracy (%)
                Alps                              0.51                                   78
              Scandes                             0.40                                   70
              Pyrenees                            0.42                                   81

     The match is moderate in the Alps and Pyrenees where Kappa and overall accuracy are above 0.42
and 78%, respectively. The maps in Figure 2 reveal that the delineation of the ATD is more restrictive
than the subunits delineated in the alpine tundra biome map in the Alps and Pyrenees. There is
agreement between the higher elevation zones of the ATD and the categories subnival vegetation of
high mountains, glaciers, and the alpine vegetation (at the higher elevations) of the alpine tundra
biome map. In contrast, some expanses of the alpine tundra biome at lower elevations fall outside the
area delimited by the ATD. This mismatch at lower elevations occurs marginally in the Pyrenees.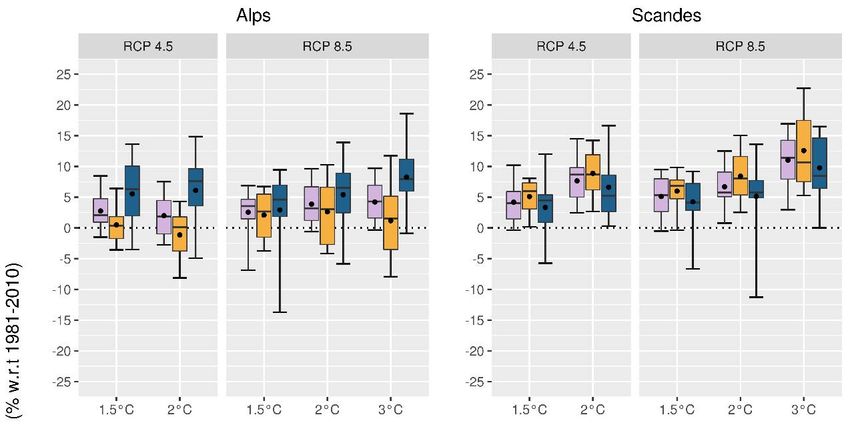
Atmosphere 2020, 11, 698 7 of 21
Atmosphere 2020, 11, x FOR PEER REVIEW 8 of 23
Figure 2.
Figure Comparison between
2. Comparison between the
the alpine
alpine tundra
tundra domain
domain (ATD)
(ATD) delineated
delineated using
using climate
climate data
data from
from
WorldClim (Version 1.4) at a 1-km grid size [48] and the alpine tundra biome (alpine
WorldClim (Version 1.4) at a 1-km grid size [48] and the alpine tundra biome (alpine vegetation, vegetation,
subnival vegetation
subnival vegetationofof
high mountains
high mountainsand and
glaciers) according
glaciers) to BohntoetBohn
according al. [45].etAgreement represents
al. [45]. Agreement
coincident coincident
represents areas in theareas
two maps.
in the two maps.
Both maps
3.2. Sensitivity are fairly in correspondence in the Scandes, showing a Kappa statistic and overall
Analysis
accuracy of 0.40 and 70%, respectively. There is more agreement in the southern region of the Scandes,
The results
specifically of theelevations,
at higher sensitivitywhere
analysisthe reveal
ATD and agreement
the alpine among
tundra thebiome
simulations. That is, all the
are in correspondence.
RCM simulations projected contraction of the ATD across scenarios
Similarly, as in the other two regions, some lower elevation zones of the alpine tundra and warming levels. Asbiome
expected,
fall
the projected loss of the ATD is less pronounced in 1.5 °C warming
outside the ATD. In the northernmost region of the Scandes, the alpine vegetation category and losses increase with warming
of the
level
alpine(Figure
tundra3).biome
Nevertheless, the magnitude
map is delineated furtherof the
southprojected
and east contractions
with respect of the ATD
to the ATDvary(Figure
between 2).
the 11 simulations. For example, under RCP4.5 in
Therefore, pushing down both the Kappa statistic and overall accuracy.the 1.5 °C warming in the Alps the contraction is
projected at between 21% and 49%, that is, the minimum and maximum
Bohn et al. [45] indicated that the vegetation above the tree line in Scandinavian mountains iscontraction projected by the
11 simulations,
considered part of respectively,
the categorywith alpinerespect to the
vegetation extent
(B.2). in the the
However, reference period. In(B.2)
alpine vegetation this resembles
case, the
projected median contraction of the 11 simulations is 34%.
the adjacent Arctic shrub tundras (B.1.4), showing a continuous transition zone in the norther boreal
TheThis
region. projected
makescontraction
challengingofdelineating
ATD vary their considerably depending
limit as there on the regionbetween
is no discontinuity considered.
themFor in
instance, in the 1.5 °C warming level, the projected median loss is around
this region. For instance, a narrow strip of land in the northernmost part of Norway delineated in 80% in the Pyrenees and
above
Bohn et47% in the
al. [45] Scandes.
as Arctic shrubWhile
tundrasthe(B.1.4)
projected mean contraction
and therefore not included in in
thethe Alpsmapisofless pronounced,
the alpine tundra
though stillalmost
biome falls representing
entirely34–40% of theThe
in the ATD. extent in the reference
mentioned strip of landperiod. Moreover,
includes in the 2 and
the northernmost 3 °C
part of
warming levels, the simulations project losses of different magnitude across
the Varanger Peninsula, a narrow strip in the north of the Nordkinn Peninsula and the Magerøya Island. regions. In the 2 °C
warming
Somelevel,
areastheof mean
the ATDcontraction is projected
fall outside the limit inofthetherange of around
alpine tundra 54%, biome 63%in and aboveregions.
the three 90% in
the
TheAlps,
reasonsScandes
behindand thisPyrenees,
discrepancy respectively.
have yet to Finally, in the 3 °C
be elucidated. warming
However, it islevel the projected
possible mean
that the coarse
contraction is around 76% and 88% in the Alps
scale of the biome map might have played a role in this case. and Scandes, respectively. While in the Pyrenees the
meanIncontraction
general, the across
ATD simulations
resembles the is projected
delineation at of
99%theof the current
alpine tundraextent.
biome.InHowever,
other words, the
at lower
mean contraction of the 11 simulations indicates that the ATD is projected
elevations, the subunit alpine vegetation of the biome map covers an extent somewhat beyond the to virtually disappear in
this region.
lower elevational boundary of the ATD. One factor that could explains this difference is that the
lower limit of the alpine vegetation subunit borders with the tree-line ecotone, which is a transition
zone between the alpine tundra and subalpine forests. Despite these constraints, and considering
the rather different methods used for producing the maps and the coarse spatial resolution of the
biome map, the validation shows spatial agreement between the delineation of the ATD and the alpine
tundra biome.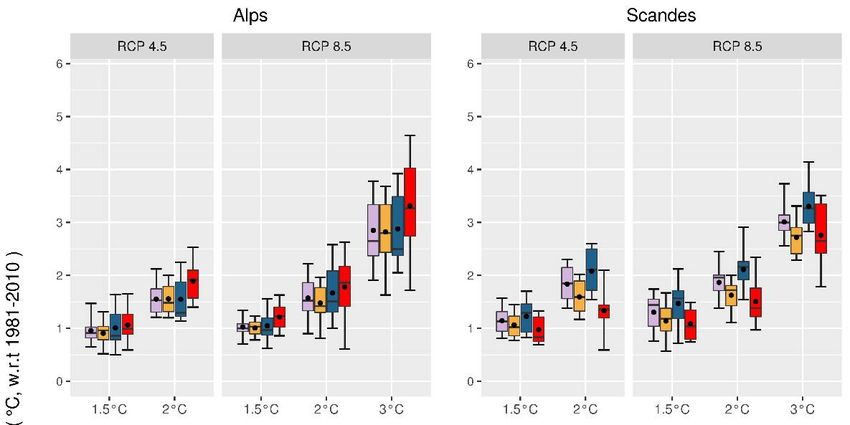
Atmosphere 2020, 11, 698                                                                                                8 of 21

3.2. Sensitivity Analysis
     The results of the sensitivity analysis reveal agreement among the simulations. That is, all the
RCM simulations projected contraction of the ATD across scenarios and warming levels. As expected,
the projected loss of the ATD is less pronounced in 1.5 ◦ C warming and losses increase with warming
level (Figure 3). Nevertheless, the magnitude of the projected contractions of the ATD vary between
the 11 simulations. For example, under RCP4.5 in the 1.5 ◦ C warming in the Alps the contraction is
projected at between 21% and 49%, that is, the minimum and maximum contraction projected by the
11 simulations, respectively, with respect to the extent in the reference period. In this case, the projected
Atmosphere 2020, 11, x FOR PEER REVIEW                                                                  9 of 23
median contraction of the 11 simulations is 34%.

      Figure  3. Projected
      Figure 3.  Projected relative
                           relative area
                                    area loss
                                           loss of
                                                 of the
                                                    the alpine
                                                         alpine tundra
                                                                 tundra domain
                                                                          domain (ATD)
                                                                                  (ATD) under
                                                                                         under scenario
                                                                                                scenario RCP4.5
                                                                                                         RCP4.5 and
                                                                                                                 and
      RCP8.5                               ◦      ◦ and 3 ◦ C) in relation to the reference period (1981–2010) in the
      RCP8.5 ininthree
                  threewaring
                        waringlevels
                                levels(1.5
                                        (1.5C,
                                             °C,2 2C°C  and 3°C) in relation to the reference period (1981–2010) in
      Alps, Scandes
      the Alps,       and Pyrenees.
                  Scandes            Box-and-whisker
                           and Pyrenees.                   plots show
                                              Box-and-whisker       plotsthe minimum,
                                                                           show        maximum,
                                                                                 the minimum,      median (number),
                                                                                                 maximum,   median
      lower  quartile (25%) and  upper    quartile   (75%)  of the 11 RCM    simulations.
      (number), lower quartile (25%) and upper quartile (75%) of the 11 RCM simulations.

      The projected
3.3. Mapping    Projected  contraction
                             Changes of of the ATD
                                               Alpinevary
                                                       Tundraconsiderably depending on the region considered.
For instance, in the 1.5 ◦ C warming level, the projected median loss is around 80% in the Pyrenees
      The results
and above     47% in ofthe
                         thisScandes.
                              study indicate
                                         While athe pronounced
                                                      projected meanprojected   contraction
                                                                           contraction         ofAlps
                                                                                          in the  the ATD     across
                                                                                                        is less        regions,
                                                                                                                 pronounced,
though still representing 34–40% of the extent in the reference period. Moreover, in the 2 and 3lose
scenarios   and  warming       levels  (Table   4 and  Figure   4). In the  Alps,  it is projected  that  the  ATD     will  ◦C
an extent of
warming        around
            levels,   the31–36%      of theproject
                            simulations      currentlosses
                                                      area with    a 1.5 °C warming,
                                                              of different    magnitude    exhibiting  both RCP
                                                                                             across regions.      In scenarios
                                                                                                                      the 2 ◦ C
warming level, the mean contraction is projected in the range of around 54%, 63% and above 90%and
similar  results   (Figure    5). Note    that  in this  section  we   report   changes    including   both    the likely     in
confident
the          categories
    Alps, Scandes      andunless     mentioned
                              Pyrenees,             otherwise.
                                            respectively.        Theinprojected
                                                            Finally,                 loss is more
                                                                          the 3 ◦ C warming          pronounced
                                                                                                 level the projected  in mean
                                                                                                                         lower
areas, particularly
contraction    is around  in the
                              76%eastern
                                    and 88%   andin southwestern      Alps where
                                                    the Alps and Scandes,              the mountain
                                                                                  respectively.    While range
                                                                                                            in therarely   goes
                                                                                                                     Pyrenees
beyond    2600  m   a.s.l.  Then,  in a  2 °C  warming,     the ATD    is  projected   to lose around
the mean contraction across simulations is projected at 99% of the current extent. In other words,       half  of their  extent
in this
the meanregion.   While in
            contraction     of the  3 °C
                               the 11     warming the
                                       simulations         lossesthat
                                                      indicates    are projected
                                                                        the ATD isatprojected
                                                                                        75%. Therefore,     the extent
                                                                                                  to virtually           of the
                                                                                                                 disappear    in
ATD    in  the
this region.    Alps    is  projected    to  be  only   19%   of their   present   area.   The   remaining      6%  is  part  of
uncertain changes (Figure 4). Consequently, almost the entirety of ATD areas below 3000 m a.s.l. are
projected to disappear.
      In the Scandes, a contraction of the ATD of around half of the present extent is projected in the
1.5 °C warming level in both scenarios (Figure 6). In the 2 °C warming level, a contraction of around
60% is projected in either scenario. The shrinking is particularly pronounced in the northern Scandes,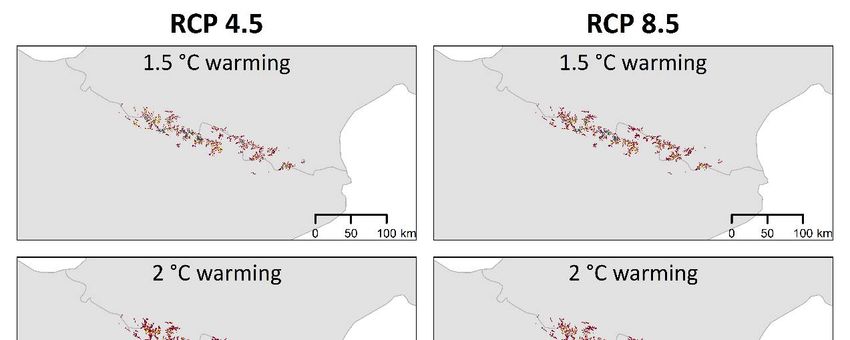
only around 4% of the ATD is projected to persist, whereas the ATD is projected to virtually
disappear in a 3 °C warming level in the Pyrenees.
Our findings indicate that both scenarios, RCP4.5 and RCP8.5, project comparable results across
regions regarding the 1.5 and 2 °C warming levels, as illustrated by Figure 4. Results describing
Atmosphere 2020, 11, 698 9 of 21
changes in climate parameters are in Appendix A.
Table 4. Projected relative contraction (including the categories confident and likely contraction) of
3.3. Mapping Projected Changes of the Alpine Tundra
the alpine tundra domain (ATD) in three warming levels (1.5 °C, 2 °C and 3 °C). Changes with respect
toThe
the results of the
extent of thisATD
study
in indicate a pronounced
the reference projectedincontraction
period (1981–2010) of the
three regions: ATD
Alps, across
Scandes regions,
and
scenarios andRanges
Pyrenees. warming levelsaccording
computed (Table 4 and
to theFigure 4). contraction
projected In the Alps,initRCP4.5
is projected that the
and RCP8.5 ATD will lose
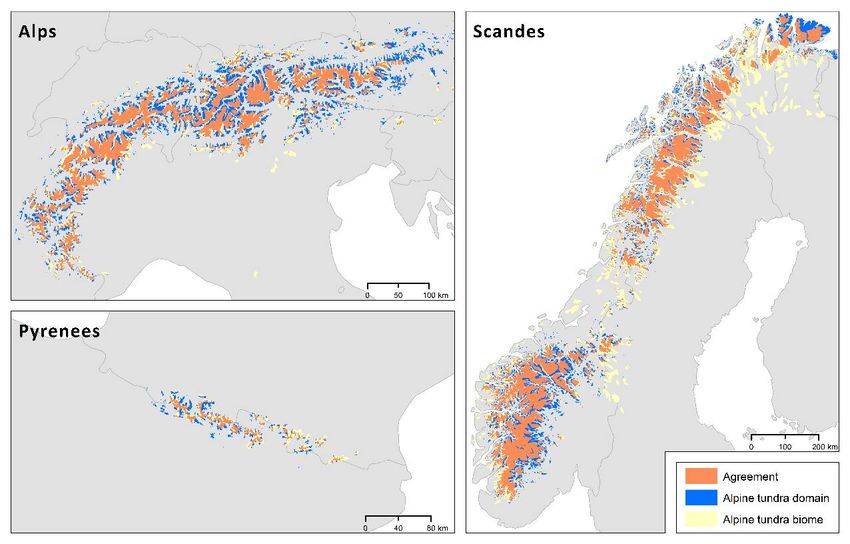
simulations.
an extent of around 31–36% of the current area with a 1.5 ◦ C warming, exhibiting both RCP scenarios
Warming Level
similar results (Figure 5). Note that in this section we report changes including both the likely and
Region
confident categories unless mentioned otherwise. 1.5° C The projected
2° C loss3°isCmore pronounced in lower
Alps
areas, particularly in the eastern 31–36 Alps where
and southwestern 49–51 the mountain
75 range rarely goes beyond
◦ Scandes 48–52 59–62
2600 m a.s.l. Then, in a 2 C warming, the ATD is projected to lose around 87 half of their extent in this
Pyrenees 74–76 90–92 99
region. While in the 3 ◦ C warming the losses are projected at 75%. Therefore, the extent of the ATD
Numbers in percent
in the Alps is projected to be only 19% of their present area. The remaining 6% is part of uncertain
changes (Figure 4). Consequently, almost the entirety of ATD areas below 3000 m a.s.l. are projected
to disappear.
Figure 4. Projected relative area change of the alpine tundra domain (ATD) under scenario RCP4.5 and
Figure 4. Projected relative area change of the alpine tundra domain (ATD) under scenario RCP4.5
RCP8.5 in in three warming levels. Changes with respect to the reference period (1981–2010) extent of
and RCP8.5 in in three warming levels. Changes with respect to the reference period (1981–2010)
the ATD in three regions: Alps, Scandes and Pyrenees. Categories in the legend according to Table 2
extent of the ATD in three regions: Alps, Scandes and Pyrenees. Categories in the legend according
and description in methods.
to Table 2 and description in methods.
Atmosphere 2020, 11, 698                                                                                      10 of 21
Atmosphere 2020, 11, x FOR PEER REVIEW                                                                        11 of 23

     Figure 5. Projected
     Figure 5.  Projectedchanges
                          changesofofthe
                                       thealpine tundra
                                            alpine  tundradomain
                                                             domain(ATD)  in the
                                                                      (ATD)       Alps
                                                                              in the   under
                                                                                     Alps    scenario
                                                                                          under       RCP4.5
                                                                                                 scenario    and
                                                                                                          RCP4.5
     RCP8.5  in three
     and RCP8.5       warming
                  in three     levelslevels
                           warming     with with
                                              respect to thetoreference
                                                   respect              period
                                                               the reference    (1981–2010).
                                                                              period (1981–2010).

     Table 4. Projected relative contraction (including the categories confident and likely contraction) of the
     alpine tundra domain (ATD) in three warming levels (1.5 ◦ C, 2 ◦ C and 3 ◦ C). Changes with respect to
     the extent of the ATD in the reference period (1981–2010) in three regions: Alps, Scandes and Pyrenees.
     Ranges computed according to the projected contraction in RCP4.5 and RCP8.5 simulations.

                                                           Warming Level
                        Region
                                             1.5   ◦C             2 ◦C               3 ◦C
                         Alps                31–36               49–51                 75
                       Scandes               48–52               59–62                 87
                       Pyrenees              74–76               90–92                 99
                                                                           Numbers in percent

      In the Scandes, a contraction of the ATD of around half of the present extent is projected in the
1.5◦C   warming level in both scenarios (Figure 6). In the 2 ◦ C warming level, a contraction of around
60% is projected in either scenario. The shrinking is particularly pronounced in the northern Scandes,
with the ATD persisting only in the highest mountain ranges. In the southern Scandes, the contraction
is less severe due to the presence of higher mountain ranges above 1800 m a.s.l., which may act as
Atmosphere 2020, 11, 698 11 of 21
refugia for alpine tundra biota. Then, in the 3 ◦ C warming level, 87% of the ATD is projected to
Atmosphere 2020, 11, x FOR PEER REVIEW
disappear and only 8% is projected to persist. The remaining 5% falls in the uncertain category.12 of 23
Figure
Figure 6. As for
6. As for Figure
Figure 55 but
but for
for the
the Scandes.
Scandes.
In the Pyrenees, the projected contractions of ATD are more pronounced than in the Alps and
Scandes. In this region, the shrinking is already above 74% in the 1.5 ◦ C warming level in both scenarios
(Figure 7). In the 2 ◦ C warming level, the projected contraction is above 90%, making that only around
4% of the ATD is projected to persist, whereas the ATD is projected to virtually disappear in a 3 ◦ C
warming level in the Pyrenees.Atmosphere 2020, 11, 698 12 of 21
Atmosphere 2020, 11, x FOR PEER REVIEW 13 of 23
Figure7.7.As
Figure As for
for Figure
Figure 55 but
but for
for the
thePyrenees.
Pyrenees.
Our findings indicate that both scenarios, RCP4.5 and RCP8.5, project comparable results across
4. Discussion
regions regarding the 1.5 and 2 ◦ C warming levels, as illustrated by Figure 4. Results describing
changesWein assessed the contraction
climate parameters are of
in the alpine tundra
Appendix A. using an approach that accounts for changes in
the area of analogous climates. The results of this study indicate that projected increases in the mean
temperature of the warmest month, the parameter defining the ATD, drive a pronounced contraction
4. Discussion
of the alpine tundra climate zone across European mountains.
WeThe
assessed
magnitudethe contraction
of contractionof theis alpine
smallertundra using
at lower an approach
warming levels.that
For accounts
instance, for
in changes
a 1.5 °C in
thewarming,
area of analogous climates.
the contraction in theThe results
Alps, Scandesof this
andstudy
Pyreneesindicate thatisprojected
together projected increases
at betweenin44%theandmean
temperature of the warmest month, the parameter defining the ATD, drive
48% of the present extent, which is equivalent to a contraction of around between 37,000 km and a pronounced contraction
2
of the alpine
41,000 km2 tundra climate
out of 86,000 kmzone across
2 in the European
reference period. mountains.
The contraction is projected to climb in the 2 °C
The magnitude
warming to above of 57%contraction
or aroundis49,000
smaller kmat2. lower
Lastly,warming
under a 3levels. For instance,
°C warming, in a 1.5 ◦loss
the projected C warming,
in the
thethree
contraction
regions in the Alps,
is 84% of theScandes
present and
extent,Pyrenees
or around together
72,000iskm
projected
2. at between 44% and 48% of the
presentOur
extent, which
results is equivalent
indicate that the to a contraction
RCP4.5 and RCP8.5 of around between
scenarios project37,000 km2 andcontraction
a comparable 41,000 km2ofout
of the ATD
86,000 km 2
under thereference
in the 1.5 and 2 period.
°C warming levels. This finding
The contraction is consistent
is projected to climbwith ◦
previous
in the evidence to
2 C warming
indicating
above 57% orthat
aroundthe effect
49,000ofkm 2 . Lastly,
the RCP tounder ◦ C warming,
reach aa3global warming thelevel is negligible
projected loss in over Europe
the three if
regions
compared to the internal variability in
is 84% of the present extent, or around 72,000 km . the time 2
period involved in reaching the warming level [53].
Nevertheless,
Our resultsaindicate
warmingthat of either 1.5 or 2and
the RCP4.5 °C RCP8.5
is projected to occur
scenarios earliera in
project RCP8.5 than
comparable in RCP4.5 of
contraction
thebecause these the
ATD under scenarios
1.5 andfollow different trajectories
2 ◦ C warming levels. Thisoffinding
greenhouse gases concentrations
is consistent with previous (Table 1).
evidence
This has implications for adaptation and mitigation because a trajectory
indicating that the effect of the RCP to reach a global warming level is negligible over Europe if following RCP8.5 will
shorten the
compared timeinternal
to the response to implement
variability in theadaptation
time period and involved
mitigationinactions.
reaching the warming level [53].
As expected, the contraction of the ATD ◦ is projected to occur first at lower elevations. That is,
Nevertheless, a warming of either 1.5 or 2 C is projected to occur earlier in RCP8.5 than in RCP4.5
the lower elevational boundary of the ATD zone, where the mean temperature of the warmest month
because these scenarios follow different trajectories of greenhouse gases concentrations (Table 1).
of the year is just below 10 °C. This is evidenced in the maps of ATD change under 1.5 °C warming
This has implications for adaptation and mitigation because a trajectory following RCP8.5 will shorten
in Figure 5 to Figure 7. Then, the contraction climbs to higher elevational belts under the 2 and 3 °C
the time response to implement adaptation and mitigation actions.
warming. A notable feature is that the fragmented nature of the ATD increases further at higher
As expected, the contraction of the ATD is projected to occur first at lower elevations. That is, the
warming levels. This opens questions regarding the persistence of small patches of ATD in the future.
lower elevational boundary of the ATD zone, where the mean temperature of the warmest month ofAtmosphere 2020, 11, 698 13 of 21
the year is just below 10 ◦ C. This is evidenced in the maps of ATD change under 1.5 ◦ C warming in
Figures 5–7. Then, the contraction climbs to higher elevational belts under the 2 and 3 ◦ C warming.
A notable feature is that the fragmented nature of the ATD increases further at higher warming levels.
This opens questions regarding the persistence of small patches of ATD in the future.
In this study we have focused on the alpine tundra, as defined by a single climatic metric.
Nevertheless, the contraction of the ATD domain is consistent with a range of documented and
projected environmental effects, such as changes in species diversity and composition and the function
of high-altitude mountains ecosystems. However, despite the great importance of the potential
impacts of a temperature increase in mountain systems, our understanding of the processes involved
is limited [22].
Reductions in the areal extent of the ATD can have an important impact on ecosystem functions
and consequently on its services [54]. For example, regarding water provision, winter snowpack
accumulation and snow retention in summer occurs in the highest belts of mountains’ environments,
associated with the ATD. The retention of snow is critical because it releases water from the mountains
during the summer months. Therefore, the contraction of the ATD is consistent with reductions
in snowpack, affecting, therefore, low elevation biota and changing mountain hydrology [4,16,55].
A declining snow cover and ice reservoir will prolong periods of low river flow in summer in many
parts of Europe. This can have negative consequences in several economic sectors including agriculture,
hydropower generation, water supply and river navigation [4,56].
Shrinks of the ATD support evidence of warming-driven changes in alpine plant assemblages that
suggest a decline in cold-adapted species and the increase in more warm-adapted species. This process
suggests a progressive decline of cold mountain habitats and their associated biota [10,11,54]. Nevertheless,
there is great uncertainty regarding potential impacts in plants diversity in mountain systems [22,57],
and there is controversy regarding whether the impacts of climate change will be negative in absolute
terms or there could be beneficial aspects as well [58,59]. For instance, Engler et al. [14] suggest that
36–55% of alpine plant species will lose more than 80% of their suitable habitat by the end of the
century in Europe. In contrast, Rixen and Wipf [60] indicate that the extinction of high mountain plants
may be mitigated by the high diversity of microhabitats, the longevity of alpine plants and positive
plant–plant interactions in harsh environments.
One of the most notable impacts of warming, consistent with ATD contraction, is the pervasive
shrink of glaciers [4,16,17]. Rapid changes in glaciers result in multiple impacts in social-ecological
systems, including formation of ice-marginal lakes, ice avalanches and mass movements [61,62],
runoff volume and sediment fluxes. Observational evidence indicates a consistent reduction in glacier
mass across mountains at global level, with the Alps and Pyrenees among the most affected zones [4,16].
Our assessment is consistent with previous studies that have demonstrated that warming will
affect notably high mountain environments in Europe. For instance, our results are in accordance with
a previous study assessing the changes of Köppen-Geiger climate zones in the Alps. Rubel et al. [30]
assessed observational and future changes using projections from a single RCM and end-of-century
RCP2.6 and RCP8.5 scenarios disaggregated at 30 arc-seconds (~1 km), which is the same horizontal
resolution used in our assessment. They used simulations from the RC4 RCM with boundary conditions
from the EC Earth model that is one of the 11 RCM models included in our assessment (see Table 1).
However, a direct comparison between both studies is not straightforward because Rubel et al. [30]
assessed impacts by the end of the century, while we assessed changes in relation to warming levels
that are projected to occur earlier. For example, the range of the 3 ◦ C warming in the 11 simulations
falls between 2037 and 2084, while the 1.5 and 2 ◦ C warming levels are projected to occur earlier
(see Table 1). Rubel et al. [30] indicate that by the 2076–2100 the alpine tundra in the Alps will be
constrained into small areas under RCP2.6 and is projected to disappear almost entirely under RCP8.5.
These findings are consistent with our results that projected a contraction of around 75% of the ATD in
the Alps in the 3 ◦ C under RCP8.5.Atmosphere 2020, 11, 698 14 of 21
Numerous studies on cryogenic changes indicate that snow cover, glaciers and permafrost are
projected to continue decline in European high mountains throughout this century [4]. As in the case
of the ATD, changes in glaciers are triggered primarily by atmospheric conditions. Hock et al. [63]
concluded that projected changes indicate that glaciers in European mountains will lose more than
75% of their current mass by the end of the century under RCP8.5 [4,63]. The Alps and Pyrenees will
be among the most affected zones exceeding 80%. Similarly, the losses in Scandinavian glaciers are
projected over 75% in the same scenario. In the study of Hock et al. [63], changes under RCP4.5 do not
diverge substantially from RCP8.5. Another study indicated that glaciers in the European Alps will
virtually disappear by 2100, projecting mass losses above 94% under RCP8.5 and above 63% under the
low emissions RCP2.6 [64].
Despite the fact that most studies assessed changes by the end of the century, in contrast to
our study that assessed changes earlier, and that glacier mass loss and ATD contraction are driven
by different factors, the projected changes of these two processes are in accordance with each other.
Similarities in the magnitude of the projected changes are reasonable considering that glaciers fall
entirely in the area delineated by the ATD (not shown), and that the contraction of this domain seems
consistent with glacier area and mass reduction.
We presented a transparent methodology for mapping changes in the alpine tundra climate
zone. Nevertheless, in addition to uncertainties in climate models, there may be some possible
limitations in this study. For instance, despite the fact that we used state-of-the-art RCM simulations,
their horizontal resolution might be coarser than then optimal resolution for assessments in high
mountains. We alleviated this issue by using the change factor downscaling method. This method
captures only the signal of change from climate models with no further local detail. However, when used
with input from RCMs provides suitable data for regions with complex topography [31].
The CHELSA climate data used in the reference period is a valuable data set for continental and
global studies. Nevertheless, the one kilometre horizontal resolution of CHELSA might be coarser than
the high horizontal resolution necessary to map microclimate zones [65,66]. For example, the Varanger
Peninsula, in the northeasternmost part of Norway, that would be part of the ATD according to the
national-level maps of Tveito et al. [67], falls partially outside the ATD using CHELSA or WorldClim.
Another limitation concerns the validation data set. A data set delineating the European domain
of the alpine tundra at a high spatial resolution is, to our knowledge, not available. Therefore, we used
a set of categories of the Map of Natural Vegetation of Europe for delineating the alpine tundra biome.
This map presents some constraints because it is based on expert knowledge. Despite this, the alpine
tundra biome map proved to be effective in the validation
Using the full ensemble of the CMIP5 simulations would give a better representation of uncertainty
in the future climate than the set of 11 RCM simulations used. Despite this limitation, Dosio [68]
demonstrated that the range of the 11 RCM simulations for a selection of climate change indices is in
accordance, over Europe, with the range produced using the full CMIP5 ensemble by Sillmann et al. [69].
The extent of the alpine tundra habitat is the product of the action of biotic and abiotic drivers.
Therefore, future changes in this habitat will be the result of these drivers and its interactions. Instead,
our method to delineate the ATD is based solely on climatic factors and no other drivers.
The approach used for delineating the ATD is based in one temperature metric. This is because
the Köppen-Geiger classification disregards a precipitation limit for delineating the alpine tundra as
moisture shortages are, in general, not characteristic of high elevations. This is in agreement with
Körner [15] and Körner and Paulsen [70] that found that a temperature threshold is the unique
predictor of the tree line altitude, which occurs just below the alpine tundra. Our study indicates that
mean annual precipitation is projected to increase in the ATD of the Alps and Scandes (Figure A2
in Appendix A) and to decrease in the Pyrenees between less of 1% and 8%, across scenarios and
warming levels, in relation to the 1207 mm/year of the reference period. This decrease results in a
projected precipitation well above, for example, the 200–250 mm/year that is considered the limit for
tree grow at the highest elevations [15].Atmosphere 2020, 11, 698 15 of 21
Assessing habitat exposure to climate change is challenging, and, actually, the multiple dimensions
of exposure can be represented by different metrics. In this study, we used one metric that accounts
for areal changes of the ATD. Assessments using more types of metrics could convey complementary
information regarding the potential impacts of climate change on species, habitats and biodiversity.
An example is the use of species distribution models with RCM data [71].
The ATD is projected to face a pronounced contraction in Europe, resulting from increased
temperatures. The shrinking of this domain is associated with a range of impacts in high mountain
ecosystems. Including habitat degradation and biodiversity loss, changes in mountain hydrology,
increased natural hazards and significant negative effects in recreational ecosystem services, among others.
Therefore, ecosystem-based adaptation efforts should be oriented to protect and restore key sensible
habitats and species. Nevertheless, adaptation options in high mountain environments face a number
of constraints arising from their unique topographic, edaphic and climatic characteristics [3,72].
In addition, the unprecedented projected changes open research challenges that should be addressed
before we can fully understand if and how humans can implement conservation options in alpine
areas to prevent, for instance, extinction of alpine species [60].
Impacts and adaptation challenges increase with warming level. Similarly, mitigation, as represented
by the 1.5 ◦ C warming, reduces projected losses of the alpine tundra. However, even in this case
the contraction of the alpine tundra and concomitant effects in mountain systems would be severe.
The effects are projected to increase in the 2 ◦ C warming, while the 3 ◦ C warming would imply that the
alpine tundra will be near to collapse in Europe.
Author Contributions: All authors contributed to the preparation of the paper. Conceptualization, J.I.B., A.M.
and G.C.; Data curation, J.I.B., A.M. and G.C.; Formal analysis, J.I.B., A.M. and G.C.; Funding acquisition, J.I.B.;
Investigation, A.M. and G.C.; Methodology, J.I.B., A.M. and G.C.; Project administration, J.I.B.; Resources, J.I.B.;
Supervision, J.I.B.; Validation, J.I.B., A.M. and G.C.; Visualization, J.I.B., A.M. and G.C.; Writing–original draft,
J.I.B.; Writing–review & editing, J.I.B., A.M. and G.C. All authors have read and agreed to the published version of
the manuscript.
Funding: This research received funding from the PESETA IV Project “Climate impacts and adaptation in Europe”,
European Commission, DG-CLIMA.
Acknowledgments: The authors acknowledge the EURO-CORDEX initiative for providing the climate simulations
obtained from the Earth System Grid Federation server. We are grateful to all the modelling groups that performed
the simulations and made their data available, namely, Laboratoire des Sciences du Climat et de l’Environnement
(IPSL), Institut National de l’Environnement Industriel et des Risques, Verneuil en Halatte (INERIS), the CLM
community (CLMcom), the Danish Meteorological Institute (DMI), the Royal Netherlands Meteorological Institute
(KNMI), and the Rossby Centre, Swedish Meteorological and Hydrological Institute (SMHI). We also thank
the CHELSA (Climatologies at high resolution for the earth’s land surface areas) and WorldClim initiatives for
providing the baseline climate data sets. The authors would like to thank two anonymous reviewers who have
provided helpful comments on the refinement of the paper. The views expressed in this article are those of the
authors and do not necessarily reflect an official position of the European Commission.
Conflicts of Interest: The authors declare no conflict of interest. The funders had no role in the design of the
study; in the collection, analyses, or interpretation of data; in the writing of the manuscript, or in the decision to
publish the results.
Appendix A. Climate Parameters
Changes in climate parameters indicate that the area of the ATD is projected to be warmer across
regions, whereas projected changes in precipitation are less homogeneous, indicating a wetter climate
in the Alps and Scandes and a drier climate in the Pyrenees. Temperature is projected to increase in
winter and summer across scenarios, warming levels and regions (Figure A1). In the Alps and Scandes,
the increase is more pronounced in winter, in contrast to the Pyrenees where the increase is greater in
summer. Thus, the mean annual temperature is projected to increase from the current −1.3, −1.8 and
0.6 ◦ C in the Alps, Scandes and Pyrenees, respectively, to 0.2, 0 and 2.3 ◦ C in the 2 ◦ C warming level.
Comparable results between RCP4.5 and RCP8.5 are projected in the 1.5 and 2 ◦ C warming levels.
In the 3 ◦ C warming level, the mean annual temperature is projected to almost double the increaseAtmosphere 2020, 11, 698 16 of 21
projected in the 2 ◦ C warming, thus projecting temperatures at 1.5, 1.2 and 3.6 ◦ C in the three regions,
respectively (Table A1).
The mean temperature of the warmest month, the parameter that defines alpine tundra, in the
three ATD regions ranged between 7.9 and 9 ◦ C in the referenced period. Projected changes indicate
that this parameter will average between 9.8 and 11.4 ◦ C in the 2 ◦ C warming level under RCP4.5
(9.7 and 11.4 ◦ C under RCP8.5), and 11.2 and 13.1 ◦ C in the 3 ◦ C warming. These figures are consistent
with the projected contractions of ATD shown in the results section.
In the ATD, mean annual precipitation is projected to decrease in the Pyrenees across scenarios
and warming levels between less than 1% and 8% in relation to the 1207 mm of the reference period
(Figure A2). The projected decrease is more pronounced in the summer half of the year. For example,
a decrease of 12% is projected in this season in the 3 ◦ C warming in relation to the 618 mm of the
reference period. In contrast, in the ATD of the Alps and Scandes, annual precipitation is projected to
increase between 2% and 4% across warming levels in the first region, and between 4% and 11% in the
former, in relation to the 1230 and 991 mm, respectively, of the reference period in both regions. In the
Alps, the projected increase is more pronounced in winter, in contrast to the Scandes, where a larger
Atmosphere
increase 2020, 11, x in
is projected FOR PEER REVIEW
summer. 18 of 23
Projected temperature ◦ C) in the alpine tundra domain (ATD) across scenarios
Figure A1. A1.
Figure Projected temperaturechange
change( (°C) in the alpine tundra domain (ATD) across scenarios
relative to the
relative reference
to the referenceperiod
period(1981–2010)
(1981–2010) in in three
three regions. Resultsare
regions. Results areshown
shown forfor
thethe
11 11
RCMRCM
simulations for for
simulations RCP4.5
RCP4.5and RCP8.5
and RCP8.5ininthree
threewarming
warming levels. Summer(orange):
levels. Summer (orange): temperature
temperature of the
of the
summer
summer half half
of theofyear;
the year;
annualannual (purple):
(purple): annualannual temperature;
temperature; winter
winter (blue):
(blue): temperature
temperature of the
of the winter
winter half of the year; tmax (red): temperature of the warmest month of the
half of the year; tmax (red): temperature of the warmest month of the year. The median (horizontal year. The median
(horizontal
line in line in
boxes), mean boxes),
(black mean
circle (black circle
in boxes), 25–75% in boxes), 25–75% and
range (boxes), rangeminimum
(boxes), and minimum range
to maximum to
maximum range (whiskers) across the 11 simulations are shown for each scenario, period
(whiskers) across the 11 simulations are shown for each scenario, period and season. Note that the 3 ◦ C and season.
Note
period wasthat the 3 °C period
computed only inwas computed only in RCP8.5.
RCP8.5.You can also read