Functional Toll-Like Receptors (TLRs) Are Expressed by a Majority of Primary Human Acute Myeloid Leukemia Cells and Inducibility of the TLR ...
←
→
Page content transcription
If your browser does not render page correctly, please read the page content below
cancers
Article
Functional Toll-Like Receptors (TLRs) Are Expressed
by a Majority of Primary Human Acute Myeloid
Leukemia Cells and Inducibility of the TLR Signaling
Pathway Is Associated with a More
Favorable Phenotype
Annette K. Brenner 1,2 and Øystein Bruserud 1,2, *
 1    Department of Medicine, Haukeland University Hospital, 5021 Bergen, Norway
 2    Section for Hematology, Department of Clinical Science, University of Bergen, 5020 Bergen, Norway
 *    Correspondence: oystein.bruserud@helse-bergen.no; Tel.: +47-55-97-29-97

 Received: 31 May 2019; Accepted: 9 July 2019; Published: 11 July 2019

 Abstract: Acute myeloid leukemia (AML) is a highly heterogeneous disease with regard to biological
 characteristics and receptor expression. Toll-like receptors (TLRs) are upstream to the transcription
 factor NFκB and part of the innate immune system. They are differentially expressed on AML blasts,
 and during normal hematopoiesis they initiate myeloid differentiation. In this study, we investigated
 the response upon TLR stimulation in an AML cohort (n = 83) by measuring the increase of
 NFκB-mediated cytokine secretion. We observed that TLR4 is readily induced in most patients,
 while TLR1/2 response was more restricted. General response to TLR stimulation correlated with
 presence of nucleophosmin gene mutations, increased mRNA expression of proteins, which are part of
 the TLR signaling pathway and reduced expression of transcription-related proteins. Furthermore,
 signaling via TLR1/2 appeared to be linked with prolonged patient survival. In conclusion, response
 upon TLR stimulation, and especially TLR1/2 induction, seems to be part of a more favorable
 phenotype, which also is characterized by higher basal cytokine secretion and a more mature
 blast population.

 Keywords: acute myeloid leukemia; toll-like receptors; cytokine; epigenetic modification; survival

1. Introduction
       Acute myeloid leukemia (AML) is an aggressive malignancy which is characterized by bone
marrow infiltration of immature leukemic cells. Even though AML is the most common acute leukemia,
it still is a relatively rare disease with a late onset in life [1,2]. Most cases occur without apparent cause,
but AML can also be secondary to for instance myelodysplastic syndromes (MDS) or chemotherapy [3,4].
The disease is highly heterogeneous with regard to cell morphology, cytogenetics and gene mutations,
of which especially the latter two influence prognosis and, ultimately, overall survival [5].
       Toll-like receptors (TLRs) are part of the innate immune system and detect pathogen- and danger
associated molecular patterns derived from bacteria, viruses, fungi or parasites [6]. In humans, ten TLRs
have been identified so far [7]. The TLRs differ in their localization as TLR1/2/4–6/10 are situated
at the plasma membrane, whereas TLR3/7–9 and partially TLR4 localize to membranes of cytosolic
compartments [8]. Upon ligand binding, TLRs homo- or heterodimerize which leads to recruitment of
adaptor proteins—with MyD88 being the most abundant as it is shared by all TLRs but TLR3 [9]—and
the subsequent initiation of signaling cascades [8]. The latter have a common target in the transcription
factor NFκB which upon activation leads to the transcription of pro-inflammatory cytokines [7,10].

Cancers 2019, 11, 973; doi:10.3390/cancers11070973                                www.mdpi.com/journal/cancers
Cancers 2019, 11, 973 2 of 18
Previous studies suggest that TLRs are expressed by various hematological malignant cells,
including AML cells, and TLR agonists may therefore have direct effects on the leukemic cells [11]. First,
primary AML cells seem to have increased levels of TLR2 and TLR4 [12], which then are associated
both with chemoresistance and monocytic differentiation [13]. Second, several TLRs are also expressed
in AML cell lines and specific receptor agonists seem to employ growth-inhibitory and pro-apoptotic
effects in some of the cell lines [13,14]. Third, the dual TLR7/8 agonist R848 inhibited the growth of
human AML cells in immunodeficient mice through a direct effect on the AML cells [15]. TLRs are also
expressed by AML stem cells, and TLR1/2 ligation stimulates stem cell growth [16]. Thus, whether
TLR ligation causes growth inhibition or stimulation seems to depend on the experimental model, and
the results are also conflicting whether TLR ligation can induce leukemic cell differentiation [15,17].
TLRs are furthermore regarded as possible drug targets in AML due to indirect antileukemic effects
caused by the activation/stimulation of normal immunocompetent cells, e.g., for eradication of residual
leukemic cells after induction therapy [18]. Furthermore, the release of pro-inflammatory cytokines
as a result of TLR stimulation can enhance the immunogenicity of AML blasts, rendering them more
susceptible towards treatment [19].
As outlined above, previous studies of TLRs in AML have mainly focused on cell proliferation
and survival, and several of the studies were mainly based on the use of cell lines. In the present study,
we therefore focused on detection of functional receptors (i.e., protein expression), mRNA expression
of TLRs and proteins of the downstream signaling pathway, communication with neighboring
non-leukemic cells (i.e., cytokine release) and associations between TLR responsiveness and genomic
profiles. None of these aspects have been addressed in previous studies on a large and unselected patient
cohort. We found TLR response to be correlated with nucleophosmin (NPM1) mutations, increased
mRNA expression of proteins of the TLR signaling pathway, and low expression of transcription-related
proteins. Furthermore, especially signaling via the TLR1/2-NFκB axis appeared to be associated with
an improved outcome.
2. Results
2.1. AML Patients Included in the Study
We investigated primary human AML cells derived from 83 consecutive patients admitted to the
Section for Hematology, Haukeland University Hospital, which is responsible for diagnosis and clinical
handling of all AML patients within a defined geographical area. The cell samples were derived from
patients with relatively high levels of circulating leukemic cells. The cells were stored in the public
biobank of the Section for Hematology. Diagnostic information about each sample was available from
the biobank (i.e., karyotype and mutational characteristics, FAB classification based on histochemistry,
flow cytometric analyses of differentiation markers, results of treatment) together with the enrichment
of leukemic cells in the samples. All experiments were based on cryopreserved viable cells; all cells
were collected, prepared, cryopreserved and thawed according to highly standardized protocols.
All samples were prepared by density gradient separation (see Section 4.1.). Thus, our patients should
be regarded as a population-based and unselected cohort of AML patients with relatively high levels of
circulating blasts to allow for preparation of highly enriched AML cell populations based on gradient
separation alone. Most contaminating cells (usuallyCancers 2019, 11, x973 3 3of
of 18
18
exceptional high increase in the chemokines CCL2/3 and CXCL1, the interleukins IL-1β and IL-6, and
high increasetumor
additionally in the chemokines
necrosis factorCCL2/3 and CXCL1,
α (TNFα) the interleukins
and granulocyte IL-1β and IL-6, and
colony-stimulating additionally
factor (G-CSF;
Figure 1). Only the protease inhibitors cystatin C and serpin E1 were little affected by LPS 1).
tumor necrosis factor α (TNFα) and granulocyte colony-stimulating factor (G-CSF; Figure Only the
attribution,
proteasewas
which inhibitors
expected cystatin C andsignaling
as TLR serpin E1foremost
were littleleads
affected
to bytheLPS attribution,
expression ofwhich was expected
pro-inflammatory
as TLR signaling foremost leads to the expression of pro-inflammatory
cytokines. In the Figure, we show the increase in mediator release as the median fraction cytokines. In thebetween
Figure,
we show the increase in mediator release as the median fraction between samples
samples with and without TLR agonists. We used the median values (i.e., the median effect on AML with and without
TLR agonists.
cells) for each We used
single the median
mediator values
in order to (i.e., the median
visualize effectofonallAML
the effects cells)on
agonists forall
each singlemediators
soluble mediator
in order to visualize
in a single figure. the effects of all agonists on all soluble mediators in a single figure.
Pam3CSK4
Flagellin
R848
LPS
Mediator
CCL2
TNFa
CCL3
CXCL1
IL-1b
G-CSF
IL-6
CCL4
CCL5
MMP-1
CXCL5
CXCL8
CXCL10
GM-CSF
MMP-2
Cystatin C
Serpin E1
HGF
IL-1RA
MMP-9
Distance metrics: Euclidean
Linkage: COMPLETE
0.0 0.5 1.0 1.5 2.0
Figure 1. Log-transformed median mediator secretion increase in AML cells after incubation in TLR
Figure 1. Log-transformed median mediator secretion increase in AML cells after incubation in TLR
single agonists for 48 h. For each of the 20 soluble mediators (right part of the figure) we estimated
single agonists for 48 h. For each of the 20 soluble mediators (right part of the figure) we estimated
and log-transformed the median effect of the four various TLR agonists (see top of the figure), i.e.,
and log-transformed the median effect of the four various TLR agonists (see top of the figure), i.e., the
the figure is based on the median results for all patients for each agonist/soluble mediator combination.
figure is based on the median results for all patients for each agonist/soluble mediator combination.
Median values were used in order not to over-estimate the change from low basal levels, and at the
Median values were used in order not to over-estimate the change from low basal levels, and at the
same time not to under-estimate the change from basal levels that were close to detection limit of the
same time not to under-estimate the change from basal levels that were close to detection limit of the
assay. IL-6 was the most readily upregulated cytokine with medians of 5-fold (Pam3CSK4), 10-fold
assay. IL-6 was the most readily upregulated cytokine with medians of 5-fold (Pam3CSK4), 10-fold
(R848), 45-fold (flagellin) and 300-fold (LPS) concentration increases. The secretion of the protease
(R848), 45-fold (flagellin) and 300-fold (LPS) concentration increases. The secretion of the protease
inhibitors cystatin C and serpin E1 on the other hand were not altered by TLR ligands.
inhibitors cystatin C and serpin E1 on the other hand were not altered by TLR ligands.
2.3. Response towards Agonists Is Linked with Mutations in the Nucleophosmin Gene
2.3. Response towards Agonists Is Linked with Mutations in the Nucleophosmin Gene
Approximately 70% of the 83 patient cell cultures showed a significant increase in mediator
Approximately
secretion 70% of
after stimulation theTLR
with 83 patient
agonists.cell
TLRscultures
ligationshowed a significant
can initiate increase
intracellular in mediator
signaling through
secretion
their mainafter stimulation
pathway directlywith
down TLR agonists.
to NFκB [20],TLRs ligation
but other can initiate
pathways intracellular
that either signaling
are additionally
through
activated their
or showmain pathway
crosstalk with directly
TLR-NFκB down
may toalsoNFκB [20],mediator
influence but other pathways
release that either
[21]. However, NFκB areis
additionally activated or show crosstalk with TLR-NFκB may also influence mediator
documented as an important regulator of the release of several soluble mediators. For these reasons, release [21].
However,
we decided NFκB
prioristodocumented
beginning the as an important
study regulatorrelease
to use cytokine of the release of several
as the readout forsoluble mediators.
responsiveness to
For these reasons, we decided prior to beginning the study to use cytokine release as the
TLR agonists, and to quantify this responsiveness not only by the effects on a single mediator. First, readout for
responsiveness
based on the 10to TLR agonists,
unselected and to quantify
test patients this responsiveness
(see Section 4.2.) we definednot only by the effects
a significantly alteredon a single
level for a
mediator. First, based on the 10 unselected test patients (see Section 4.2.) we defined
single mediator as: (i) at least doubling in concentrations for control values > 100 pg/mL, or (ii) ana significantly
altered level for a single mediator as: (i) at least doubling in concentrations for control values > 100
pg/mL, or (ii) an increase of at least 100 pg/mL for values below that threshold. Second, we defined aCancers 2019, 11, 973 4 of 18
increase of at least 100 pg/mL for values below that threshold. Second, we defined a positive response
to a single agonist as significantly increased levels of at least 1/3 (i.e., seven or more) of the mediators
and a partial response as significantly altered levels of at least two mediators. Finally, a positive
response towards general TLR stimulation was defined as either increase in at least 7/19 mediators
for at least two agonists, or an increase of at least 7/19 mediators in one agonist and partial response
(2–6 mediators) in at least two additional agonists. Partial response was then defined as partial response
to stimulation of at least two agonists. Using these definitions, 57 of the patients were considered to be
responders, 10 to be partial responders and 16 to be non-responders to TLR stimulation.
TLR responsiveness appeared to be independent of most AML prognostic factors or patient
characteristics. Patient age, gender, disease etiology and FMS-related tyrosine kinase-internal tandem
repeats (Flt3-ITDs) did not significantly correlate with response upon TLR stimulation. However,
we saw that cells with NPM1 mutations were associated with higher likelihood to be induced by TLR
agonists, except for R848 (TLR7/8 agonist). Only 1/23 (4%) patients with an NPM1 insertion did not
respond or showed only partial response to the group of agonists as compared to 20/44 (45%) patients
lacking these mutations (χ2 likelihood ratio, p < 0.001; the first diagnosis data were used for patients
with two samples). The same pattern was observed for the single agonists: Pam3CSK4 (TLR1/2 agonist)
showed 41% unresponsive patients with NPM1-mutations as compared to 81% of patients without
(p = 0.006). The corresponding values for LPS (TLR4 agonist) and flagellin (TLR5 agonist) were p
= 0.011 (4% vs. 32%) and p = 0.033 (14% vs. 45%). We also saw a correlation between general TLR
responsiveness and CD34- cells (62% vs. 24% for CD34+ cells; p = 0.012), which most likely is caused
by the close association between NPM1 insertions and CD34- cells. Furthermore, it appeared as if
cytogenetics correlated with R848 (TLR7/8 agonist) response: 23/45 patients (45%) with normal or
favorable (i.e., core-binding factor AML) karyotype responded with increased cytokine secretion upon
R848 stimulation as opposed to 7/28 patients (25%) with an intermediate or adverse karyotype (Fisher’s
exact test, p = 0.010). Lastly, borderline correlation for monocytic differentiation according to the FAB
classification and TLR response was also seen for flagellin (TLR5 agonist, p = 0.032) and Pam3CSK4
(TLR1/2 agonist, p = 0.056). However, we want to emphasize that patient subgroups are relatively
small; these results should therefore be interpreted with great care because the number of patients will
only allow us to detect the strongest associations.
2.4. Response towards the TLR1/2 Agonist Is Linked with Prolonged Patient Survival
Our samples were collected from consecutive AML patients, and our cohort therefore has a
high median age and includes several elderly and unfit patients. For this reason, our cohort should
be regarded as representative for the AML population, but at the same time only a subset of our
patients received intensive remission-inducing and potentially curative treatment. A total of 41 patients
received intensive treatment; two of these patients were lost from follow-up and one died from toxicity
26 days after start of induction therapy. We therefore investigated the associations between TLR
agonist responsiveness and overall survival for the remaining 38 patients. By that, we have a study
population where the patients either died from chemoresistant AML (primary refractory disease
or relapse) or survived without relapse after a median follow-up time of 92 months. Death due to
toxicity/comorbidity thus did not influence our comparison of in vitro AML cell biology and clinical
AML cell chemosensitivity.
Pam3CSK4, the TLR1/2 heterodimer agonist, was to a lesser degree—both quantitatively and
qualitatively—than the other three agonists able to induce mediator expression. Only 33% of patients
(26/78; samples for five patients were missing from Pam3CSK4 analysis) were responders to TLR1/2
induction, whereas 40% (31/78 patients) were unresponsive to Pam3CSK4. Importantly, patient
survival was associated with TLR responsiveness (p = 0.037; Figure S1) as median survival for (partial)
responders was 2.3 years (95% CI: 1.19–3.31 years) as opposed to 0.58 years (95% CI: 0.16–1.01 years)
for non-responders. However, one has to be careful with the interpretation of these data, as only
7/38 patients were in the non-responder group. Of the single agonists, only response upon TLR1/2Cancers 2019, 11, 973 5 of 18
stimulation was associated with prolonged patient survival (p = 0.045; Figure 2). The median survival
Cancers 2019, 11, x 5 of 18
time for the 23 (partial) responders was 2.4 years as compared to only 0.67 years (95% CI: 0.26–1.08 years)
for the 13for
years) non-responders. Interestingly,
the 13 non-responders. two of thetwo
Interestingly, three
of patients—one of them received
the three patients—one of them potential
received
curative treatment and was included in the survival statistics—with samples from both first
potential curative treatment and was included in the survival statistics—with samples from both first diagnosis
and relapseand
diagnosis changed
relapsefrom beingfrom
changed responders at first diagnosis
being responders at first to being non-responders
diagnosis at relapse.at
to being non-responders
Because
relapse.AML relapse
Because AMLis associated
relapse iswith a more with
associated aggressive
a moredisease, beingdisease,
aggressive non-responsive towards TLR
being non-responsive
induction might be part of a less favorable phenotype.
towards TLR induction might be part of a less favorable phenotype.
100 (Partial) responders
Non-responders
80
Percent survival
60
p = 0.045
40
20
0 2 4 6 8 10 12
Survival (yrs)
Figure 2. Patient survival dependent on response towards TLR agonists. Lack of response towards
Figure 2. Patient survival dependent on response towards TLR agonists. Lack of response towards
TLR1/2 targeting by Pam3CSK4 was significantly linked with poor outcome (log-rank test).
TLR1/2 targeting by Pam3CSK4 was significantly linked with poor outcome (log-rank test).
Because we observed that mutations in NPM1 and partially cytogenetics correlated with TLR
Because we observed that mutations in NPM1 and partially cytogenetics correlated with TLR
response, we additionally performed Cox regression for uni- and multivariate analysis, including the
response, we additionally performed Cox regression for uni- and multivariate analysis, including the
terms TLR response, patient age (younger or older than 60 years), disease etiology (relapse/secondary vs.
terms TLR response, patient age (younger or older than 60 years), disease etiology (relapse/secondary
de novo AML), NPM1 insertions, Flt3-ITD, and normal/favorable vs. intermediate/adverse karyotype.
vs. de novo AML), NPM1 insertions, Flt3-ITD, and normal/favorable vs. intermediate/adverse
Both older patient age (crude hazard ration, HR = 1.82; p = 0.006) and borderline lack of TLR1/2
karyotype. Both older patient age (crude hazard ration, HR = 1.82; p = 0.006) and borderline lack of
responsiveness (HR = 1.52; p = 0.057) arose as negative prognostic factors in the univariate analyses.
TLR1/2 responsiveness (HR = 1.52; p = 0.057) arose as negative prognostic factors in the univariate
However, only lack of TLR1/2 induction (HR = 1.86; p = 0.029) emerged as independent negative
analyses. However, only lack of TLR1/2 induction (HR = 1.86; p = 0.029) emerged as independent
prognostic factor in the multivariate Cox regression (Table 1). Because mutation status is missing
negative prognostic factor in the multivariate Cox regression (Table 1). Because mutation status is
for four patients (one TLR1/2 responsive patient; one long-term survivor), the latter analyses only
missing for four patients (one TLR1/2 responsive patient; one long-term survivor), the latter analyses
contained 32 out of the 36 patients with survival data.
only contained 32 out of the 36 patients with survival data.
Table 1. Multivariate analysis with adjusted hazard ratio for parameters associated with AML prognosis.
Table 1. Multivariate analysis with adjusted hazard ratio for parameters associated with AML
prognosis. Variable Adj. HR 95% CI p-Value
TLR1/2 (non-responder) 1 1.86 1.07–3.24 0.029
Variable Adj. HR 95% CI p-Value
Age (≥60 years) 1.57 0.86–2.88 0.145
TLR1/2 (non-responder) 1 1.86 1.07–3.24 0.029
Etiology (secondary) 3.05 0.62–14.94 0.170
Age (≥60 years)
Cytogenetics (intermediate/adverse) 0.56 1.57 0.86–2.88
0.14–2.29 0.145
0.422
Etiology
Flt3-ITD (secondary) 2.53 3.05 0.62–14.94
0.80–7.95 0.170
0.113
Cytogenetics (intermediate/adverse) 0.81 0.56 0.21–3.24
NPM1-insertion 0.14–2.29 0.422
0.758
Flt3-ITD
1 Reference 2.53 0.80–7.95 0.113
value. HR: hazard ratio; CI: confidence interval.
NPM1-insertion 0.81 0.21–3.24 0.758
1 Reference value. HR: hazard ratio; CI: confidence interval.
2.5. Response upon TLR Activation Is Correlated with Increased Expression of Genes in the TLR Signaling
Pathway and High Constitutive Cytokine Release
2.5. Response upon TLR Activation Is Correlated with Increased Expression of Genes in the TLR Signaling
We searched AmiGo 2 [22] for gene ontology (GO) terms related to “TLR signaling” and identified
Pathway and High Constitutive Cytokine Release
129 distinct human proteins. After median-normalization, we clustered the mRNA expression of
Weproteins
these 129 searchedobtained
AmiGofrom 2 [22] for gene analysis
microarray ontology(see
(GO) terms
Section related
4.4) to “TLR signaling”
in 46 unselected and
patients (the
identified
patients are 129 distinct
indicated humanS2).
in Table proteins.
The mainAfter median-normalization,
subgroup that determined we the clustered the mRNA
patient distribution
inexpression
the clusterofincluded
these 12938proteins obtained
differentially from microarray
expressed analysis3).
proteins (Figure (see Section
These 4.4) in 46contained
38 proteins unselected
patients (the patients are indicated in Table S2). The main subgroup that determined the patient
distribution in the cluster included 38 differentially expressed proteins (Figure 3). These 38 proteins
contained six TLRs (among them the targeted TLR1, TLR4, TLR5, TLR7 and TLR8), important co-
receptors, such as CD14, and adaptors, such as MyD88 (Table 2). But we also found proteins upstreamCancers 2019, 11, 973 6 of 18
Cancers 2019, 11, x 6 of 18
six TLRs (among them the targeted TLR1, TLR4, TLR5, TLR7 and TLR8), important co-receptors,
such
to as CD14,
TLRs, and adaptors,
like TLR chaperonessuch as MyD88
and (TableTLR
the intrinsic 2). But we also
agonists found proteins
S100A8 and A9. upstream
Furthermore,to TLRs,
we
like TLR chaperones
identified andand
three positive the intrinsic TLRpathway
13 negative agonistsregulators.
S100A8 andAmong
A9. Furthermore, wefive
the latter are identified three
inhibitors of
positive and 13 negative pathway regulators. Among the latter are five inhibitors
NFκB: ARRB2 and HAVCR2 attenuate NFκB mediated transcription, whereas NFKBIA, PIK3AP1 of NFκB: ARRB2 and
HAVCR2
and TANK attenuate NFκB activation.
inhibit NFκB mediated transcription, whereas NFKBIA,
Thus, the differentially PIK3AP1
expressed genes and TANKto
belonged inhibit NFκB
all steps in
activation.
the Thus, the
TLR signaling differentially expressed genes belonged to all steps in the TLR signaling pathway.
pathway.
TLR1/2 responders
Cytokine secretion
Responders
UNC93B1
FAB M4/5
CD300LF
TNFAIP3
PIK3AP1
HAVCR2
MAP3K1
CD300A
TICAM2
NFKBIA
S100A8
S100A9
ARRB2
MYD88
CNPY3
RAB7B
ITGAM
FLOT1
CTSL1
IRAK3
ITGB2
CYBA
PELI1
CTSB
TANK
CTSS
CAV1
CD36
CD86
CD14
TLR1
TLR6
TLR4
TLR7
TLR5
TLR8
LY96
LYN
LTF
Patient ID
6
12
22
60
20
21
74
62
29
66
39
42
68
7
46
72
81
10
24
58
16_1
53
82
77
41
49_2
9
51
15
17
23
55
38
67
25
33
37
64
19
26
28
35
43
48
57
13
Distance metrics: Euclidean
Linkage: COMPLETE
-5 -4 -3 -2 -1 0 1 2 3 4 5
Figure 3. A
Figure 3. A cluster
clustercontaining
containingthe the3838
outout of 129
of 129 genes
genes belonging
belonging to thetoGO-term
the GO-term “TLR signaling”
“TLR signaling” (based
(based on the AmiGO database) that were most differentially expressed among
on the AmiGO database) that were most differentially expressed among the 46 unselected patients in the 46 unselected
patients
our study.in The
our remaining
study. Thegenes,
remaining genes,TLR2,
including including
showed TLR2,
onlyshowed only minor
minor variations variations
among among
patients and
patients and did not differ significantly between the two identified clusters.
did not differ significantly between the two identified clusters. Six of the ten TLR receptors showedSix of the ten TLR
receptors showed
differential differential
expression expression
(i.e., were included (i.e.,
amongwere the
included among
38 genes) andtheare38indicated
genes) and are top
at the indicated
of the
at the top
figure. Allofvalues
the figure.
wereAll values
median were median
normalized andnormalized and log2thus
log2 -transformed, -transformed, thuscolor
red and blue red and blue
indicate
color indicate values above and below the median, respectively. The most differentially
values above and below the median, respectively. The most differentially expressed genes were the expressed
genes were the TLR4
TLR4 co-receptor co-receptor
CD14, and the CD14, and the S100A8
TLR4 ligands TLR4 ligands
and A9 S100A8
(on theandfarA9 (on the
right). far right).
Patient Patient
distribution
distribution
in the cluster in was
the cluster was correlated
correlated with response with upon
response
TLRupon TLR induction,
induction, especially especially by the TLR1/2
by the TLR1/2 ligand
ligand Pam3CSK4,
Pam3CSK4, basal cytokine
basal cytokine secretion
secretion levels levels and monocytic
and monocytic cell differentiation
cell differentiation according
according to thetoFAB the
FAB system.
system. The The numbers
numbers behind
behind thethe patient
patient IDID correspond
correspond toto thededenovo
the novosample
sample(1)
(1)and
and the relapse
sample (2) for patients with cells sampled at dual time points. All cells included in this analysis were
gradient-separated
gradient-separated and and cryopreserved
cryopreserved primary
primary AML AML cell as described in Section Section 4.1.
4.1. mRNA
mRNA was
prepared immediately after thawing without any kind kind of
of cell
cell stimulation/incubation.
stimulation/incubation.Cancers 2019, 11, 973 7 of 18
Table 2. Overview of the 38 differentially expressed mRNA levels of proteins belonging to the GO-term
“TLR signaling” and their function in the TLR pathway. The three proteins in bold were found to be
overexpressed in the patient subset with reduced response towards TLR targeting.
Function Proteins
Chaperone, translocation CNPY3/PRAT4A, UNC93B1
TLR cleavage CTSB, CTSS
Agonists S100A8, S100A9
Receptors TLR1, TLR4, TLR5, TLR6, TLR7, TLR8
Co-receptors CD14, CD36, CD86, LY96/MD2
Adaptors, co-factors CTSL1, MYD88, PIK3AP1/BCAP, TICAM2/TRAM
Downstream targets CYBA, MAP3K1/MEKK1, PELI1
Positive regulators/feedback pathways CAV1, FLOT1, LTF
ARRB2, CD300A, CD300LF, HAVCR2/TIM-3, IRAK3/IRAK-M,
Negative regulators/feedback pathways ITGAM/CD11b, ITGB2, LYN, NFKBIA, PIK3AP1/BCAP,
RAB7B, TANK, TNFAIP3
The 46 patients could be categorized into two groups: 13 patients with generally increased mRNA
levels, and 33 patients with low mRNA TLR pathway expression. In the high expression group,
responders to general TLR activation (12/13 vs. 19/33 patients; Fisher’s exact test: p = 0.035) and
especially TLR1/2 activation (9/12 vs. 8/30 patients; Fisher’s exact test: p = 0.006) were overrepresented.
Therefore, response to TLR targeting is at least partly reflected at the mRNA level. Interestingly,
12/13 differentially expressed negative pathway regulators were also found to be upregulated in the TLR
responders, indicating that these cells have the ability to counteract pro-longed TLR pathway activation.
We further analyzed whether high basal constitutive release correlated with the TLR response in
Figure 3; these analyses were based on the mediators with large concentration ranges and showing
high increase in response to TLR activation, namely all chemokines, IL-1β, IL-6 and TNFα. Patients
with release above 1 ng/mL in at least two mediators were defined to have high basal levels, whereas
patients with undetectable values (usually corresponding to less than 5 pg/mL) in at least five mediators
were defined to have low constitutive release. We first compared the high mRNA level patients (n = 13)
with the patients in the other main subset (n = 33). Eight out of 13 patients in the high expression
group then presented with high basal cytokine levels without TLR stimulation as compared to only
5/33 patients in the low expression group (Fisher’s exact test: p = 0.003). Thus, the mRNA levels of
TLR signaling components also seem to reflect the cells’ ability to constitutively produce cytokines.
Across the groups in Figure 3, high basal cytokine secretion was seen in 12/31 patients with high TLR
responsiveness, whereas only one TLR responder did not show high cytokine release (Fisher’s exact
test, p = 0.035). The corresponding fractions for TLR1/2 response were 9/17 vs. 4/25 patients (Fisher’s
exact test, p = 0.018). Thus, a strong responsiveness to TLR agonists was generally associated with
high constitutive release of soluble mediators. Further, cells with monocytic cell differentiation (FAB
M4/M5) were overrepresented among the high TLR mRNA expression group (10/12 vs. 12/31 patients;
Fisher’s exact test: p = 0.016); whereas insertions in NPM1, despite of correlating with TLR response,
were evenly distributed between the two groups (4/11 vs. 10/28 patients).
2.6. TLR Responders Show Low mRNA Expression of Transcription-Related Proteins
We analyzed the global gene expression profile for the same patients as in the previous chapter but
excluded partial responders to general TLR stimulation. The compared groups then contained 31 TLR
responders and 9 TLR non-responders. We performed a significance analysis of microarrays (SAM)
using a false discovery rate (FDR) of 5.0 (corresponding to p < 0.05) as cut-off value. The analysis
identified 217 probes coding for 155 annotated proteins, and 62 probes coding for 45 annotated proteins
that were overexpressed in the TLR non-responders and the TLR responders, respectively. Out of the
200 annotated proteins, 56 have been studied in or are associated with hematopoiesis, AML or related
diseases (MDS, APL, Schwachman-Diamond Syndrome).Cancers 2019, 11, 973 8 of 18
Functional annotation using DAVID 6.8 showed that the main enriched functional GO-term in
Cancers 2019, 11, x 8 of 18
the non-responders was “transcription, DNA templated”, which contained 38 genes (enrichment
score: 4.89; p = 1.8 ×
Functional 10−7 ). Gene
annotation usingfunctional
DAVID 6.8classification
showed that theidentified 22 genes
main enriched dividedGO-term
functional into threein gene
clusters and contained was
the non-responders only“transcription,
four additional DNAgenes compared
templated”, to the
which initial identified
contained 38 genes. In the
38 genes (enrichment
TLR-responders,
score: 4.89; p = on 1.8 the
× 10other hand,
−7). Gene only four
functional proteinsidentified
classification sharing 22 thegenes
GO-term
divided “cellular
into threeresponse
gene to
clusters and contained only four additional genes compared to the initial
LPS” were enriched and contained the proteins CD86 and HAVCR2/TIM-3 that also were found to identified 38 genes. In the
TLR-responders,
be differentially on the other
expressed in thehand, only four proteins
unsupervised sharing
clustering the 3).
(Figure GO-term
Details“cellular
about the response to
differentially
LPS” were enriched and contained the proteins CD86 and HAVCR2/TIM-3 that
expressed clusters and the 46 differentially encoded proteins are provided in Supplementary Materials also were found to
be differentially expressed in the unsupervised clustering (Figure 3). Details about the differentially
Table S3.
expressed clusters and the 46 differentially encoded proteins are provided in Supplementary
The 200 differentially expressed genes were also analyzed by STRING 11.0. For the TLR
Materials Table S3.
responders,
The a200 network of 14 proteins
differentially expressedwas identified
genes were alsothat only was
analyzed by slightly
STRINGenriched
11.0. For forthethe
TLRKEGG
pathway “TNF signaling” (FDR = 0.030). This network again contained both
responders, a network of 14 proteins was identified that only was slightly enriched for the KEGG CD86 and HAVCR2.
For the non-responders,
pathway “TNF signaling” on (FDR
the other hand,
= 0.030). ThisSTRING identified
network again a network
contained both CD86of 41
andproteins
HAVCR2. with
For most
proteins belonging to the
the non-responders, onGO-terms “chromatin
the other hand, STRING modification” (FDR =of8.841×proteins
identified a network −14
10 ) and/or “cellular
with most
proteins
protein belongingprocess”
modification (FDR = “chromatin
to the GO-terms 5.2 × 10⁻⁶ ).modification”
Main nodes(FDR = 8.8 of
consisted × 10 −14) and/or “cellular
E3 ubiquitin ligases and
protein modification
the chromatin remodeling process” (FDR = 5.2
complexes × 10−6). Main nodes
SWItch/Sucrose consisted of E3 ubiquitin
Non-Fermentable (SWI/SNF) ligases
andand the
polycomb
chromatin remodeling complexes SWItch/Sucrose Non-Fermentable (SWI/SNF)
(Figure 4). The latter contains the epigenetic modifiers ASXL1 and EZH2, which recurrently are and polycomb
(Figure 4). The latter contains the epigenetic modifiers ASXL1 and EZH2, which recurrently are
mutated in AML and then linked with an adverse prognosis. However, the mutational landscape did
mutated in AML and then linked with an adverse prognosis. However, the mutational landscape did
not differ between TLR responders or non-responders, neither with regard to chromatin modifiers nor
not differ between TLR responders or non-responders, neither with regard to chromatin modifiers
any of
northe
anyother
of theassessed mutations
other assessed (Table
mutations S4). S4).
(Table
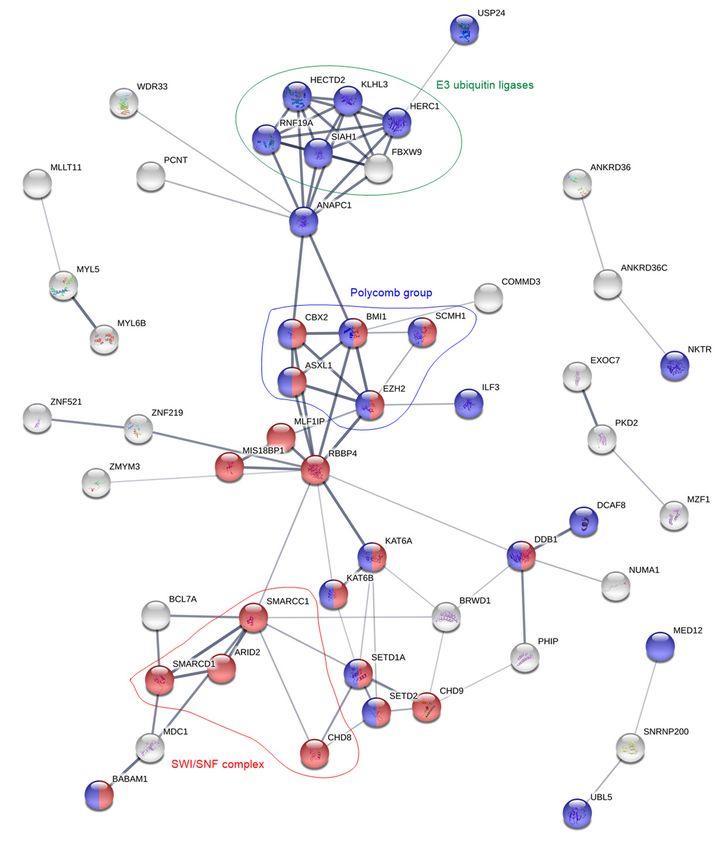
Figure 4. Protein network analysis of the overexpressed genes in the TLR non-responsive patient cells.
Figure 4. Protein network analysis of the overexpressed genes in the TLR non-responsive patient cells.
For clarity, the figure
For clarity, onlyonly
the figure contains proteins
contains that
proteins are
that interrelated
are interrelatedwith
withatatleast
least two
two other proteins.Red
other proteins. Red and
blueand
colorblue
correspond to the GO-terms
color correspond “chromatin
to the GO-terms modification”
“chromatin and “cellular
modification” protein modification
and “cellular protein
process”, respectively.
modification Groups
process”, of proteins
respectively. with
Groups identicalwith
of proteins functions
identical(E3 ubiquitin
functions (E3 ligases,
ubiquitingreen)
ligases,or that
are part of or
green) thethat
same protein
are part complexes
of the (polycomb,
same protein complexesblue; SWI/SNF,
(polycomb, blue;red) are highlighted.
SWI/SNF, red) are highlighted.Cancers 2019, 11, 973 9 of 18
Altogether, as many as 75 (thereof 16 putative) of the 155 annotated proteins in the
TLR non-responders are associated with transcription or processes that appear either pre- or
post-transcriptionally (Table 3). Furthermore, seven proteins that are related to the TLR, TNFα
or NFκB pathways were found to be upregulated: among them two proteins (BABAM1 and OTUD5)
that down-regulate TLR signaling, one protein (COMMD3) that down-regulates NFκB and two proteins
(CXXC5 and ZBTB20) that enhance NFκB activation. On the other hand, in the TLR responders only
one transcriptional protein (MLX) was overexpressed. Additionally, among the 45 annotated proteins
are three (CASP1, HAVCR2 and ILK) proteins that activate/regulate the NFκB pathway and two
proteins (MLKL and TNFRSF1B) that are associated with the TNFα pathway. Interestingly, while 13 E3
ubiquitin ligases were overexpressed in the TLR non-responders, three proteins (COPS7A, TNFRSF1B
and YWHAB) that regulate or reduce the activity of E3 ubiquitin ligases were found to be overexpressed
in the responders.
Table 3. Overview over the 75 transcription-associated proteins that were found to be overexpressed in
TLR non-responding patient cells. Proteins in bold have been studied or identified as overexpressed
in AML.
Protein Task Protein Group Protein Names Protein Names (Putative Task)
Pre-Transcription
Chromatin remodeling
Polycomb ASXL1, BMI1, CBX2, EZH2, SCMH1
SWI/SNF ARID2, CHD8, SMARCC1, SMARCD1 CHD9
WD40-repeats BRWD1, FBXW9, RBBP4, WDR33 WDR42A
Chromatin modification SETD1A, ZMYM3
Chromatin binding MED12, MYST3, MYST4, RCOR3 C14orf106
Transcription
DACH1, ELF2, FOXJ3, ILF3, MYST4, MZF1, NFX1, CCDCC171, KANSL3, RCOR3, UBN2,
Activation and/or
TFs RFX7, SCMH1, TP53INP1, ZBTB20, ZNF395, ZNF521, ZNF669, ZNF700, ZNF763,
regulation
ZNF521, ZNF548, ZNF880 ZNF789
Transcription repressors TRIM33, ZNF219, ZNF431, ZNF521
Post-Transcription
Pre-mRNA splicing SFRS8, SFRS14, SNRNP200, TCF3, WDR33, YTHDC1 EXOC7, PSIP1
mRNA degradation DCP1A
Ubiquitination
CCNB1IP1, DDB1, FBXO46, FBXW9, HECTD2,
E3 ubiquitin ligases HECTD4, HERC1, MAGEL2, MARCH5, RNF19A,
RNF144, RNF144A, SIAH1
Other tasks with
CUL9, KLHL COMMD3, WDR42A
ubiquitination
De-ubiquitination OTUD5, USP4 BABAM1
3. Discussion
As summarized in the Introduction, previous studies of TLRs in AML have mainly focused on
cell proliferation and survival, and several of these studies were mainly based on the use of cell
lines [12–17]. In the present study, we therefore focused on detection of functional receptors and mRNA
expression of TLRs and proteins downstream in the signaling pathway. In addition, we investigated
the communication with neighboring non-leukemic cells (i.e., mediator release) and associations
between TLR responsiveness and genomic profiles. These aspects have not been addressed in the
previous studies.
TLRs recognize pathogens either at the cell surface or at intracellular membranes, depending on
the specific receptor. In this study, we concentrated on TLR1/2 and 5 that are localized to the plasma
membrane, and on TLR7/8 that is situated at membranes of cytosolic compartments. Furthermore,
TLR4 is mainly located to the plasma membrane but is also found intracellularly [8]. The reason for the
selection of various receptors is that all TLRs except for TLR3 are expressed by normal hematopoietic
cells. Signaling through TLR2 and TLR4 leads to commitment of primitive hematopoietic stem cells
to the myeloid lineage [23]. Additionally, induction of TLR8 by R848 showed to induce monocytic
differentiation in AML cells and reduced colony formation ability [15], which is regarded a negative
prognostic factor [24]. Furthermore, induction of TLR1/2 by Pam3CSK4 in AML primary cells has
shown to increase both apoptosis and myeloid blast differentiation [16]. Lastly, increased surfaceCancers 2019, 11, 973 10 of 18
expression of TLR5 appears to be an inherent feature of AML [25]. TLRs mainly signal via the
transcription factor NFκB to produce pro-inflammatory cytokines. Therefore, we regarded a high
increase in the concentration of secreted mediators by AML blasts as proof that the stimulated TLR
got activated.
The NFκB transcription factor contributes to maturation of monocytes and granulocytes during
normal hematopoiesis [26], but is also a key survival factor in several types of cancer where it is usually
upregulated and linked with chemoresistance [27]. In AML, NFκB upregulation is further associated
with chemotactic migration of malignant cells, angiogenesis and extramedullary infiltration [27].
The pro-inflammatory cytokines IL-1β and TNFα, that are expressed upon signaling through TLR-NFκB,
can also directly activate NFκB and thereby induce an autocrine positive feedback loop [26]. TLRs on
the other hand are regarded as means of increasing the immunogenicity of AML cells and thus their
susceptibility towards chemo- and/or immunotherapy [19]. This can be achieved by increasing the
secretion of pro-inflammatory cytokines (especially IL-1β, IL-6, TNFα, IFNα and INFβ) as a result of
TLR stimulation by single agonists [18,19], by a combination of TLR ligands [28–30], or by combination
of agonists and TNFα/INFα [31,32]. As already mentioned, induction of both TLR1/2 and TLR8 further
showed to induce blast differentiation in AML [15,16].
In this study, we saw a correlation between NPM1 mutated cells responsiveness to TLR agonists,
and experimental studies have shown that NPM1 can be a regulator of NFκB-dependent transcription,
including the expression of certain cytokines [33]. The molecular interactions behind this effect are not
known. The effects of cancer-associated mutations can be highly dependent on the biological context;
this is for example true for many TP53 mutations where gain of function, selection of functions and
loss of functions can be seen [34]. Thus, an association between TLR agonist responsiveness and NPM1
mutations is not surprising, but additional studies are needed to clarify the molecular mechanisms
behind this correlation in primary AML cells.
Our AML cell populations contain a small contamination of normal cells, and light microscopy as
well as flow cytometry show that this contamination corresponds to 0.5–5% (information from the
biobank). For several reasons, we regard both the constitutive mediator release as well as the TLR
agonist effects to be caused by the majority of leukemic cells and not by the minor contamination. First,
constitutive release is not observed for most mediators when testing normal mononuclear cells at a
much higher cell concentration incubated in medium alone, i.e., undetectable or only low CXCL8 levels
are seen compared with the high levels observed for the AML cells in our present study [35] (Figure S2).
Such a broad constitutive mediator release profile as described for our AML cell populations would
thus not be expected for normal lymphocytes or monocytes. Second, the wide variation in constitutive
release of many mediators among patients cannot be explained by a similar wide variation in the
number of contaminating cells. Third, the TLR agonist effect was associated with the capacity of
constitutive release, i.e., we observed a significant association between a generally high constitutive
release (i.e., an AML cell characteristic) and responsiveness to the agonists. Finally, the wide variation
among patients in the effect of TLR agonists is also difficult to explain by an effect on a similar and
minor contamination of normal mononuclear cells. We therefore conclude that the TLR agonist effects
observed in our present study are caused by an effect on the leukemic cells and not by an effect on a
small contamination of normal mononuclear cells.
In this study, we observed that the TLR4 agonist LPS readily increased the median secretion
of 12 mediators by at least 5-fold (Figure 1 and Table S1), among them interleukins, chemokines,
growth factors, matrix metalloproteases and TNFα. The TLR1/2 agonist Pam3CSK4 on the other hand,
only increased the secretion of IL-6 and CCL2 to a higher extend. Because discrimination of patients
into responders and non-responders after TLR targeting was most accurately achievable for the TLR1/2
agonist, this might explain why both patient survival and mRNA levels of TLR signaling components
showed the highest association with response towards this particular agonist.
Even though several previous studies [29–31] have reported that TLR response upon receptor
activation, both in terms of secretion of cytokines and cell differentiation, was linked with monocyticCancers 2019, 11, 973 11 of 18
differentiation of the AML blasts (FAB M4/M5), we only found weak correlation between cell
morphology and TLR1/2 and TLR5 responsiveness. However, we observed a correlation between
TLR response, especially TLR1/2, and insertions in the NPM1 gene, which is also associated with
differentiation and absent expression of the CD34 stem cell marker [36].
Clustering 129 proteins belonging to the GO-term “TLR signaling”, we recognized 38 proteins to
be differentially expressed at the mRNA level among 46 unselected patients of the cohort (Figure 3 and
Table 2). The cluster divided the patients into two groups, where response to TLR1/2 ligation was the
most differentially distributed factor. Thus, response to TLR activation is at least partly reflected by
mRNA levels of members of the TLR signaling pathway.
In a previous study [37], we identified a group of patients with high constitutive cytokine secretion
that was further characterized by overrepresentation of FAB M4/M5 cells and prolonged patient
survival. Since high constitutive cytokine release might be a result of increased TLR pathway activation,
as well as the previously mentioned autocrine feedback loops via NFκB, we investigated whether
high mRNA levels of TLR signaling molecules correlated with constitutive cytokine secretion. Indeed,
patient cells with high constitutive cytokine release appeared to have higher mRNA levels of TLR
signaling molecules as well. Furthermore, FAB M4/M5 cells were also overrepresented in the patient
group with high mRNA levels. However, the latter might partially be explained by the fact that several
of the overexpressed proteins, especially CD86 [38] and S100A8/A9 [39], are correlated with monocytic
differentiation. These observations are unlikely to be caused by a minority of contaminating monocytes
because we showed in a previous study that genes included in the GO-term “monocytic differentiation”
were only slightly differentially expressed among patients and were then clearly related to the FAB
classification system but not mediator release [40]. Of note, we did not detect TLR2 to be differentially
expressed within our cohort. High mRNA expression of this particular receptor was in a previous
study linked both with shorter overall survival and less response towards treatment [13], whereas
another study reported reduced TLR2 mRNA levels at remission, but could not link TLR2 expression
at diagnosis with patient survival [12].
Like in the previous study, where we observed an association between constitutive mediator
secretion and patient survival [37], also inducible mediator secretion by TLR1/2 seems to be part of a
more favorable phenotype. The reason why the correlation was strongest between TLR1/2 and survival
might be the aforementioned clearer differentiation into responders and non-responders towards this
agonist. Furthermore, for three patients we could compare cells collected at the first time of diagnosis
and at the time of relapse. While one patient (ID 16) was classified as responder at both time points,
the other two patients (IDs 49 and 54) were classified as responders at the time of first diagnosis, but as
non-responders during later disease progression. These observations further support our hypothesis
that lack of TLR response is part of an adverse phenotype. A recent study including primary cells of
28 AML patients showed MAPK-dependent apoptosis and NFκB-mediated myeloid differentiation
of the blasts after treatment with 10 ng/mL Pam3CSK4 (TLR1/2 agonist) [16]. Thus, the increase in
mediator secretion upon TLR1/2 targeting, which we observed in our study and which was correlated
with improved patient survival, might reflect that in these responding cells also NFκB-mediated
differentiation was induced, i.e., increased mediator secretion and myeloid differentiation may be part
of the same phenotype.
Finally, we analyzed the global gene expression profile where we compared TLR responders with
non-responders. Several of the 200 annotated, differentially (i.e., p < 0.05) expressed genes coded for
proteins that are relevant in AML. The discussion of the impact of single proteins would be outside the
scope of this study, but we refer the reader to Supplementary Materials Table S5 for more detailed
information about the 31 proteins that may be associated with AML prognosis. Interestingly, 16 out of
20 overexpressed genes in the TLR non-responders are linked with poor prognosis, as compared to
five out of the 11 genes for the TLR responders. Functional analyses of differentially expressed genes
for TLR responders showed only enrichment for proteins belonging to the GO-term “cellular response
to LPS” and the KEGG pathway “TNF signaling”, i.e., signaling pathways downstream to especiallyCancers 2019, 11, 973 12 of 18
TLR4. These proteins included the myeloid differentiation marker CD86 and the leukemia cell-specific
HAVCR2/TIM-3. On the other hand, the TLR responders were especially characterized by low mRNA
levels of pre- and post-transcriptional proteins.
The most enriched GO-term for TLR non-responders was “transcription, DNA templated”,
which contained 38 proteins. In a previous study, we identified the same GO-term to be overexpressed
for patient cells that showed low secretion of proteases and protease inhibitors [40]. A more thorough
analysis showed that almost half of the overexpressed genes code for proteins involved in transcription,
all the way from chromatin modification via transcription factors and regulators, to pre-mRNA splicing
and post-transcriptional protein modifications (Table 3). STRING analysis (Figure 4) showed that
especially proteins belonging to the chromatin modulating polycomb group, the SWI/SNF complex,
and E3 ubiquitin ligases were enriched.
Polycomb group proteins maintain the repression of gene expression by histone modification.
In hematopoiesis, they regulate repression of genes involved in differentiation, proliferation and
maintenance of hematopoietic stem cells [41]. There exist two polycomb complexes, PRC1 and PRC2,
and we found members of both complexes to be overexpressed in TLR non-responders. Of the five
members that were overexpressed (Table 4), BMI1 and EZH2 upregulation is correlated with poor
prognosis in AML [41–44]. EZH2 and ASXL1 are frequently mutated in AML; these mutations are
linked with poor prognosis [45], but the frequencies of these mutations did not differ between TLR
responders and non-responders (Table S4).
Table 4. Biological and clinical characteristics of the 83 AML patients included in the study.
Patient Characteristics, Disease Etiology,
Cell Genetics
Cell Morphology Cell Morphology
Age De novo AML 1 55 Cytogenetics
Median (yrs) 66 Favorable 7
Range (yrs) 18–92 Secondary AML Intermediate 14
MDS 12 Normal 38
Gender CMML 4 Adverse 14
Females 39 CML 1 n.d. 10
Males 44 CLL 1
MF 4 Flt3 mutations 3
FAB
PV 1 ITD 26
classification
M0 5 Chemotherapy 1 Wild-type 41
M1 20 n.d. 16
M2 14 AML relapse 2 7
NPM1
M4 21
mutations
M5 17 CD34 receptor Mutated 22
Negative
n.d. 6 25 Wild-type 45
(≤20%)
Positive (>20%) 50 16
n.d.
n.d. 8
1 Patients that were enrolled twice, at first diagnosis and relapse, are listed with their de novo characteristics. 2 Three
of the patients had relapse of secondary AML. 3 One patient in each group has a point mutation at D835. n.d.:
not determined. Abbreviations: MDS: myelodysplastic syndrome; CMML: chronic myelomonocytic leukemia; CML:
chronic myeloid leukemia; CLL: chronic lymphocytic leukemia; MF: myelofibrosis; PV: polycytemia vera; ITD:
internal tandem repeat; n.d.: not determined.
The second overexpressed group was the SWI/SNF complex. This complex and the polycomb
group oppose each other in regulation of gene expression. While polycomb complexes modify histone
N-terminals, SWI/SNF utilizes ATP to disrupt the interaction between DNA and nucleosomes, move
the nucleosomes along the DNA, and remove them in order to allow transcription [46]. SWI/SNF
members interact with several hematopoietic transcription factors, but gene mutations in these proteinsCancers 2019, 11, 973 13 of 18
are not associated with AML [47]. Still, at least specific SWI/SNF members appear to contribute to
blast proliferation and survival [47]. Of the four overexpressed proteins in the TLR non-responders,
ARID2/BAF200 contributes to stem cell maintenance and suppression of leukemogenesis in t(9;11)
transgenic mice [48].
Finally, 13 E3 ubiquitin ligases were overexpressed by TLR non-responders. The ubiquitin
proteasome process is mediated by three types of enzymes: E1 ubiquitin- activating enzymes,
E2 ubiquitin-conjugating enzymes and E3 ubiquitin ligases. Of these, the latter emerge as important
for cancer development through their inactivation of p53 [49]. Deregulation of E3 ubiquitin ligases
is also linked with hematological malignancies [50]. Of note, also the PRC2 member EZH2 and the
NFκB pathway are regulated by E3 ubiquitin ligases [50,51]. To summarize, TLR non-responders
show overexpression of several protein groups that are important for transcriptional regulation and
associated with leukemia development, progression and adverse prognosis in AML.
In a previous study we described that TLRs and NFκB signaling in mesenchymal stem cells
are important for the AML-supporting crosstalk between leukemic cells and the stromal cells [52].
Our present results show that TLR ligation, and thereby NFκB signaling, seems to be important for
chemosensitivity in human AML. Thus, TLR/NFκB targeting may be a possible therapeutic strategy
especially for the patients where this targeting may have both direct and indirect (i.e., mediated through
the neighboring stromal cells) antileukemic effects.
4. Materials and Methods
4.1. Patients and Cell Preparations
The study was approved by the local Ethics Committee (Regional Ethics Committee III, University
of Bergen, REK 2017-305, Bergen, Norway) and samples were collected after written informed consent.
AML blasts from peripheral blood were derived from 83 consecutive patients with a high number
and/or percentage of circulating leukemic cells (39 females and 44 males; median age 66 years
with range 18–92 years). A majority of 55 patients had de novo AML whereas 24 patients had
AML secondary to chronic myeloproliferative neoplasia, myelodysplastic syndromes or previous
chemotherapy, and seven patients had relapsed AML (Table 4). Additionally, three of the patients were
enrolled twice in the study: both at first diagnosis and at relapse of the disease. Thirty-eight of the
patients, including two of the patients with samples gathered at dual time-points, received potentially
curative treatment including induction therapy based on cytarabine plus an anthracycline followed by
intensive consolidation treatment.
AML cells were isolated from peripheral blood by density gradient separation (Lymphoprep;
Axis-Shield, Oslo, Norway; specific density 1.077 g/mL) and contained at least 90% blasts. The cells were
stored in liquid nitrogen until use [53]. As a part of the quality control of cells included in the biobank,
it has been documented that variation among AML cell samples in proliferative responsiveness,
survival during in vitro culture and constitutive cytokine release is not associated with the storage
time in liquid nitrogen.
4.2. Reagents
The following TLR-agonists (InvivoGen; San Diego, CA, USA, if not stated otherwise) were
used at following concentrations: (i) 10 ng/mL of the TLR1/2 heterodimer agonist Pam3CSK4,
a synthetic triacetylated lipopeptide, (ii) 10 ng/mL of the TLR4 agonist LPS isolated from Escherichia
coli 0111:B4 (Sigma Aldrich; St. Louis, MO, USA), (iii) 100 ng/mL of the TLR5 agonist flagellin
isolated from Salmonella typhimurium, and (iv) 100 ng/mL of the dual TLR7/8 agonist resiquimod (R848).
These compounds were tested on ten unselected AML patients at concentrations of 0.01, 0.1 and
1.0 µg/mL (Pam3CSK4, LPS and flagellin) or respectively of 0.1, 1.0 and 10 µg/mL (R848). At the
selected concentrations, the agonists significantly increased the AML blasts’ secretion of the cytokinesYou can also read