A Long-Day Photoperiod and 6-Benzyladenine Promote Runner Formation through Upregulation of Soluble Sugar Content in Strawberry - MDPI
←
→
Page content transcription
If your browser does not render page correctly, please read the page content below
International Journal of
            Molecular Sciences

Article
A Long-Day Photoperiod and 6-Benzyladenine
Promote Runner Formation through Upregulation
of Soluble Sugar Content in Strawberry
Yali Li 1 , Jiangtao Hu 1 , Hao Wei 1               and Byoung Ryong Jeong 1,2,3, *
 1    Division of Applied Life Science (BK21 Plus Program), Department of Horticulture, Graduate School of
      Gyeongsang National University, Jinju 52828, Korea; leeyali@gnu.ac.kr (Y.L.); hujiangtao@gnu.ac.kr (J.H.);
      oahiew@gmail.com (H.W.)
 2    Institute of Agriculture and Life Science, Gyeongsang National University, Jinju 52828, Korea
 3    Research Institute of Life Science, Gyeongsang National University, Jinju 52828, Korea
 *    Correspondence: brjeong@gnu.ac.kr; Tel.: +82-55-772-1913

 Received: 13 May 2020; Accepted: 10 July 2020; Published: 12 July 2020

 Abstract: Commercial strawberries are mainly propagated using daughter plants produced on
 aerial runners because asexual propagation is faster than seed propagation, and daughter plants
 retain the characteristics of the mother plant. This study was conducted to investigate the effective
 factors for runner induction, as well as the molecular mechanisms behind the runner induction.
 An orthogonal test with 4 factors (photoperiod, temperature, gibberellin, and 6-benzyladenine),
 each with 3 levels was performed. Proteins were also extracted from the crowns with or without
 runners and separated by two-dimensional electrophoresis. The results of the orthogonal test showed
 that a long-day (LD) environment was the most influential factor for the runner formation, and
 50 mg·L−1 of 6-BA significantly increased the number of runners. A proteomic analysis revealed
 that 32 proteins were differentially expressed (2-fold, p < 0.05) in the strawberry crowns with and
 without runners. A total of 16 spots were up-regulated in the crowns with runners induced by LD
 treatment. Identified proteins were classified into seven groups according to their biological roles.
 The most prominent groups were carbohydrate metabolism and photosynthesis, which indicated that
 the carbohydrate content may increase during runner formation. A further analysis demonstrated
 that the soluble sugar content was positively correlated with the number of runners. Thus, it is
 suggested that the photoperiod and 6-BA break the dormancy of the axillary buds and produce
 runners by increasing the soluble sugar content in strawberry.

 Keywords: orthogonal test; photoperiod; DIF; plant growth regulator; strawberry propagation; sugar

1. Introduction
      Cultivated strawberry (Fragaria × ananassa) is one of the most popular fruits all around the world
due to its beautiful appearance, flavor and health benefits. The cultivation and production of strawberry
has continuously increased over the last two decades [1]. Commercially, strawberries are mainly
propagated using daughter plants produced on runners, because asexual production using daughter
plants is faster than seed propagation, and daughter plants retain the characteristics of the mother
plant [2]. Hence, the ability to form runners carries an enormous agricultural importance. Strawberry
is a rosette-forming plant, with short stems that are also called the primary crown. At the base of each
leaflet along the primary crown, there is an axillary meristem (AXM), and these AXMs can either develop
into runners and branch crowns, or remain dormant [3]. A high number of branch crowns means more
inflorescence because only the shoot apical meristem (SAM) can develop an inflorescence [4]. It has
long been observed that wild and cultivated strawberry have antagonistic processes of developing

Int. J. Mol. Sci. 2020, 21, 4917; doi:10.3390/ijms21144917                            www.mdpi.com/journal/ijms
Int. J. Mol. Sci. 2020, 21, 4917 2 of 16
runners and flowers from different meristem crowns. Therefore, the development of the AXM is
extremely important for runner production.
Factors affecting runner induction in strawberry have been studied for several decades. Seasonal
flowering (June-bearing or non-remontant) and perpetual flowering (everbearing or remontant) are
two different genotypes of commercial strawberries [5–7]. It is clear that long-days (LD) and higher
temperatures promote runner formation in the seasonal flowering strawberries [8–10]. While higher
temperatures also increase the runner production in the perpetual flowering strawberries, the effects
of the photoperiod on the runner production in the perpetual flowering strawberries vary among
different experiments [11,12]. Furthermore, plant growth regulators (PGRs) also play a decisive role
in the fate of the AXMs. The most well-known PGRs for runner induction are gibberellins (GA).
Numerous studies have shown that GA can significantly increase the runners in both wild and
cultivated strawberries [13–15]. GA biosynthesis inhibitor prohexadione-calcium (Pro-Ca) retards the
runner formation [4,16,17]. In addition, cytokinine and auxin coordinate the dormancy and outgrowth
of the axillary buds in strawberry [18], and exogenous applications of benzyladenine (BA) were
observed to contribute to a higher number of runners in some experiments [19,20].
Researchers began to focus on the genetic factors affecting the runner formation in strawberry
in recent years. Diploid woodland strawberry (Fragaria vesca) has been developed as a model for
the commercial strawberry (octoploid) because of the small genome size [21]. Tenreira and his
colleagues [22] found that the runnerless trait in woodland strawberry was caused by a deletion in the
active site of a GA biosynthesis gene named FveGA20ox. This mutation was also found in all natural
runnerless woodland strawberry plants, and exogenous applications of bioactive GA restored the
runner-producing phenotype in the runnerless plants. Later, FveRGA1 was identified as a key gene
controlling the runner formation in woodland strawberry plants. FveRGA1 belongs to DELLA proteins,
which function as a GA signaling suppressor, and silencing FveRGA1 results in constitutive GA responses
and constant development of runners [2,23]. Moreover, Mouhu et al. [10] suggested that FvSOC1
plays a central role in the photoperiodic control of runner production and flowering in woodland
strawberries, and this process may also be regulated through the activation of GA biosynthesis genes.
These results strongly suggest that GA biosynthesis in the axillary meristem is essential for inducing
runner differentiation in diploid strawberry plants [24]. Few studies report on the genetic control of
octoploid cultivated strawberry. Some studies have shown that perpetual flowering is controlled by
a single dominant gene in cultivated strawberry plants [25,26], but the relation of these genes and
runner production has not yet been identified. More studies have favored the polygenic control of
the runnering trait. Gaston et al. [27] found that a single major quantitative trait locus (QTL) named
FaPFRU negatively regulates the runnering in cultivated strawberry, which was further confirmed by
Sooriyapathirana et al. [28]. Moreover, Hossain et al. [1] identified seven other QTLs, namely qRU-5D,
qRU-3D1, qRU-1D2, qRU-4D, qRU-4C, qRU-5C, and qRU-2D2, that are responsible for the runner
formation. These QTLs are not orthologous to the loci affecting runnering in Fragaria vesca, suggesting
that runnering in diploid and octoploid strawberry are controlled by different genes. Although great
progress has been made to reveal the genetic controls underlying the runner formation in strawberry,
the proteomic changes underlying strawberry runnering are poorly understood. Proteomics is a
reliable approach in understanding biological processes. Analyzing the proteomic changes during
runner formation may help us understand the inner mechanisms.
In this study, we compared the effects of the photoperiod, temperature, GA3 and 6-BA on the
runner induction in one of the most commonly cultivated strawberries in South Korea. We also
compared the proteome-level changes in the crowns of the strawberry with and without runners.
These results will provide new insights for the propagation of cultivated strawberry.Int. J. Mol. Sci. 2020, 21, 4917 3 of 16
Int. J. Mol. Sci. 2020, 21, x FOR PEER REVIEW 3 of 16
2. Results
2. Results
2.1. Analysis of the Morphological and Growth Parameters
2.1. Analysis of the Morphological and Growth Parameters
After 4 weeks of cultivation in three plant growth chambers, different morphologies were observed
After 4 plants
in strawberry weeks (Figure
of cultivation
1C–E).in Thethree plantnumber
highest growth of
chambers,
runners different
induced morphologies
per plant waswere found
in T6, and then T8 (Figure 1A). The longest runner was found in T3 (Figure 1B). Theper
observed in strawberry plants (Figure 1C–E). The highest number of runners induced rangeplant was
analysis
found in T6, and then T8 (Figure 1A). The longest runner was found in T3 (Figure 1B). The range
revealed that the photoperiod was the most important factor for runner induction; the long-day (LD)
analysis revealed that the photoperiod was the most important factor for runner induction; the long-
photoperiod (16 h) led to a strong increase in the number of runners (Table 1). The optimal day/night
day (LD) photoperiod (16 h) led to a strong increase in the number of runners (Table 1). The optimal
temperature for runner formation was 25/15 ◦ C. 6-BA also promoted the runner induction, where a
day/night temperature for runner formation was 25/15 °C. 6-BA also promoted the runner induction,
concentration of 50 mg·L−1 was the−1most effective. Foliar GA3 spray decreased the number of runners,
where a concentration of 50 mg·L was the most effective. Foliar GA3 spray decreased the number of
where the concentration and the number of runners were negatively correlated. The plant height and
runners, where the concentration and the number of runners were negatively correlated. The plant
petiole
heightlength were the
and petiole shortest
length inthe
were T6 (Figure
shortest2A,B), and the2A,B),
in T6 (Figure leaf length wasleaf
and the also shorter
length inalso
was T6 compared
shorter
to that of plants treated with GA (Figure 2D). The chlorophyll content (SPAD)
in T6 compared to that of plants treated with GA3 (Figure 2D). The chlorophyll content (SPAD)
3 was also higher
was in
T6 also
and higher
T8 (Figure 2F). Furthermore, through the range analysis, it was found
in T6 and T8 (Figure 2F). Furthermore, through the range analysis, it was foundthat GA significantly
3 that GA3
increased the runner
significantly length,
increased the plant
runnerheight,
length,petiole length,petiole
plant height, petiolelength,
diameter, leafdiameter,
petiole length, andleafleaf width,
length,
butand
decreased thebut
leaf width, leafdecreased
chlorophyll content
the leaf (SPAD),content
chlorophyll while (SPAD),
a high daytime temperature
while a high increased the
daytime temperature
chlorophyll
increased content (Tables content
the chlorophyll S1–S7). (Tables S1–S7).
Figure
Figure 1. The
1. The morphology
morphology of theofstrawberry
the strawberry
plants plants
affectedaffected by the photoperiod,
by the photoperiod, temperature,
temperature, gibberellin
(GAgibberellin
) and (GA3) and 6-benzyladenine
6-benzyladenine (6-BA). (A) (6-BA). (A)
Number of Numberper
runners of plant;
runners(B)per plant;length;
runner (B) runner
(C–E) length;
present
3
(C–E) present the morphology of the strawberry plants in T1 to T9, respectively. Runners
the morphology of the strawberry plants in T1 to T9, respectively. Runners are indicated with yellow are indicated
with yellow arrows.
◦ C +T1, 23/27 °C 23/27
+ 8/16◦h;
C T2, 23/27h°C
+ 12/12 + 12/12
+ 50 mg·Lh−1+ 50
GAmg·L
−1 GA3 + 50 mg·L−1 BA; T3,
3 + 50 mg·L
arrows. T1, 23/27 8/16 h; T2, −1 BA; T3, 23/27 ◦ C
23/27 °C + 16/8 h +−1 100 mg·L GA3 + 100−1mg·L BA; T4, 25/25
−1 −1 °C + 8/16 h + 50 mg·L −1 GA3 + 100 mg·L−1
+ 16/8 h + 100 mg·L GA3 + 100 mg·L BA; T4, 25/25 C + 8/16 h + 50 mg·L GA3 + 100 mg·L−1
◦ −1
BA; T5, 25/25 °C + 12/12 h + 100 mg·L−1 GA3; T6, 25/25 °C + 16/8 h + 50 mg·L−1 BA; T7, 27/13 °C + 8/16
BA; T5, 25/25 ◦ C + 12/12 h + 100 mg·L−1 GA3 ; T6, 25/25 ◦ C + 16/8 h + 50 mg·L−1 BA; T7, 27/13 ◦ C +
h + 100 mg·L−1 GA3 + 50 mg·L−1 BA; T8, 27/13 °C + 12/12 h + 100 mg·L−1 BA; T9, 27/13 °C + 16/8 h + 50
8/16 h +−1100 mg·L−1 GA3 + 50 mg·L−1 BA; T8, 27/13 ◦ C + 12/12 h + 100 mg·L−1 BA; T9, 27/13 ◦ C +
mg·L GA3. The plants used for this experiment were one month and a half after cutting propagation
16/8 h + 50 mg·L−1 GA3 . The plants used for this experiment were one month and a half after cutting
and pictures were taken after another month cultivation in growth chambers. Data are presented as
propagation and pictures were taken after another month cultivation in growth chambers. Data are
the mean ± standard error (n = 3). Lowercase letters indicate the significant difference according to
presented as the mean ± standard error (n = 3). Lowercase letters indicate the significant difference
Duncan’s multiple range test at a 0.05 level.
according to Duncan’s multiple range test at a 0.05 level.Int. J. Mol. Sci. 2020, 21, 4917 4 of 16
Int. J. Mol. Sci. 2020, Table 1. Range
21, x FOR analysis of L9 (3)4 test results for the number of runners.
PEER REVIEW 4 of 16
Variable Temperature Photoperiod GA3 BA
Table 1. Range analysis of L9 (3)4 test results for the number of runners.
K1 6.00 2.67 18.00 5.00
Variable Temperature Photoperiod GA3 BA
K2 14.00 10.33 7.33 15.00
K1 6.00 2.67 18.00 5.00
K2 K3 10.67
14.00 17.67 10.33 5.33 7.33 10.67 15.00
K3 R 10.67
8.00 15.00 17.67 12.67 5.33 10.00 10.67
R
Optimal level 8.00
25/15 C◦ 16/8 h 15.00 0 mg·L −1 12.67 50 mg·L−1 10.00
Optimal level 25/15 °C 16/8 h 0 mg·L −1 50 mg·L−1
Ki is the average of the following variables: photoperiod, temperature, GA3 and 6-BA, at the 1, 2, and 3 levels.
R =Kmax
i is the
Ki –average
min Ki. of
Thethegreatest
following variables:
values photoperiod,
for K and temperature,
R are expressed in bold. GA3 and 6-BA, at the 1, 2, and
3 levels. R = max Ki – min Ki. The greatest values for K and R are expressed in bold.
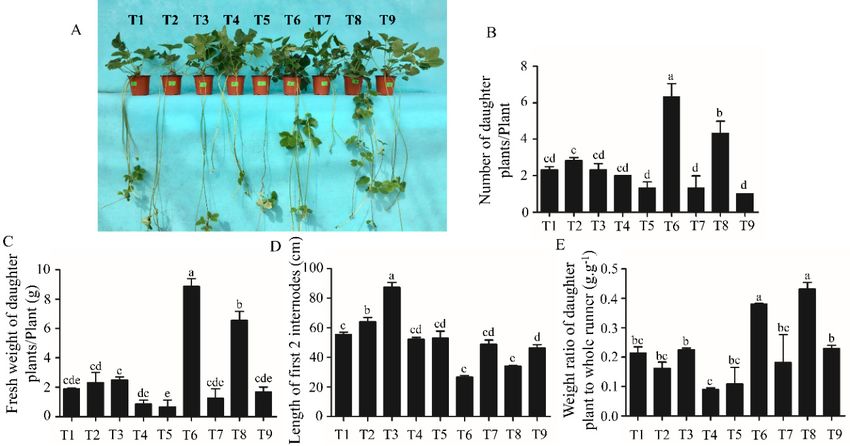
Half of the strawberry plants were moved to a glasshouse after cultivation in growth chambers.
Half of the strawberry plants were moved to a glasshouse after cultivation in growth chambers.
The data related to runners were collected 5 weeks later. T6 produced the highest number of daughter
The data related to runners were collected 5 weeks later. T6 produced the highest number of daughter
plants and also resulted in the greatest fresh weight of the daughter plants per plant. T8 produced
plants and also resulted in the greatest fresh weight of the daughter plants per plant. T8 produced
the second highest number of daughter plants, with the second highest average daughter plant fresh
the second highest number of daughter plants, with the second highest average daughter plant fresh
weight (Figure 3B,C). On the contrary, the length of the first two internodes was shorter for plants in T6
weight (Figure 3B,C). On the contrary, the length of the first two internodes was shorter for plants in
and T8 (Figure
T6 and 3A,D). 3A,D).
T8 (Figure The weight ratio of ratio
The weight the daughter plant to the
of the daughter whole
plant runner
to the whole was also significantly
runner was also
increased in T6increased
significantly and T8 when
in T6 compared thatcompared
and T8 when in the other
thattreatments
in the other(Figure 3E). (Figure 3E).
treatments
Figure
Figure2. 2.The
The growth
growth parameters
parameters and andchlorophyll
chlorophyll content
content forfor
eacheach treatment.
treatment. (A) Plant
(A) Plant height;height;
(B)
(B)petiole
petiole length;
length; (C)(C) petiole
petiole diameter;
diameter; (D)
(D) leaf leaf length;
length; (E) leaf(F)width;
(E) leaf width; (F) chlorophyll.
chlorophyll. Data are
Data are presented
presented as the
as the mean mean ± error
± standard standard error
(n = 3). (n = 3).letters
Lowercase Lowercase
indicateletters indicate the
the significant significant
difference difference
according to
according
Duncan’s tomultiple
Duncan’s multiple
range test atrange
a 0.05test at a 0.05 level.
level.Int. J. Mol. Sci. 2020, 21, 4917 5 of 16
Int. J. Mol. Sci. 2020, 21, x FOR PEER REVIEW 5 of 16
Int. J. Mol. Sci. 2020, 21, x FOR PEER REVIEW 5 of 16
Figure Figure
Figure 3. 3.The
3. The Themorphological
morphological
morphological and andand growth
growthgrowth parameters
of theof
parameters
parameters of the
the strawberry
strawberry plantsplants
strawberry aafter
plants
after aftera 5-week
5-week acultivation
5-week
cultivation
in acultivation
glasshouse. inin a glasshouse.
a(A)
glasshouse.
Morphology (A)Morphology
(A) Morphology of the
of
of the strawberry the strawberry
plants; (B)plants;
strawberry plants;
number (B)
(B)number
ofnumber ofof
daughter daughter
plantsplants
daughter plants
per plant;
perper plant;
plant; (C)(C) fresh
fresh weight
weight ofof daughter
daughter plants;
plants; (D)
(D) length
length of
ofthe
the first 2
first 2internodes;
internodes; (E)
(C) fresh weight of daughter plants; (D) length of the first 2 internodes; (E) weight ratio of the daughter weight
(E) weight ratio of
ratio of
the daughterplant
planttotothe
thewhole
whole runner.
runner. Data
Data are presented as the mean ± ±standard error (n (n
= 3).
plant to the whole runner. Data are presented as the mean ± standard error (n = 3). Lowercase letters
the daughter are presented as the mean standard error = 3).
Lowercase
Lowercase lettersindicate
letters indicatethe
the significant difference
difference according totoDuncan’s multiple range testtest
at aat a
indicate the significant differencesignificant
according to Duncan’s according
multiple Duncan’s
range test multiple range
at a 0.05 level.
0.05 level.
0.05 level.
2.2. Protein Expression Profiles and Protein Identification
2.2. Protein Expression Profiles and Protein Identification
2.2. Protein Expression Profiles and Protein Identification
The proteins in the crowns of the strawberry plants with runners (LD) and without runners (SD)
The proteins in the crowns of the strawberry plants with runners (LD) and without runners (SD)
were were The proteins
separated in the to
according crowns
their of
Mrtheandstrawberry plants with runners (LD) and without runners (SD)
separated according to their Mr pIand(Figure 4). Approximately
pI (Figure 4). Approximately 657 protein spotsspots
657 protein wereweredetected
were separated
in alldetected
replicates. according
in all Comparative
to their M
proteomic
replicates. Comparative
r and pI (Figure
analyses
proteomic
4).
revealed
analyses
Approximately
that that
revealed 32 spots 657
32 spots
protein
showed spots
showedsignificant
were
significant and
detected
reproducible indifferences
all replicates.
and reproducible Comparative
in abundance
differences (p proteomic
in abundance < 0.05(pInt. J. Mol. Sci. 2020, 21, x FOR PEER REVIEW 6 of 16
Int. J. Mol.
and Sci. 2020, 21,
arrows 4917 the differentially expressed protein (DEP) spots with at least 2-fold changes
indicate 6 of 16
between the crown with and without runners.
Figure5.5. The
Figure The expression
expression profiles
profilesof
of32
32DEPs
DEPsunder
underLD
LDandandSD
SDconditions.
conditions. LD1,
LD1, LD2,
LD2, LD3,
LD3, SD1,
SD1, SD2,
SD2,
and SD3 represent the three replicates in each treatment. The significant differences were calculated
and SD3 represent the three replicates in each treatment. The significant differences were calculated by
Student’s t-test.
by Student’s t-test.
Table 2. Proteins identified by the MALDI-TOF MS in strawberry.
Table 2. Proteins identified by the MALDI-TOF MS in strawberry.
Accession Theor./Exp. Theor./Exp.
Spot No. Species Protein Name Score a SC (%) d
No. Mr (kDa) b pI c
Spot Theor./Exp. Theor./Ex SC
Accession No. Species Protein NameMetabolism Score
Carbohydrate
a
No. Mr (kDa) b p. pI c (%) d
Malate dehydrogenase,
3 gi|470120564 Fragaria vesca 59 36.0/40.7 6.01/6.35 23
cytoplasmic-like
Carbohydrate Metabolism
Glucose-6-phosphate
Fragaria Malate dehydrogenase,
1-Dehydrogenase,
3 8 gi|470120564 Fragaria 59 36.0/40.7 6.01/6.35 36 23
gi|470136472 vescavesca cytoplasmic-like
cytoplasmic isoform
184 58.8/81.7 5.93/6.07
Glucose-6-phosphate
2-like 1-
Fragaria
Fragaria vesca
8 9 gi|470109046
gi|470136472 Sucrose synthase
Dehydrogenase, 2-like
cytoplasmic 98 184 92.8/90.8
58.8/81.7 5.94/6.01
5.93/6.07 23 36
vesca Glucan
20 gi|470148237 Fragaria vesca isoform 2-like
endo-1,3-beta-glucosidase
157 16/31.9 5.33/5.58 32
Fragaria Putative
9 gi|470109046 Sucrose synthase 2-like 98 92.8/90.8 5.94/6.01 23
25 gi|470114187 Fragaria
vescavesca lactoylglutathione 114 32.6/31.0 5.28/5.33 33
Fragaria lyase-like
Glucan isoform 2
endo-1,3-beta-
20 gi|470148237 Proteometabolism 157 16/31.9 5.33/5.58 32
vesca glucosidase
Probable protein
6 gi|470132774 Fragaria
Fragaria vesca Putative lactoylglutathione
disulfide-isomerase 81 40.1/47.2 6.12/6.02 30
25 gi|470114187 114 32.6/31.0 5.28/5.33 33
vesca A6-like
lyase-like isoform 2
Probable
Proteometabolism
mitochondrial-processing
7 gi|470136937 Fragaria
Fragariavesca Probable protein disulfide- 219 58.5/60.7 6.42/6.07 29
6 gi|470132774 peptidase subunit 81 40.1/47.2 6.12/6.02 30
vesca isomerase
beta-like A6-like
12 gi|470114303 Fragaria vesca Fumarylacetoacetase-like
Probable mitochondrial- 69 45.8/45.3 5.57/5.89 32
Fragaria 26S protease regulatory
7 23 gi|470136937
gi|470142843 Fragaria vesca processing peptidase subunit 99 219 58.5/60.7
46.2/55.6 6.42/6.07
5.48/5.54 26 29
vesca subunit 6B homolog
beta-like
Photosynthesis
Fragaria Ribulose-1,5-bisphosphate
12 13 gi|470114303
gi|7008071
Baccharis Fumarylacetoacetase-like
carboxylase/oxygenase 68
69 45.8/45.3
54.5/57.5
5.57/5.89
6.29/5.92 20
32
vesca
halimifolia
large subunit
Fragaria 26S protease regulatory
23 gi|470142843 (3S,6E)-nerolidol 99 46.2/55.6 5.48/5.54 26
vesca
Fragaria subunit 6B homolog
synthase 2,
14 NES2_FRAAN 40 66.6/88.6 6.27/5.99 20
ananassa Photosynthesis
chloroplastic/mitochondrial
Bacchar OS
Ribulose-1,5-bisphosphate
Chaperone protein ClpC,
19 gi|470122943 is vesca
Fragaria 93 102.4/94.1 6.59/5.63 27
13 gi|7008071 Chloroplastic-like large
carboxylase/oxygenase 68 54.5/57.5 6.29/5.92 20
halimifo
subunit
liaInt. J. Mol. Sci. 2020, 21, 4917 7 of 16
Table 2. Cont.
Accession Theor./Exp. Theor./Exp.
Spot No. Species Protein Name Score a SC (%) d
No. Mr (kDa) b pI c
Ribulose-1,5-bisphosphate
24 gi|237637006 Linum tenue carboxylase/oxygenase 94 51.2/89.2 6.23/5.46 17
large subunit
Chaperonin CPN60-2,
28 gi|470107388 Fragaria vesca 89 61.8/69.9 5.89/5.41 28
mitochondrial-like
Respiration
Coenzyme Q-binding
10 gi|470109651 Fragaria vesca protein COQ10 homolog, 45 28.6/31.5 8.85/5.92 24
mitochondrial-like
Signaling Proteins
2 gi|470103566 Fragaria vesca Annexin D1-like 263 36.4/31.5 6.44/6.54 44
Transcription factor
5 gi|470114874 Fragaria vesca 53 10.4/12.2 5.07/6.02 44
bHLH135-like
Probable calcium-binding
16 gi|571467514 Glycine max 70 19.5/32.3 4.64/5.74 40
protein CML45-like
Stress-Related Proteins
1 gi|470129560 Fragaria vesca Catalase-like 87 57.1/59.7 6.58/6.74 33
Chaperone protein
4 gi|470126676 Fragaria vesca 85 101.8/100.5 5.91/6.21 21
ClpB1-like
Major allergen Pru ar
31 gi|470121677 Fragaria vesca 36 17.7/22.9 5.39/5.51 44
1-like
Pathogenesis-related
32 gi|470106694 Fragaria vesca 70 18.1/34.2 5.1/5.05 24
protein 1C-like
General Metabolism-Related Proteins
Monodehydroascorbate
11 gi|470134340 Fragaria vesca 72 47.2/48.6 6.22/5.98 23
reductase-like
Fragaria
17 gi|51493451 Flavanone 3-hydroxylase 307 41.4/43.1 5.61/5.72 53
ananassa
Chalcone-flavonone
29 gi|470144168 Fragaria vesca 95 23.6/25.4 4.86/5.16 46
isomerase-like
a b
score, MASCOT score of protein hit. Theoretical and experimental molecular mass (Mr) calculated by MASCOT
peptide mass fingerprint and protein gel images, respectively. c Isoelectric point (pI) of spots identified by MASCOT
and protein gel images. d SC, sequence coverage (%).
2.3. Functional Classification of the DEPs
The identified proteins were classified into seven groups (Table 2). The most prominent groups
were carbohydrate metabolism- and photosynthesis-related proteins, followed by proteins related
to proteometabolism, stress, signaling, general metabolism, and respiration. Spots 3, 8, 9, 20, and 25
were involved in carbohydrate metabolism. Among these, spots 9 and 20 were significantly increased,
while others decreased, in the crown with runners. Four photosynthesis-related spots (14, 19, 24,
and 28) increased, while one photosynthesis-related protein (spot 13) decreased, in the crown with
runners. Spots 6, 7, 12, and 23 were assigned to proteometabolism, and these proteins decreased
in the crown with runners. There are four stress-related proteins identified: two of them (spots 1
and 4) increased in the crown without runners, while the other two (spots 31 and 32) were expressed
more in the crown with runners. Moreover, one signaling protein (spot 16) was highly expressed,
while two signaling proteins (spot 2 and 5) decreased, in the crown with runners. In total, three
general metabolism-related proteins (spots 11, 17 and 29) were found to be differently expressed in the
crown with vs. without runners, all of them except for spot 29 decreasing in the crown with runners.
Furthermore, one respiration-related protein (spot 10) was highly expressed in the crown with runners.
2.4. Soluble Sugar and Starch Contents
The soluble sugar contents in young leaves and crowns were significantly increased in T6 and
T8 when compared to those in the other treatments (Figure 6A,B). The sugar content in leaves of
strawberry plants grown in T6 was more than twice that of plants grown in the other treatments, except
for T8. The starch contents were also increased in young leaves and crowns in T6, especially for the
content of starch in crowns (Figure 6C,D). Range analysis revealed that photoperiod and 50 mg·L−1
6-BA increased while GA3 decreased sugar and starch contents (Tables S8–S11).The soluble sugar contents in young leaves and crowns were significantly increased in T6 and
T8 when compared to those in the other treatments (Figure 6A,B). The sugar content in leaves of
strawberry plants grown in T6 was more than twice that of plants grown in the other treatments,
except for T8. The starch contents were also increased in young leaves and crowns in T6, especially
for
Int. the content
J. Mol. of21,
Sci. 2020, starch
4917 in crowns (Figures 6C,D). Range analysis revealed that photoperiod and
8 of50
16
mg·L−1 6-BA increased while GA3 decreased sugar and starch contents (Tables S8–S11).
Figure 6.
Figure Thesugar
6. The sugar and
and starch
starch contents
contents in in strawberry
strawberry plants
plants treated
treated with
with different
different photoperiods,
photoperiods,
temperatures, GA
temperatures, GA33 and
and6-BA
6-BAconcentrations.
concentrations. (A,B) Soluble
(A,B) sugar
Soluble contents
sugar in young
contents leaves and
in young crowns,
leaves and
respectively. (C,D) Starch contents in young leaves and crowns, respectively. Data
crowns, respectively. (C,D) Starch contents in young leaves and crowns, respectively. Data are are presented as
the mean ±
presented asstandard
the meanerror (n = 3). error
± standard Lowercase
(n = 3).letters indicate
Lowercase the significant
letters indicate thedifference according
significant to
difference
Duncan’s multiple
according to Duncan’srange test at range
multiple a 0.05 level.
test at a 0.05 level.
3. Discussion
3. Discussion
Because runner formation is photoperiod- and temperature- sensitive, we compared the impact of
Because runner formation is photoperiod- and temperature- sensitive, we compared the impact
the photoperiod, temperature, GA3 and 6-BA on the runner induction in the strawberry ‘Seolhyang’.
of the photoperiod, temperature, GA3 and 6-BA on the runner induction in the strawberry
The results showed that the photoperiod was the most influential factor for runner induction, and the
‘Seolhyang’. The results showed that the photoperiod was the most influential factor for runner
LD condition significantly increased the number of runners compared to the SD, which is consistent
induction, and the LD condition significantly increased the number of runners compared to the SD,
with the findings from previous studies [12,29]. Higher temperatures proved to be crucial for runner
which is consistent with the findings from previous studies [12,29]. Higher temperatures proved to
induction [30], so three different sets of day and night temperatures (DIF) with the same mean
be crucial for runner induction [30], so three different sets of day and night temperatures (DIF) with
daily temperature of 20 ◦ C were used in this study. The DIF of 25/15°C was the most optimal
the same mean daily temperature of 20 °C were used in this study. The DIF of 25/15℃ was the most
for runner induction, indicating that both day and night temperatures are important for runner
optimal for runner induction, indicating that both day and night temperatures are important for
formation. The effects of the BA concentration on runner formation still remain controversial, while
runner formation. The effects of the BA concentration on runner formation still remain controversial,
some researchers found that BA could improve runner induction [20], others have shown that BA alone
while some researchers found that BA could improve runner induction [20], others have shown that
had no effects on producing runners [31,32]. Our results showed that 6-BA (T6 and T8) significantly
BA alone had no effects on producing runners [31,32]. Our results showed that 6-BA (T6 and T8)
increased the number of runners. A recent research revealed that auxin and cytokinin coordinate
significantly increased the number of runners. A recent research revealed that auxin and cytokinin
the dormancy and outgrowth of axillary buds in strawberry. Relatively higher auxin activity is
coordinate the dormancy and outgrowth of axillary buds in strawberry. Relatively higher auxin
present in the dormant buds, and increased cytokinin activity is present in the non-dormant buds.
activity is present in the dormant buds, and increased cytokinin activity is present in the non-dormant
Both the reduction in auxin accumulation and exogenous cytokinin application could trigger the
buds. Both the reduction in auxin accumulation and exogenous cytokinin application could trigger
regeneration of vegetative shoots in dormant buds [18]. Thus, the outgrowth of the axillary buds is
the regeneration of vegetative shoots in dormant buds [18]. Thus, the outgrowth of the axillary buds
affected not only by the cytokinin content, but also by auxin content. GA has been shown to play a
is affected not only by the cytokinin content, but also by auxin content. GA has been shown to play a
critical role in runner formation in woodland strawberry. In this study, exogenous GA3 application
decreased the number of runners. Surapornpiboon [33] also found that the runner production was
negatively correlated with the GA3 concentration in cultivated strawberry, which is consistent with our
results. Cultivated strawberries are complex allo-octoploids, with four relatively similar sub-genomic
chromosome sets from diploid donors. A polyploid usually produces more hormones, total proteins,Int. J. Mol. Sci. 2020, 21, 4917 9 of 16
sugars, flavonoids, etc., compared to the corresponding diploid [34–36]. It could be deduced that the
octoploids could increase the level of GAs, and these GAs alone are enough for producing runners
in ‘Seolhyang’. Thus, the GA3 application broke the dynamic equilibrium and reduced the runner
formation. In addition, the lengths of the first two internodes decreased while the weight ratios of
the daughter plant to the whole runner increased in T6 and T8, which suggested that less energy
was wasted.
Functional classification of the DEPs suggested that the carbohydrate content was quite different
between strawberry plants with runners and those without runners. Sucrose synthase 2 (spot 9)
and glucan endo-1,3-beta-glucosidase (spot 20) were found highly expressed in the crown with
runners. The sucrose synthase (SUS) has been associated with the synthesis of both storage and
structural carbohydrates. It catalyzes the reversible conversion of sucrose and the UDP to fructose
and the UDP-glucose [37]. The expression level of the SUS has been found highly correlated
with phloem loading, which is the starting point for exporting process of carbohydrates and other
nutrients from leaves [38]. Overexpression of the SUS leads to higher concentrations of fructose
in leaves, whereas in elongating fibers, concentrations both glucose and fructose increased [39].
Glucan endo-1,3-beta-glucosidase is mainly present in vacuoles and plays a key role in carbohydrate
metabolism [40]. It has the capacity to break the C-N bond and produce oligosaccharides [41]. Thus,
the higher expression levels of the SUS and glucan endo-1,3-beta-glucosidase may suggest that more
sugars were present in the crown with as opposed to without runners. The expression of malate
dehydrogenase (MDH), glucose-6-phosphate 1-dehydrogenase (G6PDH1), and lactoylglutathione
lyase increased in the crown without runners. The MDH catalyzes the interconversion of malate
and oxaloacetate [42]. It promoted glycolysis in actively proliferating cells [43] and may impair
photosynthesis, since promoted photosynthesis was found in tomato (Solanum lycopersicum) plants
when the activity of the MDH decreased [44]. The G6PDH1 is a key regulatory enzyme in the oxidative
pentose phosphate pathway that plays a central role in plant metabolism by converting glucose to
ribose-5-phosphate for the biosynthetic processes such as assimilation of nitrogen and fatty-acid [45].
Lactoylglutathione lyase is also related to glycolysis [46]. Therefore, all these enzymes are involved in
sugar consumption, which indicates less sugar content in the crown without as opposed to with runners.
Four proteometabolism-related proteins increased in the crown without runners. Protein
disulfide-isomerase and mitochondrial-processing peptidase are involved in processing of proteins.
Fumarylacetoacetase is an important enzyme involved in the amino acid catabolism [47], and the 26S
protease regulatory subunit participates in protein degradation [48]. All these proteins were highly
expressed in the crown without runners, which indicates that proteometabolism was enhanced under
the SD condition.
Both spots 13 and 24 belong to the ribulose-1,5-bisphosphate carboxylase (RuBisCo) large subunit.
RuBisCo is a key enzyme for photosynthesis. It mediates the fixation of atmospheric CO2 in the Calvin
cycle to produce organic carbon [49]. However, RuBisCo struggles in distinguishing CO2 from O2 .
The fixation of O2 results in energetically wasteful photorespiration [50]. In this study, spots 13 and 24
were presumed to be involved in photorespiration and photosynthesis, respectively, and spot 24 was
more highly expressed under the LD condition, while spot 13 was less highly expressed. Moreover,
two ATP-dependent photosynthesis-related chaperone proteins ClpC (spot 19) and Cpn60-2 (spot 28),
together with magnesium ion binding protein (spot 14), were increased under the LD condition. ClpC
and Cpn60 played an essential role in the photosynthetic activity and photosystem content [51–53].
Magnesium, the central element in chlorophyll [54], could affect the RuBisCo activity and is extremely
crucial for photosynthesis [55]. These results indicate that photosynthesis was enhanced under the
LD condition, which suggests that a greater amount of carbohydrates (such as sugar and starch) was
produced by photosynthesis.
The enhanced respiration may also play an important role in the runner formation process. CoQ10
is a conserved CoQ-binding protein that is essential for proper respiration [56]. The expression level
of CoQ10 (spot 10) was significantly increased under the LD condition (p < 0.05), which suggestedInt. J. Mol. Sci. 2020, 21, 4917 10 of 16
that the respiration might be enhanced. Respiration is the metabolic bridge from photosynthesis
to growth, where photosynthates are converted into substances that contribute to the plant growth,
maintenance, transport, and nutrient assimilation processes [57]. Respiration achieves this process by
breaking down sugars into smaller molecules (carbon skeleton intermediates) for biosynthesis, and
generating ATP for all heterotrophic energy-requiring processes [58]. The enhanced photosynthesis
and respiration under the LD condition indicate that more substances and energy were produced to
support plant growth. Since runner formation was the most conspicuous growth difference between
plants grown in the LD and SD conditions, we assume that most of the substances and energy produced
by respiration were used for producing runners. However, the exact mechanisms with which carbon
skeleton intermediates and energy promote runner formation are still an open question.
Recent research has proven that sugar is crucial for the bud outgrowth. For almost a century,
the plant growth regulator auxin has been central to theories on apical dominance, whereby the
growing shoot tip suppresses the growth of the axillary buds below. Actually, auxin transports very
slowly, typically at 1 cm·h−1 through the stem [59], but it has been observed that pea (Pisum sativum)
buds release up to 24 h before changes in the auxin content were observed in the adjacent stem.
After the loss of the shoot tip, sugars are rapidly redistributed over large distances (150 cm·h−1 ) and
accumulate in axillary buds within a timeframe that correlates with the bud release. Thus, a new
theory of apical dominance was put forward that the shoot tip0 s strong demand for sugars inhibits
axillary bud outgrowth by limiting the amount of sugar translocated to those buds [60]. Furthermore,
recent studies have shown that sugar not only plays a nutritional role, but also serves as a significant
signaling mediator for bud release. For instance, sugar could suppress the auxin-induced strigolactone
pathway to promote bud growth in rose (Rosa hybrida L. cv Radrazz) [61]. Moreover, higher expression
levels of sugar metabolism and signaling genes were detected in non-dormant buds in strawberry
runners when compared with the dormant buds [18]. Thus, we measured the soluble sugar and starch
contents in strawberry treated with different photoperiods, temperatures, GA3 and 6-BA concentrations.
Although T6 and T8 had different photoperiods, they both processed higher soluble sugar and starch
contents than the other treatments, and the soluble sugar content was positively correlated with the
number of runners, suggesting that sugar may play an important role in breaking the dormancy of the
axillary buds and producing runners in strawberry. In addition, a range analysis revealed that GA3
significantly decreased the chlorophyll and soluble sugar contents in strawberry. These may be the
means for the downregulation of the number of runners by GA3 in this experiment (Tables S7–S9).
The range analysis also indicated that 6-BA slightly increased the sugar content (Tables S8 and S9).
There is evidence demonstrating that 6-BA could promote photosynthesis and increase the soluble
sugar content in plants [62,63], which suggests that 6-BA may promote runner formation partly by
increasing the sugar content.
4. Materials and Methods
4.1. Plant Materials and Culture Condition
The runner plants of the strawberry ‘Seolhyang’ were obtained from a strawberry farm
(Sugok-myeon, Jinju, Gyeongsangnam-do, Korea) and were stuck in the BVB Medium (Bas Van
Buuren Substrate, EN-12580, De Lier, Westland, The Netherlands) in 21-cell zigzag trays (21-Zigpot/21
cell tray, Daeseung, Jeonju, Korea). All cuttings were kept on a fogged propagation bench with an 80%
relative humidity for 2 weeks, and were subsequently cultivated for a month in a glasshouse with
29/20 ◦ C day/night temperatures, an average light intensity of 450 µmol·m−2 ·s−1 PPFD coming from
the sun, and a natural photoperiod of 12 h. The strawberry plants were transplanted into 10-cm plastic
pots for the subsequent experiments.
An orthogonal design L9 (3)4 was used, where the 9 treatments contained different combinations
of photoperiod (8, 12, or 16 h), temperature (23/17, 25/15, or 27/13 ◦ C for day/night), GA3 (0, 50,
or 100 mg·L−1 ), and 6-BA (0, 50, or 100 mg·L−1 ) (Table 3). The experiment was conducted in 3 plantInt. J. Mol. Sci. 2020, 21, 4917 11 of 16
growth chambers. There were 3 biological replicates (n = 3) in each treatment. The data were collected
after a month. The fully-expanded young leaves and crowns were harvested and immediately put into
liquid nitrogen, then stored in a −80 ◦ C freezer until further use. The rest of the strawberry plants
were moved to a glasshouse and the growth indexes of the runners were measured after 5 weeks
of cultivation.
Table 3. L9 (3)4 orthogonal design used in this study.
Temperature Photoperiod GA3 6-BA
Treatment
(A, D/N, ◦ C) (B, D/N, h) (C, mg·L−1 ) (D, mg·L−1 )
T1 A1 23/17 B1 8/16 C1 0 D1 0
T2 A1 23/17 B2 12/12 C2 50 D2 50
T3 A1 23/17 B3 16/8 C3 100 D3 100
T4 A2 25/15 B1 8/16 C2 50 D3 100
T5 A2 25/15 B2 12/12 C3 100 D1 0
T6 A2 25/15 B3 16/8 C1 0 D2 50
T7 A3 27/13 B1 8/16 C3 100 D2 50
T8 A3 27/13 B2 12/12 C1 0 D3 100
T9 A3 27/13 B3 16/8 C2 50 D1 0
A, B, C, and D represent the temperature, photoperiod, GA3 , and 6-BA, respectively; D/N means day/night.
4.2. Measurement of the Chlorophyll Content
The chlorophyll content was measured with the Plus Chlorophyll Meter (Spectrum technologies,
Wales, UK).
4.3. Proteomic Analysis
4.3.1. Materials for the Proteomic Analysis
As the photoperiod is the most influential factor for runner induction based on our results,
we conducted another experiment to produce runners for the proteomic analysis. Strawberry plants
were grown in a closed walk-in growth chamber with 25/15 °C day/night temperatures. Half of
the strawberry plants were grown with the LD (16 h) photoperiod to produce runners, while the
others were grown with the short day (SD, 10 h) photoperiod, using a light with an intensity of
300 µmol·m−2 ·s−1 PPFD. The crowns of the strawberry plants with 3 runners grown in LD and those
with 0 runners grown in SD were collected after 2 months, were immediately frozen in liquid nitrogen,
and subsequently stored in a −80 °C refrigerator.
4.3.2. Protein Extraction
The total proteins in the strawberry crowns were extracted based on the methods described by
Bianco et al. [64] with minor modifications. Samples weighing 0.5 g were finely ground in liquid
nitrogen. The powder was transferred into a 15 mL centrifuge tube, and was suspended with a 5 mL
extraction buffer (0.7 M sucrose, 0.1 M KCl, 0.5 M Tris–HCl, pH 7.5, 50 mM EDTA, 1% PVP, 2% w/v
β-mercaptoethanol and 1 mM PSMF, 10 mM DTT). The tube was kept in ice for 30 min before an equal
volume of chilled phenol saturated with a Tris-HCl buffer (pH = 7.5) was added, and then was vortexed
for 15 min. After a 20-min centrifugation at 5000 g and 4 °C, the upper phenolic phase was collected and
mixed with 5 volumes of 100 mM ammonium acetate in methanol, then was kept at −20 ◦ C overnight.
The precipitated proteins were centrifuged for 20 min at 5000 g and 4 ◦ C, and then rinsed once with a
pre-cooling methanol and twice with chilled 80% acetone. The proteins were then air-dried at room
temperature and dissolved in a 400 µL rehydration buffer (7 M urea, 2 M thiourea, 4% CHAPS, 2% IPG
buffer at pH 3–10 nonlinear and 0.001% bromophenol blue). Finally, the protein concentration was
determined with the Bradford reagent (Sigma-Aldrich, St. Louis, MO, USA) according to the manual,
and bovine serum albumin (BSA) was used as the standard.Int. J. Mol. Sci. 2020, 21, 4917 12 of 16
4.3.3. Two-Dimensional Gel Electrophoresis and Image Analysis
For the first dimension, isoelectric focusing (IEF) of proteins was performed based on the method
described by Gorg et al. [65] with some modifications. The immobilized pH gradient (IPG) strips
(18 cm, pH 3–10 NL) were passively rehydrated with 500 µg of protein in a 360 µL rehydration buffer
in the IPGbox (GE Healthcare, Little Chalfont, Buckinghamshire, UK) for 12 h. The focusing was
performed in the Ettan IPGphor 3 (GE Healthcare, UK) at 20 ◦ C with 50 mA per strip under the
following conditions: 30 V for 2 h, 200 V for 1 h, 500 V for 1 h, 3000 V for 1 h, gradient from 3000 V
to 8000 V within 30 min, and 8000 V for 3 h. After the first dimensional IEF, the IPG strips were
equilibrated according to the method of Gorg et al. [65]. The second dimensional electrophoresis was
carried out in 12% SDS-PAGE, then the gels were stained with Coomassie brilliant blue (CBB) according
to R-250/G-250 = 4:1. The images were taken with a high-resolution scanner (Epson, Long Beach,
USA). The abundant difference (2-fold, p < 0.05) of the proteins in the samples were calculated with the
PDQuest Advanced 2-D Analysis software (version 8.01, Bio-Rad Laboratories, Hercules, CA, USA)
based on Student’s t-test.
4.3.4. In-Gel Digestion and MALDI-TOF/MS
The differentially expressed proteins were excised from PAGE gel with pipette tips, and the in-gel
digestion was performed according to the method of Shevchenko et al. [66]. The peptide solution
was then spotted onto the MALDI-TOF MS target plate. The MALDI-MS analysis was performed
using an ABI 4800 Plus TOF/TOF mass spectrometer (Applied Biosystems, Framingham, MA, USA).
The running condition was set to 200 Hz ND: 355 nm YAG laser operations, and the 10 most and least
intense ions per MALDI spot with signal/noise ratios >25 were selected for the subsequent MS/MS
analysis in 1 kV mode with 800–1000 consecutive laser exposure. The MS/MS spectra data were
searched against the NCBInr database and Protein Pilot v.3.0 software (AB Sciex, Framingham, MA,
USA) with the MASCOT search engine (ver. 2.3.02, Matrix Science, London, UK) at 50 ppm of mass
tolerance. Oxidation of methionines and carbamidomethylation of cysteines were allowed for the
MS/MS spectra search in the databases. Individual peptide ion scores were searched using a statistically
significant threshold value of p = 0.05.
4.3.5. Protein Functional Classification
The identified proteins were classified into different categories of biological processes according
to gene ontology [67].
4.4. Measurements of the Soluble Sugar and Starch Contents
The soluble sugar and starch contents were determined by the anthrone–sulfuric acid
colorimetry [68]. An amount of 0.3 g of leaf or crown samples were finely ground in liquid nitrogen and
then extracted in 25 mL of distilled water for 30 min at 100 ◦ C. Samples were centrifuged at 6500 rpm
for 10 min before the supernatant was collected for the soluble sugar content assays. The residues of
the leaves were suspended in 20 mL of distilled water and 2 mL of 9.2 M perchloric acid. The mixture
was then placed in boiling water for 15 min, and after centrifugation, the supernatant was collected for
the starch content assay. An amount of 0.2 mL of soluble sugar was transferred to 1.8 mL of distilled
water, and 0.5 mL of starch was transferred to 1.5 mL of distilled water. An amount of 0.5 mL of
2% anthrone and 5 mL of concentrated sulfuric acid were then added to the soluble sugar or starch
solutions. After the solutions were incubated in boiling water for 10 min, the absorbance of the mixed
solution was measured at 630 nm for soluble sugar and 485 nm for starch with a UV-spectrophotometer
(Libra S22, Biochrom Ltd., Cambridge, UK). The soluble sugar and starch contents were calculated
based on the standard curve.Int. J. Mol. Sci. 2020, 21, 4917 13 of 16
4.5. Measurements of the Soluble Sugar and Starch Contents
The physiological parameters were obtained in a complete randomized design with three replicates,
and are presented as the mean ± the standard deviation (SD). The data collected were subjected
to an analysis of variance (ANOVA) followed by Duncan0 s multiple range test at p < 0.05 with the
SAS (Statistical Analysis System, V. 6.2, Cary, NC, USA) program. Furthermore, we conducted a
range analysis to test the optimal level for runner induction. The equation used was R = max{Ki X }
− min{Ki X }, where Ki X is the average of the following variables: photoperiod, temperature, GA3
and 6-BA, at the 1, 2, and 3 levels. X, represents the photoperiod, temperature, GA3 , or 6-BA and i
represents the levels of 1, 2, or 3 [69].
5. Conclusions
We compared the effects of the photoperiod, temperature, and GA3 and 6-BA concentrations on
runner induction in strawberry, and we found that the photoperiod was the most influential factor for
runner induction. The expected optimal combination for runner formation was a 16-h photoperiod
combined with 25/15 ◦ C day/night temperatures, and 50 mg·L−1 of 6-BA. A proteomic analysis revealed
that proteins related to carbohydrate metabolism and photosynthesis were the most prominent groups
under the LD condition, indicating that more carbohydrates were produced for runner induction.
Moreover, we demonstrated that the soluble sugar content was positively correlated with the number
of runners, which suggested that sugar may play an important role in runner formation in strawberry.
Supplementary Materials: Supplementary materials can be found at http://www.mdpi.com/1422-0067/21/14/4917/s1.
Author Contributions: Conceptualization, Y.L. and B.R.J.; methodology, Y.L. and J.H.; software, Y.L. and J.H.;
investigation, Y.L., J.H. and H.W.; writing—original draft preparation, Y.L.; writing—review and editing, Y.L.,
J.H. and B.R.J.; visualization, Y.L.; supervision, Y.L. and J.H.; project administration, Y.L. and B.R.J.; funding
acquisition, B.R.J. All authors have read and agreed to the published version of the manuscript.
Funding: This research was funded by the Korea Institute of Planning and Evaluation for Technology in Food,
Agriculture, Forestry and Fisheries (Project No. 118078-2). Y.L., J.H. and H.W. were supported by a scholarship
from the BK21 Plus Program, the Ministry of Education, Korea.
Conflicts of Interest: The authors declare no conflict of interest.
References
1. Hossain, M.R.; Natarajan, S.; Kim, H.-T.; Jesse, D.M.I.; Lee, C.-G.; Park, J.-I.; Nou, I.-S. High density linkage
map construction and QTL mapping for runner production in allo-octoploid strawberry Fragaria× ananassa
based on ddRAD-seq derived SNPs. Sci. Rep. 2019, 9, 1–11. [CrossRef]
2. Caruana, J.C.; Sittmann, J.W.; Wang, W.; Liu, Z. Suppressor of runnerless encodes a DELLA protein that
controls runner formation for asexual reproduction in strawberry. Mol. Plant. 2018, 11, 230–233. [CrossRef]
[PubMed]
3. Hytönen, T.; Elomaa, P. Genetic and environmental regulation of flowering and runnering in strawberry.
Genes Genom. Genom. 2011, 5, 56–64.
4. Hytönen, T.; Elomaa, P.; Moritz, T.; Junttila, O. Gibberellin mediates daylength-controlled differentiation
of vegetative meristems in strawberry (Fragaria× ananassa Duch). BMC Plant. Biol. 2009, 9, 18. [CrossRef]
[PubMed]
5. Heide, O.; Stavang, J.; Sønsteby, A. Physiology and genetics of flowering in cultivated and wild strawberries–a
review. J. Hortic. Sci. Biotech. 2013, 88, 1–18. [CrossRef]
6. Weebadde, C.; Wang, D.; Finn, C.; Lewers, K.; Luby, J.J.; Bushakra, J.; Sjulin, T.; Hancock, J. Using a linkage
mapping approach to identify QTL for day-neutrality in the octoploid strawberry. Plant. Breeding 2008, 127,
94–101. [CrossRef]
7. Castro, P.; Bushakra, J.; Stewart, P.; Weebadde, C.; Wang, D.; Hancock, J.; Finn, C.; Luby, J.J.; Lewers, K.
Genetic mapping of day-neutrality in cultivated strawberry. Mol. Breeding 2015, 35, 79. [CrossRef]
8. Heide, O.M. Photoperiod and temperature interactions in growth and flowering of strawberry. Physiol. Plant.
1977, 40, 21–26. [CrossRef]Int. J. Mol. Sci. 2020, 21, 4917 14 of 16
9. Hytönen, T.; Palonen, P.; Mouhu, K.; Junttila, O. Crown branching and cropping potential in strawberry
(Fragaria ananassa Duch.) can be enhanced by daylength treatments. J. Hortic. Sci. Biotech. 2004, 79, 466–471.
[CrossRef]
10. Mouhu, K.; Kurokura, T.; Koskela, E.A.; Albert, V.A.; Elomaa, P.; Hytönen, T. The Fragaria vesca homolog
of SUPPRESSOR OF OVEREXPRESSION OF CONSTANS1 represses flowering and promotes vegetative
growth. Plant. Cell 2013, 25, 3296–3310. [CrossRef]
11. Sønsteby, A.; Heide, O. Long-day control of flowering in everbearing strawberries. J. Hortic. Sci. Biotech.
2007, 82, 875–884. [CrossRef]
12. Bradford, E.; Hancock, J.F.; Warner, R.M. Interactions of temperature and photoperiod determine expression
of repeat flowering in strawberry. J. Am. Soc. Hortic. Sci. 2010, 135, 102–107. [CrossRef]
13. Uddin, A.J.; Hossan, M.; Islam, M.; Ahsan, M.; Mehraj, H. Strawberry growth and yield responses to
gibberellic acid concentrations. J. Expt. Biosci. 2012, 3, 51–56.
14. Kumar, R.; Bakshi, M.; Singh, D. Influence of plant growth regulators on growth, yield and quality of
strawberrry (Fragaria x ananassa Duch.) under UP sub tropics. Asian J. Hortic. 2012, 7, 434–436.
15. Palei, S.; Das, K.; Sahoo, K.; Dash, D.K.; Swain, S. Influence of plant growth regulators on strawberry Cv.
Chandler under Odisha condition. Int. J. Sci. Res. 2016, 7, 9945–9948.
16. Greene, D.W.; Schloemann, S.G. Prohexadione-calcium inhibits runner formation and enhances yield of
strawberry. J. Am. Pomol. Soc. 2010, 64, 125.
17. Kim, H.M.; Lee, H.R.; Kang, J.H.; Hwang, S.J. Prohexadione-calcium application during vegetative growth
affects growth of mother plants, runners, and runner plants of Maehyang strawberry. Agronomy 2019, 9, 155.
[CrossRef]
18. Qiu, Y.; Guan, S.C.; Wen, C.; Li, P.; Gao, Z.; Chen, X. Auxin and cytokinin coordinate the dormancy and
outgrowth of axillary bud in strawberry runner. BMC Plant. Biol. 2019, 19, 528. [CrossRef]
19. Kour, S.; Kumar, R.; Wali, V.; Sharma, A.; Bakshi, P. Impact of benzyladenine and gibberellic acid on quality
and economics of runner production in Chandler strawberry (Fragaria× ananassa) under subtropical climate.
Indian J. Agric. Sci. 2017, 87, 964–967.
20. Liu, C.; Guo, Z.; Park, Y.G.; Wei, H.; Jeong, B.R. PGR and its application method affect number and length of
runners produced in ‘Maehyang’and ‘Sulhyang’strawberries. Agronomy 2019, 9, 59. [CrossRef]
21. Slovin, J.P.; Schmitt, K.; Folta, K.M. An inbred line of the diploid strawberry Fragaria vesca f. semperflorens
for genomic and molecular genetic studies in the Rosaceae. Plant. Methods 2009, 5, 15. [CrossRef] [PubMed]
22. Tenreira, T.; Lange, M.J.P.; Lange, T.; Bres, C.; Labadie, M.; Monfort, A.; Hernould, M.; Rothan, C.; Denoyes, B.
A specific gibberellin 20-oxidase dictates the flowering-runnering decision in diploid strawberry. Plant. Cell
2017, 29, 2168–2182. [CrossRef]
23. Li, W.; Zhang, J.; Sun, H.; Wang, S.; Chen, K.; Liu, Y.; Li, H.; Ma, Y.; Zhang, Z. FveRGA1, encoding
a DELLA protein, negatively regulates runner production in Fragaria vesca. Planta 2018, 247, 941–951.
[CrossRef] [PubMed]
24. Martins, A.O.; Nunes-Nesi, A.; Araújo, W.L.; Fernie, A.R. To bring flowers or do a runner: Gibberellins make
the decision. Mol. Plant. 2018, 11, 4–6. [CrossRef]
25. Shaw, D.V.; Famula, T.R. Complex segregation analysis of day-neutrality in domestic strawberry (Fragaria×
ananassa Duch.). Euphytica 2005, 145, 331–338. [CrossRef]
26. Sugimoto, T.; Tamaki, K.; Matsumoto, J.; Yamamoto, Y.; Shiwaku, K.; Watanabe, K. Detection of RAPD
markers linked to the everbearing gene in Japanese cultivated strawberry. Plant. Breeding 2005, 124, 498–501.
[CrossRef]
27. Gaston, A.; Perrotte, J.; Lerceteau-Köhler, E.; Rousseau-Gueutin, M.; Petit, A.; Hernould, M.; Rothan, C.;
Denoyes, B. PFRU, a single dominant locus regulates the balance between sexual and asexual plant
reproduction in cultivated strawberry. J. Exp. Bot. 2013, 64, 1837–1848. [CrossRef]
28. Sooriyapathirana, S.S.; Mookerjee, S.; Weebadde, C.K.; Finn, C.E.; Lewers, K.; Bushakra, J.M.; Luby, J.J.;
Stewart, P.; Neils, S.; Hancock, J.F. Identification of QTL associated with flower and runner production in
octoploid strawberry (Fragaria× ananassa). J. Berry Res. 2015, 5, 107–116. [CrossRef]
29. Durner, E.F.; Barden, J.; Himelrick, D.; Poling, E. Photoperiod and temperature effects on flower and runner
development in day-neutral, Junebearing, and everbearing strawberries. J. Am. Soc. Hortic. Sci. 1984, 109,
396–400.You can also read