Dynamic Alternations in Cellular and Molecular Components during Blossom-End Rot Development in Tomatoes Expressing sCAX1, a Constitutively Active ...
←
→
Page content transcription
If your browser does not render page correctly, please read the page content below
Dynamic Alternations in Cellular and Molecular
Components during Blossom-End Rot Development in
Tomatoes Expressing sCAX1, a Constitutively Active
Ca2+/H+ Antiporter from Arabidopsis1[W][OA]
Sergio Tonetto de Freitas, Malkeet Padda, Qingyu Wu, Sunghun Park, and Elizabeth J. Mitcham*
Department of Plant Sciences, University of California, Davis, California 95616 (S.T.d.F., M.P., E.J.M.); and
Department of Horticulture, Forestry, and Recreation Resources, Kansas State University, Manhattan, Kansas
66506 (Q.W., S.P.)

Although calcium (Ca) concentration in cellular compartments has been suggested to be tightly regulated, Ca deficiency
disorders such as blossom-end rot (BER) in tomato (Solanum lycopersicum) fruit may be induced by abnormal regulation of Ca
partitioning and distribution in the cell. The objectives of this work were to analyze the effects of high expression of the
constitutively functional Arabidopsis (Arabidopsis thaliana) Ca2+/H+ exchanger (sCAX1) tonoplast protein in tomato fruit on
cellular Ca partitioning and distribution, membrane integrity, and the transcriptional profile of genes potentially involved in
BER development. Wild-type and sCAX1-expressing tomato plants were grown in a greenhouse. Wild-type plants did not
develop BER, whereas sCAX1-expressing plants reached 100% BER incidence at 15 d after pollination. The sCAX1-expressing
fruit pericarp had higher total tissue and water-soluble Ca concentrations, lower apoplastic and cytosolic Ca concentrations,
higher membrane leakage, and Ca accumulation in the vacuole of sCAX1-expressing cells. Microarray analysis of healthy
sCAX1-expressing fruit tissue indicated down-regulation of genes potentially involved in BER development, such as genes
involved in membrane structure and repair and cytoskeleton metabolism, as well as up-regulation of genes that may have
limited BER damage expansion, such as genes coding for heat shock proteins, glutathione S-transferases, and peroxidases. The
results indicate that the high expression of the sCAX1 gene reduces cytosolic and apoplastic Ca concentrations, affecting
plasma membrane structure and leading to BER symptom development in the fruit tissue.

   Blossom-end rot (BER) is a physiological disorder                      tissue Ca and BER incidence is possibly the result of
in tomato (Solanum lycopersicum) fruit that starts as                     abnormal cellular Ca partitioning and distribution,
water-soaked tissue at the blossom-end region and                         leading to a localized Ca deficiency within the cell.
eventually becomes dark brown and may spread to the                       Understanding the mechanisms involved in BER de-
whole fruit (Ho and White, 2005). At the tissue level,                    velopment is the key to effectively control this disorder,
the first visual symptom of BER is cell plasmolysis,                      which can reach values higher than 50% incidence,
which is always associated with leaky membranes                           decreasing crop yield, quality, and the return on the
(Simon, 1978; Ho and White, 2005). Although high                          effort and investments spent during production
susceptibility to BER has been associated with lower                      (Abdal and Suleiman, 2005).
calcium (Ca) concentration in fruit tissue, total tissue                     At the cellular level, the apoplastic Ca concentra-
Ca concentration is not a precise predictor of BER de-                    tion must be greater than 0.1 mM Ca to maintain the
velopment, and frequently, fruit showing BER symp-                        integrity and selectivity of the plasma membrane,
toms have equal or even more Ca than healthy fruit                        cytosolic Ca concentration must be maintained in the
(Nonami et al., 1995; Ho and White, 2005). The high                       range of 0.1 to 0.2 mM to avoid toxicity, and Ca stor-
correlation with no predictive accuracy between total                     age organelles (vacuole, endoplasmic reticulum) must
                                                                          contain 1 to 10 mM Ca, which is required for signaling
  1
     This work was supported by the Coordenação de Aperfeiçoa-         responses and charge balance (Hanson, 1960; Plieth,
mento de Pessoal de Nı́vel Superior-Brazil/Fulbright (scholarship to      2001; White and Broadley, 2003). Proper cellular Ca
S.T.d.F.) and by the California League of Food Processors.                partitioning and distribution depends on the activity
   * Corresponding author; e-mail ejmitcham@ucdavis.edu.                  of a complicated machinery composed of Ca2+ chan-
   The author responsible for distribution of materials integral to the   nels, H+/Ca2+ exchangers, Ca2+-ATPases, and Ca2+
findings presented in this article in accordance with the policy
                                                                          sensors (Cessna and Low, 2001; White and Broadley,
described in the Instructions for Authors (www. plantphysiol.org) is:
Elizabeth J. Mitcham (ejmitcham@ucdavis.edu).                             2003). Previous reports suggest that aberrant regula-
   [W]
       The online version of this article contains Web-only data.         tion of cellular Ca partitioning and distribution may
   [OA]
        Open Access articles can be viewed online without a sub-          lead to Ca deficiency symptom development (Hirschi,
scription.                                                                1999; Ho and White, 2005). In these studies, high
   www.plantphysiol.org/cgi/doi/10.1104/pp.111.175208                     expression of a constitutively functional Arabidopsis
844               Plant PhysiologyÒ, June 2011, Vol. 156, pp. 844–855, www.plantphysiol.org Ó 2011 American Society of Plant Biologists

                                    Downloaded on April 11, 2021. - Published by https://plantphysiol.org
                                  Copyright (c) 2020 American Society of Plant Biologists. All rights reserved.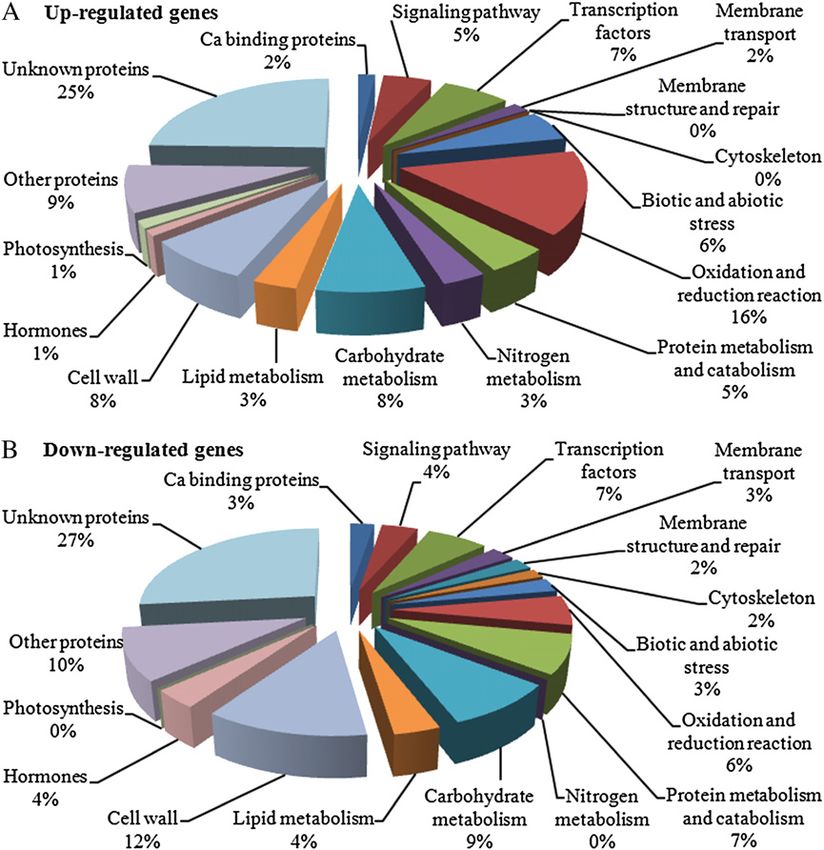
Mechanisms of Calcium Deficiency Development in Tomato Fruit

(Arabidopsis thaliana) Ca2+/H+ exchanger (sCAX1) to-                  vacuole, which may affect cytosolic Ca oscillations,
noplast protein in tomato plants not only increased                   and consequently proper cellular responses to biotic
the total amount of Ca in the fruit but also increased                and abiotic stimuli, eventually leading to cell death. A
by 90% the incidence of the Ca deficiency disorder                    transcriptional profile analysis could reveal the possible
BER (Park et al., 2005a). The sCAX1-expressing tomato                 metabolic processes affected in sCAX1-expressing fruit
phenotypes, in conjunction with the biochemical prop-                 tissue and could also indicate candidate genes involved
erties of sCAX1 in yeast (Hirschi et al., 1996; Hirschi,              in BER development.
1999), suggest that expression of this transporter po-                   The mechanism by which the sCAX1-expressing
tentially altered Ca partitioning and distribution by                 tomato fruit triggers BER development may be similar
increasing the vacuolar Ca level and decreasing the                   to the mechanism involved in BER development in
cytosolic and apoplastic Ca levels in the cells. Similar              more susceptible cultivars, which may also have ab-
results were also obtained in tobacco (Nicotiana taba-                normal regulation of Ca partitioning and distribution.
cum; Hirschi, 1999), carrot (Daucus carota; Park et al.,              Considering that about 40% of the Ca in fruit tissue is
2004), and potato (Solanum tuberosum; Park et al.,                    located in the vacuole, this organelle is an important
2005b) by overexpressing vacuolar H+/Ca2+ exchangers.                 regulator of Ca partitioning and distribution in the cell
In these studies, the susceptibility to Ca deficiency                 (Rossignol et al., 1977; Harker and Venis, 1991). Im-
development was always positively correlated with                     balanced Ca movement into the vacuole could also
the expression level of the H+/Ca2+ exchanger transgene.              explain the fact that fruit with BER frequently have
   The high flow of Ca into the vacuole of sCAX1-                     similar or even higher concentrations of total fruit Ca
expressing cells can potentially deplete the apoplastic               than healthy fruit. The sCAX1-expressing tomato plant
pool of Ca, leading to a localized cellular Ca deficiency             can be used as a tool to explore and understand the
and death. The apoplastic pool of Ca is required for                  mechanisms involved in BER development in tomato
proper plasma membrane integrity and function by                      fruit.
binding to phospholipids and proteins at the mem-                        Our objectives were to test the hypothesis that high
brane surface (Hanson, 1960; Clarkson and Hanson,                     expression of the sCAX1 gene lowers the apoplastic
1980; Hirschi, 2004). Ca has also been shown to increase              pool of Ca, which increases membrane leakiness and
membrane phospholipid and monogalactosyldiacyl-                       cell plasmolysis, and triggers BER development. In
glycerol concentrations and to preserve membrane                      addition, we expect that high expression of the sCAX1
integrity not only by delaying senescence-related mem-                gene will lead to altered cytosolic Ca-dependent cel-
brane lipid changes but also by increasing membrane-                  lular responses, triggering changes in the expression of
restructuring processes (Picchioni et al., 1996, 1998).               genes involved in BER development.
Since BER symptoms start with leaky membranes and
cell plasmolysis (Ho and White, 2005), an abnormal
                                                                      RESULTS
depletion of the apoplastic pool of Ca in fruit tissue
could explain the high incidence of BER observed in                   BER Incidence, Membrane Leakage, and Ca
sCAX1-expressing fruit.                                               Concentrations in Fruit Pericarp Tissue
   The inability of cells to respond properly to any
stimuli dependent on cytosolic Ca oscillations may                       The sCAX1-expressing plants reached 100% BER
also be the cause of cell death and BER development in                incidence at 15 d after pollination (DAP), whereas
sCAX1-expressing tomato fruit. In response to specific                wild-type plants did not develop this disorder during
biotic and abiotic stimuli, Ca2+ channels present in the              fruit growth and development under our greenhouse
plasma membrane, tonoplast, and/or endoplasmic                        conditions (Figs. 1 and 2A). Some sCAX1-expressing
reticulum open, allowing Ca to flow into the cytosol                  fruit developed BER symptoms on the entire surface
(White, 2000). The pattern of Ca influx through channels              (data not shown). Membrane leakage was higher in
generates perturbations in the cytosolic Ca concentra-                sCAX1-expressing fruit pericarp tissue compared with
tion that initiate specific cellular responses (White, 2000;          the wild type at both 15 and 45 DAP (Fig. 2B). The
Sanders et al., 2002). Particular cytosolic proteins that             sCAX1-expressing fruit pericarp had lower water-
change conformation or catalytic activity upon binding                soluble apoplastic Ca concentration but higher total
Ca, such as calmodulin, calcineurin B-like proteins, and              water-soluble and tissue Ca concentrations at both 15
Ca-dependent protein kinases, allow the cellular per-                 and 45 DAP (Fig. 3). Our confocal microscopy studies
ception and transduction of the specific cytosolic Ca                 showed that sCAX1-expressing cells from pericarp
signal (White and Broadley, 2003). The submicromolar                  without visible BER symptoms had significantly lower
concentration of Ca in the cytosol is then reestablished              steady-state concentrations of cytosolic Ca than wild-
by the activity of high-capacity H+/Ca2+ exchangers                   type fruit pericarp cells (Fig. 4).
and high-affinity Ca2+-ATPases. These enzymes are also                Tissue Structure and Ca Accumulation inside the Vacuole
believed to define the specificity of cell responses by               of sCAX1-Expressing Cells
controlling the level of cytosolic Ca oscillation (White
and Broadley, 2003). In this context, the high incidence                Electron microscopy images taken at 15 DAP
of BER in sCAX1-expressing tomato fruit may be the                    showed that wild-type and sCAX1-expressing fruit
result of a constitutively high flow of Ca into the                   pericarp tissue without water-soaked symptoms of
Plant Physiol. Vol. 156, 2011                                                                                                845

                             Downloaded on April 11, 2021. - Published by https://plantphysiol.org
                           Copyright (c) 2020 American Society of Plant Biologists. All rights reserved.
Tonetto de Freitas et al.
tors, 3% membrane transport, 3% biotic and abiotic
stress, 6% oxidation and reduction reactions, 7% pro-
tein metabolism and catabolism, 9% carbohydrate
metabolism, 4% lipid metabolism, 12% cell wall me-
tabolism, and 4% hormone metabolism (Fig. 8B; Sup-
plemental Table S2). The expression of genes involved
in nitrogen metabolism (3%) and photosynthesis (1%)
was only up-regulated (Fig. 8A). Transcriptional anal-
ysis of healthy sCAX1-expressing fruit tissue indicated
possible changes in gene expression that may have
triggered BER development, such as down-regulation
of genes involved in membrane structure and repair
(synaptotagmin and dynamin) and cytoskeleton me-
tabolism (GTP-binding protein and actin-binding pro-
tein), as well as changes in gene expression that may
have limited BER damage expansion in the fruit, such
as up-regulation of heat shock proteins, glutathione
S-transferases, and peroxidases and down-regulation
of proteases (Fig. 8; Supplemental Tables S1 and S2).
The metabolomic profile analysis of sCAX1-express-
ing healthy fruit pericarp based on the microarray data
suggests an increase in ubiquitin and autophagy deg-
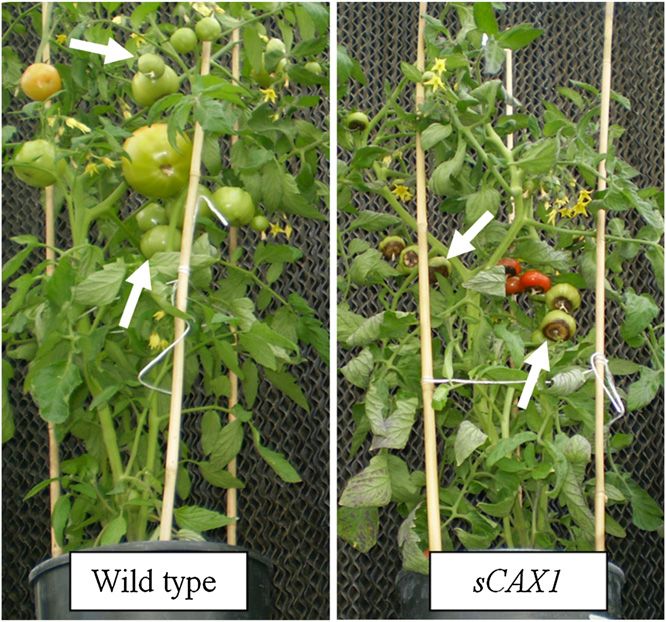
Figure 1. Wild-type and sCAX1-expressing cv FM9 phenotypes at 45 radation pathways (Supplemental Fig. S1), inhibition
DAP. Wild-type plants had no BER incidence, and sCAX1-expressing in the biosynthesis of cell wall precursors (Supple-
plants showed 100% BER incidence since 15 DAP. White arrows point
to 100% healthy fruit in wild-type plants and 100% fruit with BER
visual symptoms in sCAX1-expressing plants.
BER had turgid cells, whereas sCAX1-expressing fruit
pericarp with water-soaked symptoms had plasmo-
lyzed epidermal and subepidermal cells (Fig. 5). The
epidermal cells of sCAX1-expressing fruit had a thicker
cuticular layer than the wild-type fruit (Fig. 5, A and
B), and the sCAX1-expressing fruit with BER symp-
toms also showed thicker cell walls than the wild-type
and the sCAX1-expressing fruit pericarp without vis-
ible symptoms of BER (Fig. 5C). Electron micrographs
with potassium antimonate of sCAX1-expressing peri-
carp cells without visible water-soaking symptoms
taken at 15 DAP show the beginning of plasmolysis
and aberrant Ca accumulation inside the vacuole of
sCAX1-expressing pericarp cells, which was not ob-
served in the wild-type pericarp cells (Figs. 6 and 7).
Transcriptional Analysis
Transcriptional profile analysis of healthy sCAX1-
expressing fruit pericarp, compared with wild-type
fruit pericarp at 15 DAP, shows up-regulation of 277
genes, with 2% encoding Ca-binding proteins, 5%
proteins involved in signaling pathways, 7% tran-
scription factors, 2% membrane transport, 6% biotic
and abiotic stress, 16% oxidation and reduction reac-
Figure 2. A, BER incidence determined as the percentage of fruit with
tions, 5% protein metabolism and catabolism, 8%
visual BER symptoms in each replication. B, Electrolyte leakage of
carbohydrate metabolism, 3% lipid metabolism, 8%
pericarp tissue calculated based on the change in conductivity per hour
cell wall metabolism, and 1% hormone metabolism (Fig. as a percentage of the total conductivity. Wild-type (white bars) and
8A; Supplemental Table S1). Genes down-regulated in sCAX1-expressing (gray bars) tomatoes were assayed. Data were ana-
sCAX1-expressing fruit pericarp are represented by lyzed at 15 and 45 DAP. Mean values with different letters at each time
3% encoding Ca-binding proteins, 4% proteins in- are significantly different according to Duncan’s test (P = 0.05). For
volved in signaling pathways, 7% transcription fac- both the wild type and sCAX1, n = 6. Data shown are means 6 SE.
846 Plant Physiol. Vol. 156, 2011
Downloaded on April 11, 2021. - Published by https://plantphysiol.org
Copyright (c) 2020 American Society of Plant Biologists. All rights reserved.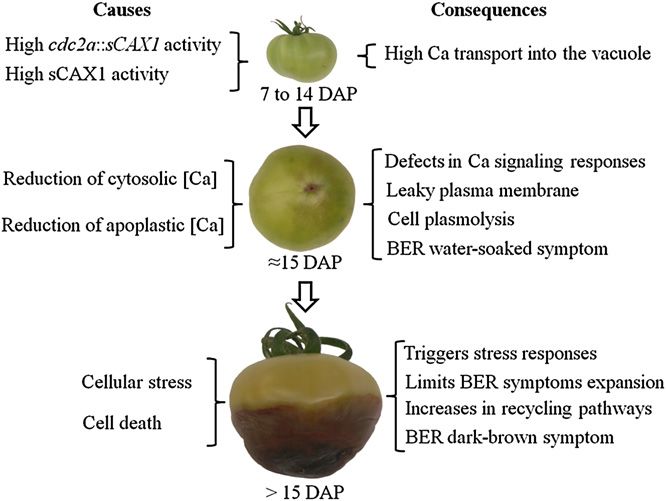
Mechanisms of Calcium Deficiency Development in Tomato Fruit

                                                                           analysis showed that two putative vacuolar Ca2+/H+
                                                                           exchangers, CAX3 and CAX6, and one putative Ca2+/Na+
                                                                           exchanger, CAX7, had lower expression in sCAX1-
                                                                           expressing fruit pericarp without visible BER symp-
                                                                           toms compared with wild-type fruit pericarp (Table II).
                                                                           One Ca2+/H+ exchanger, CAX4, was more highly ex-
                                                                           pressed in sCAX1-expressing fruit pericarp than in the
                                                                           wild type (Table II). Among eight putative Ca-ATPases,
                                                                           seven had lower expression in sCAX1-expressing fruit
                                                                           pericarp tissue and one (Ca-ATPase5) had similar ex-
                                                                           pression in both wild-type and sCAX1-expressing fruit
                                                                           pericarp tissue (Table II). The sCAX1-expressing fruit
                                                                           pericarp had lower expression of a putative H+ pyro-
                                                                           phosphatase (VPPase) and a Vacuolar-ATPase (V-ATPase)
                                                                           during fruit growth and development (Table II).

                                                                           DISCUSSION
                                                                           Cellular Ca Partitioning and Distribution and BER
                                                                           Development in sCAX1-Expressing Fruit
                                                                              BER is believed to be caused by Ca deficiency in
                                                                           tomato fruit tissue (Ho and White, 2005). This as-
                                                                           sumption is based on the facts that (1) growing tomato
                                                                           plants under hydroponic conditions with low Ca
                                                                           results in BER development, (2) fruit with BER symp-
                                                                           toms usually have lower Ca concentrations, and (3)
                                                                           spraying fruit and plants with Ca solutions reduces the
                                                                           probability of BER development (Evans and Troxler,
                                                                           1953; Geraldson, 1957; Millikan et al., 1971). Although
                                                                           there is strong evidence supporting the role of Ca in
                                                                           BER development, often fruit that develop BER con-
                                                                           tain higher levels of Ca than fruit without BER grown
                                                                           under the same agronomic conditions (Nonami et al.,
                                                                           1995; Saure, 2001). Our results show that, in the
Figure 3. A, Apoplastic water-soluble Ca extracted by vacuum infil-
                                                                           pericarp tissue, sCAX1-expressing fruit had higher
trating an isotonic mannitol solution (0.68 MPa) through pericarp discs.
B, Total water-soluble Ca extracted after freezing and thawing pericarp
                                                                           total and water-soluble Ca concentrations than the
samples. C, Total pericarp tissue Ca concentration. Wild-type (white       wild-type fruit. However, the sCAX1-expressing fruit
bars) and sCAX1-expressing (gray bars) tomatoes were assayed. Data         also showed 100% BER incidence, lower cytosolic and
were analyzed at 15 and 45 DAP. Mean values with different letters at      apoplastic Ca concentrations, and an abnormal Ca
each time are significantly different according to Duncan’s test (P =      accumulation inside the vacuole. These results suggest
0.05). For both the wild type and sCAX1, n = 6. Data shown are means       that BER may not be triggered only by low total fruit
6 SE. gfw, Grams fresh weight.                                             Ca content but also by an abnormal Ca partitioning
                                                                           and distribution at the cellular level. These ideas
                                                                           appear to contradict previous studies showing that
mental Fig. S2), and an increase in phenylpropanoids                       cellular Ca partitioning and distribution is a tightly
and lignin biosynthesis (Supplemental Fig. S3).                            regulated process (Cessna and Low, 2001; Zhou et al.,
                                                                           2009). However, BER is a physiological disorder, which,
Expression of Genes Involved in Ca Movement into                           by definition, means that it is caused by an abnormal
Cellular Organelles                                                        cell metabolism that leads to tissue damage. In this
                                                                           case, the altered metabolism may result from abnor-
   The expression of the Arabidopsis sCAX1 gene was                        mal regulation of cellular Ca partitioning and distri-
not detected in wild-type tomato fruit (Table I). The                      bution, resulting in a cellularly localized Ca deficiency
highest expression of the sCAX1 gene in sCAX1-                             and eventually BER development. Previous studies
expressing fruit was observed at 15 DAP, which                             have consistently shown that increasing the expres-
decreased at 45 DAP (Table I). Since we were also                          sion of vacuolar CAX genes not only increased total
interested in the effects of sCAX1 activity on the ex-                     tissue Ca content but also the incidence and severity of
pression of other genes involved in Ca movement into                       Ca deficiency symptoms in tobacco (Hirschi, 1999),
cellular organelles, we specifically analyzed the expres-                  carrot (Park et al., 2004), potato (Park et al., 2005b), and
sion of these genes by real-time (RT)-PCR. Expression                      tomato (Park et al., 2005a).
Plant Physiol. Vol. 156, 2011                                                                                                      847

                                 Downloaded on April 11, 2021. - Published by https://plantphysiol.org
                               Copyright (c) 2020 American Society of Plant Biologists. All rights reserved.
Tonetto de Freitas et al.
Figure 4. A and B, Projection of three-dimensional images of Fluo4-AM fluorescence in the cytosol of wild-type (A) and sCAX1-
expressing (B) fruit pericarp cells at 40 DAP. C, Fluorescence intensities of wild-type and sCAX1-expressing fruit pericarp cells.
Higher fluorescence intensity means higher cytosolic Ca concentration. Mean values are significantly different according to
Duncan’s test (P = 0.05). For both the wild type and sCAX1, n = 5. Data presented show the fluorescence intensity distribution of
15 cells from five replications (three cells per replication) of wild-type or sCAX1-expressing fruit. Top of box, Intensity with 75th
percentile; middle line of box, median intensity; bottom of box, intensity with 25th percentile. Points indicate outliers.
Membrane Damage during BER Development The transcriptional analysis revealed that the ex-
pression of genes involved in membrane structure and
The requirement of Ca for proper membrane struc- repair was down-regulated in sCAX1-expressing fruit
ture and function has been well documented in the pericarp. One of these was a putative synaptotagmin,
literature, and fruit tissue with lower Ca content and which is a Ca sensor that regulates vesicle exocytosis
Ca deficiency symptoms have been reported to have and endocytosis and mediates the delivery of intra-
higher membrane leakage (Hanson, 1960, 1984; Simon, cellular membranes to wound sites (Schapire et al.,
1978; Clarkson and Hanson, 1980; Enoch and Glinka, 2008; Lewis and Lazarowitz, 2010). Down-regulation
1983; Picchioni et al., 1996, 1998; Saure, 2001; Kaya of synaptotagmin has been shown to reduce the via-
et al., 2002; Hirschi, 2004; Tuna et al., 2007). Accord- bility of cells as a consequence of a decrease in the
ingly, our results suggest that BER development in integrity of the plasma membrane (Schapire et al.,
sCAX1-expressing fruit may begin with increasing 2008). Another observed down-regulated gene was a
membrane permeability followed by plasmolysis of putative dynamin, which is a GTPase responsible for
epidermal and subepidermal cells, which result in endocytosis and involved in the scission of newly
water-soaked BER symptoms on the fruit surface and formed vesicles from the membrane of one cellular
finally cell death. This idea is supported by the high compartment and their targeting to, and fusion with,
correlation observed between cell membrane leakage another compartment, both at the cell surface and
and BER incidence (r = 0.95). Although total Ca at the Golgi apparatus (Henley et al., 1999). Down-
concentration was higher in sCAX1-expressing fruit regulation of dynamins has been shown to cause
than in wild-type fruit, the lower apoplastic Ca con- problems in polar cell expansion, cell plate biogenesis,
centration observed in sCAX1-expressing fruit peri-
carp was highly correlated with higher membrane
leakage (r = 20.95) and BER incidence (r = 20.99),
suggesting that BER could be the result of altered
regulation of Ca partitioning and distribution in the
sCAX1-expressing cells. In this case, the constitutive
high expression and activity of the vacuolar sCAX1
protein would favor a “vacuolation” of tissue Ca,
reducing the apoplastic pool of this nutrient and
increasing membrane leakiness, cell plasmolysis, and
BER incidence. This speculation is further supported
by the observed high accumulation of Ca inside the
vacuole of sCAX1-expressing cells. It has been reported
before that apoplastic Ca sensors can induce Ca release
from cellular organelles into the apoplast when the cell
is exposed to lower apoplastic Ca conditions, which
reestablish the proper cellular Ca partitioning and
distribution (Cessna and Low, 2001). However, Figure 5. Electron microscopy images of epidermal and subepidermal
sCAX1-expressing cells may not be able to regulate cells of wild-type fruit pericarp (A), sCAX1-expressing healthy fruit
Ca partitioning and distribution because of the consti- pericarp (B), and sCAX1-expressing water-soaked fruit pericarp (C) at
tutive high expression and activity of the vacuolar 15 DAP. Images shown represent averages of 15 images taken on five
sCAX1 protein. single fruit replications of each phenotype (three images per fruit).
848 Plant Physiol. Vol. 156, 2011
Downloaded on April 11, 2021. - Published by https://plantphysiol.org
Copyright (c) 2020 American Society of Plant Biologists. All rights reserved.Mechanisms of Calcium Deficiency Development in Tomato Fruit
Figure 6. Electron microscopy images of wild-
type fruit pericarp cells at 15 DAP. A to D, Arrows
point to black spots resulting from the reaction
between potassium antimonate and Ca, showing
cells with Ca accumulation inside the vacuole. E
and F, Arrowheads indicate stretched membranes
pressed against the cell wall, and arrows point to
similar structures found inside the vacuole of sCAX1-
expressing cells without potassium antimonate-
Ca black spots. The view in E is amplified (23) in
F. CW, Cell wall; Cyt, cytosol; V, vacuole. Images
shown represent averages of 15 images taken on
five single fruit replications of each genotype
(three images per fruit).
and plasma membrane recycling (Kang et al., 2003). death and BER development mainly at the blossom end
Therefore, it is possible that the high expression of the of the fruit, which contains the highest rates of cell
sCAX1 gene, which reduced the steady-state cytosolic division and consequently activity of the cdc2a pro-
Ca and apoplastic Ca concentrations in tomato fruit, moter (cdc2a::sCAX1). The results show a reduction in
may have also affected cellular processes responsible the expression of tomato Ca2+/H+ and Ca2+/Na+ trans-
for proper membrane structure and integrity. In this porters, Ca-ATPases, V-ATPase, and VPPase genes in
case, the reduction in the expression of synaptotagmin sCAX1-expressing fruit. The high activity of the sCAX1
and dynamin genes could also result in the leaky protein may have triggered an inhibition in the expres-
membranes and cell plasmolysis observed in sCAX1- sion of tomato genes also involved in Ca movement
expressing fruit tissue during BER development. into storage organelles. This mechanism could attempt
to reduce the intensity of Ca transport into organelles
Altered Ca-Dependent Cell Responses in and allow proper Ca oscillations in the cytosol and
sCAX1-Expressing Fruit cellular responses to different stimuli.
Furthermore, the sCAX1-expressing fruit tissue
Cytosolic Ca oscillations are part of complex cellular showed a reduction in the expression of cytoskeleton-
responses to abiotic and biotic stimuli, and the spec- associated proteins, such as a GTP-binding protein
ificity of the response is determined by the pattern of involved in microtubule-dependent transport path-
cytosolic Ca perturbation (White, 2000; Sanders et al., ways through the Golgi and from endosomes to the
2002). In our work, the high expression of constitu- Golgi, and an actin-binding protein involved in actin
tively functional sCAX1 tonoplast protein reduced the cytoskeleton organization. Cytosolic Ca oscillations
steady-state cytosolic Ca concentration and possibly have been reported to trigger microtubule depolymer-
resulted in fruit cells unable to respond properly to ization and cytoskeletal orientation and reorganiza-
different stimuli dependent on cytosolic Ca oscillations. tion, which in some cases are required for changes in
The inability to respond properly to different stimuli plasma membrane composition (Orvar et al., 2000;
may be one possible explanation for the observed cell Hepler, 2005; Tuteja and Mahajan, 2007). Therefore, the
Plant Physiol. Vol. 156, 2011 849
Downloaded on April 11, 2021. - Published by https://plantphysiol.org
Copyright (c) 2020 American Society of Plant Biologists. All rights reserved.Tonetto de Freitas et al.
Figure 7. Electron microscopy images
of sCAX1-expressing fruit pericarp
cells without visible BER symptoms at
15 DAP. A to G, Arrows point to black
spots resulting from the reaction be-
tween potassium antimonate and Ca,
showing cells with Ca accumulation
inside the vacuole, and arrowheads
indicate waved membrane detachment
from the cell wall, suggesting the be-
ginning of cell plasmolysis. The view
in E is amplified (2.53) in F. H and
I, sCAX1-expressing cells after EGTA
treatment. Arrows show regions where
Ca was removed by EGTA treatment.
CW, Cell wall; Cyt, cytosol; V, vacuole.
Images shown represent averages of 15
images taken on five single fruit repli-
cations of each genotype (three images
per fruit).
down-regulation of genes involved in cytoskeleton hydrates. The results show high expression of genes
metabolism as well as membrane structure and repair involved in ubiquitin- and autophagy-dependent deg-
(discussed in the previous section) could be a conse- radation pathways, which could be necessary to recy-
quence of an inability of Ca sensors to detect proper cle nonfunctional proteins and other cellular products
cytosolic Ca oscillations or sense improper cytosolic in sCAX1-expressing cells. The high activity of these
Ca oscillations because of the high activity of the pathways and possibly the uptake of nitrogen from
sCAX1 protein. This idea is supported by the lower dying cells into healthy cells could also explain the
steady-state cytosolic Ca concentration observed in higher expression of genes involved in nitrogen me-
sCAX1-expressing fruit cells. Alternatively, the down- tabolism observed in healthy sCAX1-expressing peri-
regulation of these genes could be triggered by factors carp. In this case, the accumulation of high levels of
other than altered cytosolic Ca oscillations, which nitrogen and nitrogen-containing compounds in
could also lead to metabolic defects and cell death. healthy sCAX1-expressing cells may have triggered
Although there is evidence suggesting that the sCAX1 the increase in expression of nitrate and ammonium
gene affected cytosolic Ca signaling responses, further transporters, Glu synthase, Glu dehydrogenase, and
work should measure cytosolic Ca oscillations in re- aminotransferase. The results also show reduction in
sponse to a known, specific stimulus. Under stimulus, the expression of enzymes involved in the biosynthe-
cytosolic Ca oscillations can be monitored with Ca- sis of cell wall precursors and increase in the expres-
specific fluorophores, such as Fluo-4:acetoxymethyl sion of UDP-glycosyltransferases, which suggest that
ester (Fluo4-AM), and the effect of the sCAX1 protein healthy cells were possibly redirecting carbohydrates
on cellular responses can be further elucidated (Zhang to other pathways. Accordingly, 41 genes coding for
et al., 2010). enzymes involved in phenylpropanoid biosynthesis
(lignin biosynthesis) were up-regulated in healthy
sCAX1-expressing cells. The activities of recycling
Recycling Pathways pathways and lignin biosynthesis have also been
reported before in response to pathogen infection,
The results suggest that sCAX1-expressing cells mechanical damage, and abiotic stress (Love et al.,
triggered mechanisms to recycle nutrients and carbo- 2008; Shulaev et al., 2008).
850 Plant Physiol. Vol. 156, 2011
Downloaded on April 11, 2021. - Published by https://plantphysiol.org
Copyright (c) 2020 American Society of Plant Biologists. All rights reserved.Mechanisms of Calcium Deficiency Development in Tomato Fruit
Figure 8. Graphic representation of the percent-
age of genes belonging to a given functional
group for the 277 up-regulated (A) and 229 down-
regulated (B) genes in sCAX1-expressing fruit
pericarp at 15 DAP presented in Supplemental
Tables S1 and S2. Level of significance was
determined by P , 0.05 and paired t tests. Only
significant expression levels higher than 2-fold
are presented. For both the wild type and sCAX1,
n = 3.
Mechanisms Triggered to Reduce BER Peroxidases have several physiological functions, such
Symptom Expansion as removal of hydrogen peroxide, oxidation of toxic
reductants, biosynthesis and degradation of lignin,
The transcriptional analysis revealed that healthy auxin catabolism, defensive responses to wounding,
sCAX1-expressing pericarp tissue close to pericarp and defense against pathogen or insect attack (Yoshida
tissue showing visual BER symptoms had higher et al., 2003). The high levels of peroxidases in healthy
expression of proteins that could suppress cell death sCAX1-expressing fruit pericarp close to damaged
and the expansion of BER development in the fruit. tissue is likely also part of the defense mechanism to
Healthy sCAX1-expressing fruit pericarp showed avoid the accumulation of toxic compounds that could
higher expression of eight glutathione S-transferases, eventually cause cell death and the expansion of BER
which are enzymes that detoxify endobiotic and xeno- symptoms on the fruit surface (Fig. 9).
biotic compounds by covalent linking of glutathione to The expression of genes encoding proteins involved
hydrophobic substrates (Edwards et al., 2000). Gluta- in protein metabolism and catabolism showed a trend
thione S-transferases are highly expressed under biotic toward maintaining protein stability and inhibiting
and abiotic stress conditions, and high levels of these protein degradation in healthy sCAX1-expressing
enzymes have been shown to reduce the effect of pericarp tissue. This result is supported by the ob-
chilling and salt stresses (Roxas et al., 1997). Since
stress-inducible glutathione S-transferases have been
shown to conjugate metabolites arising from oxidative
damage, such as fatty acid oxidation (Edwards et al., Table I. Expression of the sCAX1 gene in tomato fruit
2000), high levels of these enzymes in healthy sCAX1- Data shown are means 6 SE. ND, Not detected. For both the wild
expressing pericarp tissue might have limited the type and sCAX1, n = 3.
expansion of BER symptoms by reducing the accu- Expression
mulation of toxic compounds in healthy cells close to Tomato
15 DAP SE 45 DAP SE
the damaged tissue (Fig. 9).
The expression of six peroxidases was also up- Wild type ND 60.00 ND 60.00
sCAX1 1.00 60.02 0.58 60.16
regulated in healthy sCAX1-expressing fruit pericarp.
Plant Physiol. Vol. 156, 2011 851
Downloaded on April 11, 2021. - Published by https://plantphysiol.org
Copyright (c) 2020 American Society of Plant Biologists. All rights reserved.Tonetto de Freitas et al.
Table II. Expression of tomato fruit vacuolar CAXs, vacuolar/ against stress by reestablishing normal protein con-
endoplasmic reticulum Ca-ATPases, VPPase, and V-ATPase formation and thus cellular homeostasis (Wang et al.,
Different letters in a column indicate statistical differences accord- 2004; Fig. 9).
ing to Duncan’s test (P = 0.05). Data shown are means 6 SE. For both
the wild type and sCAX1, n = 3. Mechanisms Involved in BER Development
Tomato 15 DAP SE 45 DAP SE
The data presented suggest that high Ca accumula-
CAX3 tion in storage organelles of sCAX1-expressing cells
Wild type 1.00 a 60.12 1.92 a 60.08 resulted in lower apoplastic Ca concentration and
sCAX1 0.65 b 60.16 1.35 b 60.11 defects in metabolic processes responsible for proper
CAX4 membrane structure and integrity, which led to leaky
Wild type 1.00 b 60.06 0.76 b 60.17
membranes and BER development (Fig. 9). The high
sCAX1 1.61 a 60.18 2.29 a 60.18
CAX6
activity of the vacuolar sCAX1 protein may also have
Wild type 1.00 a 60.05 1.49 a 60.10 affected cytosolic Ca oscillations and Ca-dependent
sCAX1 0.94 a 60.09 1.15 b 60.03 cellular responses to different stimuli, which could
CAX7 also result in cell death and BER development (Fig. 9).
Wild type 1.00 a 60.09 0.76 a 60.03 The results suggest that sCAX1-expressing cells
sCAX1 0.34 b 60.03 0.45 b 60.05 triggered mechanisms to limit the expansion of BER
Ca-ATPase 1 damage (Fig. 9). Among these mechanisms were the
Wild type 1.00 a 60.09 1.66 a 60.06 synthesis of glutathione S-transferases and peroxi-
sCAX1 0.43 b 60.04 1.16 b 60.09 dases involved in cell detoxification, synthesis of
Ca-ATPase 2
heat shock proteins to maintain protein stability, and
Wild type 1.00 a 60.05 1.01 a 60.07
sCAX1 0.67 b 60.05 0.51 b 60.01
inhibition of protease synthesis to reduce protein
Ca-ATPase 3 degradation. The sCAX1-expressing tomato cells also
Wild type 1.00 a 60.07 1.40 a 60.15 adjusted their metabolism to recycle nutrients and
sCAX1 0.43 b 60.09 0.49 b 60.02 carbohydrates through the ubiquitin- and autophagy-
Ca-ATPase 4 dependent degradation pathways and reincorporate
Wild type 1.00 a 60.23 4.09 a 60.36 nitrogen by increasing the expression of nitrate and
sCAX1 0.55 b 60.14 1.23 b 60.33 ammonium transporters, Glu synthase, Glu dehydroge-
Ca-ATPase 5 nase, and aminotransferase. Possibly, sCAX1-expressing
Wild type 1.00 a 60.21 1.45 a 60.07 cells close to BER damage switched the flow of carbon
sCAX1 0.77 a 60.15 1.52 a 60.18
from cell wall biosynthesis into lignin biosynthesis,
Ca-ATPase 6
Wild type 1.00 a 60.08 1.66 a 60.21
which has been reported to be a stress response in
sCAX1 0.57 b 60.11 0.72 b 60.11 plants (Shulaev et al., 2008).
Ca-ATPase 7 Although the Affymetrix GeneChip interrogates
Wild type 1.00 a 60.11 2.36 a 60.06 only approximately 9,200 tomato genes, it was a pow-
sCAX1 0.68 b 60.13 1.30 b 60.17 erful tool to aid our understanding of possible meta-
Ca-ATPase 8 bolic changes in sCAX1-expressing fruit tissue that
Wild type 1.00 a 60.15 3.91 a 60.26
sCAX1 0.67 b 60.09 1.32 b 60.12
VPPase
Wild type 1.00 a 60.03 0.97 a 60.04
sCAX1 0.44 b 60.05 0.51 b 60.01
V-ATPase
Wild type 1.00 a 60.14 2.74 a 60.11
sCAX1 0.68 b 60.14 0.86 b 60.07
served up-regulation in the expression of five heat
shock proteins and down-regulation of 10 proteases
(proteinases, peptidases) in sCAX1-expressing peri-
carp tissue. Abiotic stresses usually cause protein
dysfunction. Maintaining functional conformation of
proteins and preventing protein aggregations are par-
ticularly important for cell survival under stresses.
Heat shock proteins/chaperones are responsible for
protein folding, assembly, and translocation in many
cellular processes, stabilizing proteins and membranes Figure 9. Proposed mechanisms involved in BER development and
and assisting in protein refolding under stress condi- suppression of BER symptom expansion in sCAX1-expressing tomato
tions. They may play a crucial role in protecting cells fruit.
852 Plant Physiol. Vol. 156, 2011
Downloaded on April 11, 2021. - Published by https://plantphysiol.org
Copyright (c) 2020 American Society of Plant Biologists. All rights reserved.Mechanisms of Calcium Deficiency Development in Tomato Fruit
may have led to BER development. Gene-silencing Ca by inductively coupled plasma atomic emission spectrometry (Meyer and
Keliher, 1992). To determine water-soluble apoplastic Ca concentration, 12
experiments and studies at the protein level should be fruit discs of 1 cm diameter and 0.3 cm thickness (total of approximately 11 g
accomplished to narrow down these results and pos- fresh weight) were cut from the blossom end of the fruit with a stainless steel
sibly identify the gene(s) involved in BER develop- cork borer and sectioned with a double-bladed knife beginning 1 mm under
ment in sCAX1-expressing fruit. the skin. Each sample of 12 discs, two discs from each of six fruit, represented
one replication. After cutting, each disc was rinsed in deionized water for 10 s
and blotted. Blotting the discs after cutting was required to reduce tissue
contamination with Ca from the cut surface, as suggested in other studies
MATERIALS AND METHODS (Wada et al., 2008). Each disc was then placed in a funnel containing a flat
acrylic membrane (1.2 cm diameter) with a pore size of 10 to 16 mm (Kimax;
Experimental Procedures Kimble). The funnel was placed in a Kitasato flask (Pyrex), and vacuum (10–15
mm mercury) was applied. An isotonic mannitol solution (0.68 MPa, 300 mL)
The experiment was accomplished with wild-type and transformed to-
was slowly dripped over the entire disc surface and collected in the Kitasato
mato plants (Solanum lycopersicum ‘FM9’). Transformed plants have an
flask. After repeating the procedure for all 12 fruit discs, the mannitol solution
Arabidopsis (Arabidopsis thaliana) sCAX1 transgene without the N-terminal
accumulated was used for Ca quantification, representing the water-soluble
regulatory region, which makes the protein constitutively functional. The
apoplastic Ca content. The procedure was conducted at 4°C. Cell damage was
sCAX1 gene is under the control of the cell cycle promoter cdc2a (Park et al.,
not detected with a light microscope (Olympus SZH10) by analyzing samples
2005a). Since the homozygous plants for the transgene cdc2a::sCAX1 fail to
before and after the extraction of water-soluble apoplastic Ca extraction. The
reach flowering because of the high severity of Ca deficiency, only heterozy-
method described here was chosen after extensive testing of methods de-
gous plants were used in this study. Both wild-type and sCAX1-expressing
scribed in previous studies (Welbaum and Meinzer, 1990; Pomper and Breen,
tomato plants were grown in 9.5-L pots containing organic substrate (0.33%
1995; Ruan et al., 1995; Olivieri et al., 1998; Almeida and Huber, 1999; Wada
peat, 0.33% sand, 0.33% redwood compost with 2.6 kg dolomite lime m23) in a
et al., 2008).
greenhouse environment during the spring season at about 20°C day and 18°C
night temperatures without supplemental light. The plants were irrigated
every day with a fertilizing solution containing nitrogen (102 mg L21), Cytochemical and Ultrastructural Observations of
phosphorus (26 mg L21), potassium (124 mg L21), Ca (90 mg L21), magnesium
Cellular Ca Localization
(24 mg L21), sulfur (16 mg L21), iron (1.6 mg L21), manganese (0.27 mg L21),
copper (0.16 mg L21), zinc (0.12 mg L21), boron (0.26 mg L21), and molybde- Observations of Ca localization were made with pericarp tissue collected at
num (0.016 mg L21). At full bloom, fully opened flowers were selected, tagged, the blossom-end region of each of five single fruit replications of wild-type or
and manually pollinated on each plant to monitor the chronological age of the sCAX1-expressing genotype. Each single fruit replication was harvested from
fruit. Fruit samples were harvested and analyzed at 15, 40, and 45 DAP. All a different plant at 15 DAP. Pericarp tissue was fixed in 4% glutaraldehyde in
parameters were evaluated on six replicated samples, with one plant per 0.1 M potassium phosphate buffer (pH 7.2) containing 2% potassium anti-
replication. The only exceptions were the gene expression, cytochemical, and monate. After rising in buffer (0.1 M phosphate buffer containing 2%
ultrastructural observations of cellular Ca localization and the cytosolic Ca potassium antimonate, pH 7.2), the tissue was postfixed in 1% osmium
analysis, which are described below. BER incidence was analyzed by counting tetroxide in 0.1 M potassium phosphate buffer containing 2% potassium
the total number of tagged fruit and the number of tagged fruit with visible antimonate for 2 h at 4°C. The tissue was dehydrated in a graded alcohol series
BER symptoms. Wild-type plants had no BER incidence, and only healthy and embedded in epoxy resin. For observation with the transmission electron
fruit were analyzed. The sCAX1-expressing plants reached 100% BER devel- microscope, ultrathin sections were prepared. Control grids mounted with
opment at about 15 DAP, and only fruit with early symptoms of BER water tissue sections were immersed in a solution of 100 mM ethylene glycol
soaking were analyzed. In fruit with visible BER symptoms (sCAX1-expressing tetraacetic acid (pH 8.0), a chelator with high affinity for Ca ions, and
fruit), pericarp samples with skin tissue were taken at the blossom-end region incubated at 60°C for 1 h. After treatment, the grids were rinsed in distilled
using tissue adjacent to, but not yet affected by, the expanding tissue damage. water (Suzuki et al., 2003). Electron micrographs were taken with a Philips
Healthy fruit (wild-type fruit) were sampled at the exact same position. Fruit CM120 Biotwin Lens electron microscope at 75 kV in the Diagnostic and
samples were evaluated for BER incidence, membrane leakage, total tissue, Research Electron Microscopy Laboratory at the University of California,
water-soluble, and apoplastic Ca concentrations, cytochemical and ultrastruc- Davis. All samples were exposed to the same buffers as well as processed and
tural observations of Ca localization in cellular organelles, Affymetrix tomato analyzed at the same time.
GeneChip analysis, and expression of putative CAX genes, putative Ca-
ATPase unigenes, a V-ATPase gene, and a putative VPPase gene.
Cytosolic Ca Concentration
Membrane Leakage Analysis and Extraction of Total Cytosolic Ca concentration was analyzed in five fruit replications. Each
Water-Soluble Ca replication was a single fruit harvested from each of five wild-type or sCAX1-
expressing plants at 40 DAP. From each fruit, three thin, healthy subepidermal
Electrolyte leakage was determined in three fruit discs of 1 cm diameter pericarp sections were manually cut from the blossom-end region with a
and 0.7 cm thickness (approximately 3 g fresh weight) cut at the blossom end scalpel for cytosolic Ca determination. The thin sections were incubated in the
of the fruit with a stainless steel cork borer and sectioned with a double- loading solution containing 100 mM KCl, 10 mM MES (pH 5.0 with KOH), 1 mM
bladed knife 1 mm under the skin. Each sample of three discs from three fruit CaCl2, 300 mM eserine, and 5 mM Fluo4-AM (Invitrogen) for 1 h. The negative
represented one replication and was placed into a 50-mL conical tube control samples were incubated in 100 mM KCl, 10 mM MES (pH 5.0 with
containing a mannitol solution with similar water potential to the disc tissue KOH), 300 mM eserine, 5 mM Fluo4-AM, 5 mM EGTA, and 25 mM A23187
(0.68 MPa), and the conductivity was recorded periodically during 6 h. After (Supplemental Fig. S4). The fluorophores were imaged using a Zeiss LSM 5
6 h, the samples were frozen and thawed twice to determine total conduc- PASCAL confocal microscope with a 488-nm argon laser (excitation), 488-nm
tivity. The values were expressed as a percentage of the total conductivity dichroic mirror, 505- to 530-nm band-path emission filter, 103 0.3 numerical
(Saltveit, 2002). After all measurements, each replication was filtered and the aperture, and Neofluar objective lens (Zeiss). The pinhole setting was air
solution collected was used to determine the total water-soluble Ca in the unit = 1. All cell images were taken under the exact same conditions and during
tissue. The tissue water potential was measured by incubating pericarp discs the same session. In each sample, cells were optically sectioned, and the images
in solutions containing different concentrations of mannitol. The tissue water obtained were used to generate three-dimensional projection images using the
potential was determined as the solution that maintained a constant tissue brightest point projection method in the Zeiss LSM 5 PASCAL software. The
weight during incubation. edge of each cell three-dimensional projection image was manually delin-
eated, and the average fluorescence intensity of the cell was quantified using
Apoplastic Ca Extraction and Ca Analysis the ImageJ program. The average fluorescence intensities were determined in
a total of 15 cells in each genotype. The fluorescence intensity of each
Pericarp tissue samples were frozen in liquid N2 and freeze dried. Samples replication represents the average of the fluorescence intensity of three cells
were subjected to microwave acid digestion and dissolution and analyzed for measured in each of the five fruit.
Plant Physiol. Vol. 156, 2011 853
Downloaded on April 11, 2021. - Published by https://plantphysiol.org
Copyright (c) 2020 American Society of Plant Biologists. All rights reserved.Tonetto de Freitas et al.
Transcriptional Analysis reticulum Ca-ATPase (NCBI: NM_100887; Arabidopsis), and Ca-ATPase8
(SGN-U595382), with 74% identity to endoplasmic reticulum Ca-ATPase
The expression analysis was accomplished in three biological replications. (NCBI: NM_100887; Arabidopsis).
Each biological replication included 10 fruit harvested from two wild-type or
sCAX1-expressing plants at 15 DAP. Total RNA was extracted from blossom- Statistical Analysis
end pericarp fruit tissue as described in the RNeasy Plant Mini Kit (Qiagen).
The RNA concentration and purity were determined at 260 and 280 nm using The ANOVA for a completely randomized design was performed for each
a UV spectrophotometer (NanoDrop 2000; Thermo Scientific). Total RNA variable, except for the microarray data, which were analyzed as described
samples were quality assessed before beginning target preparation/process- previously. The analyses were accomplished using the SAS statistical package
ing steps by running 25 to 250 ng of each sample onto an RNA Lab-On-A-Chip (SAS Institute). The mean values were compared using Duncan’s test (P =
(Caliper Technologies) that was evaluated on an Agilent Bioanalyzer 2100 0.05). Values presented are means 6 SE. Pearson’s correlation coefficient (r)
(Agilent Technologies). Total RNA (300 ng) was processed for the microarray was calculated for the parameters apoplastic Ca 3 electrolyte leakage,
hybridizations using the Affymetrix GeneChip 3# IVT Express Kit. The apoplastic Ca 3 BER incidence, and electrolyte leakage 3 BER incidence.
resultant biotinylated copy RNA was fragmented and hybridized to the
GeneChip Tomato Genome Array, which contains 10,209 tomato probe sets Sequence data from this article can be found in the NCBI and SGN data
that interrogate more than 9,200 tomato genes. The arrays were washed, libraries (NCBI: 818395, BP884739, EF647616, AK326847, AW221661, 543862,
stained, and scanned at the Microarray Core Facility at the University of and AK320752; SGN: SGN-U581856, SGN-U581346, SGN-U571409, SGN-
California Davis Genome Center. The raw data were imported into R statis- U568889, SGN-U603702, SGN-U563935, SGN-U568808, and SGN-U595382).
tical software, background subtracted, and normalized with the Robust Multi-
array Average method (Irizarry et al., 2003). The paired t test was used to Supplemental Data
calculate P values, which were then adjusted to cope with the problem of false
discovery rates (Storey, 2002). Genes with adjusted values of P , 0.05 and The following materials are available in the online version of this article.
2-fold or greater change in expression were considered to be differentially
Supplemental Figure S1. Ubiquitin- and autophagy-dependent degrada-
expressed in sCAX1-expressing fruit pericarp tissue compared with wild-type
tion pathways in sCAX1-expressing fruit pericarp at 15 DAP.
fruit pericarp tissue (Supplemental Tables S1–S3). Annotations of differen-
tially expressed genes were obtained by BLAST search comparisons with the Supplemental Figure S2. Biosynthetic pathway of cell wall precursors in
National Center for Biotechnology Information (NCBI) database. Functional sCAX1-expressing fruit pericarp at 15 DAP.
classifications were accomplished with the MapMan software, a user-driven
tool that displays large data sets onto diagrams of metabolic pathways or Supplemental Figure S3. Phenylpropanoid pathway (lignin biosynthesis)
other processes (Thimm et al., 2004). in sCAX1-expressing fruit pericarp at 15 DAP.
Supplemental Figure S4. Negative confocal microscopy control images.
RT-PCR Supplemental Table S1. Summary of genes with significant up-regulated
expression in sCAX1-expressing fruit pericarp at 15 DAP.
The RT-PCR analysis was accomplished in three biological replications.
Each biological replication included 10 fruit harvested from two wild-type or Supplemental Table S2. Summary of genes with significant down-regulated
sCAX-expressing plants. Total RNA was extracted and quantified as described expression in sCAX1-expressing fruit pericarp at 15 DAP.
before. For all samples, equal amounts of total RNA (3 mg) were reverse
Supplemental Table S3. Entire gene data set for GeneChip analysis.
transcribed using SuperScript III (Invitrogen) according to the manufacturer’s
protocol. RT-PCR was then performed with the addition of 13 SYBR Green Supplemental Table S4. Nucleotide identifier numbers and primers used
(Applied Biosystems) to each sample containing about 100 ng of the synthe- for RT-PCR assays.
sized cDNA. The data obtained were normalized based on the expression
of the housekeeping tomato 18S rRNA (Martinelli et al., 2009). All primers
were designed with 20-nucleotide length and melting point temperature of ACKNOWLEDGMENTS
58°C 6 3°C (Supplemental Table S4). Four putative Ca2+/H+ exchangers and
one Ca2+/Na+ exchanger nucleotide sequences were obtained in the tomato We thank Grete N. Adamson and Patricia Kysar for valuable contributions
EST database in the NCBI GenBank (http://www.ncbi.nlm.nih.gov/GenBank/). to the electron microscopy approach used in our study.
Among these ESTs, only three Ca2+/H+ exchangers and the Ca2+/Na+ ex-
Received February 27, 2011; accepted April 1, 2011; published April 4, 2011.
changer were found to be expressed in the targeted fruit tissue. The expressed
nucleotide sequences were named CAX3 (NCBI: BP884739), with 83% identity
to vacuolar Ca2+/H+ exchanger (NCBI: AF461691; Arabidopsis), CAX4 (NCBI: LITERATURE CITED
EF647616), with 86% identity to vacuolar Ca2+/H+ exchanger (NCBI:
XM_002528054; Ricinus communis), CAX6 (NCBI: AK326847), with 75% iden- Abdal M, Suleiman M (2005) Blossom end rot occurrence in calcareous soil
tity to vacuolar Ca2+/H+ exchanger (NCBI: NM_001158996; Zea mays), and of Kuwait. Acta Hortic 695: 63–65
CAX7 (NCBI: AW221661), with 69% identity to Ca2+/Na+ exchanger (NCBI: Almeida DPF, Huber DJ (1999) Apoplastic pH and inorganic ion levels in
NM_104200; Arabidopsis). CAX3, CAX6, and CAX7 nucleotides are part of tomato fruit: a potential means for regulation of cell wall metabolism
unigene sequences. The gene sequence for one tomato V-ATPase (gene during ripening. Physiol Plant 105: 506–512
identifier 543862, A2 subunit) and the nucleotide sequence for a putative Cessna SG, Low PS (2001) An apoplastic Ca2+ sensor regulates internal Ca2+
tomato PPase (NCBI: AK320752), with 84% identity to H+-pyrophosphatase release in aequorin-transformed tobacco cells. J Biol Chem 276: 10655–10662
(XM_002530709; R. communis) were also obtained in the NCBI GenBank. Eight Clarkson DT, Hanson JB (1980) The mineral nutrition of higher plants.
putative Ca-ATPase unigenes obtained in the Sol Genomics Network (SGN) Annu Rev Plant Physiol 31: 239–298
database (http://solgenomics.net/index.pl) were also used for expression Edwards R, Dixon DP, Walbot V (2000) Plant glutathione S-transferases:
analysis, and all eight sequences were found to be expressed in pericarp fruit enzymes with multiple functions in sickness and in health. Trends Plant
tissues. The unigene sequences were named Ca-ATPase1 (SGN-U581856), Sci 5: 193–198
with 75% identity to endoplasmic reticulum Ca-ATPase (NCBI: NM_100655; Enoch S, Glinka Z (1983) Turgor-dependent membrane permeability in
Arabidopsis), Ca-ATPase2 (SGN-U581346), with 72% identity to tonoplast Ca- relation to calcium level. Physiol Plant 59: 203–207
ATPase (NCBI: NM_115593; Arabidopsis), Ca-ATPase3 (SGN-U571409), with Evans HJ, Troxler RV (1953) Relation of calcium nutrition to the incidence
75% identity to endoplasmic reticulum Ca-ATPase (NCBI: NM_119927; of blossom-end rot in tomatoes. Proc Am Soc Hortic Sci 61: 346–352
Arabidopsis), Ca-ATPase4 (SGN-U568889), with 78% identity to endoplasmic Geraldson CM (1957) Control of blossom-end rot of tomatoes. Proc Am Soc
reticulum Ca-ATPase (NCBI: XM_002320177; Populus trichocarpa), Ca-ATPase5 Hortic Sci 69: 309–317
(SGN-U603702), with 77% identity to endoplasmic reticulum Ca-ATPase Hanson JB (1960) Impairment of respiration, ion accumulation, and ion
(NCBI: NM_100640; Arabidopsis), Ca-ATPase6 (SGN-U563935), with 80% retention in root tissue treated with ribonuclease and ethylenediamine
identity to endoplasmic reticulum Ca-ATPase (NCBI: XM_002320646; P. tetraacetic acid. Plant Physiol 35: 372–379
trichocarpa), Ca-ATPase7 (SGN-U568808), with 74% identity to endoplasmic Hanson JB (1984) The functions of calcium in plant nutrition. In PB Tinker,
854 Plant Physiol. Vol. 156, 2011
Downloaded on April 11, 2021. - Published by https://plantphysiol.org
Copyright (c) 2020 American Society of Plant Biologists. All rights reserved.Mechanisms of Calcium Deficiency Development in Tomato Fruit
A Lauchli, eds, Advances in Plant Nutrition, Ed 1, Vol 1. Praeger Plieth C (2001) Plant calcium signaling and monitoring: pros and cons and
Publishers, New York, pp 149–208 recent experimental approaches. Protoplasma 218: 1–23
Harker FR, Venis MA (1991) Measurement of intracellular and extracellu- Pomper KW, Breen PJ (1995) Levels of apoplastic solutes in developing
lar free calcium in apple fruit cells using calcium-selective microelec- strawberry fruit. J Exp Bot 46: 743–752
trodes. Plant Cell Environ 14: 525–530 Rossignol M, Lamant A, Salsae L, Heller R (1977) Calcium fixation by the
Henley JR, Cao H, McNiven MA (1999) Participation of dynamin in the roots of calcicole and calcifuge plants: the importance of membrane
biogenesis of cytoplasmic vesicles. FASEB J (Suppl 2) 13: S243–S247 systems and their lipid composition. In M Thellier, A Monnier, M
Hepler PK (2005) Calcium: a central regulator of plant growth and Demarty, J Dainty, eds, Transmembrane Ionic Exchanges in Plants, Ed 1,
development. Plant Cell 17: 2142–2155 Vol 1, Editions du CNRS, Paris/Editions de 1’Universite, Rouen, pp
Hirschi KD (1999) Expression of Arabidopsis CAX1 in tobacco: altered 483–490
calcium homeostasis and increased stress sensitivity. Plant Cell 11: Roxas VP, Smith RK Jr, Allen ER, Allen RD (1997) Overexpression
2113–2122 of glutathione S-transferase/glutathione peroxidase enhances the
Hirschi KD (2004) The calcium conundrum: both versatile nutrient and growth of transgenic tobacco seedlings during stress. Nat Biotechnol 15:
specific signal. Plant Physiol 136: 2438–2442 988–991
Hirschi KD, Zhen RG, Cunningham KW, Rea PA, Fink GR (1996) CAX1, Ruan YL, Mate C, Patrick JW, Brady CJ (1995) Non-destructive collection
an H+/Ca2+ antiporter from Arabidopsis. Proc Natl Acad Sci USA 93: of apoplast fluid from developing tomato fruit using a pressure dehy-
8782–8786 dration procedure. Aust J Plant Physiol 22: 761–769
Ho LC, White PJ (2005) A cellular hypothesis for the induction of blossom- Saltveit ME (2002) The rate of ion leakage from chilling-sensitive tissue
end rot in tomato fruit. Ann Bot (Lond) 95: 571–581 does not immediately increase upon exposure to chilling temperatures.
Irizarry RA, Hobbs B, Collin F, Beazer-Barclay YD, Antonellis KJ, Scherf Postharvest Biol Technol 26: 295–304
U, Speed TP (2003) Exploration, normalization, and summaries of high Sanders D, Pelloux J, Brownlee C, Harper JF (2002) Calcium at the
density oligonucleotide array probe level data. Biostatistics 4: 249–264 crossroads of signaling. Plant Cell (Suppl) 14: S401–S417
Kang BH, Busse JS, Bednarek SY (2003) Members of the Arabidopsis Saure MC (2001) Blossom-end rot of tomato (Lycopersicon esculentum Mill.):
dynamin-like gene family, ADL1, are essential for plant cytokinesis and a calcium or a stress-related disorder? Sci Hortic (Amsterdam) 90:
polarized cell growth. Plant Cell 15: 899–913 193–208
Kaya C, Kirnak H, Higgs D, Saltali K (2002) Supplementary calcium Schapire AL, Voigt B, Jasik J, Rosado A, Lopez-Cobollo R, Menzel D,
enhances plant growth and fruit yield in strawberry cultivars grown at Salinas J, Mancuso S, Valpuesta V, Baluska F, et al (2008) Arabidopsis
high (NaCl) salinity. Sci Hortic (Amsterdam) 93: 65–74 synaptotagmin 1 is required for the maintenance of plasma membrane
Lewis JD, Lazarowitz SG (2010) Arabidopsis synaptotagmin SYTA regu- integrity and cell viability. Plant Cell 20: 3374–3388
Shulaev V, Cortes D, Miller G, Mittler R (2008) Metabolomics for plant
lates endocytosis and virus movement protein cell-to-cell transport.
stress response. Physiol Plant 132: 199–208
Proc Natl Acad Sci USA 107: 2491–2496
Simon EW (1978) The symptoms of calcium deficiency in plants. New
Love AJ, Milner JJ, Sadanandom A (2008) Timing is everything: regulatory
Phytol 80: 1–15
overlap in plant cell death. Trends Plant Sci 13: 589–595
Storey JD (2002) A direct approach to false discovery rates. J R Stat Soc B 64:
Martinelli F, Uratsu SL, Reagan RL, Chen Y, Tricoli D, Fiehn O, Rocke
479–498
DM, Gasser CS, Dandekar AM (2009) Gene regulation in parthenocar-
Suzuki K, Shono M, Egawa Y (2003) Localization of calcium in the pericarp
pic tomato fruit. J Exp Bot 60: 3873–3890
cells of tomato fruits during the development of blossom-end rot.
Meyer GA, Keliher PN (1992) An overview of analysis by inductively
Protoplasma 222: 149–156
coupled plasma-atomic emission spectrometry. In A Montaser, DW
Thimm O, Bläsing O, Gibon Y, Nagel A, Meyer S, Krüger P, Selbig J,
Golightly, eds, Inductively Coupled Plasmas in Analytical Atomic
Müller LA, Rhee SY, Stitt M (2004) MAPMAN: a user-driven tool to
Spectrometry, Ed 2, Vol 1. VCH Publishers, New York, pp 473–516.
display genomics data sets onto diagrams of metabolic pathways and
Millikan CR, Bjarnason EN, Osborn RK, Hanger BC (1971) Calcium
other biological processes. Plant J 37: 914–939
concentration in tomato fruits in relation to the incidence of blossom-
Tuna AL, Kaya C, Ashraf M, Altunlu H, Yokas I, Yagmur B (2007) The
end rot. Aust J Exp Agric Anim Husb 11: 570–575
effects of calcium sulphate on growth, membrane stability and nutrient
Nonami H, Fukuyama T, Yamamoto M, Yang L, Hashimoto Y (1995)
uptake of tomato plants grown under salt stress. Environ Exp Bot 59:
Blossom-end rot of tomato plants may not be directly caused by calcium 173–178
deficiency. Acta Hortic 396: 107–114 Tuteja N, Mahajan S (2007) Calcium signaling network in plants: an
Olivieri F, Godoy AV, Escande A, Casalongue CA (1998) Analysis of overview. Plant Signal Behav 2: 79–85
intercellular washing fluids of potato tubers and detection of increased Wada H, Shackel KA, Matthews MA (2008) Fruit ripening in Vitis vinifera:
proteolytic activity upon fungal infection. Physiol Plant 104: 232–238 apoplastic solute accumulation accounts for pre-veraison turgor loss in
Orvar BL, Sangwan V, Omann F, Dhindsa RS (2000) Early steps in cold berries. Planta 227: 1351–1361
sensing by plant cells: the role of actin cytoskeleton and membrane Wang W, Vinocur B, Shoseyov O, Altman A (2004) Role of plant heat-shock
fluidity. Plant J 23: 785–794 proteins and molecular chaperones in the abiotic stress response. Trends
Park S, Cheng NH, Pittman JK, Yoo KS, Park J, Smith RH, Hirschi KD Plant Sci 9: 244–252
(2005a) Increased calcium levels and prolonged shelf life in tomatoes Welbaum GE, Meinzer FC (1990) Compartmentation of solutes and water
expressing Arabidopsis H+/Ca2+ transporters. Plant Physiol 139: in developing sugarcane stalk tissue. Plant Physiol 93: 1147–1153
1194–1206 White PJ (2000) Calcium channels in higher plants. Biochim Biophys Acta
Park S, Kang TS, Kim CK, Han JS, Kim S, Smith RH, Pike LM, Hirschi 1465: 171–189
KD (2005b) Genetic manipulation for enhancing calcium content in White PJ, Broadley MR (2003) Calcium in plants. Ann Bot (Lond) 92:
potato tuber. J Agric Food Chem 53: 5598–5603 487–511
Park S, Kim CK, Pike LM, Smith RH, Hirschi KD (2004) Increased calcium Yoshida K, Kaothien P, Matsui T, Kawaoka A, Shinmyo A (2003) Molec-
in carrots by expression of an Arabidopsis H+/Ca2+ transporter. Mol ular biology and application of plant peroxidase genes. Appl Microbiol
Breed 14: 275–282 Biotechnol 60: 665–670
Picchioni GA, Watada AE, Conway WS, Whitaker BD, Sams CE (1998) Zhang R, Kang KA, Piao MJ, Chang WY, Maeng YH, Chae S, Lee IK, Kim
Postharvest calcium infiltration delays membrane lipid catabolism in BJ, Hyun JW (2010) Butin reduces oxidative stress-induced mitochon-
apple fruit. J Agric Food Chem 46: 2452–2457 drial dysfunction via scavenging of reactive oxygen species. Food Chem
Picchioni GA, Watada AE, Whitaker BD, Reyes A (1996) Calcium delays Toxicol 48: 922–927
senescence-related membrane lipid changes and increases net synthesis Zhou L, Fu Y, Yang Z (2009) A genome-wide functional characterization of
of membrane lipid components in shredded carrots. Postharvest Biol Arabidopsis regulatory calcium sensors in pollen tubes. J Integr Plant Biol
Technol 9: 235–245 51: 751–761
Plant Physiol. Vol. 156, 2011 855
Downloaded on April 11, 2021. - Published by https://plantphysiol.org
Copyright (c) 2020 American Society of Plant Biologists. All rights reserved.You can also read