Guideline for Complete Blood Count in Medical Laboratories: Effects of Preanalytical Parameters
←
→
Page content transcription
If your browser does not render page correctly, please read the page content below
Guideline for Complete Blood
                  Count in Medical Laboratories:
                  Effects of Preanalytical Parameters

Prepared by the Turkish Biochemical Society Preanalytical Phase Working Group.
                                2020-ANKARA
                           ISBN: 978-605-70111-0-7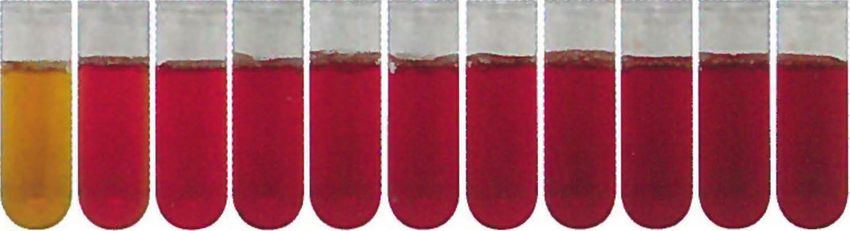
Guideline for Complete Blood
       Count in Medical Laboratories:
      Effects of Preanalytical Parameters

Prepared by the Turkish Biochemical Society Preanalytical Phase Working Group.
                                 2020-Ankara
                           ISBN: 978-605-70111-0-7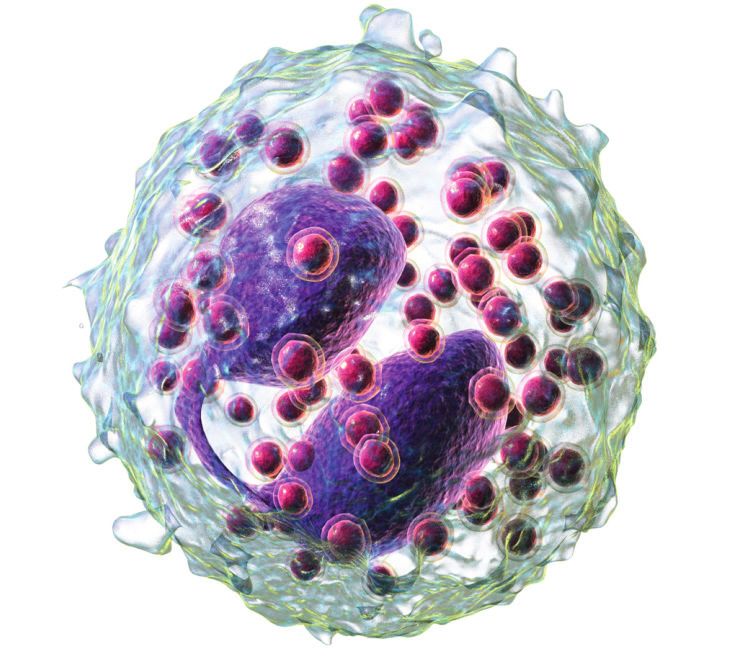
Published by
                                    Turkish Biochemical Society
                             Hirfanlı Sokak 9/3 G.O.P. Çankaya/Ankara

                                             Tel: 0 312 447 09 97
                                            Fax: 0 312 447 09 63
                                            Publication Year 2020

All rights are reserved. Any part of this book cannot be reproduced, kept electronically, copied neither electronically nor
                     photographically and cannot be published in any way without written permission.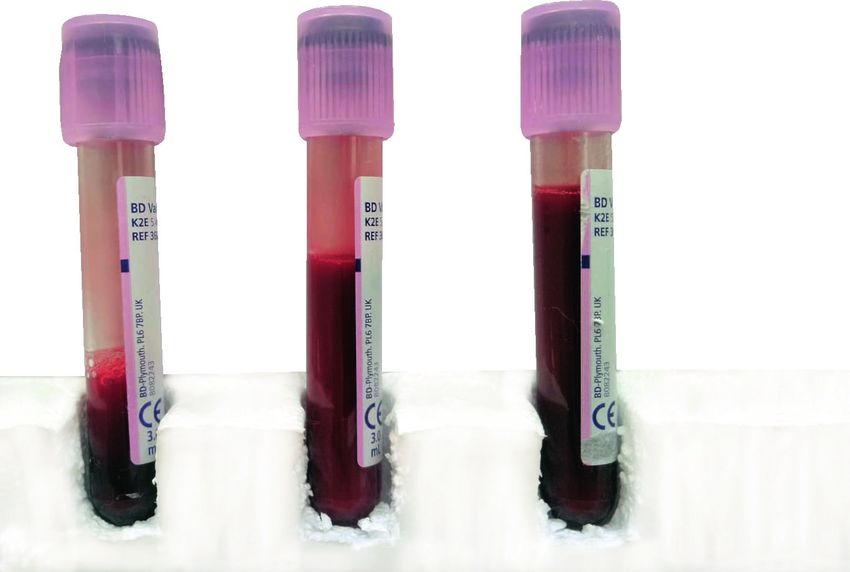
PREPARED BY

Fehime Benli Aksungar
 Fatma Demet Arslan

      Esin Avcı

     Güzin Aykal

    Cihan Coşkun

   İpek Çınaroğlu

     Ayfer Çolak

     Pınar Eker

    Funda Güçel

    Alper Gümüş

    Aylin Haklıgör

  Berrin Berçik İnal

    Bağnu Orhan

  Çiğdem Sönmez

   Mehmet Şeneş

    Fatma Taneli

    Canan Yılmaz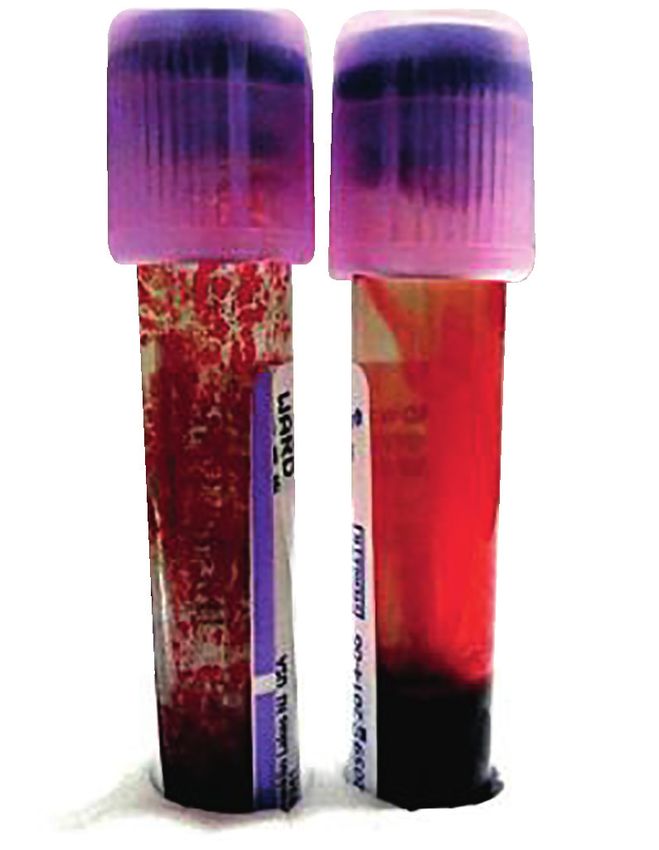
CONTENT

Abbreviations......................................................................................................... 8

1. INTRODUCTION ................................................................................................ 9

2. GENERAL INFORMATION................................................................................. 9

     2.1. Structure and Cellular Components of Blood............................................ 9

     2.2. Development of Complete Blood Count Method.................................... 14

3. PRINCIPLES OF THE MEASUREMENT IN AUTOMATIC BLOOD COUNT DEVICES .16

     3.1. Impedance Method in Blood Count (Coulter Method)............................. 16

     3.2. Flow Cytometry Method in Blood Count................................................. 18

     3.3. Calculation of Complete Blood Cell Count Parameters.......................... 20

4. VENOUS BLOOD COLLECTION FOR COMPLETE BLOOD COUNT ............ 25

     4.1. Preparing the Patient................................................................................ 25
           4.1.1. Posture............................................................................................. 25

           4.1.2. Exercise .......................................................................................... 25

           4.1.3. Circadian Rhythm............................................................................ 25

           4.1.4. Stress............................................................................................... 25

           4.1.5. Diet ................................................................................................. 25

           4.1.6. Smoking........................................................................................... 26

     4.2. Blood Sampling Equipment Used in Complete Blood Count ................. 26
           4.2.1. Blood Sampling Tubes.................................................................... 26

           4.2.2. Tube Additives: Anticoagulants...................................................... 26

           4.2.3. Insufficient Sample Volume............................................................ 27

           4.2.4. Blood Sampling Needle.................................................................. 28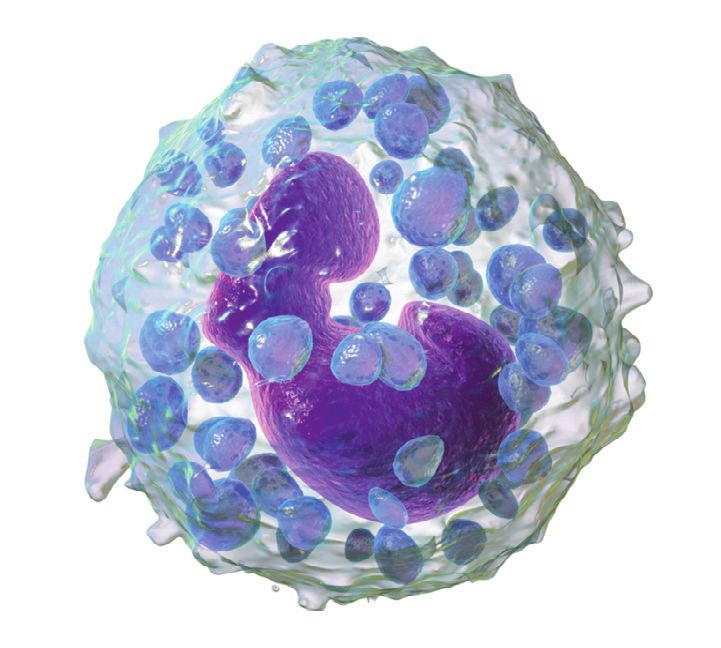
4.3. Venous Sampling for Complete Blood Count.......................................... 29
           4.3.1. Blood Sampling Staff .................................................................... 29

           4.3.2. Order of Draw For Edta Tubes ....................................................... 29

           4.3.3. Mixing The Edta Tube .................................................................... 30

           4.3.4. Edta-Dependent Pseudothrombocytopenia................................... 30

           4.3.5. Effect of Blood Sampling Procedures............................................ 31

           4.3.6. Blood Volume.................................................................................. 31

5. SAMPLE TRANSPORTATION.......................................................................... 33

6. SAMPLE STORAGE.......................................................................................... 33

     6.1. Time Period of Complete Blood Count and Conditions of Sample Storage... 33

7. CRITERIA OF SAMPLE REJECTION............................................................... 33

     7.1. Clotted samples........................................................................................ 34

     7.2. Hemolysis................................................................................................. 35

     7.3. Icterus (Bilirubinemia)............................................................................... 36

     7.4. Lipemia..................................................................................................... 37

     7.5. Cold Agglutinins....................................................................................... 39

Referances........................................................................................................... 41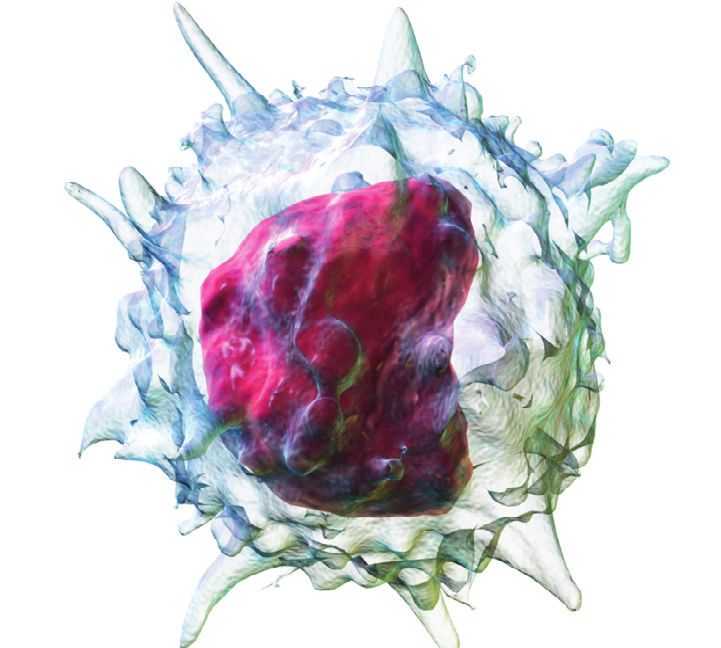
Abbreviations
ADP: Adenosine diphosphate
EDTA: Ethylenediaminetetraacetic acid (C10H16N2O8)
ESR: Erythrocyte sedimentation rate
HCT: Hematocrit
HGB: Hemoglobin
K 2EDTA: Dipotassium EDTA
K3EDTA: Tripotassium EDTA
LD: Lower detection limit
MCH: Mean corpuscular hemoglobin
MCHC: Mean corpuscular hemoglobin concentration
MCV: Mean corpuscular volume
MPV: Mean platelet volume
Na2EDTA: Disodium EDTA
NADPH: Nicotinamide adenine dinucleotide phosphate
NK: Natural killer
PCT: Plateletcrit
PDW: Platelet distribution width
PET: Polyethylene terephthalate
PLT: Platelet
PMN: Polymorphonuclear neutrophils
PP: Polypropylene
RBC: Red blood cell
RDW: Red cell distribution width
UD: Upper detection limit
VLDL: Very low density lipoprotein

WBC: White blood cell

                                      8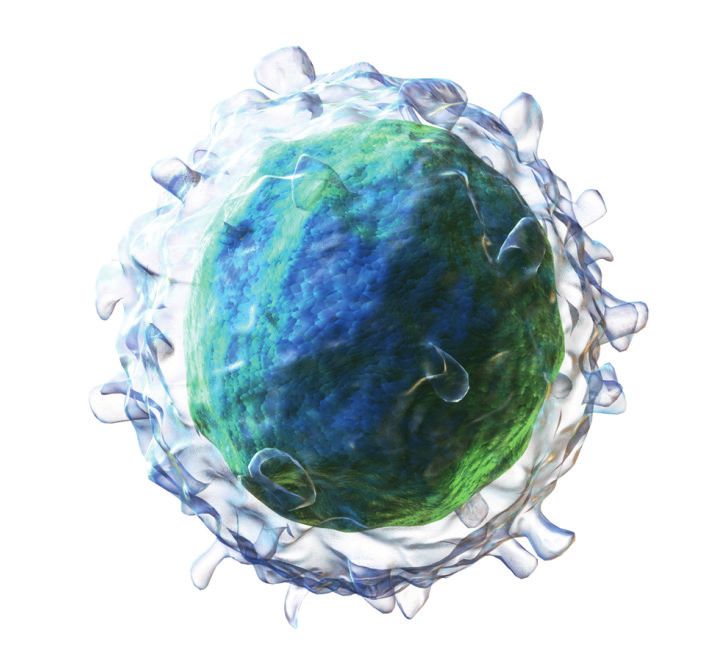
1. INTRODUCTION
     As technology progresses, automatic analyzers substitute manual proce-
dures and reduce analytical errors. However, as the number of test orders in hos-
pitals and correspondingly as the number of sample accessioning in medical bi-
ochemistry laboratories increase, the preanalytical phase of the total continuum
becomes more inclined to errors. At present, the vast majority of errors affecting
test results occur in the preanalytical phase (1). Among the tests studied, one of
the most measured tests is the complete blood count (CBC). Therefore, CBC is
one of the tests which are numerically affected by the preanalytical errors (2).
Management of the preanalytical phase is difficult due to the need for participa-
tion of divisions other than the laboratory. Knowledge about variables impacting
CBC test has great importance for preventing preanalytical errors. Developing
and complying with the instructions related to this issue are included in the re-
sponsibilities of the laboratory management. This reference document is pre-
pared with the purpose of performing a useful, practical and applicable guideline
for all medical laboratory staff, nurses, phlebotomists, students and researchers.
2. GENERAL INFORMATION
2.1. Structure and Cellular Components of Blood
     Blood is a life-sustaining fluid. Blood, also defined as a tissue, is a crucial
tool in evaluating the health status of the individual for it circulates almost all
over the tissues. Blood has two essential components;
          1. Cellular components,
          2. Plasma.
     The blood count is the most frequently used measurement method for
assessing the blood’s cellular components.
     Red Blood Cells (RBC, erythrocytes): Red blood cells are akaryocytes in the
shape of a concave disc. Its diameter is 6.2 - 8.2 µm in average and its volume is 90
fL on average (Figure 1).

                   Figure 1. Red Blood Cells (erythrocyte) (3)

                                         9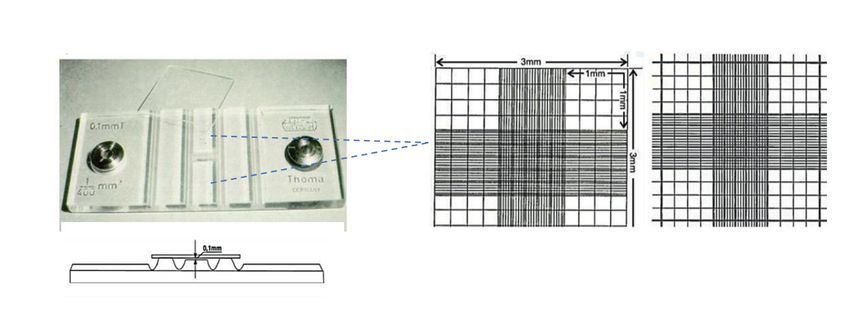
Their main function is to mediate gas exchange (4). Hemoglobin is a protein
providing this function and filling almost the whole content of the cell. Red blood
cells bond oxygen in lungs mediated through hemoglobin and transport oxygen
to the tissues and make the return trip taking carbon dioxide back to the lungs.

        Red blood cells are produced in bone marrow as all the other blood
cells. Reticulocyte is an intermediate nuclear cell which is observed during the
maturation of erythrocytes. The elasticity of the cell wall of ageing red blood
cells declines and cells are caught while filtered in the sinusoids during their
passage through the spleen. Average life-span of red blood cells in blood cir-
culation is 120 days.

       Red blood cells are examined in blood count with the parameters such
as RBC, hemoglobin (HGB), hematocrit (HCT), Mean Corpuscular Volume
(MCV), Red Cell Distribution Width (RDW), Mean Corpuscular Hemoglobin
(MCH), Mean Corpuscular Hemoglobin Concentration (MCHC)

     The decrease in red blood cell count is called anemia. Oxygen-carrying
capacity of blood declines as a result of anemia. The case where an increase
in red blood cell count is observed is polycytemia; polycytemia is observed in
myeloproliferative disorders.

     Hemoglobin: The functional protein which is found most frequently in red
blood cells is hemoglobin. The most crucial function of hemoglobin is to medi-
ate gas exchange between lungs and tissues as well as some other functions
such as maintaining acid-base balance, transportation of nitric oxide (NO).
More than 90% of the cytoplasm of a red blood cell is filled with hemoglobin.
This protein with a molecular weight of 64.000 Dalton is a tetramer composed
by the combination of four globulin chains containing one heme loop each.
Heme is the functional part of hemoglobin composed of protoporphyrin IX
ring in the middle of which an iron atom is found. Hemoglobin is the most
important part of blood count because it is used both alone and in the meas-
urements of many red blood cell indicators (5).

    White Blood Cells (WBC, leukocytes):

     White blood cells are called so because they have achromatic vision com-
pared to red blood cells under the light microscope. They are divided into five
different types.

     Neutrophils: Neutrophiles which are an important component of hered-
itary immunity, have crucial functions in defense against microbial infections.
50-70% of white blood cells in blood circulation are neutrophiles and their
count is 1.7-7.5 103/µL' on average.

                                        10
They stain neutral pink in hematoxylin and eosin. Two types of granules are
specified inside the neutrophiles. Primary granules are also known as azurophilic
granules; they contain enzymes such as myeloperoxidase, elastase, proteinase.
Secondary granules (specific granules) contain enzymes such as phosphatase,
NADPH oxidase, collagenase. Nuclei of the neutrophiles of which the diameter var-
ies between 12-15 µm have 2 to 5 segments (lobed or segmented). Therefore, they
are denominated as polymorphonuclear neutrophil cells (PMN) together with eosin-
ophiles and basophiles of which the nuclei are seen lobed under the microscope (4).
Figure 2. Neutrophiles (3)
Eosinophiles: They make just 1-3% of white blood cells; their diameter
varies between 12-17 µm. They stain well with acidic dyes; they are observed
dark red under the light microscope. The structures that stain are granules;
they are full of enzymes such as lipase, DNAse, plasminogen. Their particu-
lar function is to defend the body against parasitic infections (4). Eosinophile
count also increases in allergic conditions.
Figure 3. Eosinophile (3)
11Basophils: Just 0.5-1% of white blood cells is basophile in blood circu-
lation; the diameter of a basophile is 12 µm in average. They are called as ba-
sophiles due to well staining with alkaline (basic) dyes; they are blue under the
light microscope. Molecules like histamine and serotonin make the content of
the granules. Particularly in allergic conditions, the count increases (4).
Figure 4. Basophile (3)
Lymphocytes: Lymphocytes make about 20-40% of white blood cells;
its blood count is 1.0-3.2 103/µL. They are divided into sub-typed such as T
cells, B cells, natural killer cells (NK). These cells functioning both in hereditary
immunity and acquired immunity mediate almost all defence incidents of the
immune system. Under the light microscope, the nucleus of these cells having
a 7 µm size in average fills almost the whole of its cytoplasm; however, in the
cytoplasm of some NK cells, granules can be observed (4).
Figure 4. White Blood Cell (Lymohocyte) (3)
12Monocytes: Monocytes are the precursors of the tissue macrophages
in blood. They make 2-10% of white blood cells. They are the largest cells in
blood circulation with their 12-20 µm diameters. Under the light microscope,
their horseshoe-like nuclei is observed (4).
Figure 5. Monocyte (3)
Thrombocytes (platelet (PLT), blood-platelets): There is no nucleus in
thrombocytes derived from megakaryocytes. The function of thrombocytes
which are 2-3 µm in diameter is to plug holes by clotting where endothelial in-
tegrity is interrupted. For this reason, when necessary, they must be activated.
Availability of two kinds of granules inside thrombocytes: While coagulation
factors such as fibrinogen are found in alpha granules, delta granules is full of
substances such as ADP, calcium, serotonin (4).
Figure 6. Thrombocytes (3)
132.2. Development of Complete Blood Count Method:
Blood count measurement is one of the oldest laboratory methods providing to
evaluate blood cellular components both quantitatively and qualitatively. At present,
a complete blood count is one of the most frequently requested tests.
The one who firstly specified blood count as a test that helps to the clinical
diagnosis of diseases is Karl Vierordort (1818-1884). He investigated the blood by
performing blood smears to be observed under the microscope (6). Thereafter,
Luis Charles Malassez (1842-1909) influenced on the advancement of blood
count method with his studies. He facilitates blood count by designing a new
mechanism providing whole blood to become diluted (7).
Figure 7. Blood count instrument developed by Malassez (Hemocytometer) (6)
One of the most important developments in blood count is realized by
Richard Thoma (1847-1923). He applied complete blood count specimen into
the hallow which is found on the slide that he designed specifically and has 1
mm sides, 0.1 mm depth and a shape of tetragonal prism with a volume of 0,1
mm3, by diluting the specimen with his specific pipette. In Thoma slide, the
counting area is divided into 16 big squares, and these squares are divided into
400 little squares (Figure 8). Blood cells can be counted through Thoma slide
under the microscope. Thoma slide is manufactured commercially by the firm
Carl Zeis and launched to the daily laboratory consumption (8).
Figure 8. Thoma slide (8)
14At the beginning of 1900s, it was seen that Thoma slide has insufficient
performance for white blood cell count and then researchers such as Bauer,
Türk, Bürker developed white blood cell count further, also by the help of di-
verse staining methods (6).
Figure 9. Blood count apparatus developed by Bürker and Türk (Hemocytometer) (7)
Until the 1950s, blood count remained to be a manual procedure, but
after then the need of automatic cell count method gradually increased due
to the increase in the workload of laboratories. At this point, the big revolution
became true by courtesy of Coulter Brothers. Coulter Brothers developed the
application which is known as the Coulter Method at present.
Figure 10. Coulter Brothers. Wallace H. Coulter on the left, Joseph R. Coulter
on the right (9)
15Figure 11. Example of the first automatic blood count device developed by
Coulter Brothers (9)
After 1980, computerized automatic blood count devices took the place of
blood count which was performed under the microscope manually. Automatic
blood count devices have provided to measure or calculate at least 18 pa-
rameters in whole blood samples having a volume lower than 200 µL within a
time period such as 1 minute. Although there are a lot of blood count devices
from different brand in the market, almost all of them operate with the similar
methods.
3. PRINCIPLES OF THE MEASUREMENT IN AUTOMATIC BLOOD
COUNT DEVICES
3.1. Impedance Method in Blood Count (Coulter Method)
Coulter Brothers observed that as blood cells suspended in an ionic
solution are directed to pass through a narrow space, they cause changes
in electric current sensed by the electrodes placed in the space according to
the type of the passing cells. Coulter Brothers, in their device, found out that
there happened to be an alteration in lower frequency electric current applied
between two electrodes placed inside and outside the tube when blood cells
were passing respectively through the space (aperture) made on a glass tube
(Figure 12). As each cell passes through the aperture, change in the electrical
the resistance between these two electrodes, alias impedance, caused the
alteration (10).
16Figure 12. The general design of automatic blood count devices running ac-
cording to the method of impedance (10,11)
In Coulter device, each beat (peak) read on the oscilloscope is counted as
a cell passing. Magnitude in voltage change is proportional to the size of the
cell passing at that moment.
Figure 13. Counting blood cells in oscilloscope in automatic blood count
devices. Each peak line shows a cell passing and the height of the peak bar
shows the size of the cell in femtoliter (fL) (10, 11)
17Cell counts together with their sizes are added into a histogram graphic.
In these graphics, cell populations can be differentiated with certain thresh-
old values. Thus, both counts and sizes of the blood cells are measured
(Figure 13).
Figure 14. Presentation of the distribution of blood cells counted by automat-
ic blood count devices according to the size of the cells (10,11)
3.2. Flow Cytometry Method in Blood Count
Although the Coulter method successfully counts red blood cells, it has
not displayed the success expected for the white blood cells. This issue man-
aged to be resolved by combining flow cytometers with blood count analyzers.
With flow cytometer, size, shape, biochemistry or antigenic components of a
single cell can be determined. The light source in flow cytometers is laser. As
the cell flows through the channel, exposure of the cell to the laser light causes
light scatter. Receptors placed in different angles can determine the intensity
of the scattered light. Data coming from different angles are assessed and
pooled and added to the scatter graphic (Figure 15). Thus, the type of white
cells can be specified.
18Figure 15. Specification of the type of white blood cells by flow cytometer (12)
19Figure 16. The general design for automatic blood count by the manufacturers (12)
3.3. Calculation of Complete Blood Cell Count Parameters
The complete blood count is developed by combining techniques more
than one. At present, this development has been going on by combining new
techniques with the techniques which are in use. In complete blood count, the
initial technique used was a visual examination of the cells via microscope.
HGB levels measured spectrophotometrically by cyanohemoglobin meth-
od (Drabkin method) enabled parameters known as red blood cell indicators
(erythrocyte indices) to be calculated. At present, photometric HGB measure-
ment is an integral part of the automatic blood count analyzers.
20Red Blood Cell Count (RBC), MCV: Red blood cell count is reported as
RBC. Size of the red blood cells is also essential as their count. Mean corpuscu-
lar volume (MCV) is an auxiliary indicator, particularly in the differential diagnosis
of anemia. In measurements performed under a microscope, MCV value is cal-
culated by dividing measured hemotocrite value (HCT) by red blood cell count
(RBC).
HCT: In this context, another critical indicator (parameter) is the HCT val-
ue. HCT is the proportion of total cellular components in the blood to total
blood volume in percentage. Before the development of automatic methods,
HCT levels used to be measured in the way that blood samples were collected
in capillary tubes and these capillary tubes were resolved using micro-centrif-
ugation. However, with the development of automatic blood count, HCT has
become a value calculated by using RBC counts and sizes instead of being a
measured value (Figure 17).
PCT
MPV(fL) =
P LT
Figure 17. On the left; hematocrit measurement using of micro-centrifugation (HCT
(%)). On the right; calculation of hemotocrit in automatic blood count analyzers (13)
MCH, MCHC: Another two important red blood cell indicators are MCH and
MCHC. MCH and MCHC serve in specifying the type of anemia. When MCHC
value drops below 32, red blood cells are denominated as hypochromic because
of the faint appearance of red blood cells due to iron deficiency, but not the other
way round; in fact, under physiological conditions, MCHC level in red blood cells
do not rise over 36. Hyperchromia definition, which is a microscopic assessment
is a misattribution. In such cases, for the structure of red blood cells changes and
turns into spherocyte, they are seen much more filled and darker in color. There-
fore, they have been specified as hyperchromic. MCHC value changes a little bit
lifelong of an individual. There are minimal factors that affect MCHC level. There-
fore, MCHC is an auxiliary indicator, particularly in evaluating preanalytical errors.
21HGB
MCH (pg) =
RBC
HGB
MCHC (g/dL)=
HCT
RDW: It is a quantitative measurement of differences among red blood
cell sizes. The distribution of red blood cell sizes is calculated by added on the
histogram (Figure 18). Results of the patients are reported in standard devia-
tion (RDW-SD), variation coefficient (RDW-CV).
Figure 18. Calculation of RDW by histogram (13).
*LD: Lower detection limit, UD: Upper detection limit
White Blood Cell Count (WBC): High count of red blood cells in a blood
sample conceals white blood cell count. Therefore, for blood count analyzers
to perform the measurement, red blood cells are removed by lysing red blood
cells with substances in surfactant specifications (lyse solution). Then, white
blood cells are counted directly according to the measurement method of the
manufacturer company. In the patient’s results, white blood cell count (WBC)
in total and sub-component of each white blood cell are reported both in count
and in proportion (Table 2). In designs of blood count analyzers launched by
different manufacturers, changes can exist in measurement methods and cal-
culations. In Table 2, measurement and calculation methods of the most fre-
quently used blood count analyzers are summarized.
22Platelet (thrombocyte) count: Platelet count can be more difficult than
other cells due to their small dimensions. In addition, while residual pieces
of other degraded cells, micro-erythrocytes and bacteria lead to false-high
platelet counts, giant platelets or platelet aggregates lead to false-low platelet
count values. In patient’s results, platelet values are reported together with
platelet distribution width (PDW), MPV and plateletcrit (PCT) obtained by divid-
ing platelet volume by platelet count.
Tablo 1. Measurement methods of blood count parameters by different
manufacturers
Beckman
Abbott Siemens
Coulter Sysmex XN Mindray
Parameter CELL-DYN ADVIA
UniCel Series BC Serie
Sapphire 2120i
DxH 800
Fluorescent Fluorescent
WBC Impedance stained light Light scatter Light scatter stained light
scatter scatter
Laser light
RBC Impedance Impedance Impedance Impedance
scatter
Photometric
Cyano Sodium lau- Cyano Cyano
measure-
HGB hemoglobin ryl sulfate hemoglobin hemoglobin
ment with-
525 nm 555 nm 540 nm 546 nm
out cyanide
Total RBC
(RBC x (RBCx (RBC x (RBC x
HCT peak
MCV)/10 MCV)/10 MCV)/10 MCV)/10
magnitude
Average ob- Average ob-
tained from tained from
the RBC (Hct/RBC) the RBC (HCT/RBC) (HCT/RBC)
MCV
diameter x 10 diameter x 10 x 10
distribution distribution
histogram histogram
(HGB/HCT) (HGB/HCT) (HGB/HCT) (HGB/HCT) (HGB/HCT)
MCHC
x 100 x 100 x 100 x 100 x 100
Supravital Fluorescent Supravital Fluorescent Fluorescent
Reticulocyte staining light stained light staining light stained light stained light
scatter scatter scatter scatter scatter
Light scatter Light scatter Light scatter
PLT impedance impedance impedance Light scatter Impedance
in common in common in common
23Tablo 2. Reference ranges, units, measurement methods and formulas of
blood count parameters
Measurement
Parameter Reference range Unit Formula
method
Red blood cell indicators
Female:3.8-5.2
RBC 106 /µL Count
Male: 4.2-6
Female:12-15 Photometric
HGB g/dL
Male: 13.5-18 measurement
Female: 35-49
HCT % Calculation
Male: 40-54
HCT
MCV 80-100 fL Calculation MCV(fL) =
RBC
HGB
MCH 26-34 pg Calculation MCH(pg) =
RBC
HGB
MCHC 32-36 g/dL Calculation MCHC (g/dL)=
HCT
RDW 11,5-14,5 % Calculation Histogram
Platelet parameters
PLT 150-450 103/µL Count
PCT
MPV 7-12 fL Calculation MPV(fL) =
P LT
White blood cell parameters
WBC 6.3-10.6 103/µL Count
Neutrophil 1.7-7.5 10 /µL
3
Count
Neutrophil # 50-70 % Calculation
Lymphocyte 1-3.2 103/µL Count
Lymphocyte# 18-42 % Calculation
Monocyte 0.1-1.3 10 /µL
3
Count
Monocyte# 2-11 % Calculation
Eosinophil 0-0.3 103/µL Count
Eosinophil# 1-3 % Calculation
Basophil 0-2 10 /µL
3
Count
Basophil# 1-2 % Calculation
244. VENOUS BLOOD COLLECTION FOR COMPLETE BLOOD COUNT
4.1. Preparing the Patient
4.1.1. Posture
Switching to sitting position or upright position from prone position causes
fluid flow from the vessels into the interstitial space. It is known that, as a result
of this fact, molecules which cannot diffuse into the tissue due to their dimen-
sions such as blood cells, proteins, cholesterol and iron are measured high. It
is reported that HGB values increase by 8%, RBC values by 8% and WBC up
to by 15% between supine position and sitting or prone position of the same
person (14).
4.1.2. Exercise
Exercise can affect analytes such as creatinine, creatinine kinase, myo-
globin, aspartate aminotransferase as well as the results of complete blood
count (15). It is reported that WBC, neutrophil and lymphocyte values increase
significantly and high neutrophil count lasts more than 2 hours after heavy
exercise (16).
4.1.3. Circadian Rhythm
It has been known that circadian rhythm has an impact on blood count.
Although RBC, HGB and HTC display a little increase at 11:00 in the morning,
an increase in leukocytes can be observed in the evening between 21:00-24:00
(17). It is reported that while lymphocyte, eosinophil and basophil counts reach
their highest value, they decrease in morning hours. This change is inversely
related to the cortisol level (18). It is reported that PLT count increases in the
evening and decreases in the morning (19). For standardization in results, it is
appropriate to perform blood sampling in the morning.
4.1.4. Stress
Anxiety and particularly crying of children during blood collection can
cause increase in leukocyte count (15).
4.1.5. Diet
Blood should be drawn for sampling after at least 8-12 hours fasting period
(15). Glucose and lipid content of the blood increase in individuals who eat with-
in 2 hours or less before drawing the blood sample. It can affect MCV, MCHC,
HCT results in high concentration. Excessively high lipid content can lead to
interference in tests where photometric measurement is performed such as he-
moglobin (17). In addition, it has been reported that when blood glucose level in-
creases over 500 mg/dL, MCV value is affected due to the osmotic impact (20).
254.1.6. Smoking
Before blood sampling, smoking can cause an increase in leukocyte
count. The long duration of smoking causes increases in hemoglobin level (15).
Recommendations:
• 8-12 hours fasting before blood sampling is recommended.
• Heavy physical exercise should be avoided within 24 hours prior to blood
sampling.
• It is recommended not to smoke at least 2 hours before blood sampling
for blood count.
4.2. Blood Sampling Equipment Used in Complete Blood Count
4.2.1. Blood Sampling Tubes
Plastic tubes are preferred because they are flexible, resistant to high cen-
trifugation speeds and safer for the staff; in addition, they are adjustable so
they ensure a decrease in medical waste burden and they do less harm in the
environment.
Because of these reasons, plastic tubes are more frequently chosen and
are used prevalently.
Plastic tubes are manufactured using polyesters such as polyethylene
terephthalate (PET), polyolefins such as polyethylene and polypropylene (PP),
polyacrylic, polytetrafluoroethylene, polysiloxane, polyvinyl chloride, polyacry-
lonitrile and polystyrene. However, plastic tubes have more gas permeability
compared to glass tubes. PET which is non-breakable and ensuring longer
vacuum retention is prevalently used in the production of blood sample tubes.
And PP, for it has less water permeability, is another selected plastic material
because it provides keeping the volume and concentration of liquid anticoag-
ulation agents (21-24).
4.2.2. Tube Additives: Anticoagulants
The most critical point of blood collection in complete blood count is to
draw the sample into the right tube. Drawing the sample into the EDTA tubes
known to be ‘lavender cap’ in daily laboratory speech has become a stand-
ard for complete blood count analyses. That is the most basic information
that must be well known by all healthcare workers taking roles in preanalyti-
cal phase. Thus, collecting blood sample in improper tubes, therefore sample
transfer from tube to tube can be prevented.
26Ethylenediaminetetraacetic acid (EDTA, C10H16N2O8); is specified as the
most appropriate anticoagulant for hematological tests because it keeps both
the morphology of blood cells and cellular content. For complete blood count,
EDTA salts are used as an anticoagulant. EDTA salts, being a chelating agent,
bind calcium in blood and inhibit coagulation cascade. As EDTA salts, K3ED-
TA (tri-potassium EDTA), K 2EDTA (di-potassium EDTA), Na2EDTA (di-sodium
EDTA) can be used (25, 26).
K 2EDTA and Na2EDTA are applied on the inner surface of the tubes
sprayed and dried. But the advantage of K2EDTA is that it is more soluble
than Na2EDTA. K3EDTA is found in liquid form in the tubes. Although liquid
EDTA has the advantage of mixing with blood and lack of clots, it can cause
sample dilution due to its liquid form. Therefore, it is pointed out that directly
measured values are resulted in lower levels by 1-2% compared to K 2EDTA
adulterant blood samples. In addition, as EDTA concentration rises, K3EDTA
causes more shrinkage in RBCs due to excess potassium ions it contains
(11% reduction in 7.5mg/mL blood). Therefore, K3EDTA causes reduction also
in MCV values (typically, a difference between -0.1% and -1.3% has been ob-
served compared to K 2EDTA). However, it is observed that there is a much
more increase in cellular volume in pending blood samples with K3EDTA (1.6%
increase after 4 hours). International Hematology Standardization Council and
CLSI recommend K 2EDTA that should be used in the measurements of blood
cell count and blood cell dimensions due to all of these reasons (26,27). K 2ED-
TA and K3EDTA concentrations are recommended to be 1.5 – 2.2 mg/mL as an
anticoagulant (27).
4.2.3. Insufficient Sample Volume
It has been reported that the second source of preanalytical error in com-
plete blood count tests is the collection of insufficient blood sample (28-30).
It has been stated above that two types of EDTA salt additives are used in
the tubes used for drawing complete blood count sample. While K 2EDTA is
sprayed onto the inner surface of the tubes in dry form, K3EDTA exists in the
tubes as liquid solution. Therefore, it is known that K3EDTA tubes cause dilu-
tion in samples and that this leads to reading the results under the real values
for all of the parameters that are measured by 1-2%. However, drawing blood
in lower volumes than the volume recommended for K3EDTA tubes will in-
crease this dilution effect. Another negative effect of drawing blood in lower
volume is the shrinkage occurring in blood cells due to hyperosmolarity in both
K 2EDTA and K3EDTA tubes. As a matter of this fact, it is reported that while a
decrease in MCV and HTC values is observed, there is an increase in MCHC
values (31-33).
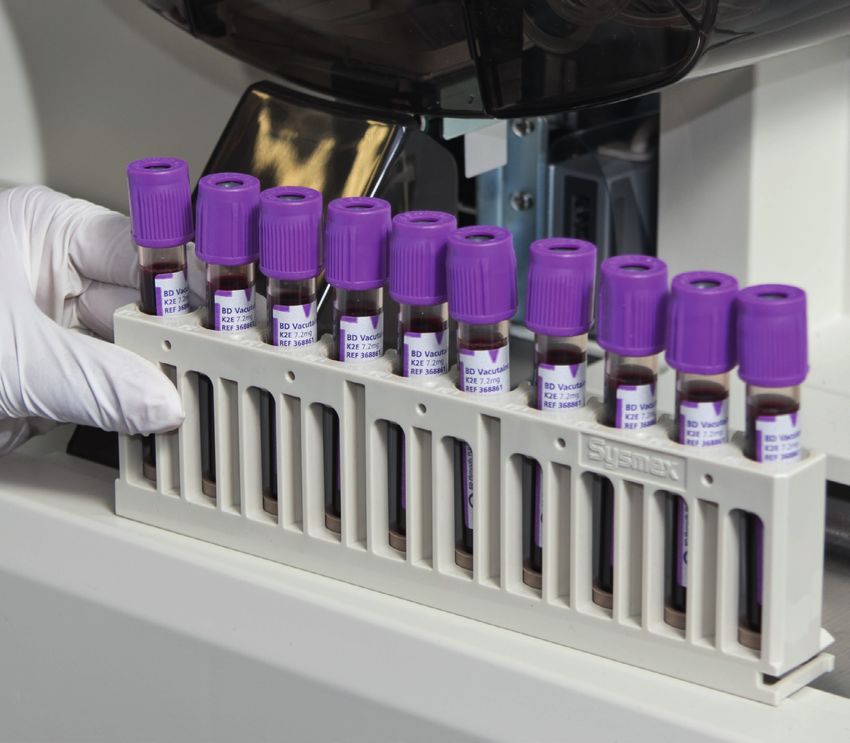
27At present, blood sampling tubes, their holders and needles are used to-
gether providing a system. In evacuated blood sample tubes, it is specified
how much volume of blood shall be drawn following vascular access. All man-
ufacturers put a fill line indicator on the tubes in order to observe this vol-
ume (Figure 19). In order to provide the right blood/anticoagulant ratio which
is needed for correct test results, it should be paid attention to drawing the
volume of blood specified by the manufacturer company (fill line). The overall
approach is in the direction that the tube can be filled with the sample about
+10% of the tube’s fill line (90%-110%) (34). For the speed of tube fill can vary
between different brands, waiting until the end of the blood flow into the tube
(till the vacuum exhausted) is important for sufficient blood drawing.
Figure 19. On the left, sample drawn in insufficient volume; in the middle,
sample drawn in appropriate volume; on the right, sample drawn in excess
volume
4.2.4. Blood Sampling Needle
In venous blood sampling, the size of the sampling needle should be speci-
fied according to the amount of blood to be drawn, the age of the patient and the
diameter of the vein. For drawing blood from the antecubital vein, 19-21 G (gauge)
needles are ideal; smaller needles can be used in newborns and in adults who have
thinner veins. It should be kept in mind that large G size numbers connote needles
with small diameter and small G size numbers connote needles with large diameter.
284.3. Venous Sampling for Complete Blood Count
4.3.1. Blood sampling staff
It has been recommended that venous sampling should be done by
trained nurses and phlebotomists for all tests. The staff that will draw blood
for sampling should be trained especially about tube sequence, specifications
of the equipment to be used and tube filling volume.
4.3.2. Order of Draw for EDTA tubes
In patients for whom the EDTA sample is ordered together with the other
laboratory tests, the order of draw of the tubes that have different specifica-
tions is crucial. After venipuncture, drew order stated in the Guidelines for
Venous Blood Sampling should be followed (Table 3) (35).
Tablo 3. Order of draw and mixing to comply with for sample tubes accord-
ing to the features of the tests ordered (35).
Cap color Tube/Additive Mixing
In order to make medium
Parameter (1) Blood culture/Medium and blood mix, it is inverted
slightly
(3) Coagulation tube / Citrated 3-4 times
(4) ESR tube / Citrated 3-4 times
(5) Serum tube / Without gel 5 times
(5) 5 times
Serum tube / With gel
(5) 5 times
Serum tube / Tube with
(5) 5 times
thrombin clot activator
Plasma tube / Heparin tube
(6) 8-10 times
with or without gel
Plasma tube / EDTA tube
(7) 8-10 times
with or without gel
Plasma tube / Fluoride /
(8) Potassium Oxalate: Fluoride 8-10 times
/ EDTA Fluoride / Heparin
29Warning: Tubes should be filled until the vacuum exhausted and blood
flow stops. Tubes containing additives (such as EDTA, citrate, heparin) should
be filled up to the volumes recommended by the manufacturer or until ensur-
ing the correct blood/additive ratio.
*EDTA; ethylenediamine tetraacetic acid, ESR; erythrocyte sedimentation
rate
4.3.3. Mixing the EDTA tube
In addition, all tubes independently of EDTA salt used for anticoagulation
should be inverted 8-10 times in order to ensure a complete mixture of an-
ticoagulant and blood. Doing this procedure imprecisely is one of the most
essential preanalytical error sources, imprecisely. This procedure should be
repeated 8-10 times as shown in Figure 20. Tubes must not be shaken, must
be inverted gently.
Figure 20. Mixing the whole blood sample collected in EDTA tube by inverting
4.3.4. EDTA-dependent pseudothrombocytopenia
It is considered that autoantibodies against glycoprotein originated as a
result of an interaction between EDTA and the glycoprotein IIb-IIIa found on
30the platelet membrane leads to platelet aggregation. Consequently, pseudo-
thrombocytopenia is specified. Prevalence of EDTA-dependent pseudothrom-
bocytopenia is reported to be 0.1%. If such a condition is suspected, the test
is repeated after collecting a blood sample in another tube containing an anti-
coagulant other than EDTA (such as sodium citrate, heparin). If the case is ED-
TA-dependent pseudothrombocytopenia, then platelet count is expected to
be corrected (35). Besides, the platelet count can be controlled by peripheral
smear with a finger stick capillary sample.
4.3.5. Effect of Blood Sampling Procedures
At every stage of:
• Identity validation,
• Choosing and preparing the equipment that will be used for blood
collection,
• Choosing vascular access site (vein),
• Cleaning vascular access site,
• Tourniquet duration,
• Venipuncture and blood collection,
• Tube sequence
which are applied during blood collection in the patient, it should be com-
ply with related guidelines (35-37).
Tourniquet application should not exceed one minute for it can locally halt
circulation system associated with hemoconcentration and infiltration of blood
to tissue. If tourniquet application exceeds this period of time, analytes hav-
ing a protein structure, cellular blood volume and other cellular element levels
are found to be erroneously high. Among the parameters affected, along with
analytes such as albumin, potassium and calcium, complete blood count pa-
rameters such as RBC, WBC, HGB, HCT take place. It is reported that if tour-
niquet duration lasts for 2 minutes, there is a significant increase in HGB and
HCT values (36). In order to prevent this case, it is recommended to loosen
the tourniquet and reapply after two minutes if it is applied for more than one
minute (38).
4.3.6. Blood volume
Blood volume collected should be so as to minimize iatrogenic (related to
phlebotomy) anemia risk particularly in pediatric patients and individuals with
31any critical illness. In order to prevent iatrogenic anemia, total blood amount
drawn from the patient should be monitored and limited on the base of the
time period.
In references, blood volume for children 75-80 mL/kg and for new-
borns it is higher. And in adults, it is specified as 65-70 mL/kg. It is recom-
mended to limit so as not to exceed 1-5% of the total blood volume within 24
hours and not to exceed 10% of total blood volume within 8 weeks (38). Also,
EDTA tubes with lower volumes providing to draw lower volumes of blood.
Blood amount filled into the tube is also essential. If it is overfilled, blood
is not well mixed with the anticoagulant in the tube, and this can lead to erro-
neous test results (25).
Recommendations:
• For blood count tests, blood is drawn into the tubes with lavender cap
(EDTA additive).
• Blood is to be drawn in the proper and appropriate volume. In order to
ensure proper blood/anticoagulant ratio, the tube should be filled up to the fill
line on the tube pointed out by the manufacturer. Much or less blood should
not be collected (Figure 19).
• Recommended equipment should be used; blood should not be drawn
definitely using a syringe.
• In venous sampling, phlebotomists should determine the gauge of the
blood collection needle according to the blood volume that will be drawn from
the patient, his/her age and the diameter of vein of the patient. 19-21G size
numbered blood collection needles should be used for blood count tests. For
children or and individuals with thin veins, small size numbered needles (>21G)
can be used.
• Blood transfer from tube to tube must not be done.
• After venipuncture, one should be comply with the blood sampling se-
quence stated in the Guidelines for Blood Sampling (Table 3) (35).
• The tube should be inverted 8-10 times in order to ensure blood and
anticoagulant is completely mixed (Figure 20).
• For all tests to be performed, it is recommended that venous blood sam-
pling should be done by trained nurses, phlebotomists. These staff should be
trained in regular intervals
325. SAMPLE TRANSPORTATION
Samples should be held on the tube racks straightly; swinging and shak-
ing should be avoided as possible as it can be. Specimens should be trans-
ported in nested special primary (sample tube), secondary (in a structure that
can prevent infectious contamination even if the cap is opened and containing
sorbent material) and tertiary (can be used as transportation bag, protect-
ed against temperature changes) containers so as to control heat. Heat con-
trol can be performed using devices that record temperature changes. If the
samples will be tested distant laboratories, refrigerated transportation is the
recommended application. On the other hand, it should be kept in mind that
keeping samples in the refrigerator can stimulate coagulation and these sam-
ples should be evaluated with regards to the presence of coagulum.
6. SAMPLE STORAGE
6.1. Time Period of Complete Blood Count and Conditions of Sample
Storage
If samples of complete blood count analyses are kept waiting at room
temperature, it is recommended to perform the tests within 6 (six) hours just
after blood drawing (30). If samples cannot be tested within 6 hours, they can
be kept in the refrigerator at +4ºC for 24 hours. In samples kept in the refriger-
ator, it is reported that MCV, HCT, WBC values are more stable (39-42).
Recommendations:
• If samples of complete blood count tests are kept waiting at room tem-
perature, it is recommended to perform the tests within 6 (six) hours just after
blood drawing.
• If samples cannot be tested within 6 hours, they can be kept in refriger-
ator at +4ºC for 24 hours (38).
7. CRITERIA OF SAMPLE REJECTION
Many of the preanalytical variables affecting complete blood count can be
controlled. In case of complying with the blood collection instructions stated in
the previous article, a whole blood sample which is appropriate for blood count
can be obtained. However, getting an appropriate sample, meeting the required
features, may not be always provided. Recognizing such cases, if needed, this
sample or results obtained from these samples should be rejected.
Research concerning this issue suggests similar data. According to these
research, preanalytical errors that are observed most frequently in blood count
tests are listed below (30,44,45):
33• Clotted sample 57%
• Insufficient sample 14%
• Improper tube 7%
• Hemolysis 2.7%
• Lipemia 2.3%
7.1. Clotted samples
Regarding complete blood count test, the most observed preanalytical
error source is reported to be the clotted samples (28,29,45).
Potential factors that cause clotted samples:
• Insufficient mixing of blood and the additive just after the sample
collection,
• Difficult blood drawing,
• Storing the sample in the refrigerator,
• Collecting blood sample over or below the fill line indicated by the
manufacturer,
• Blood drawing by using a syringe,
• Blood transfer from tube to tube (especially from the tubes containing
coagulant to EDTA tubes).
Removing the clot using tools like wooden applicator from the tube is a
frequent misapplication in laboratories and it is not recommended definitely.
This application can lead to hemolysis and false low values in results of all pa-
rameters. Clot residues in the sample can cause occlusions in the probes and
tubing of analyzers, and if it escapes the attention, it can cause interferences
during measurement.
Recommendations:
• If clotting is observed in a whole blood sample, this sample must be
rejected definitely (28-30,44). This application can lead to hemolysis and false
low values in the results of all parameters.
• Removing the clot using tools like wooden applicator from the tube is a
frequent misapplication in laboratories and it is not recommended definitely.
34It is easy to detect large clots by the naked eye. At present, there are clot
detectors in almost all blood count analyzers found in laboratories. Even if a
clotted sample is applied to the device, it will not work, but micro-clots may
not be detected by the detector. In the presence of clots in the sample, for
blood cells are wrapped with clots, it can be observed false low results of all
parameters. In such a case, low MCHC values can be a warning.
Figure 21. A clot in a whole blood sample
7.2. Hemolysis
Figure 22. Visual evaluation of hemolysis (46)
Hemolysis is the degradation of red blood cells in vitro or in vivo. However,
most of the hemolysis events occur due to the mechanical impairment of the the
integrity of red blood cells during sample collection, transportation, processing
or storage. Hemolysis is a critical problem particularly in blood samples coming
from the emergency service and in samples drawn from children (47).
Potential hemolysis causes:
• Difficult blood drawing,
• Blood drawn using a syringe,
• Prolonged tourniquet application,
• Small needle size (larger than 23 G),
35• Hematoma formation,
• Sample contaminated by ethanol or water,
• Shaking the tube after blood draw or during transportation,
• Blood transfer from tube to tube,
• Insufficient blood draws into the vacuum tube.
Degradation of red blood cells within the sample is a part of hemoglobin
measurement method (analytical phase), but the early occurrence of this event
accidentally in the preanalytical phase causes particularly red blood cell pa-
rameters be counted or calculated improperly. While hemoglobin value is not
affected, RBC value decreases due to the degradation of red blood cells, con-
sequently HCT, MCV values will decrease and MCHC value will be calculated
falsely elevated. Regarding complete blood count, it is very difficult to detect
hemolysis in the preanalytical phase. In tests performed in serum or plasma,
the presence of hemolysis can be detected visually or by analyzers and a flag
can be formed.
An increase in platelet (PLT) values can be observed depending on hemol-
ysis. The reason of this issue can be that degraded red blood cells residues
are read as platelets (48). But hemolysis cannot be detected visually in a whole
blood sample. Therefore, while evaluating the patient results, MCHC values
can be warning.
7.3. Icterus (Bilirubinemia)
Figure 23. Visual evaluation of bilirubinemia (46)
High bilirubin value is an important interference reason. Bilirubin gives ab-
sorbance between 340-500 nm. For hemoglobin measurements are done in
close spectrums, high bilirubin levels can cause interference. Depending on
the high bilirubin levels, HGB can be read as falsely elevated; MCH values cal-
culated from hemoglobin will also be found to be high (10, 49).
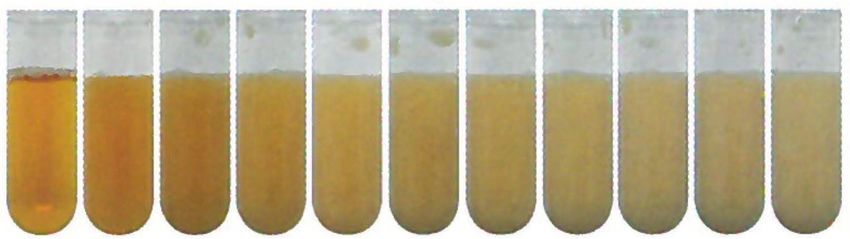
367.4. Lipemia
Figure 24. Visual evaluation of lipemia (46)
Regarding Turkish society, it is reported that triglyceride levels are over 150
mg/dL in 32% of female population and in 41.3% of male population (50). In
postprandial samples, it is known that these values are found to be much high-
er. Lipemia over 300 mg/dL can be visible. Elevated triglyceride levels show
the existence of chylomicron and VLDL of which the large part of the content
is triglyceride increase in blood circulation. While the diameter of VLDLs from
lipoproteins having particulate structure reaches 200 nm, chylomicron size
reaches 1000 nm (51). In complete blood count of which measurement method
is based on counting the particles, these lipoprotein particles can be counted
as platelet, even as red blood cell or white blood cell leading to obtaining false-
ly elevated results. Nevertheless, the impact of lipemia is not limited to this.
Lipemia affects the matrix of the sample, hence causes unwanted light scat-
tering in photometric methods. By the blur it creates, in HGB measurement
wavelength, it interferes with HGB causing to read falsely elevated hemoglobin
values (52). In addition, lipoprotein particles cause analyte condensation in the
sample by narrowing liquid compartment due to liquid excluding effect, hence
lead to falsely elevated results in all of the analytes. Reflection of this fact on
the blood count is again on hemoglobin values.
37Figure 15. The absorption spectrum of lipid, bilirubin and hemoglobin (53)
Figure 22. Lipemic whole blood sample with EDTA (52)
387.5. Cold Agglutinins
Cold agglutinin disorder is an autoimmune disorder which is caused by
antibodies generally in the type of IgM and sometimes IgA or IgG formed
against polysaccharide antigens on the surface of red blood cells. In cold ag-
glutinin disorder, antibodies that are activated by cold cause impairment in
the red blood cell membrane and red blood cells are auto-agglutinated, if the
case intensifies, it results in hemolysis. Its effect on complete blood cell count
is similar to hemolysis; while RBC and HCT decrease MCHC increases. If a
whole blood sample is kept waiting in 37°C water bath, agglutination clears up
and real values can be reached in measurements performed once more again
(55,56). If such a case is specified, it should be reported in patient results (45).
Figure 23. Visual comparison of a whole blood sample to control sample in
cold agglutinin disorder (54)
39Parameter affect-
Preanalytical error Cause Recommendation
ed in blood count
No reading or de-
In the presence of
creases in all values
Clotted sample clot residues, cells Sample rejection
in the presence of
cannot be counted
micro-clots
Red blood cells
which are early
Hemolysis RBC ↓, HCT↓ Sample rejection
degraded cannot be
counted.
Photometric in- Decision accord-
Icterus HGB↑, MCH↑ terference due to ing to the patient’s
turbidity clinical status
Photometric in- Decision accord-
Lipemia HGB↑, MCH↑ terference due to ing to the patient’s
turbidity clinical status
In disorders such as
Red blood cells hemoglobin S and Decision accord-
resistant to degra- WBC↑, C, red blood cells ing to the patient’s
dation can be counted as clinical status
white blood cell
Sample can be
RBC↓, MCV↑, Red blood cells ag-
Cold agglutinins incubated in 37 °C
MCHC↑ gregated together
and retested
Aggregated plate- Can be tested
lets can be errone- with a new sample
Platelet aggregation PLT↓, WBC↑ ously counted as drawn into another
white blood cells citrated, heparin-
(EDTA interference). ized, etc. tube
Tablo 4: Frequently seen preanalytical errors, potential causes and solution
recommendations
40Referances:
1. Plebani M, Sciacovelli L, Aita A, Padoan A, Chiozza M. Quality indicators to
detect pre-analytical errors in laboratory testing. Clin Chim Acta 2014 (15); 432:
44-48.
2. Kocer D, Karakukcu C, Buldu S, Oz L . Kayseri Şehir Hastanesi Biyokimya
Laboratuvarında Hematolojik Testlere Ait Preanalitik Hatalar. JAMER 2019;4 (3):
100-104 .
3. WikiJournal of Medicine/Medical gallery of Blausen Medical. Wikiversity. Re-
trieved September 11, 2020, from https://en.wikiversity.org/wiki/WikiJournal_of_
Medicine/Medical_gallery_of_Blausen_Medical_
4. Perkins SL. Examinations of the blood and bone marrow. In: Greer JP, Foer-
ster J, Rodgers GM, Paraskevas F, Glader B, Arber DA, et al, editors. Wintrobe’s
clinical hematology. 12th ed. Philadelphia: Lippincott Williams & Wilkins 2009.
5. Hsia CC. Respiratory function of hemoglobin. New Eng J Med 1998; 338(4):
239-248.
6. Vierordt K V Neue methode der quantitativen mikroskopischen analyse des
blutes. Arch F Physiol Heilk. 1852;11: 26-46.
7. Verso ML. The evolution of blood-counting techniques. Med Hist 1964; 8(2):
149-158.
8. Davis JD. The hemocytometer and its impact on progressive era medicine
(http://hdl.handle.net/2142/20809; erişim: 06.11.2020).
9. Marshall D. The Coulter principle: foundation of an industry. JALA 2003; 8:
72–81.
10. Longanbach S, Miers MK. Automated Blood Cell Analysis. In Keohane EM,
Smith LJ, Walenga JM. Editors. Rodak's Hematology: Clinical Principles and
Applications. St. Louis, Missouri. Elsevier Saunders. 5th ed. 2016
11. https://www.beckmancoulter.com/download/file/wsr32905/4237515BA?-
type=pdf. Erişim 31.08.2020
12. Sullivan E. Hematology analyzer: From workhorse to thoroughbred. Lab Med
2006; 37(5); 273-278.
13. https://www.sysmexeurope.com/fileadmin/media/f100/SEED/Sysmex_
SEED_The_Red_Blood_Cell_Indices.pdf erişim 31.08.2020
14. Lima-Oliveira G, Guidi GC, Salvagno GL, Danese E, Montagnana M, Lippi G.
41Patient posture for blood collection by venipuncture: recall for standardization
after 28 years. Rev Bras Hematol Hemoter 2017; 39(2): 127-132.
15. Keohane EM. Blood Specimen Collection. In Keohane EM, Smith LJ, Walen-
ga JM. Editors Rodak's Hematology: Clinical Principles and Applications. St.
Louis, Missouri. Elsevier Saunders, 5th ed. 2016
16. Neves PRDS, Tenorio TRDS, Lins TA, Muniz MTC, Pithon-Curi TC, Botero JP,
Do Prado WL. Acute effects of high-and low-intensity exercise bouts on leuko-
cyte counts. J Exerc Sci Fit 2015; 13(1): 24-28.
17. Banfi G, Germagnoli L. Preanalytical phase in haematology. JMB 2008; 27(3):
348-353.
18. Haus E. Editor. Chronobiology of circulating blood cells and platelets. In: Bi-
ologic rhythms in clinical and laboratory medicine. Springer, Berlin, Heidelberg.
1992; 504-526.
19. Budkowska M, Lebiecka A, Marcinowska Z, Woźniak J, Jastrzębska M,
Dołęgowska B. The circadian rhythm of selected parameters of the hemostasis
system in healthy people. Thromb Res 2019;182:79-88.
20. Van Duijnhoven H, Treskes M. Marked interference of hyperglycemia in
measurements of mean (red) cell volume by Technicon H analyzers. Clin Chem
1996; 42(1): 76-80.
21. Landt M, Wilhite TR, Smith CH. A new plastic evacuated tube with plasma
separator. J Clin Lab Anal 1995;9(2):101-6.
22. Hill BM, Laessig RH, Koch DD, Hassemer DJ. Comparison of plastic vs.
glass evacuated serum-separator (SSTTM) blood-drawing tubes for common
clinical chemistry determinations. Clin Chem 1992; 38(8): 1474-1478.
23. Bowen RA, Remaley AT. Interferences from blood collection tube compo-
nents on clinical chemistry assays. Biochem Med (Zagreb) 2014;24(1):31-44.
24. Flanders MM, Crist R, Rodgers GM. A comparison of blood collection in
glass versus plastic Vacutainers on results of esoteric coagulation assays. Lab
Med 2003; 34(10): 732-735.
25. Banfi G, Salvagno GL, Lippi G. The role of ethylenediamine tetraacetic acid
(EDTA) as in vitro anticoagulant for diagnostic purposes. Clin Chem Lab Med
2007; 45(5): 565-576.
26. CLSI P 39-A6 Guideline, Tubes and Additives for Venous and Capillary Blood
Specimen Collection, 6th Edition; Approved Standard. CLSI documentation G: 2010.
4227. International Council for Standardization in Haematology. Recommenda-
tions of International Council for Standardization in Haematology for Ethylenedi-
aminetetraacetic Acid Anticoagulation of Blood Cell Counting and Sizing. Am J
Clin Pathol 1993;100: 371-372.
28. Narang V, Kaur H, Selhi PK, Sood N, Singh A. Preanalytical errors in hema-
tology laboratory-an avoidable incompetence. Iran J Pathol 2016;11(2):151-4
29. De la Salle B. Pre-and postanalytical errors in haematology. Int J Lab Hema-
tol 2019;41 Suppl 1:170-176.
30. Abed R. Rate of hematology specimens rejection association with area of
collection and reason of rejection. Int J Biol Med Res 2013; 4(1): 2902–2904.
31. http://eclinpath.com/hematology/sample-collection-heme/erişim 31.08.2020.
32. Brunson D, Smith D, Bak A, Przyk E, Sheridan B, Muncer DL. Comparing
hematology anticoagulants: K2EDTA vs. K3EDTA. Lab Hematol 1995; 1: 112.
33. Nemec A, Drobnič–Košorok M, Butinar J. The effect of high anticoagulant
K3-EDTA concentration on complete blood count and white blood cell differen-
tial counts in healthy beagle dogs. Slov Vet Res 2005; 42 (3/4): 65-70.
34. CLSI H21 A5 Guideline, Collection, Transport, and Processing of Blood
Specimens for Testing Plasma-Based Coagulation Assays and Molecular He-
mostasis Assays; Approved Guideline-Fifth Edition, January 2008.
35. Turk Biyokimya Derneği Prenalitik Evre Calışma Grubu Venoz Kan Alma (Fle-
botomi) Kılavuzu, 2016. ISBN 978-605-87229-3-4.
36. Lippi G, Plebani M. EDTA-dependent pseudothrombocytopenia: further in-
sights and recommendations for prevention of a clinically threatening artifact.
Clin Chem Lab Med 2012; 50(8): 1281-1285.
37. European Federation of Clinical Chemistry and Laboratory Medicine (EFLM)
Working Group for Preanalytical Phase (WG-PRE) and Latin America Confeder-
ation of Clinical Biochemistry (COLABIOCLI) Latin American Working Group for
Preanalytical Phase (WG-PRE-LATAM). Joint EFLM-COLABIOCLI Recommen-
dation for venous blood sampling. Clin Chem Lab Med 2018; 56(12): 2015–2038.
38. Clinical Laboratory Standards Institute. Collection of Diagnostic Venous
Blood Specimens. 7th ed. CLSI standard GP41. Wayne, PA, USA, 2001.
39. Cornet E, Behier C, Troussard X. Guidance for storing blood samples in lab-
oratories performing complete blood count with differential. Int J Lab Hematol
2012;34(6):655-660.
43You can also read