Time-Resolved Monitoring of the Oxygen Transfer Rate of Chinese Hamster Ovary Cells Provides Insights Into Culture Behavior in Shake Flasks
←
→
Page content transcription
If your browser does not render page correctly, please read the page content below
ORIGINAL RESEARCH
                                                                                                                                        published: 25 August 2021
                                                                                                                                  doi: 10.3389/fbioe.2021.725498

                                           Time-Resolved Monitoring of the
                                           Oxygen Transfer Rate of Chinese
                                           Hamster Ovary Cells Provides Insights
                                           Into Culture Behavior in Shake Flasks
                                           Nina Ihling 1*, Lara Pauline Munkler 1, Christoph Berg 1, Britta Reichenbächer 2,
                                           Johannes Wirth 2, Dietmar Lang 2, Roland Wagner 2 and Jochen Büchs 1
                                           1
                                               AVT—Biochemical Engineering, RWTH Aachen University, Aachen, Germany, 2Rentschler Biopharma SE, Laupheim, Germany

                                           Cultivations of mammalian cells are routinely conducted in shake flasks. In contrast to
                                           instrumented bioreactors, reliable options for non-invasive, time-resolved monitoring of the
                                           culture status in shake flasks are lacking. The Respiration Activity Monitoring Respiration
                                           Activity Monitoring System system was used to determine the oxygen transfer rate (OTR) in
                                           shake flasks. It was proven that the OTR could be regarded as equal to the oxygen uptake
                            Edited by:
                                           rate as the change of the dissolved oxygen concentration in the liquid phase over time was
                       Frank Delvigne,     negligibly small. Thus, monitoring the oxygen transfer rate (OTR) was used to increase the
          University of Liège, Belgium
                                           information content from shake flask experiments. The OTR of a Chinese hamster ovary
                      Reviewed by:
                                           cell line was monitored by applying electrochemical sensors. Glass flasks stoppered with
           Octavio Tonatiuh Ramirez,
  National Autonomous University of        cotton plugs and polycarbonate flasks stoppered with vent-caps were compared in terms
                     Mexico, Mexico        of mass transfer characteristics and culture behavior. Similar mass transfer resistances
                  Alberto Rodríguez,
 Margarita Salas Center for Biological
                                           were determined for both sterile closures. The OTR was found to be well reproducible
             Research (CSIC), Spain        within one experiment (standard deviation
Ihling et al.                                                                                                      Time-Resolved Monitoring of CHO Cells

compared to highly instrumentalized bioreactors (Betts and                      summarized in a comprehensive review, underlining the
Baganz, 2006; Bareither and Pollard, 2011). For                                 impact of OUR as a key parameter for bioprocess monitoring
characterization on a single-cell level, microfluidic culture                    and development (Martinez-Monge et al., 2019).
devices are recently applied for mammalian cells (Schmitz                           In contrast to conventional sampling, OUR measurements can
et al., 2021). Microtiter plates can be used for cultivation at an              be performed with high-frequency and enable real-time
early stage of process development (Girard et al., 2001;                        adjustments of the process. Thus, OUR measurement was
Deshpande and Heinzle, 2004). However, the lower the culture                    shown to be suited for cell line characterization (Ramirez and
volume, the greater the relative evaporation rate. Substantial                  Mutharasan, 1990; Deshpande and Heinzle, 2004; Huang et al.,
evaporation is a significant drawback of very small cultivations                 2010; Seidel et al., 2021), the design of nutrient feeding strategies
systems, particularly during long-term cultivations necessary for               (Kyung et al., 1994; Eyer et al., 1995; Zhou et al., 1997; Goldrick
bioprocess development studies (Betts and Baganz, 2006). In                     et al., 2018) and estimation of the viable cell concentration (VCC)
                            ®
addition to TubeSpin bioreactors with a volume of 50 ml
(Girard et al., 2001; De Jesus et al., 2004; Villiger-Oberbek
                                                                                (Fleischaker and Sinskey, 1981; Yamada et al., 1990; Zhou et al.,
                                                                                1995; Kamen et al., 1996; Higareda et al., 1997; Galvez et al.,
et al., 2015; Gomez et al., 2017) and the Ambr15 system with  ®
a volume of 10–15 ml (Rameez et al., 2014), shake flasks are very
                                                                                2012). In combination with VCC measurement, the OUR can be
                                                                                used to calculate cell-specific oxygen uptake rates (qO2), which is
often utilized for research issues and early-stage development                  a crucial parameter of every cell line (Ruffieux et al., 1998).
studies in animal cell culture-based protein, virus, and viral vector               A fundamental difference between measurement of the OUR
production. They enable using appropriate scalable volumes that                 and the dissolved oxygen tension (DOT) lies in the type of
allow to take several samples of higher volumes for different                   information provided by OUR and DOT, respectively. While
quality analyses. Further, they are much cheaper and flexible                    the DOT reflects the present concentration of oxygen, the OUR
compared to spinner flasks. The latter also have limitations in                  contains time-dependent information. Since the DOT’s absolute
oxygen supply and mixing, which is particularly disadvantageous                 change is dependent on the process conditions, determined DOT
for oxygen-demanding insect cells (Annathur et al., 2003).                      values are not comparable when culture conditions (e.g., filling
    As the space for sensor integration in and around the culture               volume or shaking frequency) are changed. On the other hand,
devices is usually limited, it is crucial to identify the parameter             OUR values can be compared directly between different culture
with the highest relevance and information content for a desired                conditions, including different cultivation devices and scales. In
application. The identified parameter should preferably be                       addition, as introduced above, relations between OUR and other
acquired non-invasively to avoid culture contamination and                      metabolic parameters (VCC etc.) are well established, enabling to
interference with the cultivation process.                                      derive these parameters from measured OUR data directly.
    For some years, especially measurement of dissolved oxygen                      The Respiration Activity Monitoring System (RAMOS) has
and pH, more recently also dissolved CO2, has been realized in                  been reliably established for microbial research to determine the
several small-scale cultivation systems for different mammalian                 OTR in shake flasks. RAMOS utilizes electrochemical oxygen
cell lines (Betts and Baganz, 2006; Hanson et al., 2007; Naciri                 sensors to measure the oxygen partial pressure in the headspace
et al., 2008; Vallejos et al., 2012; Ude et al., 2014; Chatterjee et al.,       of shake flasks (Anderlei and Büchs, 2001; Anderlei et al., 2004).
2015). These techniques give time-resolved information on the                   RAMOS is commonly used to monitor eight flasks in parallel, but
culture status with a higher resolution than manual sampling. For               parallelization is only limited by the number of shake flasks
pH and dissolved oxygen measurement, optodes, which are                         integrated into the incubator. Besides monitoring of rather
oxygen or pH-sensitive fluorescent metal complexes                               “strongly metabolizing” bacteria and yeast cells, the
immobilized at the bottom of the flask or a microtiter plate,                    applicability of RAMOS has also been demonstrated for cells
were used (Kostov et al., 2001; Tolosa et al., 2002; Vallejos et al.,           with a low breathing activity such as a hybridoma cell line
2012). Here, the cells get in direct contact with parts of the                  (Anderlei et al., 2004) and the microalgae Chlorella vulgaris
measurement device, i.e., the optode. In addition, the                          (Keil et al., 2019). Moreover, HEK293 cells have recently been
measurement might be carried out in a sampling loop                             cultured in single-use shake flasks with simultaneous monitoring
(Chatterjee et al., 2015). However, this complicates the                        of the OTR and the carbon dioxide transfer rate (CTR) (Anderlei
experimental setup, which is not desirable for routine                          et al., 2020). Last, monitoring of the respiration activity was
application. Moreover, the pH is usually kept in a narrow                       combined with pH measurement by applying a pH optode to
range during cultivation by adjusting with carbon dioxide or                    further increase process insights (Scheidle et al., 2007). When it
synthetic buffers (Li et al., 2010), resulting in limited information           comes to scalability, it has been demonstrated that results
content from this parameter.                                                    obtained from microbial RAMOS shake flask experiments in
    When it comes to monitoring options, measurement of the                     batch mode are transferable to microtiter plates as well as stirred
oxygen uptake rate (OUR) is particularly suited to determine the                tank reactors, if the operating conditions are adjusted properly
culture status of mammalian cells. The OUR is a universal                       (Wewetzer et al., 2015). In addition, also results from microbial
indicator for metabolic activity and culture behavior, as it is                 fed-batch shake flask experiments were demonstrated to be
linked to the physiological state of aerobic cells (Lecina et al.,              transferable to larger scales (Müller et al., 2019). Furthermore,
2006; Ratledge and Kristiansen, 2008; Doran, 2013). Advances in                 the scalability of CHO cultures from small orbitally shaken
the application of OUR measurement for bioprocess                               culture vessels to the 1,000 L scale has also been demonstrated
development of mammalian cells have recently been                               (X. Zhang et al., 2010).

Frontiers in Bioengineering and Biotechnology | www.frontiersin.org         2                                     August 2021 | Volume 9 | Article 725498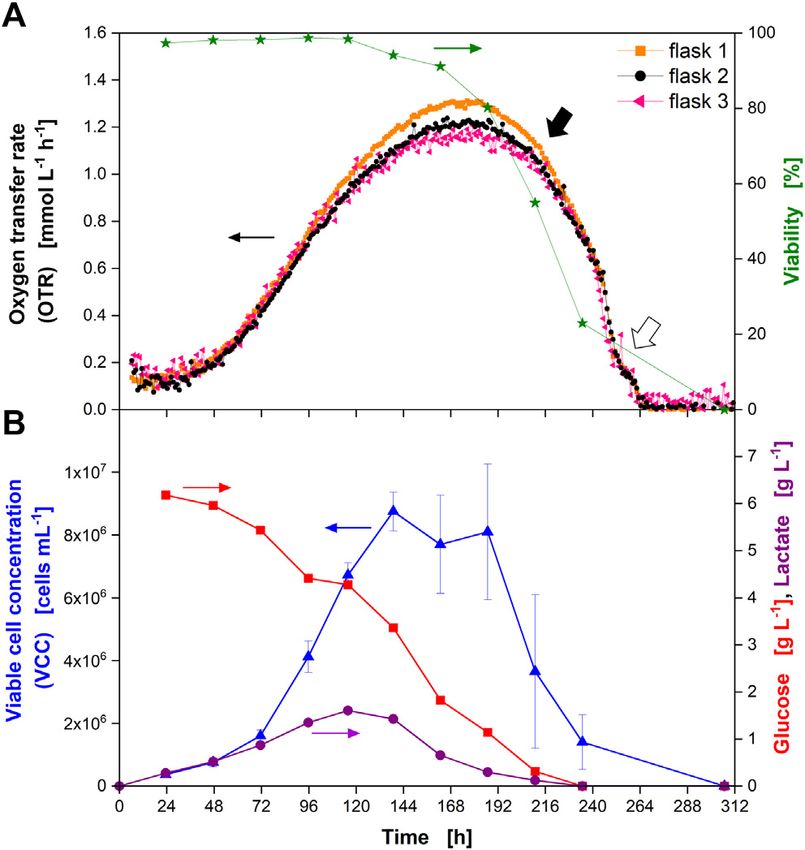
Ihling et al.                                                                                                Time-Resolved Monitoring of CHO Cells

    The oxygen mass transfer is influenced by two resistances in            established in shake flasks and other small-scale systems.
shake flasks: the sterile closure and the gas-liquid interface. Mass        Consequently, our study demonstrates time-resolved,
transfer between the gas and liquid phase is usually considered            parallelized, non-invasive monitoring of the OUR in shake
rate-limiting during cultivation (Truesdale et al., 1955). However,        flasks for the first time applied to an industrially relevant
depending on the properties of the used sterile closure, the closure       CHO cell line. The usefulness of the technology is further
can also affect the total oxygen mass transfer (Mrotzek et al.,            investigated by comparing two different culture media and
2001).                                                                     utilizing glass as well as single-use polycarbonate flasks.
    The mass transfer resistance between the gas and liquid phase
is described by the volumetric oxygen transfer coefficient (kLa).
Erlenmeyer flasks made from glass have been extensively                     MATERIALS AND METHODS
investigated in terms of gas-liquid mass transfer (Azizan and
Büchs, 2017; U.; Maier and Büchs, 2001; Ulrike; Maier et al., 2004;        Evaporation Measurement
H.; Zhang et al., 2005). For single-use shake flasks made from              Evaporation from 250-ml Erlenmeyer glass flasks stoppered with
polycarbonate, which are typically used in mammalian cell                                                             ®
                                                                           cotton plugs (culture plug Rotilabo ) and from 250-ml
                                                                           polycarbonate flasks closed with a vent-cap (Corning
culture experiments, gas-liquid mass transfer was also
described by kLa determination (Schiefelbein et al., 2013). For            CLS431144 purchased from Sigma Aldrich) was determined
                                                                                                                                                 ®
250-ml shake flasks using 80 ml working volume, a chemically                gravimetrically. Flasks (n  5 each) were filled with 50 ml
defined culture medium and 150 rpm shaking speed, kLa values                deionized water and run under cultivation conditions at a
between 8 and 15 h−1 are reported (Tsai et al., 2012). For 140 rpm         temperature of 36.5°C, 140 rpm shaking speed, 70% relative
and 250 ml flask volume, a kLa of 25 h−1 is reached with 50 ml              humidity, 5% CO2 at a shaking diameter of 50 mm in an
filling volume (Schiefelbein et al., 2013). The kLa values for glass        incubator (ISF1-X, Kühner AG, Switzerland). Subsequently,
and polycarbonate flasks were found to be in the same order of              the water evaporation rate was calculated from the decrease in
magnitude. However, a negative impact of hydrophobic flask                  weight over time.
material was also reported in the literature (U. Maier and Büchs,
2001). Generally, caution needs to be paid when comparing kLa              Producer Cell Line
values, as the methods for its determination tend to vary quite            A Chinese hamster ovary (CHO) cell line producing an IgG
strongly (Seidel et al., 2021).                                            monoclonal antibody was used for the experiments. The cell line
    Shake flasks are typically equipped with a sterile closure to           is Rentschler Biopharma’s proprietary mammalian cell line which
keep the interior sterile. However, this sterile closure acts as an        is a pre-tagged CHO K1 master cell line for directed integration of
additional resistance for oxygen mass transfer. Consequently, the          the gene of interest by recombinase mediated cassette exchange
closure also needs to be characterized in terms of mass transfer.          (RMCE) (Rehberger et al., 2013).
For the characterization of mass transfer attributes of sterile
closures, a model was previously developed (Henzler and                    Adaptation of the RAMOS Device
Schedel, 1991). The model considers convective and diffusive               A blueprint of the RAMOS device as described by Anderlei et al.
gas transfer contributions. Mrotzek et al. (2001) combined the             was adapted for cultivation of CHO cells (Anderlei and Büchs,
model with measuring the water evaporation rate to determine               2001; Anderlei et al., 2004). Commercial versions of the RAMOS
the mass transfer characteristics for carbon dioxide (CO2) and             device are available from HiTec Zang GmbH (Herzogenrath,
oxygen for different sterile closures. For 250-ml Erlenmeyer flasks         Germany) and Kühner AG (Birsfelden, Switzerland). Calculated
stoppered with cotton plugs, the sterile closure’s mass transfer           OTR values deviating more than 15% (medium 1) or 30%
resistance was much smaller than the gas-liquid mass transfer              (medium 2) from the previous and subsequent calculated OTR
resistance (Mrotzek et al., 2001; Anderlei et al., 2007).                  values were considered outliers and not further regarded.
Consequently, gas-liquid mass transfer limits the total oxygen             Deviations are caused, if the incubator hood is opened just
supply of cultures in shake flasks. Even though polycarbonate               before or during the measurement phase, as this affects the
shake flasks with a vent-cap are routinely applied to cultivate             temperature inside the incubator. Additionally, as the sensor is
mammalian cells, the mass transfer resistance of the vent-cap has          mounted right on top of the flask (see Figure 1), the cable
not been investigated in detail up to now, to the best of the              connecting the sensor to the measurement unit is subjected to
author’s knowledge.                                                        mechanical stress, which might also cause misreadings.
    Accurate and time-resolved knowledge of the OUR and the                Additional details on the adaptation of the device are given in
corresponding derived cellular and metabolic information of                Principle and Adaptation of the RAMOS Device.
CHO cells in parallel shake flasks would represent an
important advantage to existing technology, as no fully                    Cultivation Conditions
instrumented and controlled bioreactors would be needed for                All cultivations were carried out in 250-ml flasks with 50 ml filling
data acquisition. Thus, information about the OUR in small-scale           volume, being shaken on an orbital shaker with a 50 mm shaking
experiments would enable an easier, more economically and                  diameter. The shaking frequency was set to 140 rpm and the
parallelized option to gain valuable insights on the culture               temperature to 36.5°C. Flasks for passaging and manual sampling
status. A non-invasive and simple experimental setup would                 with subsequent offline analysis were cultured in an incubator
also represent an important extension to technology already                (ISF1-X, Kühner AG, Switzerland) at a controlled relative

Frontiers in Bioengineering and Biotechnology | www.frontiersin.org    3                                    August 2021 | Volume 9 | Article 725498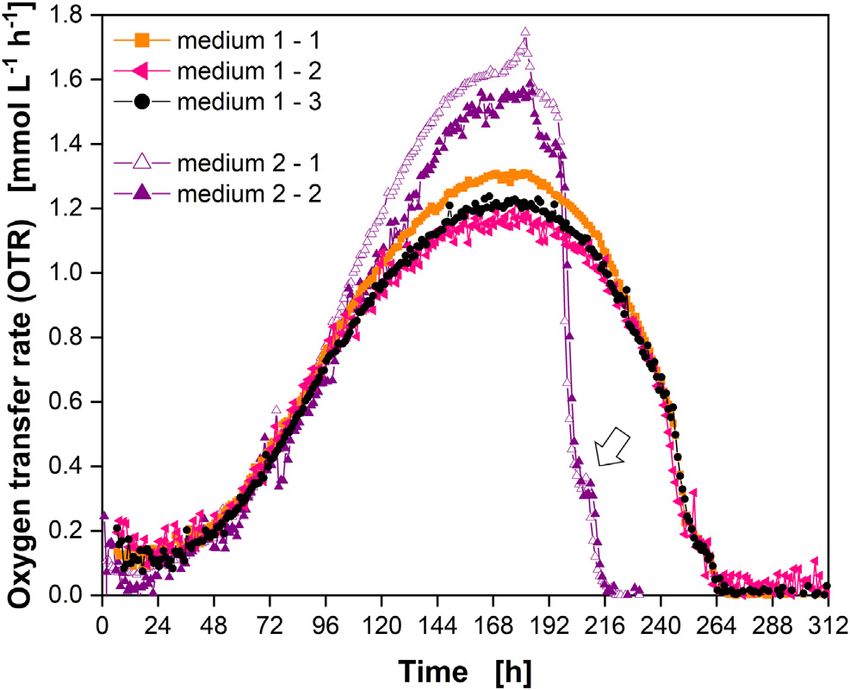
Ihling et al.                                                                                                                        Time-Resolved Monitoring of CHO Cells

  FIGURE 1 | Flasks used for online monitoring of the oxygen transfer rate in this study and schematic change of oxygen partial pressure during cultivation. (A)
  Schematic representation of the gas flow (arrows) and modification of the glass flasks for active aeration and measurement of the OTR (top). The sensor is separated
  from the headspace of the flask by a gas permeable membrane (red area). Exemplary picture of the modified glass flasks (bottom). (B) Schematic representation of the
  gas flow (arrows) and polycarbonate flasks with mounted adapter (grey) (top). The oxygen sensor is separated from the headspace of the flask by the membrane in
  the vent-cap (red area). The gap in the adapter is needed for gassing. Gas volume between sensor and membrane is approximately 3 ml. Exemplary pictures of flasks
  with mounted adapter placed on top (bottom). (C) Simplified schematic change of the oxygen partial pressure (pO2) during cultivation of bacterial cells (upper diagram)
  and mammalian cells (lower diagram) in the RAMOS device. I: gas flow phase (inlet and outlet valves open). II: measurement phase (inlet and outlet valves closed). High-
  flow phase after measurement phase and cut-off-phase (first part of measurement phase with variable length) are depicted here and explained later in the manuscript.
  Equation in the middle shows calculation of the oxygen transfer rate (OTR) (mol L−1 h−1) from the change of oxygen partial pressure over time (ΔpO         −1
                                                                                                                                                  dt ) (bar h ), gas volume
                                                                                                                                                     2

  of the flask VG [L], liquid volume of the flask VL [L], universal gas constant R (bar L mol−1 K−1), and temperature T [K].

humidity of 70% and a controlled CO2 concentration of 5%,                                 freezing container (Thermo Fisher Scientific, United States)
respectively. Flasks for time-resolved monitoring of the OTR                              according to manufacturer’s protocol.
were operated in parallel in an incubator (ISF1-X, Kühner AG,
Switzerland) under the same conditions but without CO2 and                                Cell Passaging
humidity control. Instead, these flasks were directly gassed with a                        Before cultivation, one vial stored in liquid nitrogen was rapidly
gas mixture of 5% CO2 in synthetic air (19.5% O2) from a gas                              thawed, and cells resuspended in 9 ml pre-heated culture
bottle (Figure 1A). Cultivations were either carried out in                               medium. Subsequently, the cells were centrifuged for 10 min at
PowerCHOTM two serum-free chemically defined culture                                       150 × g and at room temperature in a Heraeus Multifuge X3R
medium, containing HEPES buffer and Pluronic F68 (Lonza          ®                        centrifuge (Thermo Fisher Scientific, United States). The
AG, Switzerland) (“medium 1”) or in EX-CELL Advanced
CHO Fed-batch Medium (Sigma-Aldrich, United States)
                                                                 ®               ™        remaining cell pellet was resuspended in 10 ml pre-heated
                                                                                          medium for cultivation of the first cell passage. After 72 h,
(“medium 2”). Both culture media were supplemented with                                   40 ml of fresh medium were added to the flask. The cell culture
6 mM L-glutamine from a 200 mM stock solution (Gibco Life                                 was split every three to 4 days. The seed cell concentration was set to
Sciences, Thermo Fisher Scientific, United States) before                                  0.2·106 cells mL−1 (3-days split) or 0.1 · 106 cells mL−1 (4-days split)
cultivation. Directly before use, culture media and
supplements were pre-heated to 36.5°C for about 30 min in a
                                                                                          in a cultivation volume of 50 ml. For all steps, 250 ml Corning
                                                                                          polycarbonate Erlenmeyer flasks with vent-cap (Sigma-Aldrich,
                                                                                                                                                                              ®
water bath (VWB2 12, VWR, USA).                                                           United States) were used.

Working Cell Bank and Cryopreservation                                                    Main Culture Experiments
A working cell bank (WCB) with vials containing a viable cell                             An overview of the experiments presented in this study is
concentration (VCC) of 1.2·107 cells mL−1 was stored in the vapor                         depicted in Supplementary Table S1.
phase of liquid nitrogen. For that, cells were resuspended in a                              After a number of passages, as shown in Supplementary Table
mixture of spent culture medium (45% v/v), fresh culture                                  S1, the main culture was started at a seed cell concentration of
medium (45% v/v and dimethylsulfoxide (DMSO) (10% v/v)                                    0.2·106 cells mL−1. PenStrep (stock with 10,000 Units mL−1
(Sigma-Aldrich, United States). 1 ml of the cell suspension was                           penicillin and 10 g L−1 streptomycin, Sigma-Aldrich,
frozen at −80°C in 2 ml cryogenic vials for 24 h with a controlled                        United States) or kanamycin (stock with 30 g L−1, Carl Roth,
cooling rate of −1°C min−1 using the Nalgene Mr. FrostyTM                                 Germany) was added to the culture, resulting in a concentration

Frontiers in Bioengineering and Biotechnology | www.frontiersin.org                   4                                             August 2021 | Volume 9 | Article 725498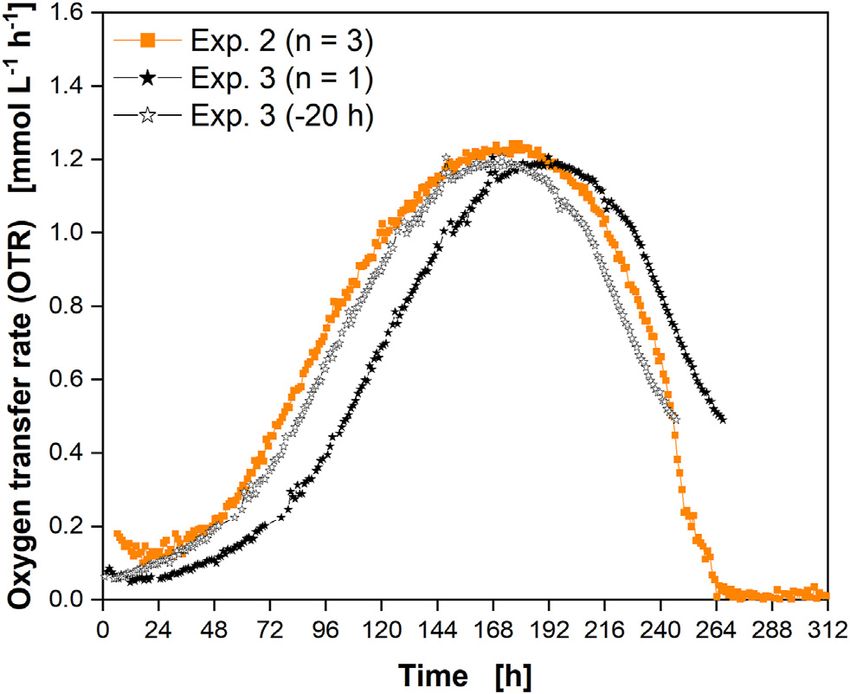
Ihling et al.                                                                                                Time-Resolved Monitoring of CHO Cells

of 1% or 30 mg L−1, respectively, for the final culture medium.             GmbH, Germany). A three-point calibration with distilled water
Cultivation was carried out in 250-ml Corning polycarbonate
flasks with vent-cap (“single-use polycarbonate”) (Sigma-
                                                            ®              and standard solutions with a given osmolality (100 and
                                                                           500 mOsm kg−1, respectively), was carried out before
Aldrich, United States) or 250 ml Erlenmeyer glass flasks                   measurement.
(Duran, Schott AG, Germany).

Sampling                                                                   RESULTS AND DISCUSSION
At each sampling point, 1.5 ml of culture broth were manually
sampled under sterile conditions from the “offline” flasks. As               Principle and Adaptation of the RAMOS
offline flasks, either glass flasks stoppered with a cotton plug or           Device
polycarbonate flasks with vent-cap (see above) were used. After             For measurement of the OTR, electrochemical sensors were used
sampling, the flasks were shaken up to the next sampling point              (Anderlei and Büchs, 2001). To demonstrate and enable the
and until the end of the cultivation. Viable and total cell                broad application of monitoring the breathing activity of CHO
concentration, pH value, and osmolality were determined                    cells, glass as well as single-use polycarbonate flasks were
directly after sampling, as stated below. For further analysis,            considered in this study. Differences between both flask types
the supernatant was stored at −20°C until used.                            are given in Supplementary Table S2. For glass flasks, specialized
                                                                           flasks with customized inlet and outlet connectors were used and
Determination of Offline Parameters                                         the sensor was mounted using a screwable holder that contained a
Viable and Total Cell Concentration                                        gas-permeable membrane (Figure 1A). The sensor was placed
Viable and total cell concentrations were determined by manual             behind the gas-permeable membrane to keep the interior of the
cell counting with a hemocytometer (Counting chamber C-Chip                flask sterile. In contrast to glass flasks, polycarbonate (“single-
Neubauer improved, Carl Roth, Germany) using the trypan blue               use”) flasks were not intended for multiple use. Further, as the
staining method (Sigma-Aldrich, United States) according to the            flasks were delivered in sterilized format, a modification of the
manufacturer’s protocol.                                                   flasks with a screwable holder and connectors was impractical.
    During each sampling 1.5 ml culture broth was harvested by             Consequently, the electrochemical sensor was placed above the
centrifugation in a table centrifuge (mini centrifuge Rotilabo, Carl       vent-cap using commercially available adapters (Kühner AG,
Roth, Germany) for 3 min at a rotation rate of 6,000 rpm at room           Switzerland) (Figure 1B).
temperature. The supernatant was stored at −20°C until use for                 The electrochemical sensors changed their voltage depending
subsequent analysis. The final samples taken from the flasks at the          on the oxygen partial pressure (Figure 1C). The flask was aerated
end of the cultivation were centrifuged for 15 min at 22°C and at          with a constant volumetric flow during the gas flow phase
225 × g (Heraeus Multifuge X3R, Thermo Fisher Scientific,                   (Figure 1C, phase I). During the measurement phase
United States).                                                            (Figure 1C, phase II), the inlet and outlet valves of the
                                                                           measurement flask were closed. As the cells continued to
pH Value                                                                   consume oxygen while the valves were closed, the partial
The pH value was determined at room temperature with an InLab              pressure in the headspace decreased over time (Anderlei and
Easy pH electrode (Mettler Toledo, Germany) using a CyberScan              Büchs, 2001). This decrease was used to calculate the OTR
pH 510 m (Eutech Instruments, Thermo Scientific, Germany).                  (Figure 1C, equation). For rather high-breathing bacterial
Appropriate buffers at pH four and pH seven were used for a two-           cultures, the decrease in partial pressure over time was
point calibration. It should be noted that the measurement of the          comparably strong (0.5 mbar min−1 at an OTR of about
pH under ambient air conditions will result in higher pH values            25 mmol L−1 h−1 and 10 ml filling volume) (Figure 1C, black
than under physiological conditions as CO2 quickly gasses out,             curve). Consequently, the measurement time in E. coli
resulting in a rise in pH.                                                 cultivations, for example, is set to 5 min. The duration of the
                                                                           measurement and gas flow phase can easily be adjusted to the
Glucose and Lactate                                                        expected respiration activity of the cells, which offers flexibility
The concentrations of glucose and lactate were determined by               for monitoring and enables adjustment of the signal quality. For
HPLC using a Dionex Ultimate 3,000 system (Thermo Scientific,               low-breathing mammalian cell cultures (0.1 mbar min−1 at an
United States). An organic acid resin column (Rezex ROA-                   OTR of about 1 mmol L−1 h−1 and 50 ml filling volume), the
Organic Acid H+ (8%), 300 × 7.8 mm, Phenomenex Inc.,                       measurement phase must be extended to reach an acceptable
United States) was used for separation at a temperature of                 resolution (Figure 1C, purple curve) as reported for the
40°C and a flow rate of 0.8 ml min−1. As mobile phase, 5 mM                 cultivation of HEK293 cells, where a measuring time of
H2SO4 was used. Separation was performed in isocratic mode. A              20–30 min was recommended (Anderlei et al., 2020). A
refractive index detector (RefractoMax 520, Shodex, Germany)               comparably short (1–2 min) “high-flow” phase (not shown)
was used for detection.                                                    followed the measurement phase to quickly increase the partial
                                                                           pressure of oxygen inside the flask up to its level before the
Osmolality                                                                 measurement phase. The high-flow phase ensured that repeated
The osmolality of the supernatant was determined using a                   measurement phases did not result in a progressing decrease of
freezing point osmometer (Gonotec Osmomat 3,000, Gonotec                   the partial pressure of oxygen inside the shake flask. The high-

Frontiers in Bioengineering and Biotechnology | www.frontiersin.org    5                                    August 2021 | Volume 9 | Article 725498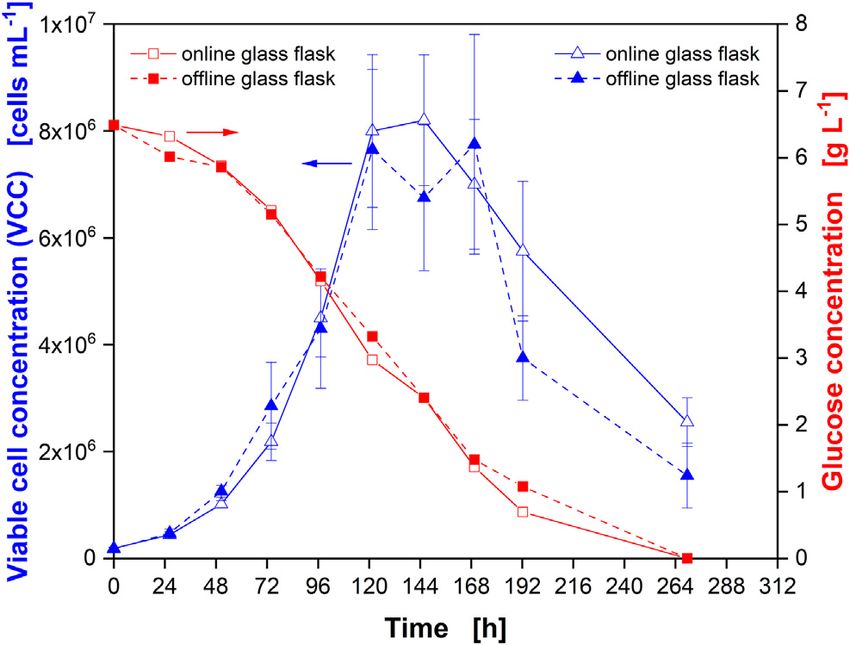
Ihling et al.                                                                                                     Time-Resolved Monitoring of CHO Cells

flow phase was followed by a gas flow phase (phase II) that was               study and values determined previously could be related to
usually twice as long as the measurement phase.                             differences in material, density, and fabrication of the plugs
    As a result of the different breathing activities, OTR                  and, thus, appear reasonable. For the vent-cap of the single-
determination by RAMOS might be carried out with a                          use polycarbonate flask, kst,O2 was determined to
frequency of four measurement points per hour for microbial                 1.17·10−5 mol s−1. This value aligns well with the wide- and
cultivations. For a typical bacterial batch cultivation that lasts          narrow-necked flasks stoppered with cotton plugs described by
24 h, the number of data points would be 96 (one measurement                Mrotzek et al. (2001). Additionally, Schiefelbein et al. (2013)
value every 15 min). To achieve a comparable number of data                 compared kLa values in 500 ml disposable shake flasks and found
points in relation to the overall cultivation time of a mammalian           no difference with and without the cap even though high kLa
cell culture in batch mode that lasts 4–7 days, one measurement             values (∼290 h−1) were reached. This observation underlined that
point is required every 60–120 min. Here, the gas flow phase was             the cap of the single-use flask did not impair the total gas transfer
set to 40 min, and the measurement phase was set to 20 min, to              even at high gas-liquid mass transfer rates. Also, the permeability
record one measurement point every 60 min. Compared to a                    of filter caps for 50 ml centrifugation tubes (TubeSpin reactors,  ®
continuous “on-line” OTR acquisition, measurement in an                     Techno Plastic Products, Trasadingen, Switzerland) was
interval of every 60 min is not continuous and therefore                    determined (Jordan et al., 2005). These filter tubes had five
referred to as “time-resolved”.                                             vent holes of different sizes integrated in the cap. One or
                                                                            more holes could be left open during cultivation to adjust the
                                                                            gas exchange rates. The filter tubes supported cell growth at a
Differences in Gas Delivery and Mass                                        filling volume of 30 ml with a volume loss by evaporation of 0.5 g
Transfer Resistance of the Sterile Closure                                  in 5 days (Jordan et al., 2005). Water evaporation from the
Glass flasks in the RAMOS device were actively gassed                        polycarbonate flasks closed with a vent-cap was 0.017 g h−1,
(Figure 1A). The gassing rate chosen needed to correspond to                which is about 2 g in 5 days. This evaporation rate is
the mass transfer resistance of the sterile closure (Klöckner et al.,       comparable with filter tubes when all ventilation holes were
2013). Choosing an appropriate gassing rate ensured that the gas            open and four times larger than needed for a filling volume of
headspace concentrations were comparable for “online” and                   30 ml (Jordan et al., 2005). In addition, the gas exchange
“offline” flasks, which is a prerequisite for validly comparing               associated with a loss of water of 2 ml (≈2 g) in 5 days was
them with data from manual sampling. A gassing rate of                      described to be exceeding the need for mammalian cells
10 ml min−1 was previously determined to result in                          (Jordan et al., 2005).
comparable gas headspace concentrations between actively                        Conclusively, no significant oxygen mass transfer limitation by
aerated glass flasks in the RAMOS device and glass flasks                     either sterile closure was expected, and ventilation was assumed
stoppered with a cotton plug (Klöckner et al., 2013). However,              to be comparable in glass and polycarbonate flasks under the
the mass transfer characteristics, represented by the mass transfer         experimental conditions applied in this study. As gas-liquid mass
resistance for oxygen (kst,O2), of the exact cotton plugs used in           transfer was also demonstrated to be in the same order of
this study were not previously determined.                                  magnitude (Schiefelbein et al., 2013), the maximum OTR
   The adapters placed on top of the single-use flasks allowed a             (OTRmax) achievable was expected to be similar between glass
defined gas flow above the vent-cap (Figure 1B, arrows). For this             and polycarbonate flasks. Quantitative values for OTRmax under
purpose, the upper part of the adapter had a gap between the                the applied process conditions were calculated considering the
sensor and the membrane (Figure 1B). Compared to the                        mass transfer resistance between the gas-liquid interface and the
modified glass flasks of the conventional RAMOS system                        sterile closure (Eq. 1) (Amoabediny and Büchs, 2007; Sieben
(Figure 1A), the type of aeration had to be considered when                 et al., 2016). The OTRmax represents the maximal OTR that is
mass transfer phenomena in the two flask types were described.               theoretically achievable for a given set of cultivation conditions.
Further, the mass transfer resistance of vent-caps was not                  Consequently, the driving concentration gradient between the
quantitatively described previously. Since the sterile closures             oxygen concentration in the liquid (yO2, liquid) and the molar
(cotton plug and vent-cap) differed significantly in material                fraction of oxygen in the gas phase (yO2, outside) was assumed to be
and design, kst,O2 of the polycarbonate flasks with vent-caps                at the maximum. As a result, yO2,liquid was assumed to be zero.
was investigated.
   The mass transfer characteristics of both sterile closures were                             kL a · pabs · LO2 · y O2,outside − y O2,liquid
                                                                                      OTR                                    ·LO2 ·VL
                                                                                                                                                    (1)
determined as described in Supplementary Data Determination of                                               1 + kL a·pkabsst,O2
Mass Transfer Characteristics for Glass and Single-Use
Polycarbonate Flasks (see also Supplementary Figure S1 and                     A value of 7.11 mmol L−1 h−1 was obtained for glass flasks
Supplementary Table S3). For the cotton plug, a value for kst,O2            closed with a cotton plug. For the single-use flask closed with a
of 0.81·10−5 mol s−1 was determined. This value was slightly lower          vent-cap an OTRmax of 7.26 mmol L−1 h−1 was calculated.
than the values published previously. For 500-ml narrow-necked              Additional values used for this calculation are listed in
flasks, values for kst,O2 of 0.9–1·10−5 mol s−1 were determined for          Supplementary Table S3. In both cases, the mass transfer
individually wrapped cotton plugs, depending on size and bulk               resistance of the sterile closure (denominator) was much
density (Mrotzek et al., 2001; Anderlei et al., 2007). Differences          smaller than the resistance of the gas-liquid interface
between the cotton plugs (made from cellucotton) used in this               (numerator).

Frontiers in Bioengineering and Biotechnology | www.frontiersin.org     6                                        August 2021 | Volume 9 | Article 725498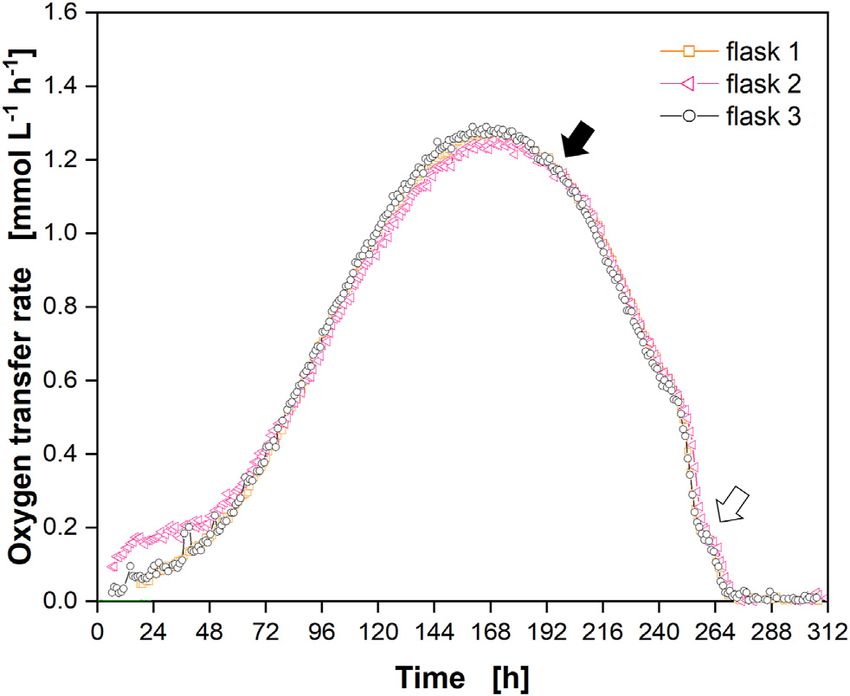
Ihling et al.                                                                                                                      Time-Resolved Monitoring of CHO Cells

                                                                                      counts between online and offline flasks. However, the
                                                                                      measured glucose concentrations still aligned well.

                                                                                      Cultivation of CHO Cells in Glass Flasks
                                                                                      CHO cells were cultivated in triplicate in the adapted RAMOS
                                                                                      device using glass flasks. The course of the OTR over the
                                                                                      cultivation time for each flask is depicted in Figure 3A. Prior
                                                                                      to discussing the data, it first had to be proven that the OTR
                                                                                      values determined reflected the OUR of the culture. This is a key
                                                                                      prerequisite to utilizing OTR measurement in shake flasks to
                                                                                      draw conclusions on culture behavior. As the inlet gas
                                                                                      composition and the shaking frequency were kept constant
                                                                                      during the experiments, but the OTR changed (see
                                                                                      Figure 3A), the dissolved oxygen concentration in the liquid
                                                                                      (dcdtO2 ) over time also changed. Only if dcdtO2 is negligibly small in
                                                                                      comparison to the OTR and OUR, the assumption that the OTR
                                                                                      is very close to the OUR is justified (Eq. 2).
  FIGURE 2 | Comparison of Chinese hamster ovary (CHO) cultures in
                                                                                               dcO2 mmol           mmol         mmol
  monitored (online) and non-monitored (offline) glass flasks. Viable cell                                  OTR       − OUR                                                (2)
  concentration (VCC) in online (open blue triangles) and offline (closed blue                   dt   L·h           L·h          L·h
  triangles) glass flasks as well as glucose concentration in online (open
  red squares) and offline (closed red squares) flasks. Glass flasks were actively         To prove that dcdtO2 was indeed negligibly small relative to OTR
  gassed with 5% CO2 in synthetic air at a rate of 6.25 ml min−1 (online) and         and OUR, the point with the highest change in the OTR was
  passively ventilated by a cotton plug in an incubator environment with 5% CO2
  in air at 70% RH (offline). Data from experiment 1 (Supplementary Table S1).

   With the lower mass transfer resistance determined for the
cotton plugs in this study compared to previously used plugs, a
gassing rate of 9 ml min−1 (instead of 10 ml min−1) was needed
for active gassing of online flasks in the RAMOS device. Active
gassing from a gas bottle with 5% CO2 in synthetic air resulted in
an oxygen fraction of 0.195. On the other side, flasks for manual
sampling were closed with a cotton plug and passively ventilated
in a humidified environment. This resulted in an oxygen fraction
of about 0.191. Thus, to achieve comparable headspace
concentrations, the gassing rate of the actively aerated flask
had to be lowered further. A gassing rate of 6.25 ml min−1 was
chosen. In contrast to online monitored glass flasks, the online
monitored polycarbonate flasks were not actively gassed
(Figure 1B). Consequently, the ventilation rate had to be high
enough to ensure a constant gas composition in the adapter.
Thus, for single-use polycarbonate flasks, the same aeration rate
(6.25 ml min−1) as for glass flasks was chosen, further enabling
the cultivation of glass and polycarbonate flasks in parallel.
   To confirm the comparability of the cultivation conditions
in actively aerated “online” and passively ventilated “offline”
glass flasks, cultivation with CHO cells was simultaneously
performed (Figure 2) in both flasks. Samples were directly
taken from one online and one offline flask. Similar cell                                FIGURE 3 | Cultivation of Chinese hamster ovary (CHO) cells in glass
numbers (Figure 2, blue triangles) and glucose                                         shake flasks with time-resolved monitoring of the oxygen transfer rate (OTR)
                                                                                       and manual (“offline”) sampling for determination of culture parameters. (A)
consumption (Figure 2, red squares) were observed. During
                                                                                       OTR in triplicate (closed orange squares, closed black circles, closed
the first part of the cultivation, until the VCC started to                             pink triangles) and cell viability (closed green stars) over the cultivation time. (B)
decrease (after about 120 h), the data were well aligned,                              Viable cell concentration (VCC) (closed blue triangles), glucose concentration
confirming the equal culture behavior for online monitored                              (closed red squares), and lactate concentration (closed purple circles) over the
and offline sampled flasks. In the later stages of the cultivation,                      cultivation time. Closed black arrow indicates decrease in OTR upon depletion
                                                                                       of glucose and lactate, open arrow indicates “shoulder” in OTR. Data from
the VCC exhibited a large standard deviation, which prohibits
                                                                                       experiment 2 (Supplementary Table S1).
a statement on the significance of the difference in viable cell

Frontiers in Bioengineering and Biotechnology | www.frontiersin.org               7                                               August 2021 | Volume 9 | Article 725498
Ihling et al. Time-Resolved Monitoring of CHO Cells
determined in a worst case scenario. The highest change in the (Figure 3A, closed orange squares) and by the slightly fluctuating
OTR was calculated as the first derivative of the OTR curve values obtained from flask 3 (Figure 3A, closed pink triangles).
(Supplementary Figure S2). After 246 h, the first derivative Comparing the maximum OTR reached during cultivation
showed a minimum and highest absolute value. At this point, (1.23 mmol L−1 h−1) to the maximum OTR reachable under
the OTR changed from 0.44 mmol L−1 h−1 to 0.38 mmol L−1 h−1 the applied shaking conditions (7.11 mmol L−1 h−1) proved
(ΔOTR 0.06 mmol L−1 in 1 h). From these data, the oxygen that the cells were not close to an oxygen limitation during
concentration in the liquid (cO2,l) was calculated (Eq. 3): cultivation. In addition, the maximum biological OTR
measured (1.23 mmol L−1 h−1) resulted in a decrease of the
OTR oxygen partial pressure in the headspace of the flasks of about
cO2,l c*O2 − (3)
kL a 2 mbar during the measurement phase (see equation in Figure 1C
and Supplementary Table S3 for parameter values). This
At saturation conditions with air, about 0.22 mmol L−1 of decrease was very small compared to the oxygen partial
oxygen are soluble in water at 36.5°C (Truesdale et al., 1955). pressure inside the flask (∼197 mbar in fully water-saturated
The kLa was calculated to 42 h−1 (Supplementary Table) and the air). Consequently, as the headspace gas volume is mixed by
OTR was measured. The change in OTR resulted in a dcdtO2 of the rotating bulk liquid (Anderlei et al., 2007), oxygen gradients
0.001 mmol L−1 in 1 h, which is roughly 0.45% of the saturation inside the flask were not expected. Thus, online monitoring of the
concentration of oxygen in the liquid and much smaller than the OTR was suited to evaluate if the chosen cultivation conditions
OTR. As the measurement phase was 20 min and the oxygen partial resulted in a sufficient supply with oxygen.
pressure in the headspace only decreased by a maximum of 2 mbar In parallel to the measurement of the OTR, one flask stoppered
during the measurement phase, dcdtO2 during the measurement phase with a cotton plug was used for sampling and “offline”
could also be neglected. Consequently, dcdtO2 was assumed to be close determination of culture parameters. The cell viability started
to zero during the entire cultivation proving that OTR equals to decrease after around 144 h (Figure 3A, closed green stars) and
OUR to be justified. However, the validity of this assumption reached zero after 312 h. However, considering the progress of the
has to be reassessed, if the cultivation conditions are changed VCC, it was most likely that the viability reached zero already
or if more rapid changes (e.g., substrate depletion at higher cell after about 264 h. In this experiment, kanamycin was
concentrations) occur. In this case, the magnitude of the error will supplemented to the medium (see Supplementary Table S1).
depend on the specific OUR value and on the kLa. Nevertheless, also Kanamycin disrupts bacterial membranes and binds to the
for fast-growing bacterial cultures (E. coli) the mean change in the cellular membrane of mammalian cells (John et al., 2017). As
oxygen concentration was comparably low (∼0.02 mmol L−1 h−1) shown, the viability was above 97% for the first 115 h of the
(Mühlmann et al., 2018). cultivation, indicating that the addition of kanamycin did not
The relationship between the OUR and other metabolic affect the viability measurement by trypan blue exclusion.
parameters (e.g., VCC) has been established for different The VCC increased until about 140 h (Figure 3B, closed blue
mammalian cell lines for decades (see Introduction). Thus, triangles). Afterwards, it started to decrease (considering the error
this study did not aim to discuss and explain the general bars) (see Figure 2, open blue triangles). Cell counts after 187 and
progression of the OUR over time. Instead, the possibilities for 210 h exhibited a large standard deviation (21 and 46%,
non-invasive, parallelized monitoring of the OTR in shake flasks respectively) due to clumping of the cells (data not shown),
should be explored and obtained data validated by comparison which made manual counting error prone.
with offline samples. As a result, the VCC, viability, glucose and During the first part of the cultivation, glucose was consumed
lactate concentration as well as pH and osmolality were (Figure 3B, closed red squares) while lactate (Figure 3B, closed
determined by manual sampling in parallel to OTR acquisition. purple circles) was produced in parallel until around 120 h of
As the OTR was the measuring parameter, the term OTR will cultivation. Consequently, the pH value decreased
be used from here on, even if the OUR was the real physiological (Supplementary Figure S3, open blue squares). After about
variable evaluated. The OTR increased until about 175 h of 120 h, glucose and lactate were consumed in parallel
cultivation (Figure 3A). At this point, an average maximum (Figure 3B) and the pH rose again (Supplementary Figure
OTR of about 1.23 mmol L−1 h−1 was reached. Afterwards, the S3, open blue squares). It has to be noted that the pH was
OTR decreased with a steep drop occurring after 216 h (closed determined by manual sampling and not in-situ. Due to manual
black arrow) and a visible “shoulder” between 253 and 264 h sampling and subsequent pH measurement in ambient air, the
(open arrow). The OTR dropped to zero after 264 h. Even though absolute values of the pH measured were most likely different
the measured OTR was low compared to microbial cultivations, from those experienced by the culture that was cultivated in a
the reproducibility within one experiment was high, as seen from CO2-enriched atmosphere. Nevertheless, the trend of the pH
the triplicate measurement. The average standard deviation value corresponded well to phases of lactate production and
between three independent measurements in one experiment consumption. After 238 h, neither glucose nor lactate were
was about 6.5% (until 265 h of cultivation) providing an detected in the supernatant, indicating their full depletion. The
appropriate reproducibility of the measurement technique. It osmolality steadily decreased during cultivation (Supplementary
also proved a reproducible culture behavior in different shake Figure S3, closed orange circles).
flasks. The value of the standard deviation might be attributed to Comparing the shape of the OTR curve with the offline
the slightly higher OTR values reached by the culture in flask 1 measured data, different conclusions can be drawn directly
Frontiers in Bioengineering and Biotechnology | www.frontiersin.org 8 August 2021 | Volume 9 | Article 725498Ihling et al. Time-Resolved Monitoring of CHO Cells
from the OTR signal. Firstly, the progress of the VCC was specific oxygen up-take rate of the utilized cell line, the
reflected by the OTR until the maximum VCC was reached. measurement frequency could be increased by decreasing the
This was expected since oxygen consumption is an indicator for duration of the measurement phase. As discussed above, a
metabolically active cells. Secondly, the maximum in the OTR measurement frequency of one measurement value every
was reached after around 180 h, even though glucose was still 60 min is comparable to the measurement resolution of
present in the medium. At this point, the cells had also switched bacterial cultures. Nevertheless, it needs to be pointed out that
from lactate production to lactate consumption. Thirdly, a rapid a truly continuous data acquisition is not possible, as an
decrease in the OTR was observed as soon as glucose and lactate alternating measurement phase and a gas flow phase are required.
were depleted after about 216 h of cultivation (closed black
arrow). This indicated the cells quickly died as soon as these
substrates were depleted. This observation is in agreement with Cultivation of CHO Cells in Single-Use
data gathered in fully instrumented bioreactors: A rapid decrease Polycarbonate Flasks
of the OUR was attributed to nutrient depletion in fed-batch In parallel to cultivations in glass flasks, a comparable cultivation
cultures of NS0 cells and used to adjust feeding time points to was carried out in single-use polycarbonate flasks. Cultivation in
increase monoclonal antibody titers (Zhou et al., 1997). For single-use polycarbonate flasks was carried out to demonstrate
another hybridoma cell line, a shift in the OUR could be flexibility of the monitoring technology. In addition, even though
attributed to glutamine depletion (Ramirez and Mutharasan, no difference was expected in terms of mass transfer (see above),
1990). Consequently, the depletion of major carbon sources an influence of the flask material on culture behaviour could not
could be predicted from the OTR signal. be excluded. It was demonstrated previously that bisphenol A
The rapid decrease of the OTR was interrupted by a visible leaching from polycarbonate flasks affected metabolic rates
“shoulder” between 258 and 264 h (open arrow). This on-going (including glucose consumption and lactate production) of a
metabolic activity was in agreement with the course of VCC and CHO cell line (Stiefel et al., 2016).
viability, which had not reached zero at this point where glucose Cultivation in single-use polycarbonate flasks was highly
and lactate were consumed. This kind of shoulder had been reproducible between the three cultures (average standard
observed for bacterial and yeast cultures in the past (Hansen et al., deviation in the OTR of about 8%). However, an off-set was
2012). In microbial cultures, this “shoulder” is an indicative of a observed (Supplementary Figure S4, open orange squares, open
diauxic effect caused by a switch from consumption of one carbon pink triangles, open black circles) in all three flasks after the
source to another (Hansen et al., 2012). As it is difficult to viability (Supplementary Figure S4, open green stars) had
compare microbial cultures to immortalized cells derived from dropped to zero. This off-set was not observed during
a mammalian tissue, the reason for the shoulder observed for the cultivation in glass flasks (Figure 3).
CHO culture is currently unknown but could be subject to further The off-set in the OTR most likely resulted from water vapor
studies. For hybridoma cells a similar “shoulder” was seen in the diffusion from the inside of the flask through the membrane into
OUR after glutamine depletion, indicating oxidation of the vent-cap to the oxygen sensor in the adapter. Consequently,
alternative substrates (e.g., glucose, other amino acids or fatty an off-set was only observed in single-use polycarbonate but not
acids) (Ramirez and Mutharasan, 1990). As the “shoulder” in glass flasks, if the flasks were only filled with water
occurred at the very end of the cultivation, it is less relevant (Supplementary Figure S5). The influence of water vapor
in terms of production. Lastly, the end of active respiration after diffusion in single-use polycarbonate flasks is further discussed
264 h could clearly be detected in the OTR signal. within the Supplementary Data Influence of Humidity. As a result
It can be concluded that the observed course of the OTR of water vapor diffusion, the so-called “cut-off phase” was set to
corresponds well with the offline-determined parameters and is 8 min in this study (see Supplementary Data for a detailed
in line with observations made for mammalian cells previously explanation).
(Ramirez and Mutharasan, 1990; Zhou et al., 1997). In addition, A cut-off phase of 8 min was suited for both flask types to
the standard deviation (Ihling et al. Time-Resolved Monitoring of CHO Cells
Both experiments were inoculated from the same cryogenic
vial with 6 weeks’ time lag between the experiments. A difference
in the lag-phase was visible between the cultures (Figure 6A,
closed orange squares and closed black stars). This difference
could be due to the use of cells from different passage numbers
(Supplementary Table S1). Differences in the lag phase could
also be the cellular response to different times of harvesting the
preculture. As a result, the cells would be in a different growth
phase (e.g., early instead of mid-exponential growth phase).
Except for these minor differences, the overall respiration
profiles matched well. Considering the shift of ∼20 h (open
black stars) corresponding to the cell doubling time, the OTR
data from the third experiment (closed black stars) aligned well
between the two consecutive experiments. This confirmed that
the culture behavior of the CHO cells was highly reproducible and
that monitoring of the OTR was suited to reveal differences in the
lag-phase. Thus, measurement of the OTR facilitates the
adaptation of sampling points to the progress of the culture to
FIGURE 4 | Cultivation of Chinese hamster ovary (CHO) cells in single-
match and to compare consecutive experiments. In addition, cell
use polycarbonate shake flasks with online monitoring of the oxygen transfer
rate (OTR). OTR in triplicate (open orange squares, open pink triangles, open
black circles) over the cultivation time. Closed black arrow indicates
decrease in OTR upon depletion of glucose and lactate, open arrow indicates
“shoulder” in OTR. Data from experiment 2 (Supplementary Table S1) with
off-set (Supplementary Figure S4) subtracted.
open arrow, respectively) that was observed in glass flasks
(Figure 3).
The culture behavior in glass and single-use polycarbonate
flasks was compared by analysing the online and offline data
(Figure 5). Figure 5 depicts the data for glass flasks already
presented in Figure 3 and the OTR data for single-use
polycarbonate flasks also shown in Figure 4.
As demonstrated above, the mass transfer resistance was
similar for the cotton plug and the vent-cap. In addition, the
kLa values for gas-liquid mass transfer were in the same order of
magnitude and the maximum oxygen transfer capacity (OTRmax)
achievable under the chosen cultivation conditions of about
7.2 mmol L−1 h−1 was much higher than the OUR of the
culture. Consequently, a similar culture behavior was expected.
This similar culture behavior was confirmed by the similar course
of the OTR (Figure 5A, diamonds). The similar culture behavior
was further proven by the similar course of the offline measured
parameters (Figure 5A, stars and Figure 5B). Further, it was
confirmed that potential leakage of bisphenol A from the FIGURE 5 | Comparison of Chinese hamster ovary (CHO) culture
behavior in glass and single-use polycarbonate shake flasks with online
polycarbonate flask did not affect any of the parameters
monitoring of the oxygen transfer rate (OTR) and manual (“offline”) sampling.
determined for the CHO cell line used in this study. (A) Averaged OTR from triplicate measurement for polycarbonate flasks
(open black diamonds) and glass flasks (closed black diamonds) as well as
culture viability in polycarbonate flask (open green stars) and glass flask
Culture Reproducibility and Cultivation in a (closed green stars) are depicted over the cultivation time. (B) Viable cell
concentration (VCC) in polycarbonate (open blue triangles) and glass (closed
Different Medium blue triangles) flasks, glucose concentration in polycarbonate (open red
The reproducibility of the culture behavior and the OTR signal squares) and glass (closed red squares) flasks as well as lactate concentration
was determined by a third cultivation using glass flasks in polycarbonate (open purple circles) and glass (closed purple circles) flasks
(Figure 6). The course of the OTR from the second over the cultivation time. Data from experiment 2 (see Supplementary Table
experiment (Supplementary Table S1) in glass flasks S1). Single measurements of the OTR are depicted in Figure 3 (glass flasks)
and Figure 4 (polycarbonate flasks), respectively.
(Figure 3) is shown for comparison.
Frontiers in Bioengineering and Biotechnology | www.frontiersin.org 10 August 2021 | Volume 9 | Article 725498Ihling et al. Time-Resolved Monitoring of CHO Cells
obtained without manual sampling. The data amount was
increased 24-fold compared to manual sampling, which was
commonly carried out once per day. Parallelized monitoring was
possible in glass and single-use polycarbonate shake flasks. In
comparison to fully instrumented bioreactors, easier parallelization
and utilization of lower filling volumes is possible, while
simultaneously obtaining comparable results.
Determination of the mass transfer resistance of two different
sterile closures (cotton plugs and vent-caps) showed only a minor
influence on the total oxygen mass transfer in shake flasks. Values
determined were used to adjust the gassing rate of the RAMOS device.
Consequently, the culture behavior in actively aerated, monitored
flasks was shown to be identical to flasks stoppered with cotton plugs.
The reproducibility of the OTR data within one experiment
exhibited a standard deviation of less than 10% for both flask
types. Monitoring the OTR with the RAMOS device is non-
invasive and requires no manual intervention and no process-
interfering volume sampling. Thus, compared to conventional
FIGURE 6 | Reproducibility of culture behavior in glass flasks. The OTR is
sampling, it is clearly less labor-intensive, more flexible, and does
shown as the average of a triplicate determination (closed orange squares, not affect culture behavior. It was demonstrated that the OTR was
experiment 2), and as a single determination (experiment 3, closed black very close to the OUR under the conditions applied in this study. The
stars). Data from experiment 3 were shifted by 20 h (open black stars) for course of the OTR reflected the course of the VCC until the maximum
comparison with experiment 2. Compare Supplementary Table S1 for
OTR was reached. In addition, the depletion of all carbon sources and
experiment comparison.
the end of active respiration was reflected in the OTR as it dropped to
zero. Furthermore, the respiration profiles and the cell growth in glass
and single-use polycarbonate flasks were shown to be identical, if the
culture monitoring during passaging could be carried out in the raw data was reasonably treated. Comparison with a second medium
future to ensure that the cells are in exactly the same growth phase demonstrated the potential of the technology to reveal differences in
upon transfer without the need for manual sampling. the OTR in different culture media. This way, a valid comparison of
Cells were cultured in a different medium in a fourth
experiment (Supplementary Table S1) to demonstrate the
future application potential of the RAMOS technology for
mammalian cell cultivation. A batch cultivation was carried
® ™
out in EX-CELL Advanced CHO Fed-batch Medium (“medium
2”) (Figure 7, purple triangles). Data for cultivation in PowerCHOTM
two medium (“medium 1”) from Figure 3 are shown for comparison
(Figure 7, orange squares, black circles, pink triangles).
The course of the OTR clearly differed between the two media.
The end of active respiration was reached about 2 days earlier for
medium 2 and higher OTRs were reached during cultivation. Similar
to medium 1 a “shoulder” was also observed for medium 2 (open
arrow). These data demonstrated that the application of RAMOS for
an initial comparison of culture media was possible and enabled a first
comparison of the overall culture behavior and the peak maximum
OTR (in terms of value and timepoint) without sampling. In the
future, correlation with offline parameters will be investigated in detail.
If these correlations (e.g., cell specific oxygen uptake rate) are already
known for a cell line, direct calculation of derived cellular and
metabolic information (e.g., VCC) is possible.
FIGURE 7 | Comparison of Chinese hamster ovary (CHO) culture
behavior in different media. OTR in triplicate for PowerCHOTM two medium
CONCLUSION (“medium 1”) (closed orange squares, closed pink triangles, closed black
circles) and in duplicate for EX-CELL® Advanced™ CHO Fed-batch
The data presented in this study demonstrated the benefit of time- Medium (“medium 2”) (open and closed purple triangles). Open arrow
resolved monitoring of the OTR to increase the information content indicates “shoulder” in OTR. Data for medium one from experiment 2
of cultivations of CHO cells in shake flasks. By monitoring the OTR, (Figure 3) (see Supplementary Table S1). Data for medium two from
experiment 4 (Supplementary Table S1).
information about the culture behavior could non-invasively be
Frontiers in Bioengineering and Biotechnology | www.frontiersin.org 11 August 2021 | Volume 9 | Article 725498You can also read