FY2019/2020 Sales & Marketing Plan - Yolo County
←
→
Page content transcription
If your browser does not render page correctly, please read the page content below
FY2019/2020 Sales & Marketing Plan

This document contains confidential and proprietary information belonging exclusively to Wild Wings
                        Golf Club and Kemper Sports Management, Inc.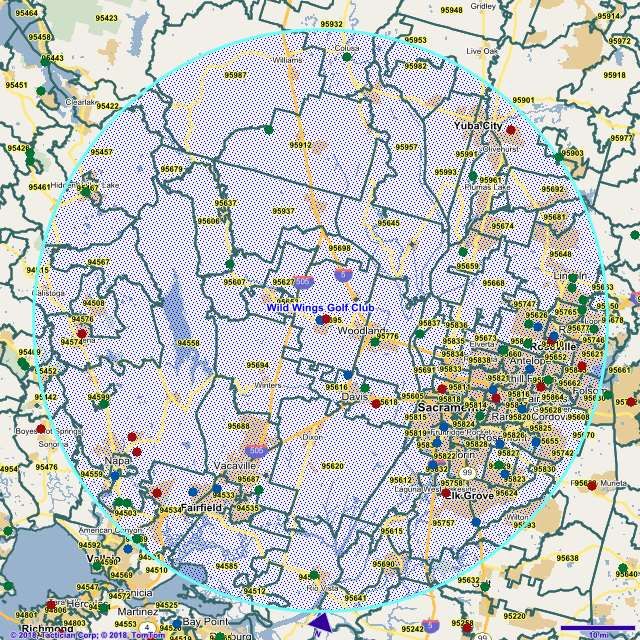
2019-2020 Marketing Plan

Contents
Market Overview .................................................................................................................................... 2
Primary Revenue Initiatives ................................................................................................................... 4
   Daily Fee Golf..................................................................................................................................... 4
   Loyalty Program/Annual Passes* ...................................................................................................... 8
   Non Golf Revenue – FootGolf – NEW! ............................................................................................ 10
   Golf Outings ..................................................................................................................................... 10
   Food & Beverage - A la Carte .......................................................................................................... 11
   Pro Shop - Merchandise .................................................................................................................. 12
Communication Overview .................................................................................................................... 13
   Website............................................................................................................................................. 13
   Email................................................................................................................................................. 15
   Digital /Social Media......................................................................................................................... 15
   Public Relations................................................................................................................................ 17
   KemperSports Marketing Channels ................................................................................................. 18
Exhibits ................................................................................................................................................. 19
   Exhibit A – Brand ........................................................................................................................... 19
   Overall Vision ................................................................................................................................... 19
   Brand Positioning Statement ........................................................................................................... 19
   Property Tagline (Brand Promise) ................................................................................................... 19
   Design Elements .............................................................................................................................. 19
       Exhibit B – SWOT ....................................................................................................................... 20
       Exhibit C – Competitive Market Analysis (CMA) ..................................................................... 21
   2018 Competitive Rates Analysis .................................................................................................... 22
   Key Competition Strengths & Weaknesses ..................................................................................... 23
       Exhibit D – Customer Insights & Survey Results ................................................................... 26
   KemperSports True Review ............................................................................................................. 26
   NGF GolfSAT ................................................................................................................................... 27
       Exhibit E – Local Market Situation Analysis ........................................................................... 30
       Exhibit F – Outing Pace Report ................................................................................................ 33
       Exhibit G – Utilization Reports .................................................................................................. 34
       Exhibit H – Marketing Budget Breakdown............................................................................... 36

                                                                                                                                                           1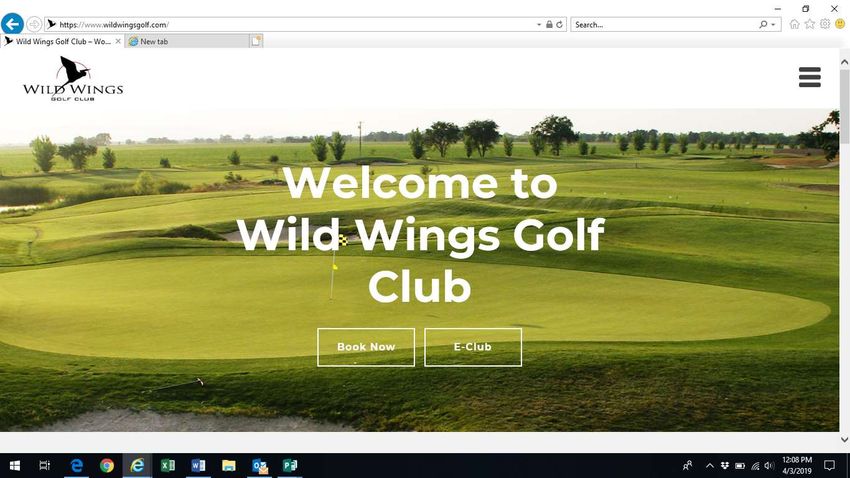
2019-2020 Marketing Plan

Market Overview
Wild Wings Golf Club is a favorite course for all golfers of all skill levels for locals, the Sacramento Valley
& Bay Area. The local marketing analysis reflects that within the immediate area (10 mile radius) there are
16,627 golfing households that represents only approximately 7,155 golfers with an 11-12% golf
participation rate. When expanding the market to a 40-mile radius, the course stands to gain exposure to
over 150,000 golfers. However in context, the course stands to compete with 52 golf courses in that same
mile radius (private, premium, standard, value, executive courses) To say the least, the oversupply of golf
courses greatly outweighs the demand as players are leaving the game or simply playing less golf.

The average household income ranges between $58,000 to $71,000 between a 10 and 40 miles radius.
The largest portions of the local market are comprised of 30-40 year olds. This young age demographic is
partially attributed to the courses proximity to UC Davis as well as the rise of the Gen X and Millennials
compared to Boomers. Although younger generations are not playing as much golf as their
parents/grandparents, there does exists a sizeable latent demand from 14,000-50,000 non-golfers within a
10-20 miles who are interested in the sport. This strongly indicates a demand for player development and
junior programs as the 9-hole course layout is more favorable for beginners and junior golfers compared to
the 18-hole, championship length Par 70+ courses in our competitive set. This would however require more
expense to hire a PGA teaching professional and not having a driving range is also limiting.

Data from the National Golf Foundation further reveals that Wild Wings Golf Club, while an executive
course, is generally favorably compared to immediate 18-Hole competition in the Public Value category.
Although we would assume that we are deriving outside play primarily from Davis and Sacramento markets,
our competitive cross play analysis from GolfNow reveals an increase of players from Vallejo, Vacaville and
Fairfield (which is just at or outside a 40 mile radius) make up more than the players we get from the
Davis/Sacramento Markets combined. Our primary market is Woodland at 41%.

The course was unfortunately plagued with several unplayable days due to severe weather this past year.
This includes more rain and the nearby wild fires greatly affected the ability of golfers to enjoy a golfing
experience. The lack of available carts and without having cart paths continues to play a role in unplayable
conditions. The course will look to acquire new carts and add to the existing fleet to better serve the golfers.

The course has benefitted from nearby course closures (Green Tree in Vacaville in late 2017) and more
recently in 2019, Woodland Meadows – a nearby 9-hole facility. The course has inherited several groups
from these course colures including regular Senior Men’s Club. Growth of the Ladies’ Twilight League will
help to increase revenue in the next fiscal year for our outings segment.

The course continues to maintain a loyal following within the immediate area with a strong NPS Score of
above 80% (KemperSports benchmark is 70%). The lack of marketing dollars to keep Wild Wings top of
mind outside of its local market could hinder the ability to continue to grow rounds and attract new golfers.
Furthermore, delayed maintenance, wear and tear on the facilities over time, a small food and beverage
operation, low staffing levels and other operational factors make it more difficult to retain golfers from
outside the immediate area.

The 2019/2020 Marketing Plan presented hence forth is a custom plan, a collaboration between our team
at the property, our regional support directors and our home office staff of professionals. We have analyzed
the data, reviewed customer trends, sourced our collection of best practices and have prepared custom
strategies and tactics to drive success in the year ahead.

Sincerely, Nadia Chapman, MBA
KemperSports
Regional Sales & Marketing Director – West #golfisgreat

                                                                                                              2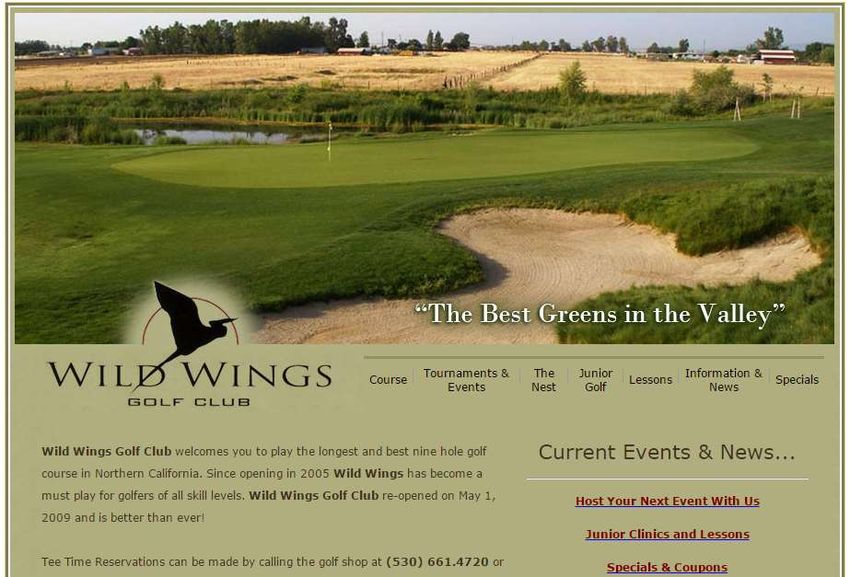
2019-2020 Marketing Plan

Revenue Snapshot
Below is a summary of the 2019/2020 Budget in the major revenue categories including Course &
Grounds (Green Fees – daily fee and outings), Carts, Food & Beverage, Golf Shop (Merchandise)
and Administrative. The course makes the majority of revenue from daily fee green fees and cart
fees. Food and beverage and merchandise represent a small amount of revenue comparatively.
This is surprising despite Mother’s Nature’s wrath that has plagued the market recently affecting the
number of playable days in the past 2 years. (El Nino, Wild Fires) A more aggressive third-party
strategy for driving rounds and revenue across all segments is further outlined in this marketing plan
to continue to grow market share and revenue at the club. An increase in league play with nearby
course closures will also help drive revenues back exceed 2017/2018 levels where we had more
playable days due to cooperating weather.

                           2019/2020           % of           Forecast  Actual    Actual
     Department
                           Budget              Budget         2018/2019 2017/2018 2016/2017
     Course and
                                    206,779            50%      189,498       194,616    172,167
     Grounds
     Carts                          131,271            32%      117,076       137,078    119,313
     Food & Beverage                 42,111            10%        39,204       43,982     44,681
     Pro Shop                        32,626             8%        31,710       39,524     37,499
     Totals                         412,787            100%     377,488       415,200    373,660

                                     Revenue 2019/2020

                                              32,626
                                     42,111

                                                                  206,779

                               131,271

                       Course and Grounds     Carts     Food & Beverage     Pro Shop

                                                                                                     3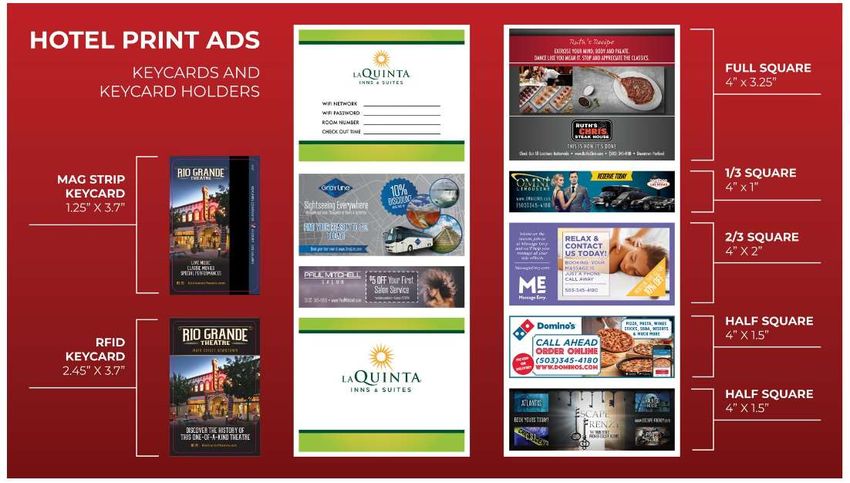
2019-2020 Marketing Plan

Primary Revenue Initiatives
This section identifies and outlines the primary revenue segments at Wild Wings Golf Club.

Daily Fee Golf
Continue to maximize green fee revenue via growth in overall rounds derived from the local and
regional market, and grow revenues from both current and new customers, with a larger focus on
continuing to grow new daily fee business from third-party partners. Club will also continue to
implement dynamic pricing to better fill off-peak times and continue to grow rounds, revenue and
wallet share using Golf Now Central Marketing.

2019/2020 Rounds Mix

The following chart depicts the anticipated rounds mix for 2019/20 compared to prior year 2018/2019
and 2017/2018.

       Measure                         2017/2018            2018/2019          2019/2020
                                       Actual               Forecast           Goals

       18- Holes Daily Fee             4,050                4,119              4,531

       9- Holes Daily Fee              4,411               3,537               3,891

       Junior                          261                 247                 272
       Twilight                        6,215               4,283               4,874
       GolfNow                         340                 500                 540
       Tournament /Outings             589                 650                 750
       Replay Rounds                   266                 270                 270
       EZLinks Rounds Trade            1,465               1,421               1,497
       Annual Pass Rounds              2,236               2,356               2,403
       TradeComp/Employee              1,070               948                 914
       Total Rounds*                   20,903              18,331              19,942

Implications: Comp rounds are comprised of birthday rounds, high school rounds, employee rounds
and Trade Times from TEeoff.com (Ezlinks) and Golf Now. Comp rounds have continued to increase
over the past few years. Course will need to closely monitor number of comp rounds by changing
rules for donations, birthday club incentive and trade times. EZ Links Rounds have increase over
prior year however that is our trade times that pay for the EZLinks booking engine, tee sheet and
POS system. GN Trade Times have increased but have produced an increase in paid rounds and
revenue overall. The operations will continue to monitor and look for ways to better manage these
trade relationships including moving the trade time to less desirable day parts. Outing/Tournament
rounds are derived from the annual PACE Report. Look to increase outing rounds back to previous
years (prior to El Nino and Wild Fires) Replay Rates are now being tracked individually in POS.
Historically tracking for replay rates did not exist prior to 2017. Participation in the NCGA Youth on
Course is contributing to higher junior Rounds than years previous. Goal to reduce comp rounds,
increase outings and increase daily fee play (direct and third-party). Moving forward, course will
need to do a better job of categorizing rounds in POS and clean up old rates that no longer exist
when new rates are implemented to avoid golf shop staff from mistakenly ringing in rounds to the
wrong sku. With weather cooperation, the course is positioned to again increase rounds over prior
year.

                                                                                                     4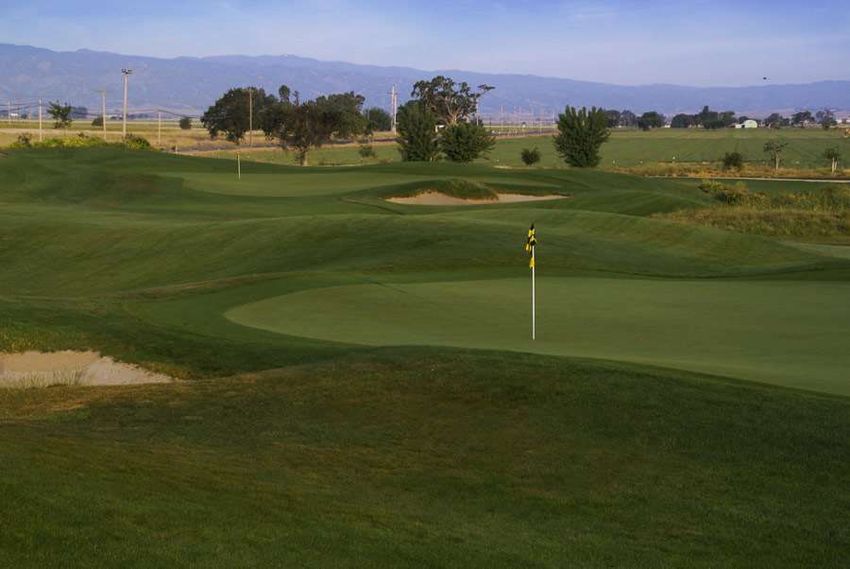
2019-2020 Marketing Plan
2019/2020 Pricing Strategy
The pricing template below reflects our current and proposed price position in the marketplace. The
course implemented an increase in August 2018. This increase was due to the increases in
minimum wage, water, fuel and other uncontrollable costs, otherwise core rates have remained the
same for the past several years with no difference in rate for walkers or riders. Due to the low supply
of carts coupled with golfers’ high demand, a $3 increase to riding fees was implemented.
For walkers, the price will remain the same with optional pull cart rental (Previously included in rate.
offered at $3 each.) Dynamic pricing to fill off peak will still be utilized and e-blasts with specials will
continue to be sent to loyal customers based on utilization.
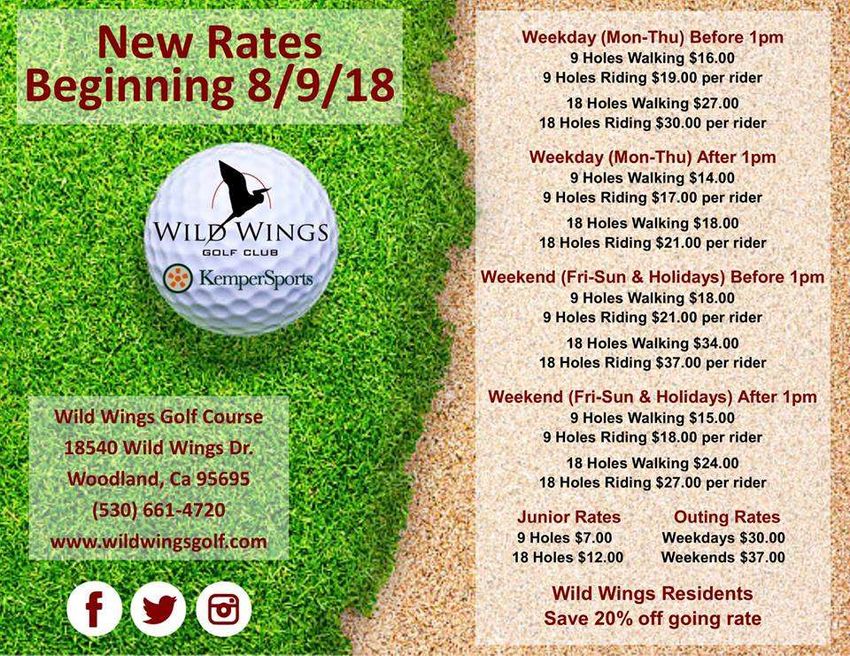
In addition Wild Wings Residents can also take advantage of 20% off posted rates and a trail fee for
Residents for private cart at $3. Annual Pass plans and cart plans continue to be the best value for
resident and loyal golfers. The rates will remain the same for 2019/2020 based on our position in
the marketplace. Below are those current posted rates.
5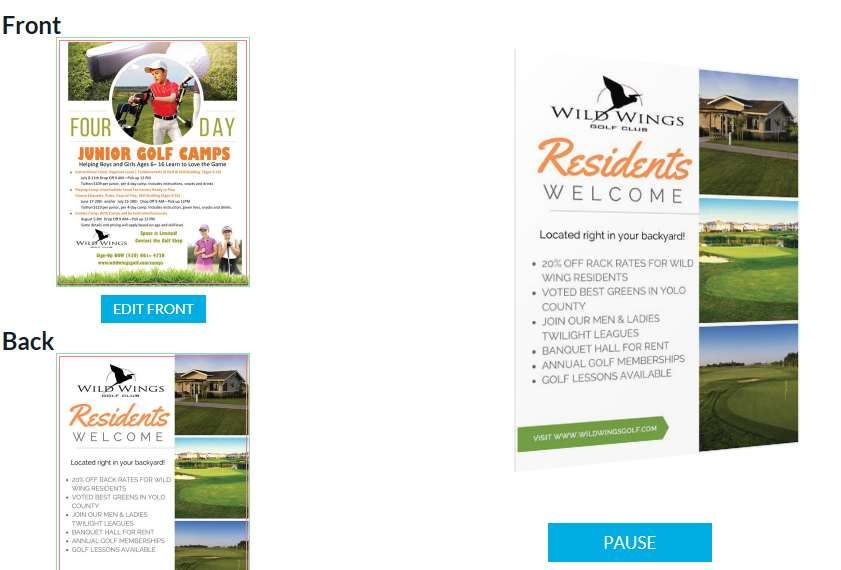
2019-2020 Marketing Plan

Daily Fee – Key Strategies & Tactics

1) Increase revenues generated from daily fee play
   a) Launch internal cybersales using GolfRev (Last used in 2013)
   b) Look to execute a GolfMoose or another third party campaign to drive volume and play
       outside 40 mil radius.

2) Increase Revenue and rounds using GolfNow
   Continue with an aggressive customer acquisitions strategy using GolfNow’s platform to attract
   local golfers and visitors who are on the GN platform. Grow market share from competitor
   courses and continue to gain new loyal golfers. Revenue from this popular third-party provider
   has doubled since 2016.
   a) Monthly calls/visits with in-market GN Rep.
   b) Continue use of the Auto Pricing/Matrix for dynamic pricing with routine adjustments based
       on utilization
   c) Use of the Golf Now Central Marketing Tool
   d) Customer Data capture at check-in (name, email, zip) to add to our internal database
   e) Offer a bounce back pass to every GN customers to encourage to book direct next time
   f) Integrate use of Promo Codes to off peak season and slow
       days.

Measure            2015 Actual         2016 Actual        2017 Actual   2018 Actual    2019 Goals
GolfNow            250                 313                340           471            540
Rounds
Golf Now           $6,116              $7,299             $9,485        $11,240        $13,000
Revenue
Course ADR         $24.46              $23.32             $27.90        $23.86         $24.00
*GolfNow rounds/revenue is reported on a Calendar Year Jan – Dec

                                                                                                    6
2019-2020 Marketing Plan
3) Resident Play
a) Look to attract more rounds from local homeowners will enhanced outreach to this market. One
such way is by the inclusion of flyers in the utility inserts. Inserts will be advertising local course
events such as Resident benefits, Summer Junior League. Below is an example of one such flyer.
3) Non-Resident Play
a) Look to attract non-locals who may be visiting the area for work or travelers in the area. We
will target the nearby Comfort Inn and Suites – Sacramento Airport in Woodland, CA by
placing a half square advertisement on their key card insert.
1/2 Square - $795.00 (4.00''W x 1.50''H – See Domino's)
Reach 42,000 guests annually
Ad will be a “Did you Forget your Clubs Campaign” Offering rental sets for $1
7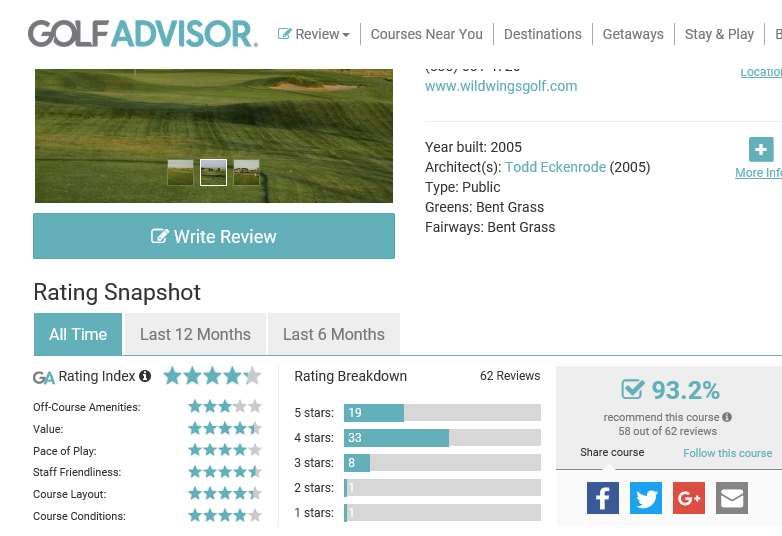
2019-2020 Marketing Plan

Loyalty Program/Annual Passes*
Increase customer loyalty and daily fee player frequency through our in-house annual/monthly
membership plans for both residents and nonresident pass sales. We’ll continue to offer annual
passes to both residents and non-residents. Annual Pass prices will remain the same price and a
monthly financing program will be available with a surcharge. Annual trail fees for those residents
owning their own golf carts will be in place, as well as an annual cart pass available to those who do
not own their own cart, both Residents and Non-Residents.

Look to increase the annual pass price to increase revenue and increase ADR for these Member
rounds or restructure the program to Singles versus Family to account for the increase in rounds
played over the years.

  Pass Type                                           Annual Fee            Monthly Fee

  Resident Passes (individual or family)              $1,100                $120

  Resident Cart Owner Passes                          $275                  $25

  Non-Resident Passes (individual passes)             $1,200                $120

  Non- Resident Cart Annual Cart pass                 $450                  $40

                                                                                                     8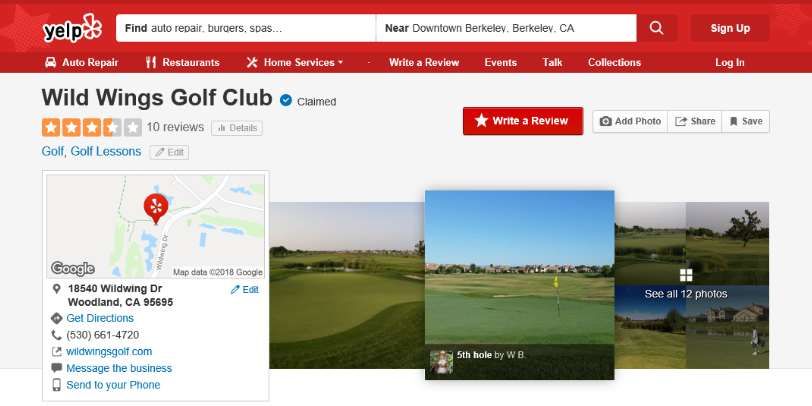
2019-2020 Marketing Plan

 Measure                              2016/2017       2017/2018     2018/2019     2019/2020
                                      Actuals         Actuals       Forecast

 Total Passes Sold                    15              22            20            20

 Total Rounds from Passes             1,517           2,238         2,356         2,403

 ADR Per Annual Pass Round            $17.03          $13.22        $10.48        $10.44

 Total Pass Revenue                   $25,900         $29,600       $24,702       $25,092

Strategies & Tactics
1. Continue to grow loyalty/ annual pass sales to increase return play from golfers

           a.   Increase price of membership program as play increases, ADR is declining YOY.
           b.   Signage on course with a tee-signs
           c.   Include collateral (flyer and banner) in the pro shop
           d.   Golf Cart Signage
           e.   Incentive staff who refer a new member
           f.   Offer a free round for that day if they upgrade to a membership (standard or premier)
           g.   E-blasts to database (internal and GN Central Marketing)
           h.   Black Friday – Offer an aggressive offer to golfers at end of the year to lock in 2019
                membership.

2. 12-Play Punch Card

       a. Create a 10 play punch pass for regular green fee paying players (NOT Third-Party or
       Annual Members) Similar to Dutch bros Coffee and other loyalty cards.
       b. Create incentive to increase frequency.
       c. Play 10, Get one Free.
       d. Pass will be business card size

                                                                                                     9
2019-2020 Marketing Plan
Non Golf Revenue – FootGolf – NEW!
Look for ways to increase revenue from non-traditional revenue streams including Foot Golf.
• Lower Cost to Set-Up (compared to Disc Golf)
• No immediate competition in market (Woodland,
Davis, Vacaville, Fairfield, Vallejo)
• Attracting New Customers
• Attracting a Younger Demographic
• Attracting more Female Players
• Faster Play
Plus Additional Revenues from:
Green Fees
Soccer Ball Rentals
Cart Rentals
Food & Beverage Sales
Tournament Play
Corporate/Group Events
The course can anticipate an average ROI of 30-45 Days!! (According to USFGA)
Golf Outings
Implement a sales and marketing strategy to increase revenues from golf outings at Wild Wings Golf
Club, with a large focus on growth recapturing lost outing groups.
Measure 2015/2016 2016/2017 2017/2018 2018/2019 2019/2020
Actual Actuals Actuals Forecast Goals
Number of 26 18 20 23 25
Outings
Outing Rounds 768 545 589 600 750
Total Outing $23,217 $16,400 $16,420 $20,000 21,000
Revenues
Outing ADR $30.23 $30.09 $27.87 $30.00 $30.00
*Data from PACE Report. See Exhibits for 2018/2019 PACE Report
Key Strategies & Tactics
1) Increase # of new outings via recruiting groups from competitor properties
a) Research online competitor courses and other listings for local tournaments
b) Develop relationship by donating rounds to tournament chair
c) Personally invite tournament chairs for complimentary round of golf at WildWings
2) Develop Internal Leagues and In-House Creative Events
a) Continue to promote and increase Senior League participation
b) Continue to grow Men’s and Ladies Twilight League
102019-2020 Marketing Plan
c) Post Tournament and Events to calendar online
3) Implement and execute a consistent rebooking strategy (current & previous outings)
a) Personal follow-up call from club to tournament organizers following event.
b) Rebook groups following outing to lock in existing rate
c) Offer a booking incentive if they book 2 or more events
4) Lost Group Business – We Miss You/ Welcome Back Campaign
a) Go through PACE reports to find groups that haven’t rebooked
b) Personally call AND email contacts with special offer to come back if they rebook
Implications: Tournament sales declined in 2017/2018 over prior year mostly due to the impact of
severe weather related cancellations (El Nino, wild-fires) Without a dedicated tournament sales
coordinator, the current group outings strategy is primarily composed of in-bound sales from
returning, local groups including regular leagues. These groups tend to be smaller is size with 12 to
20 players with shorter booking windows. Due to the length of the course and the limitations to host
large banquets, tournament play for large groups or charity fundraisers is difficult. Also with the
limited number of carts, the club is further prohibited from capturing larger group business. We did
however, do a good job of capturing group business from nearby course closures in 2018/2019,
which resulted in a growth in bookings this year over PY despite no outing play in the wet winter.
Food & Beverage - A la Carte
Increase food and beverage revenue by developing strategies to deliver growth in a la carte service
at the facility.
Measure 2016/2017 2017/2018 2018/2019 2019/2020
Actual Forecast Goal
F&B Revenue $44,681 $43,982 $39,204 $42,111
Key Strategies & Tactics – Food & Beverage
1) Grow A la Carte food & beverage revenues
a) Offer Combo items (hotdog, chips & non-alcoholic beverage) to increase average per round
b) Presale rounds of golf including food and beverage credit or combo using Cybersales
c) Include Food & Beverage min for tournament groups ($5 per player)
d) Look to expand current grab & go items as feasible in golf shop
e) Create a Golf Happy Hour with 9 Holes of Golf and alcoholic beverages
f) Create Nine & Dine offers with golf and a same day food and beverage credit
g) Offer food and beverage/meal credit through GolfNow
Implications: With the elimination of normal operating hours for the Nest saved considerable
expenses in FY2016-2017 and improved EBITDA results for the club. Wild Wings will continue to
offer very limited a la carte F&B options out of the pro shop in FY2018-2019. Wild Wings limited
offerings will consist primarily of the following
112019-2020 Marketing Plan
Bottled Water, Soft Drinks and Energy Drinks
Beer
Pre Packaged snacks & candy
Hot Dogs, burgers and other hot quick service items
Pop Corn
Pro Shop - Merchandise
We will continue to increase Pro Shop revenue by developing new programming and sales outreach
plans to deliver growth in revenue at Wild Wings.
Measure 2016/2017 2017/2018 2018/2019 2019/2020
Actuals Actuals Forecast Goals
Total Merchandise $37,499 $29,524 $31,710 $32,626
Revenue
Key Strategies & Tactics
1) Increase merchandise sales via daily fee & outing customers
a) Purchase merchandise on close-outs to increase margins and offer good value to customer
b) FootJoy Annual Shoe Sale with close-out (Oct-Dec – Holiday season)
c) Run Annual Sale(s) to move old inventory and bring in new/fresh items for new season
d) Move Items & Displays in the pro shop around
e) Create Seasonal Merchandise Displays quarterly centered around a theme
f) Offer Coupons or Specials on Merchandise through eblasts
g) Add Merchandise Credit/ Gift Cards to golf specials using internal cybersales
h) Run Online gift card sales for Father’s Day & Christmas
i) Promote Merchandise on Social Media
j) Create Monthly/Quarterly Merchandise Packages with Themes: Beat The Heat, Swing into
Spring, Fall into Savings, Give the Gift of Golf
k) Bogo Offers for Golf’s and Shoes (buy one get one half off) to encourage multiples
l) Pro shop staff to ask each person at check-in in if they need balls, tees or a glove. Inform of
current merchandise special.
m) Offer incentive to proshop staff show upsell merchandise during their shifts
n) Promote Merchandise Monthly specials on website, cart signage and pro shop signage
2) Course Essentials (Thing you need to play in the heat)
a) Wide Brim straw hats, Baseball hats
b) Sunblock
c) Small handheld Fans with misters and club logo
d) Wind breakers & Fleece (for winter months)
e) Logo T Shirts
f) Assortment of Balls & Tees
g) Gloves, Towels and Shoes, Socks
122019-2020 Marketing Plan
Communication Overview
The following section reviews the general communication methods utilized to drive overall business
at Wild Wings Golf Club.
Website
The Wild Wing Golf Club website was redesigned in 2019 as the previous site was last done in 2013
and was very outdated. This enhanced the overall aesthetics and will allow easier access for
customers, as well as drive an increase in web traffic from mobile-users and better SEO rankings.
Measure 2015/2016 2016/2017 2017/2018 2019/2020 Goals
Actual Actual Actual
Total Unique visits 14,320 17,293 20,000 23,000
Average monthly 1,250 1,500 1,700 1,950
website visits
Total ALL Rounds 20,954 19,504 22066 24,000
Booked*
Total rounds booked 1,053 1,384 1,855 2,300
on website
% of Total rounds 5.02% 7.09% 8.4% 9.58%
booked on website
*All rounds booked as reported by EZLinks tee-sheet. *Does not exclude no-shows/cancellations as that
number is reported by POS or month end financials. Annual Website Unique Visits reported by
CyberGolf, website provider)
Key Strategies & Tactics
1) Improve the user experience and grow annual web traffic
a) Upgraded to fully responsive website to be mobile friendly at no cost per GolfNow
b) Continue to update website content including text and imagery, annual calendar of
Events.
c) Website provider changed mid-year - Need to install Google Analytics to continue to
collect visitor/demographic info.
2) Increase rounds booked direct via website
a) More hyperlinks on golf course e-blast to refer traffic back to website tee times page
b) Upgrade website to be more transactions (join e-club, book tee times, buy gift cards)
c) Add a Book Tee Times button on the navigation bar, more prominent placement
d) Embed the booking engine portal into the tee times page
3) Drive SEO growth through increased website traffic
a) Consider digital advertising with YELP! to increase referral traffic.
b) Update text on website regularly for search engine crawlers
c) Update text and meta-tags with keywords including woodland golf, golf bay area, northern
California golf association, golf sacramento, davis golf course to increase search rankings
and relevance
132019-2020 Marketing Plan
d) Actively manage Google Places and Yelp! Pages
e) Implement Google Analytics for improved traffic and
demographics
OLD WEBSITE HOMEPAGE
NEW WEBSITE HOMEPAGE
142019-2020 Marketing Plan
Email
Email is the most effective tool to connect with our general audience and is our primary
communication tool. Wild Wings Golf Club employs targeted email campaigns to specific customer
segments or a generalized communication approach the entire database.
Measure 2016/2017 2017/2018 2018/2019 2019/2020
Size of Database 3,950 4,565 5,118 5,500
(Unique E-mails)
Average E-mail 29% 27% 25% 25%
Open Rate
Average Click 5% 3% 2% 3%
Thru Rates
*Last updated database April 2019
Key Strategies & Tactics
1) Increase overall email database size
a) Add a Join our E Club button prominently on the website
b) Improve data capture from customers at check-in
c) Import emails from EZLinks Tee Sheet & GolfNow Central Marketing into internal databases
d) Offer contests and raffles online and in the proshop to collect more customers emails
e) Offer a special discount when they join, opt into the database on our website
f) Start utilizing GolfNow central marketing database and platform to send emails/special offers
2) Maintain average open rates
a) Continue to use specific, relevant email titles
b) Better segmentation of databases (seniors, zip codes, etc.)
c) Start implementing birthday club offers – update database collection on website
3) Increase email click-thru rates
a) Update banner / eblast header and template to a more contemporary design
b) Include more hyperlinks back to website tee times page when monthly specials are posted.
c) Include more offers and hyperlinks back to internal cybersales
d) Include links to special offers i.e coupons etc.
Digital /Social Media
Wild Wings Golf Club currently utilizes two primary social media channels to connect with our
customers and to drive revenue. The main objectives of our social media activities are to inform our
audience of current events and to visually highlight our property to encourage fan engagement and
attract new future customers. In addition to these outlets, Wild Wings also monitors online review
sites such as Golf Advisor, YELP! and Google.
152019-2020 Marketing Plan
Measure Followers 2016/2017 2017/2018 2018/2019 2019/2020
Forecast Goals
Facebook 555 594 620 650
@wildwingsgolf
Instagram 434 454 470 500
@wildwingsgolf
Twitter 245 285 300 320
@wildwingsgolf
Key Strategies & Tactics
1) Grow total number of social media followers for Wild
Wings Golf Club
a) Add Follow-Up Button on Eblasts
b) Continue to post regularly with original course
content on both Facebooth and Instagram
c) Repost content from golfers on the wildwings
page using a Repost App
d) Update content and outdated tabs including
Events tab for creative in house events
e) Link Facebook & Instagram Accounts to post on
both at the same time (due to limited staff)
2) Increase engagement levels from social media
followers
a) Run contests monthly and announce winner on
page
b) Reply to Posts & reviews in timely manner
162019-2020 Marketing Plan
c) Ask questions, caption contests and polls to encourage engagement
d) Run a social media photo contest
e) Post Tips from the Pro, Lessons on the Links, etc.
f) Consider paying for boosted posts for Events to increase awareness and participation
g) Consistently use branded # hashtags such as #golfisgreat #wildwingsgolf to track
conversation
3) Continue to Improve Online Brand Reputation
a) Continue to monitor review sites such as Google, Yelp!, Golf Advisor
and others
b) Link TrueReview InMoment survey for net promoters back to YELP! to
increase reviews
Public Relations
Wild Wings with the help of KemperSports will work with local and regional
media outlets to showcase the property. The primary objectives are to generate
more reviews, connect with our audience (brand development) and to attract
new business.
Measure Prior Year Current Year Goals for Next Year
Best Golf course in Last Won 2017, 2014, 2018 – 3rd Place Win Award in 2019
Yolo County Award – 2013, 2012, 2011,
Daily Democrat 2009, 2017
Key Strategies & Tactics
1) Pay for advertising in local newspapers serving Woodland and Vacaville
a) Offer coupon or special to track redemption and ROI
2) Local Recognition
a) Update newspaper with hole in one announcements
b) Promote golfers via email database to vote for Best of Awards in the Daily Democrat
c) Look to get voted into the Davis Enterprise – Best of Awards (Previously not recognized in
this newspaper)
3) Community Awareness
a) Better communication between golf course and HOA
b) Utilize the HOA newsletter to announce clinics and other special resident only specials
c) Keep website up to date with current events
d) Create a referring page to the HOA website, ask for hyperlink bank
172019-2020 Marketing Plan
KemperSports Marketing Channels
KemperSports offers each property internal and external support resources. In addition to the
internal Center of Excellence and best practice sharing initiatives, KemperSports offers several
business- to-consumer distribution outlets for properties under management. The primary objective
of these channels are to generate more revenue, drive customer loyalty and to attract new business
while keeping customers in the greater KemperSports family. KemperSports’ joint marketing efforts
include the following:
KemperClub – A customer community that connects KemperSports’ patrons with experiences at
other KemperSports properties throughout the country.
Email database - An expansive subscriber network that receives property promotions and
updates via email on a weekly basis
KemperClub.com – A dynamic website that showcases property offers, events and contests
at participating KemperSports facilities
KemperClub events and contests – This includes the KemperClub Championship held
annually at one of the Top 100 locations under KemperSports management
KemperSports – Overarching support channels to help generate property revenue and highlight
portfolio offerings.
KemperSports.com – Showcases company and property news, career postings and high-
level property details
KemperSports social media channels – An extensive network that garners over 1M
impressions per year and thousands of engagements per month via daily postings on four
primary platforms (Facebook, Instagram, Twitter and LinkedIn)
KemperSports media relations – In addition to press releases, our team of media experts
have developed respected relationships with the premier media outlets throughout the
country and are focused on highlighting property success
KemperSports strategic partners – KemperSports maintains relationships with preferred
vendors and strategic partners that help reduce costs and increase leverage. In addition to
product categories and services, KemperSports has negotiated preferred rates with various
media services to ensure properties receive benefits from our collective network.
182019-2020 Marketing Plan
Exhibits
Exhibit A – Brand
Overall Vision
Wild Wings Golf Club will entice golfers of all skill levels in the local and Sacramento area to
experience the best 9-hole golf course in Northern California. Wild Wings’ exceptional course
conditions rival any private or public course in the area. With premium Bermuda fairways and tees,
and carefully manicured bent grass greens, Wild Wings provides an exceptional experience at a
reasonable price. Wild Wings Golf Club is committed to providing “Best in Class” customer service
and a memorable experience to both local residents as well as visiting guests.
Brand Positioning Statement
The following brand positioning statement will serve as an internal guidepost for the Wild Wings
brand. It will be referred to in the development of all sales and marketing communication vehicles
including collateral, advertising, PR and e-marketing to drive consistency and distinguish Wild Wings
from its competitors. It will also influence the products, services and experiences that Wild Wings
provides.
“Local residents, visitors and tourists agree, Wild Wings Golf Club provides the premier 9-hole golf
experience in Yolo County. Our award-winning greens, pure Bermuda fairways, and championship
design will call you back time and again.”
Property Tagline (Brand Promise)
The following tagline crystallizes the above brand positioning into a customer-focused brand promise
and will be used on all marketing and sales vehicles, accompanying the course name and logo.
“The Best Greens in the Valley”
Design Elements
Wild Wings will use a consistent look/feel across all its communication materials including property
signage, advertising, collateral and digital marketing efforts. The property logo and tagline will be
included on all communication. The primary colors for Wild Wings are Taupe, Brown and Burgundy.
Following is example that captures the look/feel of the Wild Wings brand.
Logo
192019-2020 Marketing Plan
Exhibit B – SWOT
Strengths Weaknesses
Voted “Best Greens in the Valley” Only a 9-hole facility
Voted “Best Golf Course in Yolo County” Location is rural and a
2009, 2011, 2012, 2013, 2014 and 2017 distance from higher
Great value populated areas
Bermuda fairways year round Low golf participation from
Bent grass greens, Scenic water features local community homeowners
Easy to walk, attractive to seniors F&B capabilities and space is
Unique bunkering limited.
Variety of holes lengths including 3 par 3s, 3 Deferred Maintenance
par 4s, and 3 par 5s Cleanliness of facility
True Service Customer Service Training Limited staffing (no dedicated
Program marketing or tournament sales
Todd Eckenrode design coordinator)
Netted Driving range Lack of marketing budget
Lack of regular driving range
Opportunities Threats
El Macero CCC, Yolo Fliers Club (private club Consumers continue to be
members looking for cheaper alternative) price conscious and are still
Expansion of group and individual lesson wary of the economy,
program for latent demand spending their dollars
Increase recreational activities to attract a prudently.
larger variety of people. (i.e.; Bocce Ball Core golfer growth in the
Court, Summer concerts, etc) West, is flat to declining
Community Open House Event for HOA according to NGF Statistics
Closure of Green Tree Golf Course in Well established competition
Vacaville and Mountain Meadows in in surrounding marketplace
Woodland Weather Impacts
Expand marketing efforts to draw more
golfers from nearby Bay Area
Larger emphasis on Junior Golf in local
community including NCGA Youth on Course
Increase market share using third parties
Digital Marketing
Website Refresh
Implications: While only a 9-hole golf course, Wild Wings offers 4 different sets of tees and in July
of 2011, a two-flag system was initiated whereby 2 pin placements were placed on each green and
play is directed to yellow flags for the first nine holes of play, and to the green flags during the
second nine holes. (Yellow flags numbered 1-9, Green flags numbered 10-18). With the Driving
Range Nets erected the executive course is better able to compete with regulation length courses..
Wild Wings’ Free Golf Clinics are being offered to Wild Wings Residents to increase the number of
202019-2020 Marketing Plan
local golfers and therefore, increase golf rounds. We have joined the NCGA program “Youth on
Course”, which will attract more junior players from Northern California. Continue to monitor
competition and customer feedback and adjust strategy as needed.
Exhibit C – Competitive Market Analysis (CMA)
Wild Wings Golf Club has 3 competitors listed in the same public value category within 20 minutes,
and one other local competitor within a short distance from the club rated as Public standard
category. The chart below represents the competition in the area. Recently the club has competed
with courses outside the local comp set including courses that are ranked based on green fees in the
premium category. The course is now drawing more players from Fairfield, Vacaville and Vallejo
courses.
Competitive Cross Play Report provided by GolfNow.
212019-2020 Marketing Plan
2018 Competitive Rates Analysis
Rates are reported for 18-holes riding. Current as of Jan 1, 2018. Rates subject to change.
Competitor Rates monitored throughout the year.
Facility Name Pellucid Type Weekday Weekend Total Dist. In
GF/CF GF/CF Facility Miles
Holes
Wild Wings Golf Club Value $30 $37 9 0
Davis Municipal Golf Value $29 $35 18 8.61
Course
Wild horse Golf Course Standard $36 $56 18 11.38
Teal Bend Golf Course Standard $46-$56 $65 18 14.13
Haggin Oaks Golf Course Standard $45-58 $53-$60 36 36.2
*dynamic *dynamic
Fairfield – Rancho Solano/ Premium $50 - $65 $64 - $76 18 holes 33.9-
Paradise Valley each 38.3
HiddenBrooke Golf Club Premium $20-$39 $65-72 18 Holes 47.6
*dynamic *dynamic
Blue Rock Springs Standard $39-$42 $48-$54 18 Holes 50.3
Dynamic Each
Other Competitor Fees for 2018
Facility Name Senior 9 – Hole/ Junior Golf Now
Rates/Age Twilight
Wild Wings Golf Club N/A $21-$27 $5, $7 or YES
$12
Davis Municipal Golf Course $24 / 60yrs $21 - $23 $5 NO
Wild Horse Golf Course $37-$38 / 55yrs $30-$41 $12 YES
Teal Bend Golf Course $39 / 60yrs $36-$41 (Fri) $20 YES
Haggin Oaks Golf Course *Dynamic Only $20-$30 $16 (must YES
*dynamic have $20
play card)
Fairfield – Rancho $44-50/ 60 yrs $38 $15 YES
Solano/Paradise Valley
HiddenBrooke Golf Club Dynamic Only $20-$25 $15 YES
Blue Rock Springs Dynamic Only $18-28 $15 YES
Implications: Wild Wings Golf Club with proposed rate increase continues to remain competitive
within it market set based on competitor rates. Dynamic Pricing will be utilized on a consistent basis
to fill underutilized tee-times.
222019-2020 Marketing Plan
Key Competition Strengths & Weaknesses
Davis Municipal
Davis, CA (9 mi) 18 holes
www.davisgolfcourse.com
Strengths: Weaknesses:
Informative website Limited number of shotgun
Ability to pull from large college demographic tournament dates available each
Great beginner facility; Lessons available. year & filled on a first-come-first-
Affordable GF Rates, Monthly & Annual Play served basis
Passes Course conditions are average
Driving range with 2 practice putting greens Layout is uninteresting
Well known by Sacramento Valley golfers Out-of-bounds left on every hole,
water in play on 15 of 18 holes.
Not on GolfNow
Wild horse Golf Club
Davis, CA (11 mi) 18 holes
www.wildhorsegolfclub.com
Strengths: Weaknesses:
15 mins from downtown Sacramento Golf course is difficult to find
5 Tee Boxes play from 4,565 to 6,816 yards Routing does not flow
Fairly new facility built in 1999 Under new management with
Golf course is in good condition with nice increased golf fees
layout
Converted portion of Pro Shop to enlarge
banquet facilities
Large driving range with grass tees 24-30
stalls, Learning Center
New website with nice imagery as of 2018
Offers Annual Memberships
Dedicated Tournament Sales Director
Voted Best Golf Course in YOLO County by
David Enterprises
232019-2020 Marketing Plan
Teal Bend Golf Club
Sacramento, CA (14 mi) 18 holes
www.tealbendgolfclub.com
Strengths: Weaknesses:
Popular golf course among avid golfers Small dated clubhouse
Excellent two tiered range Course conditions are inconsistent
Scenic layout with a lot of trees
Nice practice putting green
ClubCorp Network of reciprocal courses
New website as of 2018
Dedicated Tournament Sales and Events
Director
Full Service Restaurant and banquet facilities
Ranch Solano & Paradise Valley,
Fairfield, CA (31.7 mi) - 36 holes
www.fairfieldgolf.com
Strengths: Weaknesses:
KemperSports Managed Facility Need new golf carts; carts are dated
Convenient location midway between San and breaking down leaving undesired
Francisco and Sacramento customer experiences
Two completely different styles of golf courses Golf courses are in need of capital
giving golfers variety without having to leave improvements/general maintenance,
Fairfield i.e. many tee boxes need leveling,
Course conditions rival other courses in the bunkers need sand
same class Short of adequate staffing to keep
Paradise Valley received “Best Of” award by course conditions at ideal standards
readers of the Vacaville Reporter. Rancho Due to Rancho Solano’s shorter
Solano received the “Reader’s Choice” layout, pace of play is a challenge
awards by readers of the Daily Republic Difficult to pull golfers from out of area
Positive online reviews as Fairfield is not a golf destination
Golf Performance Center at Paradise Valley, area where golfers schedule trips to
the only golf course other than Haggin Oaks visit
(Sacramento) to offer club-fitting and repair Putting green at Rancho Solano is too
within a one hour radius sloping and continuously receives
Banquet facilities can accommodate large poor remarks on surveys
groups, up to 500 at Rancho Solano. Some greens at Rancho Solano are
Loyalty of Fairfield residents considered too difficult
Paradise Valley has above average practice Uphill driving range and sloping
facilities: designated short game practice area practice putting green at Rancho
with bunker, large putting green and lighted Solano are not popular among golfers
range. Length of Rancho Solano is short in
comparison to today’s standards
242019-2020 Marketing Plan
Designated covered lesson area with year Some of the large businesses that
round turf were in Fairfield have relocated out of
Golf carts equipped with GPS state. There are limited corporate
Both courses are women friendly courses and businesses to solicit for large
recognized as such by the EWGA (Executive corporate tournaments or outings
Women’s Golf Association)
Dedicated Sales & Marketing Director
Hiddenbrooke Golf Club
Vallejo, CA (47.6 mi) - 18 holes
www.hiddenbookegolf,com
Strengths: Weaknesses:
Troon Managed Property Staff turnover including sales staff and
Central location off freeway General Manager
Popular golf course among avid golfers Trouble paying vendors
Well known in area Trouble paying staffers
Running digital ads via Google Adwords Condition of course
Full service restaurant and banquet facilities Clubhouse is outdated and need
major capital improvements (example:
HVAC system not working)
Course conditions are inconsistent
Blue Rock Springs
Vallejo, CA (50.3 mi) 36 holes
www.bluerocksprings.com
Strengths: Weaknesses:
Recently under new management with Small dated clubhouse
considerable capital improvements Course conditions are inconsistent
Located in Bay Area near high populations Improvements to paying conditions
Recent positive press with new managements are yet to be seen.
and upgrades
28 stall, lighted driving range
West Course, Par 71, East Course, Par 70
Sweeping views of the Bay including Mt.
Tamalpais
Full service restaurant and banquet facilities
252019-2020 Marketing Plan
Exhibit D – Customer Insights & Survey Results
KemperSports True Review
The TrueReview quality survey is administered as part of a thank you communication immediately
following a customer’s round. This survey helps us make immediate improvements to all aspects of
our operations to ensure we are providing the best possible customer experience. Below are key
learnings and implications from our TrueReview Survey.
This survey tool was conducted throughout the year with 424 total responses from July 2017 through
July 2018 and held a 76.8%
For the current fiscal year July 1, 2018 thru April 24, 2019 the club is trending at an NPS of 81.5%
with 324 surveys returned thus far. This is an improvement over prior year by nearly 5 percent.
Implications: Wild Wings NPS (Net Promoter Score) measures above our company benchmark of
70. Wild Wings continues to deliver consistently high rankings.
262019-2020 Marketing Plan
NGF GolfSAT
This customized annual survey is administered on-line and serves as
critical input for building annual property business plans. Insights gathered
include customer demographics, customer play patterns, loyalty metrics, market share, competitive
benchmarking and marketing program impact. The last survey was done in 2016, A s an incentive to
respondents who completed the survey, Wild Wings Golf Club offered a coupon for 20% off
non-sale merchandise. As a result, only 111 customers completed the survey. Wild Wings Golf
Club implemented the National Golf Foundation’s customer loyalty survey (GolfSAT) from
August 10, 2018 until August 29, 2018. The survey consisted of 27 questions distributed to
email addresses compiled from Wild Wing’s customer database. As an incentive to
respondents who completed the survey, Wild Wings Golf Club offered a coupon for - $40 which
included 18-hole round of golf for TWO players with shared cart. PLUS, 20% off non-sale
merchandise in golf shop on your day of play. As a result, 257 customers completed the
survey.
2018
Loyalty Drivers
272019-2020 Marketing Plan
Average
Score Value Loyalty
Factor (Scale 1-10) Percentile * Driver
1 Overall Value 8.6 76 58
2 Convenience of Course Location 8.0 14 19
3 Tee Time Availability 8.9 85 46
4 Overall Course Conditions 8.2 79 62
5 Condition of Greens 9.0 97 40
6 Scenery and Aesthetics of Course 7.6 34 53
7 Pace of Play 8.1 90 43
8 Condition of Golf Cars 8.3 70 32
9 Amenities (clubhouse, pro shop, locker room) 6.6 21 46
10 Friendliness/Helpfulness of Staff 9.1 85 52
11 Food and Beverage Service 5.7 5 30
12 On-course Services (restrooms, drinking water) 6.8 33 36
13 Overall Experience 8.5 80 68
14 Affordability 8.6 67 38
15 Condition of Tees 8.2 88 52
16 Condition of Bunkers 6.8 55 39
17 Condition of Fairways 7.8 57 57
18 Overall Quality of Practice Facility 5.4 7 35
19 Golf Course Design/Layout 8.3 70 55
20 Overall Quality of Golf Shop 7.6 47 56
21 Overall Quality of Golf Shop Apparel 7.3 35 53
22 Overall Quality of Golf Shop Merchandise 7.5 70 46
282019-2020 Marketing Plan
2018
Competition/ Wallet Share
Courses
that
Customers
also Play:
Davis Municipal Golf Course 42%
Wildhorse Golf Club 23%
Teal Bend Golf Course 22%
Paradise Valley Golf Course 14%
Cherry Island Golf Course 14%
Bing Maloney Golf Course 11%
Haggin Oaks Golf Complex 11%
Rancho Solano Golf Course 11%
Yocha Dehe Golf Club 11%
Bartley Cavanaugh Golf Course 10%
Yolo Fliers Club 9%
Blue Rock Springs Golf Club 8%
Cypress Lakes Golf Course 8%
Arbuckle Golf Club 7%
Mare Island Golf Club 7%
292019-2020 Marketing Plan
Customer Origins
Woodland, CA
1% Davis, CA
2%
Vacaville, CA
15%
2% Sacramento, CA
2% Dixon, CA
2% 41%
Carmichael, CA
4%
Loomis, CA
10% Winters, CA
Zamora, CA
10%
11% Roseville, CA
Other
(Other – Antelopt, CA; Citrus Heights, CA; Clearlake Oaks, CA; El Dorado Hills, CA; El Macero, CA;
Elk Grove, CA; El Mira, CA; Fair Oaks, CA; Fairfield, CA; Lincoln, CA; Manchester, GA;
Martinez, CA; Marysville, CA; Merced, CA; Napa, CA; Oakland, CA; Pollock Pines, CA;
Rancho Cordova, CA; Rio Linda, CA; Rio Vista, CA; Rocklin, CA; Suisun City, CA;
Vallejo, CA; Weimar, CA; West Sacramento, CA; Woodbridge, CA)
Exhibit E – Local Market Situation Analysis
According to the NGF Golf Map data from 2017, there are 16,627 golfing households with a 12.1%
participation rate within 20 miles of the golf course. There are also 10 golf courses within 20 miles of
Wild Wings, of which 5 are “Private”, 3 are “Public Standard”, and 2 are “Public Value”. This speaks
to the price conscious market.
Within the local market (20 miles) there is only 24,344 total golfers from 16,627 golfing households.
However, when you expand the market out a 40-mile radius from the course, these numbers
increase to 103,454 golfing households and 150,519 golfers, respectively. This indicates that the
course should look to increase customers from a 40-mile radius from the course, specifically
Sacramento, Fairfield and Vacaville to increase awareness and rounds played. Creating more
demand for Wild Wings, from a larger marketing is key, especially since the immediate market has
too much supply relative to the low demand.
302019-2020 Marketing Plan
Demographic Summary
Radial
Trade
Radial Trade Area, Radial Trade
Area,
20 miles Area, 40 miles
10
miles
Total Population 120,044 388,310 2,548,464
Projected Population (2022) 130,846 416,805 2,705,061
Projected Annual Growth Rate 1.7% 1.4% 1.2%
Total Households 41,230 137,240 909,965
Median Household Income $58,028 $71,138 $66,889
Median Age 30.0 34.2 36.7
Demand Indicators
Radial
Trade
Radial Trade Area, Radial Trade
Area,
20 miles Area, 40 miles
10
miles
Number of Golfing Households 4,652 16,627 103,454
Projected Golfing Households (2022) 4,799 17,304 108,006
Household Participation Rate 11.3% 12.1% 11.4%
Number of Golfers 7,165 24,344 150,519
Latent Demand/Interested Non-Golfers 14,925 46,998 329,024
Rounds Potential (resident golfers) 102,423 416,145 2,576,718
Est. Course Rounds (in-market supply) 190,200 504,967 2,938,092
Supply Indicators (18-Hole Equivalent)
Radial
Trade
Radial Trade Area, Radial Trade
Area,
20 miles Area, 40 miles
10
miles
Total Supply 3.0 10.0 52.0
Private 1.0 5.0 12.0
Public: Premium (>$70) 0.0 0.0 5.0
Public: Standard ($40-$70) 0.0 3.0 26.5
Public: Value (2019-2020 Marketing Plan
Wild Wings Golf Club - Radial Trade Area, 40 miles
322019-2020 Marketing Plan
Exhibit F – Outing Pace Report
:::X:::
Month End OUTING Pace Report
Wild Wings Data as of Month Ending: March2019
Year End: June2019
Current Actual + Variance to Contracted % of Contract Variance to LY Actual + LY Pace to LY LY ACTUAL
Month Booked Budget % of Budget Budget (Booked) Realized Contract Booked Actual + Booked TOTAL
July2018 $ 360 $ 2,800 13% $ (2,440) $ 2,404 15% $ (2,044) $ 1,194 -70% $ 1,194
August2018 $ - $ 1,700 0% $ (1,700) $ - $ - $ 2,184 -100% $ 2,184
September2018 $ 1,820 $ 3,000 61% $ (1,180) $ 1,760 103% $ 60 $ 353 416% $ 353
October2018 $ 1,800 $ 2,000 90% $ (200) $ 1,500 120% $ 300 $ 1,175 53% $ 1,175
November2018 $ - $ 1,000 0% $ (1,000) $ - $ - $ 896 -100% $ 896
December2018 $ - $ - $ - $ - $ - $ 896 -100% $ 896
January2019 $ - $ - $ - $ - $ - $ - $ -
February2019 $ - $ - $ - $ - $ - $ 272 -100% $ 272
March2019 $ 2,100 $ 1,000 210% $ 1,100 $ 3,392 62% $ (1,292) $ 1,122 87% $ 1,122
April2019 $ 3,896 $ 2,000 195% $ 1,896 $ 3,896 24% $ (2,949) $ - $ 1,678
May2019 $ 9,088 $ 1,000 909% $ 8,088 $ 9,088 0% $ (9,088) $ 4,350 109% $ 4,834
June2019 $ 456 $ 1,500 30% $ (1,044) $ 456 0% $ (456) $ 1,632 -72% $ 1,816
Total $ 19,520 $ 16,000 122% $ 3,520 $ 22,496 31% $ (15,469) $ 14,074 39% $ 16,420
Current Year to Date Analysis Bookings Pace LY Future Bookings Future Bookings
LY Future
Actual Total Number of Current Year Last Year Contract Future Contract Next Year
MONTH Revenue Events Pipeline Booking/Month Booking/Month MONTH Revenue MONTH Revenue Pipeline
July2018 $ 360 3 $ - $ - $ 2,520 July2018 $ 360 July2019 $ 740 $ -
August2018 $ - - $ - $ 740 $ 540 August2018 $ - August2019 $ - $ -
September2018 $ 1,820 1 $ - $ - $ 1,792 September2018 $ 1,760 September2019 $ 456 $ -
October2018 $ 1,800 1 $ - $ 7,240 $ - October2018 $ 1,500 October2019 $ - $ -
November2018 $ - - $ - $ - $ 2,482 November2018 $ - November2019 $ - $ -
December2018 $ - - $ - $ 850 $ 680 December2018 $ - December2019 $ - $ -
January2019 $ - - $ - $ - $ 4,220 January2019 $ - January2020 $ 850 $ -
February2019 $ - - $ - $ 2,176 $ 1,232 February2019 $ - February2020 $ - $ -
March2019 $ 2,100 3 $ - $ 3,120 $ 2,540 March2019 $ - March2020 $ - $ -
April2019 $ 947 3 $ - $ 488 $ 3,054 April2019 $ - April2020 $ - $ -
May2019 $ - 4 $ - $ - $ - May2019 $ - May2020 $ - $ -
June2019 $ - 1 $ - $ - $ 2,044 June2019 $ - June2020 $ - $ -
Total $ 7,027 16 $ - $ 14,614 $ 21,104 Total $ 3,620 Total $ 2,046 $ -
JWL ANALYSIS 19% $ 11,033
332019-2020 Marketing Plan
Exhibit G – Utilization Reports
Rounds Report with Utilization Wild Wings GC
(by Course / DOW / Hour, with Utilization)
Between 7/1/2018 and 4/24/2019
Total Green
Day of Week Hour # Golfers APR Sold Open Utilization % # Golfers ($0)
Fees
Wild Wings GC
Monday
6 AM 8 $195.00 $24.38 13 436 2.98% 5
7 AM 49 $1,119.46 $22.85 75 936 8.01% 26
8 AM 114 $2,855.43 $25.05 152 983 15.46% 38
9 AM 110 $2,596.74 $23.61 242 947 25.55% 132
10 AM 148 $3,337.79 $22.55 176 865 20.35% 28
11 AM 71 $1,490.60 $20.99 192 783 24.52% 121
12 PM 47 $979.35 $20.84 120 879 13.65% 73
1 PM 154 $2,867.00 $18.62 178 819 21.73% 24
2 PM 53 $859.20 $16.21 91 871 10.45% 38
3 PM 59 $976.00 $16.54 92 874 10.53% 33
4 PM 44 $736.60 $16.74 61 921 6.62% 17
5 PM 13 $215.00 $16.54 14 853 1.64% 1
6 PM 7 $107.00 $15.29 7 867 0.81% 0
7 PM 0 $0.00 $0.00 0 590 0.00% 0
Total per Day: 877 $18,335.17 $20.91 1413 11624 12.16% 536
Tuesday
6 AM 8 $167.00 $20.88 30 444 6.76% 22
7 AM 35 $808.00 $23.09 62 912 6.80% 27
8 AM 101 $2,498.10 $24.73 134 957 14.00% 33
9 AM 166 $3,743.50 $22.55 280 935 29.95% 114
10 AM 268 $5,502.20 $20.53 296 893 33.15% 28
11 AM 75 $1,448.50 $19.31 175 785 22.29% 100
12 PM 76 $1,887.70 $24.84 139 868 16.01% 63
1 PM 136 $2,484.50 $18.27 167 860 19.42% 31
2 PM 43 $749.20 $17.42 84 864 9.72% 41
3 PM 83 $1,416.00 $17.06 113 888 12.73% 30
4 PM 74 $1,226.00 $16.57 88 924 9.52% 14
5 PM 42 $712.00 $16.95 53 864 6.13% 11
6 PM 2 $28.00 $14.00 3 890 0.34% 1
7 PM 0 $0.00 $0.00 0 593 0.00% 0
Total per Day: 1109 $22,670.70 $20.44 1624 11677 13.91% 515
Wednesday
6 AM 13 $346.00 $26.62 21 432 4.86% 8
7 AM 32 $736.40 $23.01 54 913 5.91% 22
8 AM 115 $2,790.74 $24.27 159 992 16.03% 44
9 AM 146 $3,341.00 $22.88 291 966 30.12% 145
10 AM 168 $3,832.30 $22.81 201 872 23.05% 33
11 AM 48 $1,083.80 $22.58 130 763 17.04% 82
12 PM 62 $1,363.15 $21.99 138 869 15.88% 76
1 PM 152 $2,923.20 $19.23 171 891 19.19% 19
2 PM 129 $2,104.40 $16.31 159 886 17.95% 30
3 PM 95 $1,526.00 $16.06 109 870 12.53% 14
4 PM 78 $1,286.00 $16.49 89 931 9.56% 11
5 PM 73 $1,065.00 $14.59 73 868 8.41% 0
6 PM 7 $87.00 $12.43 7 854 0.82% 0
7 PM 0 $0.00 $0.00 0 563 0.00% 0
Total per Day: 1118 $22,484.99 $20.11 1602 11670 13.73% 484
34You can also read