MTN Rwanda Investor presentation April 2021 - Leading Digital solutions for Africa's progress - MTN Group

Page created by Aaron Howard
 
CONTINUE READING
MTN Rwanda Investor presentation April 2021 - Leading Digital solutions for Africa's progress - MTN Group
MTN Rwanda
                Investor presentation
                April 2021
Leading Digital solutions for Africa’s progress
MTN Rwanda Investor presentation April 2021 - Leading Digital solutions for Africa's progress - MTN Group
Welcome & Introduction
Teta Mpyisi | Facilitator
MTN Rwanda Investor presentation April 2021 - Leading Digital solutions for Africa's progress - MTN Group
Today’s speakers

           Mitwa Ng’ambi                             Mark Nkurunziza                                   Yolanda Cuba                            Carine Umutoni

        MTN Rwandacell CEO                        MTN Rwandacell CFO                        MTN Group VP, SEA Region                           BK Capital CEO

 • Joined MTN Rwanda in 2019                • Joined MTN Rwanda in 2019                     • Joined MTN Group in 2020
                                                                                                                                     • Joined BK Group PLC in 2012
 • Formerly CEO of Airtel-Tigo Ghana        • Formerly CFO of                               • As Vice President of Southern & East
                                                                                                                                     • She is a seasoned Banker, and is the CEO
                                              Rwanda Development Board                        Africa (SEA), she oversees Uganda,
 • Was also CEO of Tigo Senegal                                                                                                        of BK Capital, which is the Lead
                                                                                              Zambia, Rwanda, South Sudan &
                                            • Has over 20 years of experience in              Eswatini                                 Transaction Advisor for the MTN Listing
 • She is a seasoned leader with a career     financial and risk management                                                            on the RSE
   spanning more than 10 years in the                                                       • Formerly Vodacom Group Chief
   telecom sector. She also has extensive   • He also had a stint in the aviation             Strategy Officer and also CEO of       • She has 17 years experience in Treasury
   experience in commercial, technology       industry when he served at the National         Vodafone Ghana                           & Global Banking, Trade Finance,
   and developing growth strategies.          Airline, RwandAir as Finance Manager.                                                    Investment Banking and Asset
                                                                                            • Wealth of experience in telecoms,        Management.
                                                                                              financial services and FMCG.

                                                                                        3
MTN Rwanda Investor presentation April 2021 - Leading Digital solutions for Africa's progress - MTN Group
Agenda
 1   MTN Group at a glance
 2   MTN Rwanda at a glance
 3   An overview of Rwanda
 4   Corporate Governance & Regulatory Context
 5   Evolution of MTN Rwanda
 6   Strategy & Growth Opportunities
 7   Conclusion
 8   Listing Details
 9   Q&A
MTN Rwanda Investor presentation April 2021 - Leading Digital solutions for Africa's progress - MTN Group
MTN Group at a glance
                Yolanda Cuba | MTN Group Vice President, Southern & East Africa (SEA) Region
Leading digital solutions for Africa’s progress
MTN Rwanda Investor presentation April 2021 - Leading Digital solutions for Africa's progress - MTN Group
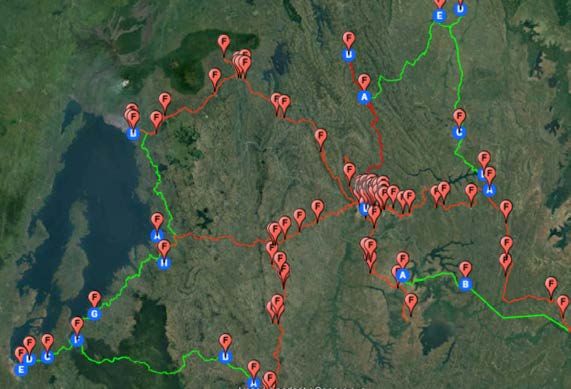
The journey of progress over the last 4 years
   A foundation of commercial and operational excellence

                      Growing                                                                                                                           Expanding
                      subscribers                                                                                                                       data coverage
                                                                             251m   280m
                                                    233m                                                                                                                            504m
                             217m                                                   114m
                   Total                                                                                                                                                   481m
                                                                             95m
                                                                                     46m                                                             375m
                                                                                                                                                                   a
                                                                                                                                                                436m
                                                     79m                                            #Largest
            Data users        69m                                            35m                  market share in
                                                     27m
         MoMo users           22m                                                                            13
                                                                                                         countries
                              2017                  2018                     2019   2020
                                                                                                                                                     2017       2018       2019     2020

                      Financial                                                                          Holdco leverage progression                    ROE progression
                      performance
                                                                                                                     R57,5bn
                                                                                    11,9%                                                                                         17,0%
                                              10,7%                                                                              R55,3bn
                                                                        9,8%                             R51,7bn
                                                                                    42,7%                            51,6%                           12,7%                13,0%
Service revenue*     7,2%                                                                                                        50,0%                         11,5%
                                                                       35,3%                 USD/EUR      54,4%                            R43,3bn
                                             35,2%                                                                                         48,0%
 EBITDA margins     33,5%                                                                          ZAR    45,6%      48,4%       50,0%
                                                                                                                                           52,0%

                                                                                                           2017       2018        2019      2020
                     2017                      2018                     2019        2020
                                                                                                           2,7x       2,3x         2,2x      2,2x
      *Constant currency, ^constant currency on IAS 17 basis for 2017-2019                  Leverage                                                 2017       2018      2019    2020

                                                                                                                             6
MTN Rwanda Investor presentation April 2021 - Leading Digital solutions for Africa's progress - MTN Group
MTN Group | Ambition 2025

 Belief statement                         “Everybody deserves the benefits of a modern connected life”

 Strategic intent                         Ambition 2025: “Leading digital solutions for Africa’s progress”

                         Build the

    25
                                                        Drive
                        largest                                                           Create                 Accelerate portfolio
                    & most valuable
                                             industry-leading                         shared value               transformation
                                           connectivity operations
    strategic         platforms
    priorities

                                       Best talent, culture &                                                              Technology
                    Leading customer                                Value based capital                ESG
   Vital enablers                           future skills                                                             platforms second to
                       experience                                      allocation                  at the core
                                                                                                                              none

        Values         Leadership           Integrity                 Relationships                Innovation               Can-Do

                                                                7
MTN Rwanda Investor presentation April 2021 - Leading Digital solutions for Africa's progress - MTN Group
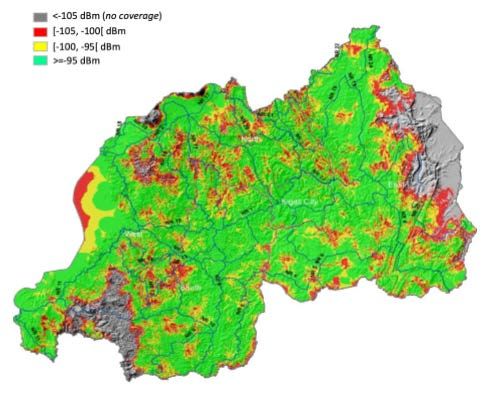
Environment, Social and Governance
Good progress in ESG, but more to achieve | Commitment to net zero emissions by 2040 | Driving digital & financial inclusion

                       Eco-                                 Sustainable                                                                Economic
                                                                                                    Governance
                       responsibility                       Societies                                                                  value-added

                         47%                                32,9%                                   79%*                               >R50 billion
                         average reduction in absolute      average reduction in data tariff,       increase in reputation and trust   expenditure on networks in
                         emissions (tCO2e) for scope 1, 2   bringing down the cost to               with stakeholders                  support of fixed investment in
                         and 3 by 2030 and net-zero by      communicate                                                                our markets
                         2040
                                                                                                    Ranked 7th of
                                                             US$152 billion                                                            >R30 billion
                        77,6%                                value of MoMo transactions,
                                                                                                    telecommunications companies
                                                                                                    on 2020 Ranking Digital Rights      tax contribution to host
                        average reduction in energy          advancing financial                    Index – greatest overall
                                                             inclusion                                                                  nations fiscus
                        consumption per subscriber by                                               improvement
                        2030
                                                            33%                                                                        ~5 million
                       1 330                                female representation at                10 284                             strong distribution agent
                       sites powered by renewable energy    Board and 29% at senior                 ethics e-learning modules          network, promoting enterprise
                                                            management levelˆ                       completed by staff                 and employment

* Based on annual Reputation Index Survey

                                                                                                8
MTN Rwanda Investor presentation April 2021 - Leading Digital solutions for Africa's progress - MTN Group
MTN Rwanda at a glance
                Mitwa Kaemba Ng’ambi | Chief Executive Officer
Leading Digital solutions for Africa’s progress
MTN Rwanda Investor presentation April 2021 - Leading Digital solutions for Africa's progress - MTN Group
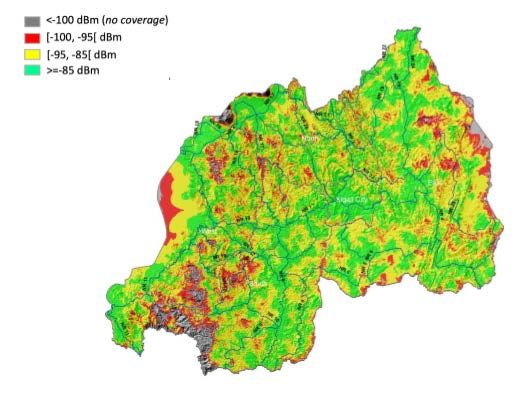
MTN Rwanda | Leading mobile operator in Rwanda

                   Growing                                                                                                           Financial
                   subscribers                                                                                                       performance
                                                                                                                                                                       152
                                                  6.1m                                                                                              125
                                                                             #Largest
Total
                                    4.5m
                                           5.2m

                                                               Customer Market
                                                                                                        62%         Total revenue
                                                                                                                          (Frw bn)
                                                                                                                                       103

                                                                             share in
Data users                          0.9m   1.3m   1.6m                                                           EBITDA margins        29.2%       40.6%               49.0%

MoMo users                          2.1m   2.7m   3.2m
                                                                            Rwanda
MTNR defines Data & MoMo users as   2018   2019   2020                                                                                 2018        2019                2020
those active in 30 days

                   Technology                                               Network Sites                                            Digital
                   investment                                                                                                        subscribers
                                           22%    15%
Capex intensity                      22%
                                            27
                                                         Population
                                                         coverage
                                                                                   89%           94%      95%                                                239K
                                                                                                                                                               ayoba
                                     23           23                                             849      917
                                                                                   763                                                                         Users

                                                         Total # of sites
                                                                                                                                                              +1K
                                                                                                                                                              Homes
                                                                                                                                                          Connected(Fibre)
                                    2018   2019   2020                             2018          2019     2020

                                                                                            10
An overview of Rwanda
                Mitwa Kaemba Ng’ambi | Chief Executive Officer
Leading Digital solutions for Africa’s progress
Rwanda | Economic overview

                    Rwanda has demonstrated strong economic growth…                                                            …supported by stable macro-economics variables
       Real GDP Growth %                                                                                                                                                 Average inflation
                                                                                                               10               9.4
        15                                                                                                                                                               Average USD/FRw depreciation

                                                                                                                  8                                                                          6.9
        10                                                               9.4
                          8.9                                   8.6                                                      5.5
                                                                                                                                5.7            5.6                                                      5.5
                                       6.0                                                                        6                                                                      5.5
           5                                                                               5.7                                                                            4.5
                                                    4.0                                                                                       4.8
                                                                                                                  4                                         3.6
                                                                                                                         2.5                                                 2.4
           0
                                                                                                                                                              1.4
                                                                                                                  2                                                                                     1.0
                                                                                  -3.4
           -5
                                                                                                                  0
                   2015         2016          2017        2018        2019     2020      2021                         2015      2016          2017           2018         2019           2020       2021

                    6.2         6.9          7.7          8.3          9.1     9.9       10.6    Nominal GDP
                                                                                                 FRw’T

                   11.3         11.5         11.8         12.1        12.3     12.7      13.0    Population (Millions)

                                                                                                   Commentary
       •        Historical real GDP growth in Rwanda was primarily driven by private consumption and fixed investment.
       •        Rwanda’s Real GDP in 2020 experienced a recession due to the Covid-19 pandemic, declining by -3.4%.
       •        Going forward, economic growth is projected to start recovering from early 2021, led by the industrial sector and a rebound in private investment and consumption.
       •        The National Bank of Rwanda (BNR) has successfully maintained average inflation and exchange rate depreciation within single digits.

Source: BNR and IMF WEO                                                                                      12
Rwanda | Impact of COVID-19

                                                 GDP growth                                                                                                # of Mobile Money Transactions
                                            2019 – 2022 (Projected)                                                                                                 2019 – 2020
                  9.4%      9.4%
                                                8.0%                         8.0%                 8.0%                                                                                         701
                                                                                           6.8%                                                     379
                                                                      5.7%

                                                                                                                                                   2019                                       2020

                                                                                                                                                     Value of Mobile Money Transactions (Frw billion)
                    2019 Act.             2020 Act.                    2021 Proj.           2022 Proj.                                                                2019 – 2020
                                                                                                                                                                                             7 177
                                        -3.4%
                                                                                                                                                 2 349

                                       GDP growth      GDP growth without covid 19
                                                                                                                                                 2019                                        2020

                                                                                                         Commentary
     • In 2020, Rwanda recorded a negative GDP growth for the first time in the last two decades due to the effects of the covid-19 pandemic on Rwanda’s economic activity. These effects included the
       implementation of lockdown restrictions critical to slowing the spread of the virus, which curtailed economic activity.

     • The Government of Rwanda initiated a swift and robust response to the pandemic, with the adoption of the Economic Recovery Plan (ERP) estimated to grow to FRw 350Billion over the two fiscal years 2019/20
       and 2020/21. The recovery plan aims to scale up social safety net programs for the most vulnerable, build key infrastructure and support strategic enterprises, including small- and medium-size enterprises.

     • The Government’s swift and efficient response to the pandemic has largely mitigated the potentially significant negative impact on essential health and nutrition services with mass testing of the population and
       distribution of vaccines across most vulnerable groups and society in general. Current vaccinations stand at 389K.

     • The Mobile financial services sector benefited from various policies as cash based transactions as a percentage of overall transactions significantly reduced in 2020 as a consequence of various policies taken to
       encourage digital payments and slow down progression of the covid-19 pandemic.

Source: BNR, NISR, World Bank
                                                                                                                13
Rwanda | National Strategy & Vision 2050

                                                      Future growth drivers                                                                                          Commentary

                                                                                          Highly                                  •   National Strategy for Transformation (NST1) seeks to implement an economic,
                                              Trade and                                 developed                                     social and transformational governance progress by 2024.
                                               regional                                human capital
                                             integration
                                                                                                                                  •   The NST1 Government priority projects that are likely to positively impact the
                                                                                                                                      Telecommunication Sector, and are In line with the Economic Transformation
                                                                                                                                      pillar, include:
                  Modern
                agriculture/                                                                                                          - A drive for digital penetration and literacy;
                                                               Drivers of                              Competitive
                food sector
                                                                growth                                  domestic                      - Promotion of the ‘Made in Rwanda’ brand working with the private sector;
                                                                                                       enterprises
                                                                                                                                      - Development of Business process outsourcing (BPO);

                                                                                                                                      - Leveraging Kigali Innovation City as a mechanism to spur ICT services.
                                  Capable and                                       Well managed
                                  accountable                                       urbanization
                                  institutions

                                                                                              Vision 2050 objectives cutting across the telecoms sector

         Rwanda’s long-term development goals are defined in “Vision 2050,” a strategy that seeks to transform the country from a low-income, agriculture-based economy to a knowledge-based,
                                                                  service-oriented economy with high-income country status by 2050.

          Indicator                                                                                                           Baseline - 2018                      Target 2035                         Target 2050

          Percentage of public services rendered fully online                                                                         40%                              100%                               100%

Years Government Programme: National Strategy for Transformation (NST1) 2017–2024
Vision 2050 Targets
                                                                                                                             14
Rwanda | Industry overview

                            Rwanda has a high mobile phone penetration rate…                                                …with internet penetration rapidly growing

      Mobile phone subscription (millions)                                                                  Internet subscriptions (millions)
                                                                         9,7     9,6     10.6                                                                                  7,9
        10                   8,9                    8,8                                                 8                                                          7,4
         8                                                                                                                                        6,2
                                                                                                        6                          5,3
         6                                                                                                          4,1
                                                                                                        4
         4
         2                                                                                              2
         0                                                                                              0
                         2016                       2017                 2018     2019   2020                     2016             2017          2018              2019        2020
                          79.2%                     76.5%                82.1%   78.1%   83.8%                      36.6%           45.5%          52.1%           60.4%       63.1%
                                                            Penetration rate                                                                    Penetration rate

                                                                                         Commentary

          •      Mobile subscriber growth has been driven by favourable economic conditions, robust distribution, expanding population coverage, lower tariffs and product innovation.
          •      A high mobile penetration rate has enabled the use of mobile phones for digitization of other services , such as mobile banking services and government services.
          •      Internet penetration rapidly increasing mainly due to growing incomes, improved access, flexible pricing of Internet bundles and smartphones in the country.

Source: RURA Quarterly Telecoms Statistics Report
                                                                                                   15
Rwanda | Market Landscape

                                                                Rwanda is a two-player mobile operator market.
                                                               MTN has grown its market share by 16pp in the last 5 years.
      Market share by mobile subscribers(%)

                                     46%                      42%                                48%                               55%                                62%

                                     18%                      19%
                                                                                                 52%                               45%
                                     36%                      39%                                                                                                     38%

                                    2016                      2017                              2018                               2019                              2020
                                                                            Competitor 1     Competitor 2    MTN Rwandacell

                                                                                           Commentary
          •     MTN Rwanda is the leading mobile network operator in Rwanda with 6.1m MTN Rwanda subscribers and about 62% of mobile subscriber market share as of December 2020.
          •     MTN Rwanda had 5.1 million Internet subscriptions for data (internet) services, the highest number of subscribers held by a telecoms service provider in Rwanda.
          •     In 2018, two of MTN Rwanda’s competitors consolidated to form a single entity with the leading market share. By 2019, MTN Rwanda was able to recover its position as
                market leader.

Source: RURA Quarterly Telecoms Statistics Report
                                                                                                 16
Corporate Governance & Regulatory Context
                Mitwa Kaemba Ng’ambi | Chief Executive Officer
Leading Digital solutions for Africa’s progress
Board | Diverse knowledge & experience

                                                                                               Board of Directors(1)                                                                                                          Commentary

                                                                                    Evelyn Rutagwenda
                                                                                                                                                                                                              • The Board has broad experience across
                                                                                    Non –Executive Chairperson
                                                                                    Since 2017
                                                                                                                                                                                                                geographies and sectors, well-placed to
                                                                                                                                                                                                                provide guidance and oversight.

                                                                                                                                                                                                                 − MTN Group representation affirms
                                                                            Nosipho Molope                                                                                                                         commitment to MTN Rwanda and reflects
          Ricardo Varzielas                                                                                                                       Yolanda Cuba
          Non-Executive                                                     Independent,                                                          Non-Executive
                                                                                                                                                                                                                   the importance of MTN Rwanda to MTN
          Director                                                          Non-Executive Director                                                Director                                                         Group.

          Since 2018                                                        Since 2014                                                            Since 2020                                                     − Highly respected local directors bring
                                                                                                                                                                                                                   substantial experience.

                                                                                                                                                                                                              • On an ongoing basis Directors undergo
          Regis Rugemanshuro                                                Mitwa Ng’ambi
          Non-Executive
                                                                                                                                                  Mark Nkurunziza                                               specific and relevant corporate governance
          Director
                                                                            Executive Director                                                    Executive Director                                            training.

          Since 2020                                                        Since 2019                                                            Since 2019

                                                                                             Board Committees

                   Audit, Risk Management and Compliance Committee                                                  Remuneration, Human Resources and Social and Ethics
                                                                                                                                      Committee

Source: Company information
Notes: (1) Within 6 months of conclusion of the listing, the Board of MTN Rwandacell PLC will be reconstituted in order to comply with all Listing Rules and Regulations pertaining to corporate governance

                                                                                                                                                            18
Stakeholders | Key government agencies & regulators

     Rwanda Utilities Regulatory                                                              National Bank of Rwanda
     Authority
     • Responsible for regulating telecommunications, information & communication         • Responsible for Monetary Policy to create price stability, issue legal tender
       technology, and broadcasting. Also oversees converging electronic technologies,      currency in Rwanda, promote a sound financial system and act as Banker and
       including the internet and any other audio-visual information and                    provide economic and financial advice to the Rwanda Government.
       communication technology.
                                                                                          • Also regulates the mobile money industry.
     • Also regulates Transport and Utilities.

       Ministry of ICT & Innovation                                                           Rwanda Information Society
                                                                                              Authority
                                                                                          • Has the mission of digitizing the Rwandan society through an increased usage
     • Addresses national priorities relating to economic growth and poverty reduction      of ICT as a crosscutting enabler for the development of other
       through development and coordination of national policies and programs related       sectors "Championing Rwanda's Digital Transformation“.
       to information, technology, communication and innovation as well as citizens’
       empowerment.

                                                                                         19
MTN Rwanda | Licenses

     Licensed by both BNR and RURA, MTN Rwandacell PLC holds the following licenses

                            Type                                 Date of Issue                         Duration                         Expiry Date                  Option for Renewal

        Mobile Cellular Licence and Second               • 8 November 2008                  • 13 Years                          • 30 Jun 20213                  • 15 Years
                Operator License

                        (2G, 3G)1

               Radio Frequency License2                  • 17 March 2008                    • 13 Years                          • 30 Jun 20213                  • 15 Years

               Payment Service Provider                  • 29 January 2016                  • Until revoked                     • N/A                           • N/A

       1.   MTN Rwandacell’s operating license does not permit it to directly operate a 4G network. KT Rwanda Networks Ltd holds a 25 year license to operate as a wholesaler of this technology till 2039.

       2.   MTN is assigned spectrum in the 900mhz (15.8), 1800mhz (25) , 2100mhz (20) and 3500mhz (88) bands.

       3.   MTN Rwanda currently undergoing License Renewal process.

                                                                                                            20
MTN Rwanda | Regulatory Matters

         MTN Rwanda has a strong professional working relationship with its’ Regulators which is maintained through regular and transparent engagement.

                 Key Matter                                                                                   Description
    Regulatory Annual Fees                 MTN Rwanda pays to the Rwanda Utilities Regulatory Authority the following annual fees:
                                                  Regulatory Fees
                                                  Universal Access Fund contribution
                                                  Spectrum Fees
                                                  Numbering Fees
    Prime Minister’s Order on Community-   Under this Order, Telecommunication Companies are required to pay 2.5% of the Company’s annual turnover into the community based health
    Based Health Insurance                 subsidy scheme. This will increase to 3% in 2023.

    Key Engagements (GSM)                  MTN Rwanda is in constant engagement with the Rwanda Utilities Regulatory Authority on matters arising, including;
                                                  Network Coverage and Quality of Service
                                                  Cyber Security Strengthening

    Key Engagements (Mobile Money)         MTN Rwanda is in constant engagement with the National Bank of Rwanda on matters arising, including;
                                                  Interoperability for e-money payments
                                                  Mobile Money Fraud Management

    Anticipated Regulations/Laws           Current Regulations & Laws that are in draft form or in process of promulgation
                                                    Regulation Governing Electronic Communication Licensing Framework
                                                    Regulation Governing Use of Personal Data
                                                    Law on Data Protection and Privacy
                                                    Revised e-Money Regulations

                                                                                              21
Evolution of MTN Rwanda
                Mitwa Kaemba Ng’ambi | Chief Executive Officer
Leading Digital solutions for Africa’s progress
MTN Rwanda | The journey from inception

  Key milestones in MTN Rwanda’s journey                                                                                                                                MTN Rwandacell receives
                                                                                                                                                                     approval to List by Introduction
                                                                                                                                                                      on the Rwanda Stock Exchange
                                                                                                                                                                       following CTL’s resolution to
                                                                                                                                      MTN Rwandacell launches a      cease business and distribute its
   Tristar Investments Invited MTN                                                                                                   campaign “ConnectRwanda”          surplus assets in specie to its
  Group to partner in establishing its                                                               Crystal Ventures listed its      aimed to connect 2.9 million             shareholders
    first Investment outside South                                                                      shareholding in MTN              households with Smart
                                                                  MTN Rwandacell launched Mobile
  Africa in the establishment of MTN                                                                  Rwandacell (20%) to the        phones and Improving smart
                                                                  Money and the MTN Foundation in
               Rwandacell                                                                           investing public through an      phone penetration in Rwanda
                                                                  February 2010
                                                                                                     initial public offer (IPO) on
                                             MTN Rwandacell                                               the Rwanda Stock
                                            Registered its one                                      Exchange in the form of an
                                         millionth mobile phone                                       SPV, Crystal Telecom PLC
                  1998                          subscriber.                                                                                      2019                              2021

                                                                             2010
                                                 2008
                                                                                                                   2015

                                                                                               23
Investment Case | A compelling growth story

                            Strong position in an attractive                                                  Exciting demographic opportunity
                                        market
                                                                           Platforms
  • 62% customer market share with 6.1m subscribers, 3.2m             accelerating growth                     • A growing youthful population.
    mobile money users and 1.6m data users.                                                                   • Low data, fintech and digital adoption.
  • Enterprise, home connectivity, wholesale and infrastructure                                               • Partner in socioeconomic development of
    sharing opportunities.                                                                                      Rwanda.
                                                                           Fintech
  * MTNR defines Data & MoMo subs as
  those active in 30 days

                                                                     API
                                                                  market
             Well-positioned for the long-term                     place                ayoba             Attractive return profile
     • Wide network coverage with 907 2G sites,
       917 3G sites & 1,487 Km of fibre.                                                          • Strong cash-flow and revenue generation track
     • Robust Distribution Network with over                                                        record.
       30,000 agents.                                                                             • Healthy EBITDA margins.
     • Strategic support and economies of scale                     NaaS             Enterprise   • Dividend policy pay-out ratio of 50% of
       through MTN Group.                                                                           distributable net income in the medium term.
     • Strong management team and brand.

                                                                               24
Strong position in an attractive market | Consistent growth

              Subscribers (‘m)                 Active data users (‘m)                                                        MoMo users (‘m)
               Strong growth YoY               Accelerated shift to data                                         “Cashless” – strong momentum

                                       6.1
                        5.2                                                                                                                                3.2
      4.5                                                                  1.6
                                                                                                                                           2.7
                                                             1.3                                               2.1
                                                0.9

      2018             2019            2020     2018         2019          2020                              2018                          2019           2020

            Voice ARPU (FRw)                     Data ARPU (FRw)                                                         Value Market Share
              Relatively stable ARPU             Affordability driving uptake                                                         Value leadership

                                                                                                                                                         65%
                                                1 534
                       2 061
                                                                                                                                          59%
      2 010                            1 979
                                                              1 436          1 438                            56%

      2018             2019            2020     2018          2019           2020                             2018                        2019           2020
                                                                                     This is calculated as MTN’s revenue over the Total
                                                                                     Telecommunication revenue as reported by RURA.

                                                            25
Exciting Demographic Opportunity | Young Population & Penetration Upside

                                              Rapid population growth                                             Internet Penetration Africa

                                           3,58%
                                                                                   2,94%
growth rate (2016-

                                                               2,58%
  Av. population

                                                                                                     2,32%
       2020)

                           1,14%

                          world est.       Uganda             Rwanda              Tanzania           Kenya

                            42%             68%                 60%                 63%              59%

                                                    % of population under 25

                                       Relatively High Mobile Penetration rates
                                                                                             129,1%
     Mobile Penetration

                                              83,8%                     85,4%
                           66,7%

                          Uganda              Rwanda                   Tanzania              Kenya

                          27.7M               10.6M                     51.2M                61.4M

                                                         Subscribers

                                                                                                             26
Exciting Demographic Opportunity | Socioeconomic development partner
                                 The MTN Foundation, through 1% of MTN Rwanda’s profit, has over the last 10 years invested more than Frw1.5 billion in Community Projects

                                                                                                                                             Economic empowerment
                                 1    Government Priorities                                                                           3
            Children Nutrition: MTN supports the government initiative of preventing malnutrition in children        Women empowerment: MTN supports women cooperatives with income-generating projects: in
                                                 under 5 years of age.                                                                agriculture, Art, innovation and digital Initiatives.

                  Genocide Commemoration: Every year MTN joins Rwandans and friends of Rwanda to
                  commemorate the 1994 Genocide Against the Tutsi and contribute to Socio economic                       Youth empowerment: Donation of tools of work and equipment to youth across Rwanda.
                           empowerment of Genocide Survivors in collaboration with Avega.

             Emergency assistance: Support to victims of excessive floods in Communities living in high risks        Entrepreneurship: Support Young entrepreneurs with start-up cash flow and Networking through
                        zone across the country with rehabilitation materials and equipment.                                                          the MTN Yolo Hackathon.

                                 2     Education                                                                                        4    Community and Health

          ICT School-Connect: MTN has built computer labs in all the 30 districts of Rwanda by the provision         Health Insurance: Supports Vulnerable families across the country with Community Based Health
                        of laptop computers and internet connectivity to secondary schools.                                                                Insurance (CBHI).

          Scholarship Program: MTN pays school fees to 100 disadvantaged students with the highest grades            Autism disease: MTN donated learning materials and equipment to AUTISME RWANDA to support
                                          in National exams since 2012.                                                                        the growing number of Autistic children.

            21 Days of Y’ello Care: MTN involves its employees from 1st – 21st of June to volunteer in social         Operation Smile: 589 Rwandese benefited from free cleft lip/palate surgery and 174 Health care
                         initiatives including: Building schools, Installation of Water tanks, etc.                            professionals and 26 medical staff were medically trained powered by MTN.

Source:    Company information
                                                                                                                27
Exciting Demographic Opportunity | Socioeconomic development partner
COVID-19 Response - Prioritising our people, customers & network

                                                      Impacts                 Managing the crisis                               Future focus

                                      • Economic slowdown               • Y'ello Hope                               • Agile working
         Social                       • Lockdowns                       • Work from home                            • Support to staff & communities
         (our people & communities)
                                      • Health & wellbeing              • Safety measures                           • $25m donated by MTN Group in support of
                                                                                                                      AU’s vaccination programme

                                      • Affordability pressure          • Digital channels ramped up                • Accelerated digitalisation
         Commercial                   • Lower transactions              • Zero-rated sites & discounts on MFS       • Stimulate usage
         (including our customers)
                                      • Shift from voice to data        • Innovative offerings - University deals   • Home connectivity

                                      • Site rollout challenges         • Focus on resilience & capacity            • Resumption of rollout
         Network                      • Data payload surges             • Capacity investments                      • Supply chain management
         & supply chain               • Supply chain disruption         • Built 12-month buffer

                                                                   28
Well positioned for the long term | Wide network coverage

         Wide Network Coverage                  Expanding Fibre Footprint                               Broad Spectrum Holding

    GSM coverage prediction: 95.1%
                                                                                                                        Total Spectrum
                                                                                            Frequency Band in MHz

                                                                                           900MHz                            15.8

                                                                                           1800MHz                           25

                                                                                           2100MHz                           20

                                                                                           3500MHz                           88

                                                                                  Leased
                                                                              MTN Owned

     Technology          Site count        Technology                  Size

         2G                 907          In country Fibre           1,487 Km

         3G                 917       International Capacity        15.3Mbps

                                                               29
Well positioned for the long term | Leading commercial position

                       Largest Distribution Nationwide                                            Fully Digitized Distribution Channel

   30,000                                                60,000                                                               100%
 MoMo & Airtime                                     MoMoPay Merchants                                                   of airtime is electronic
    Agents                                                                                                              (with 50% via MoMo)

           Rwanda’s only “GSMA Mobile Money Certified” Operator                             Recognized as Innovation Leader in the Industry
                                                                             Organization                   Year                 Award

   MTN Rwanda is 1                                                                                          2017         Best Exhibitor ICT/Annual PSF Expo.
     out of 14
                                                                                                            2018         Best Digitization/Annual PSF Expo
     operators
  worldwide with the
         ……

                                                                                                            2019         2019 Rwanda Business Excellence Awards
                                                                                                                         (RDB): Innovator of the year category.

                                                                        30
Well positioned for the long term | Strong management team

          Mitwa Ng’ambi                        Mark Nkurunziza                   Yaw Agyapong                            Chantal Kagame                  Cliff Muligande                   Sharon Mazimhaka

      Chief Executive Officer               Chief Finance Officer            Chief Consumer Officer                   Chief Business Officer        Chief Information Officer           GM, Legal & Regulatory

• Joined in 2019                        • Joined in 2019                 • Joined in 2021                          • Joined in 2018                 • Joined in 2006                  • Joined in 2009

• Formerly CEO of Airtel-Tigo Ghana     • Formerly CFO of                • Formerly CMO of MTN Liberia             • She is a senior Telecom        • Cliff has over 15 years’        • Appointed as GM Legal &
                                          Rwanda Development Board                                                   Executive with over 19 years     experience in the Information     Regulatory, and Company
• Was also CEO of Tigo Senegal            for 6 years                    • Was also CCO of Liquid Financial          of experience in                 Technology sector both in the     Secretary in 2015
                                                                           Services Ghana and CCO at Tigo            Multinational                    private and public sectors.
• She is a seasoned leader with a       • Has over 20 years of             Rwanda                                                                                                     • Between 2011 and 2014, she
                                                                                                                     Telecommunications
  career spanning more than 10 years      experience in financial and                                                                               • He holds a bachelor’s degree      was the Legal and Regulatory
  in the telecom sector. She also has     risk management                • Solid commercial experience                                                in Information Technology and     Affairs Supervisor and from
                                                                                                                   • Previously held the Deputy
  extensive experience in commercial,                                      spanning Strategy, Marketing,                                              an on-going MBA in project        2009 to 2011 she was a Legal
                                                                                                                     CEO position at Tigo Rwanda.
  technology and developing growth      • He also had a stint in the       Digital, Pricing & Products.                                               management.                       Officer at MTN Rwandacell PLC.
  strategies.                             aviation industry when he
                                          served at the National
                                          Airline, RwandAir as Finance
                                          Manager.

                                                                                                              31

                                                                                                              31
Well positioned for the long term | Strong management team

         Eugen Gakwerere                      Norman Munyampundu                              Enock Luyenzi                             George Kagabo                                 Oscar Oboma

      Chief Technology Officer                   Chief S&D Officer                      GM, Human Resources                         GM, Internal Audit                          GM, Risk & Compliance

                                          • Joined in 1998                          • Joined in 2017                           • Joined in 2008                            • Joined in 2015
• Joined in 2018
                                                                                                                               • Formerly Director of Finance at Crystal   • Oscar has held various senior
                                          • Norman has served in different          • Enock is a Chartered Human
• Eugene has 13 years experience in                                                                                              Ventures Ltd                                managerial roles within MTN
                                            Senior positions at MTN Rwandacell        Resources Analyst (CHRA). He holds
  Network Design, Planning and                                                        an MBA in International Strategic        • Seasoned finance and audit                  Rwandacell PLC Finance
                                            PLC since its inception in 1998.
  Optimization, Operational                                                           Management from Mt. Kenya                  experience. Having held various roles       department as Senior Manager
  Management and Implementation                                                       University.                                at NPD and Rwanda Social Security           Financial Planning and Analysis,
                                          • With Over 20 years’ experience in the
                                                                                                                                 Board as well.                              Senior Accountant Fixed Assets.
                                            Telcom industry, Norman has a vast
• Eugene holds a Bachelor of Science in                                             • Enock has a passion for Strategic
                                            experience in Strategy, Corporate                                                  • In this role, George oversees Internal    • Formerly also Head of Strategy in
  Engineering Electronics and                                                         Management with solid Human
                                            Business, Sales and Distribution                                                     and External Audit as well as Forensic      the CEO’s office.
  Telecommunication Engineering.                                                      Resources and Administration skills in
                                            Operations, Mobile Financial Services                                                Investigations.
                                            & Customer Care Operations.               the Banking, the Public Sector and the
                                                                                      Telecommunication Industry.

                                                                                                       32
Attractive Return Profile
                Mark Nkurunziza | Chief Finance Officer
Leading Digital solutions for Africa’s progress
Attractive Return Profile | Financial Snapshot

 Revenue                                                                                  Expenses                                                       EBITDA & Capex
 (FRw bn)                                                                                 (FRw bn)
                                CAGR +21.6%                                                          CAGR +2.8%                                      29.2%     40.6%        49.0%     EBITDA
                                                                                                                                                                                      margin
                                                                           152                                                                       21.9%     21.7%                  Capex
                                                                                                                                                                            14.9%
                                                                                            72        74               76                                                             Intensity
                                                                                                                                                              CAGR +57.4%
                                           125                                                                                                (FRw bn)                              EBITDA(1)
                                                                                                                                                                             74

          103
                                                                                                                              Opex
                                                                                                                                                                 51
                                                                                                       60               64                                                   52
                                                                                             60
                                                                                                                                                                                    FCF(2)
                                                                                                                                                                 24
                                                                                                                                                         30

                                                                                                                                                         8

                                                                                                                                                                 27                 Capex
                                                                                                                                                         23                  23
                                                                                             13        14               12    Cost of sales

          2018                           2019                            2020               2018      2019             2020                          2018      2019         2020

Source:     Company information.
Notes:      (1) Defined as Earnings Before Interest, Tax, Depreciation and Amortisation
          (2) Defined as EBITDA less Capex                                                                        34
Attractive Return Profile | Revenue mix
                              Revenue Split Evolution(1)                                                                                                               Key Drivers

                                  2015                                                                                      Voice still a great proportion of MTN Rwanda’s revenue. Continued expansion of population coverage spurs growth as more of the
                                                                                                             Voice           population gets connected. In 2020, mobile phone penetration in Rwanda was 83.8%.
                                                                                                                            Revenue driven by both growth in Subscribers and voice traffic.

                       20%                                               Voice
                                                                                                                            Increase in the subscriber base and data usage with affordability as an important factor.
                                                                         Mobile Data                      Mobile Data       Due to the Covid-19 pandemic, demand for home connectivity led to a surge in internet traffic supported by the high internet
                 6%                                                                                                          penetration in Rwanda (62.5% in 2020). The 2020 data revenues increased by 36%.
                                                                         MFS
                                                54%
                                                                         Other Revenue                                      Growth in subscriber base where MFS penetration stands at 60.5%.
                      20%
                                                                                                             MFS            Substantial growth on MFS driven by traditional person-to-person, cash-out and advanced service transactions.
                                                                                                                            Advanced services contribute 16% of total MFS revenue ending 2020.

                                                                                                          Enterprise &      Fibre connectivity to offices and homes contributes to the increase in the ICT Revenue stream.
                                                                                                           Wholesale        Demand for smartphones is high as data subscribers continue to grow.

                                  2020                                                                                      MTN subscriber base and market share is on the increase which leads to improvement in interconnect revenues from both local and
                                                                                                          Interconnect       international incoming calls. Overall, interconnect incoming traffic grew by 25% year on year with relatively stable interconnect
                                                                                                                             rates.

                            14%
                                                                                                                            Affordable rates continue to stimulate healthy SMS revenues.
                                                                        Voice
                                                                                                             SMS            In general, SMS revenue growth is mainly driven by Bulk SMS agreements with Corporates; notably Banks.

                                                  48%                   Mobile Data
                20%
                                                                        MFS                                                 Digital and VAS revenues steadily increasing as MTN continues to onboard Partners for revenue sharing arrangements.
                                                                                                            Digital         Rich Media Subscription also increased year on year by over 500%.
                                                                        Other Revenue

                            18%                                                                                             Roaming revenues driven by increase in visitors entering the country as tourism (including meetings and conferences) become
                                                                                                           Roaming           prevalent.
                                                                                                                            However, Roaming Revenues for 2020 dropped by 51% due to limited in-country visits as a result of the Covid-19 situation.

Source:    Company information
Note      (1) Other revenue comprises of Enterprise & Wholesale, Interconnect, SMS, Digital and Roaming
                                                                                                                                    35
Attractive Return Profile | Revenue growth profile

   (FRw bn)

                                                                                                                                          CAGR
                                                                                                                                                                      Understanding Revenue Growth
                                                                                                                                         2018-20
                                                               Voice       Mobile Data           MFS        Other Revenue                          (Frw bn)
                                                                                                                                          21.6%
                                                                                                                            152
                                                                                                                             22                               2019                 125
                                                                                                                                          5.8%
                                                                                          125

                                                                                            21                               31
                                  103                                                                                                     37.2%               Voice                                  11

                                   20                                                       23
                                                                                                                             27
                                                                                                                                          37.5%
                                   16                                                       20                                                         Mobile Data                                   7
                                   14

                                                                                                                             73
                                                                                            62                                                                 MFS                                        8
                                   53
                                                                                                                                           17.4%

                                                                                                                                                    Other Revenue                                     0
                                 2018                                                     2019                              2020
          Revenue Mix (%)

          Voice                         51%                                                  49%                              48%
                                                                                                                                                              2020                       152
          Mobile Data                   14%                                                  16%                              18%

          MFS                           16%                                                  18%                              20%

          Other Revenue                 19%                                                  17%                              14%

Source:     Company information
Note        (1) Other revenue comprises of Enterprise & Wholesale, Interconnect, SMS, Digital and Roaming
                                                                                                                                    36
Attractive Return Profile | Cost base summary

                                2020 Split                                             Composition                                                    Key Drivers

                                                                                     • Government and regulatory costs.           • Regulatory fees comprise of 3% of turnover.

                                                                                     • Costs of handsets and other accessories.   • Handset cost of sales relates to the increase in
                                             16%
                                                                   Cost of Sales                                                    device sales/revenues.
                                                                                     • Interconnection and roaming fees.
                                                                                                                                  • Interconnection cost of sales driven by outgoing
                                                                                                                                    international traffic.

                                                                                                                                  • With Network site rollout across the country, the
                                                                                                                                    corresponding operating costs increases.
                                84%                                                  • Direct network operating costs.
                                                                                                                                  • Employee benefits reflect the prevailing market
                                                                                     • Employee benefits expenses.                  conditions.
                                                                Operating Expenses                                                • Increase in the MTN footprint across the country
                                                                                     • Sales ,distribution and marketing costs
                                                                    (“Opex”)                                                        impacts on sales, distribution and marketing
                                                                                     • Other operating expenses.                    expenses.
                                                                                                                                  • A contribution to the health sector is provided by
              Cost of sales       Operating Expenses ("Opex")                                                                       MTN by taking 2.5% of turnover and remitting to the
                                                                                                                                    social security fund.

Source:   Company information
                                                                                          37
Attractive Return Profile | Cost of sales

          Cost of Sales split                                                                                                                             Understanding Cost of Sales
                                                                                                                                    CAGR
          (FRw bn)
                                                                                                                                   2018-20

                                                                       14
                                                                                                               12                               • Government and regulatory costs rising in line
                        13                                                                                                            (3.5%)      with revenue growth. This includes license fees
                                                                                                                                                  which is 1% of turnover. There is also 2% of
                                                                                                                                                  turnover which is channelled to the Universal
                                                                        6                                                                         access fund.
                                                                                                                4                     (27.3%)
                                   7
                                                                                                                                                • Handsets and accessories directly linked to the
                                                                                                                                                  sales of devices including smartphones for
                                                                                                                                       13.0%
                                                                                                                3                                 which demand is high.
                                                                        4

                                   2
                                                                                                                                                • Interconnect costs have reduced by 40% year
                                                                                                                                       25.7%      on year with MTN Rwanda on-net traffic rising
                                                                                                                5
                                                                        4                                                                         due to growth in the MTN subscriber base.
                                   3

                                  2018                                2019                                     2020

                     Government and regulatory costs   Cost of handsets and other accessories   Interconnection and roaming fees

Source:     Company information
                                                                                                                    38
Attractive Return Profile | Opex

                                                                                                                                CAGR
      Opex Split                                                                                                               2018-20                     Understanding Opex
      (FRw bn)                                                                                                  64              4.1%
                       60                                   60

                                                                                                                     12
                                                                                                                               (24.8%)   • Employee benefit expenses increased in line with the
                                                                 11
                                                                                                                                           inflation.
                         22

                                                                                                                     17
                                                                 17
                                                                                                                               19.1%     • Efficiencies in marketing costs as we leverage on
                                                                                                                                           digital channels.

                         12
                                                                                                                                         • Other operating costs includes 2.5% of turnover that is
                                                                                                                               23.0%
                                                                                                                     23                    contributed to the Rwanda Social Security Board
                                                                 19
                                                                                                                                           (RSSB) as a Community Health subsidy (Mutuelle de
                         15                                                                                                                Sante). Amounts payable to MTN Group including
                                                                                                                                           royalties for use of the MTN Brand and management
                                                                                                                                           services ranges between 4-5% of revenue.
                                                                                                                                8.0%
                         11                                      13                                                  12

                                                                                                                                         • Direct network operating costs increased slightly as
                       2018                                  2019                                                2020                      more network sites were rolled out across the
                                                                                                                                           Country.
                                Employee benefits expense             Sales, distribution and marketing costs
                                Other operating expenses              Direct network operating costs

Source:   Company information
                                                                                                                          39
Attractive Return Profile | EBITDA performance

   EBITDA
   (FRw bn)
                                                                                                                                                           EBITDA Drivers
     EBITDA                   29%                                 41%                                        49%
     Margin

                                                                                                          74                           • The EBITDA increase in FY2019 is partly attributed to
                                                          CAGR: +57.4%                                                                   the introduction of IFRS16 where lease costs were
                                                                                                                                         capitalized.
                                                                   51

                                                                                                                                       • The EBITDA margin for 2020 shows an increase of
                                30                                                                                                       8p.p mainly due to a 21% YoY Revenue increase and
                                                                                                                                         cost efficiencies.

                                                                                                                                       • The eradication of physical vouchers also helped in
                                                                                                                                         reducing overall costs.
                              2018                               2019                                   2020

                                                                                                                                       • OPEX also reduced with more adoption of digital
                                                             EBITDA Margin Evolution
                                                                                                                                         channels for marketing activities. Travel costs were
                                                                                                                                         also affected by the general COVID-19 lockdown as
      • EBITDA FY2020 grew year on year by 45%                                                                                           staff embraced online platforms for meetings.
      • The main drivers of the strong year on year EBITDA growth from 2019 to 2020 were:
                 • Overall year on year growth of Revenues by 21% with voice, data and Mobile Money revenue streams contributing 90%
                   of the total revenues
                 • Efficiencies in terms of costs as OPEX intensity decreased from 35% in 2019 to 26% in 2020.

Source: Company information

                                                                                                        40
Attractive Return Profile | Capital Expenditure

      Capital Expenditure                                                                                                       Overview of Capex
      (FRw bn)

                                                                                                            • To continue driving mobile penetration and
                                                                                                               connectivity, MTNR’s Investment program is averaging
                                                                                                   CAGR
           Capital Expenditure                                                                    2018–20      capital expenditure of close to FRw20.0 bn annually to
                                 21.9%                   21.7%                      14.8%
           % of revenue                                                                            0.0%        push for:

                                                         27,2
                                                                                                                    •      better connectivity
                                  22,5                                              22,5
                                                                                                                    • quality operations and service delivery to our
                                                                                                                        growing customer base
                                                         27,2
                                  22,5                                              22,5                            • improving and expanding its network

                                                                                                            • MTNR has invested about FRw 60.4bn over the last 3
                                                                                                               years:
                                  2018                   2019                       2020
                                               Network           IT         Other
                                                                                                                    • 2017: FRw10.7 bn

          Capex Mix (%)
                                                                                                                    • 2018: FRw22.5 bn
          Network                        72%                          46%                   64%

          IT                             20%                          49%                   30%
                                                                                                                    • 2019: FRw27.2 bn

          Other Capex                    8%                           5%                    6%
                                                                                                                    • 2020: FRw22.5 bn

Source:   Company information

                                                                              41
Attractive Return Profile | Taxation

                                                                         Income Tax                                                                Commentary
  (FRw bn)
                                  46.6%                                     45.6%                                     38.0%
               Effective Income                                                                                                 • MTN has been ranked among the top 2 best
               Tax rate (%)
                                                                                                                                  taxpayers in Rwanda over the last 5 years.

                                                                                                                       12.4     • In addition to corporation tax, MTN also pays the
                                   6,8                                        5.7                                                 following taxes:

                                                                                                                                        • Excise tax which is 10% of Revenue
                                  FY 2018                                   FY 2019                                   FY 2020
                                                                                                                                        • VAT 18% and Reverse VAT 18%
                                            Reconciliation of Statutory Tax Rate (STR) and Effective Tax Rate (ETR)
                                                                                                                                        • Withholding tax at 15%

    (FRw bn)                                                                                                                    • The increase in the 2020 Corporation tax is
                                                                                                                                  commensurate with the increase in YoY profit
                                                                                                                                   before tax.

                                                                                                                                • The high effective tax rates for years 2018 and
                                                                                                                                  2019 was partly due to tax penalties paid that
                                                                                                                                   were not allowable deductible expenses.

                                                                                                                                • Management fee allowable expense is capped at
                                                                                                                                   2% of turnover. The rest is disallowed and added
                                                                                                                                   back for tax purposes.

Source:   Company information

                                                                                                           42
Attractive Return Profile | Net Working Capital

            Change in Net Working Capital                                                                              Commentary
            (FRw bn)

             0
                                   FY 2018                      FY 2019       FY 2020
            -2                                                                                     • Increase in current assets in line with increased
            -4                                                                                       sales – including Mobile Money.
            -6
            -8
                                                                                                   • Increase in intercompany payables as a result of
           -10                                                   (8,5)                               delays in upstreaming due to pressures on foreign
           -12                                                                                       currency.
                                     (11,9)
           -14
                                                                                  (14,0)
           -16

          (FRw bn)                                                        2018             2019                                       2020

          Decrease/(increase) in inventory                                (0.3)            (0.2)                                      (0.5)

          (Increase)/ decrease in trade and other receivables             (7.8)            3.7                                        (9.4)

          Increase in IRU assets                                          (0.5)            0.5                                        (3.2)

          Decrease in intercompany debtors                                (1.3)            (0.4)                                      (1.2)

          (Decrease) /increase in short term provisions                   (1.0)            (1.7)                                      (2.1)

          Decrease in trade and other payables                            (5.4)            (8.8)                                      (3.2)

          Increase in intercompany payables                                4.5             (2.4)                                       5.1

          (Decrease) /Increase in deferred income                          0.0             (0.0)                                       0.0

          Increase/(decrease) in unearned income                          (0.1)            0.9                                         0.4

          Change in Net Working Capital                                   (11.9)           (8.5)                                      (14.0)

Source:   Company information

                                                                              43
Attractive Return Profile | Free cash-flow

                                               Strong EBITDA performance translated into healthy free cash flows for 2020

                                          (FRw bn)                                             2018                 2019    2020

                                           EBITDA                                              30.1                 50.9     74.5

                                           Capex                                              (22.5)               (27.2)   (22.5)

                                            FCF                                                 7.6                 23.7     52.0

                                Change in Net Working Capital                                 (11.9)                (8.5)   (14.0)

                                      Net Interest Paid                                        (0.4)                (4.7)    (4.4)

                                      Income Tax Paid                                          (3.7)                (3.6)    (6.3)

                                           Other                                                0.0                  0.0      0.0

                                         Equity FCF                                            (8.5)                 6.9     27.2

Source:   Company information

                                                                                   44
Attractive Return Profile | Dividend Policy

                                        Historical Dividends Declared                                 Dividends Outlook
      (FRw bn)

                                                                                      • MTNR will target a minimum dividend pay-out
                                                   12,4
                                                                                        ratio of 50% of its distributable net income in the
                                                                                        medium term.

                                                                                      • Only exception is 2021 where a pay-out ratio of
                                                                               6.9
                                                                                        at least 30% will be targeted to take account of
                                                                                        the renewal of MTNR’s license.
                                 2,0
                                                                                      • All dividend pay-out will be subject to board’s
                                                                                        recommendation and shareholder approval:
                                2018                2019                       2020
                                                                                              • Pay-out will take into account MTNR’s
                                                  Payout Ratio                                  cash projections, business outlook,
                                                                                                investment plans, capital market
                                                                                                conditions, tax regulations and funding
                                                  182,1%
                                                                                                facility covenants.

                                                                                      • The company may by ordinary resolution of
                                                                                        shareholders on recommendation by the Board
                                25,8%                                        34.4%
                                                                                        of Directors declare dividends.

                                2018               2019                      2020

Source:   Company information

                                                                        45
Attractive Return Profile | Capital Structure

                                            Overview and Financing Strategy                                                                                                                                              Debt Evolution

                                                                                                                                                                   Net Debt(1)
                                                                                                                                                                   (FRw bn)
          • MTNR has historically maintained moderate leverage; remains in a                                                                                               Total          40.04                                      34.96                  29.02
            comfortable position relative to covenants on current metrics:                                                                                                Debt(1)
                                                                                                                                                                                                                                      10,60
              − Net Debt to EBITDA of 0.10x(1)
                                                                                                                                                                                                                                                            6,81
              − Interest Coverage of 14.43x(2)                                                                                                                                          5,68

          • The debt-equity ratio is at a comfortable level with room for future
              borrowing as needed.

          • The weighted average cost of capital (WACC) is 16.2%.
                                                                                                                                                                                         2018                                        2019                   2020

                                                        Leverage Evolution                                                                                                                                                Finance Costs

          Net Debt / EBITDA (1)                                                                                                                                    Net Finance Cost(2)
          (x)                                                                                                                                                      (FRw bn)
                                                                                                   Covenant < 2.5x
                                                                                                                                                                   Interest               16.7x                                       9.0x                  14.4x
                                                                    0,22x                                                                                         Coverage(2)
                             0,21x
                                                                                                                                                                                                                                       5.57
                                                                                                                                                                                                                                                            5,16

                                                                                                            0,10x
                                                                                                                                                                                        1,79

                                                                                                                                                                                           2018                                       2019                  2020
                              2018                                   2019                                   2020
Source:   Company information
Notes:    Based on current reporting standards. (1) Net Debt / EBITDA based on Net Debt as at end of the financial year divided by EBITDA. Net Debt defined as Total Debt less Cash. (2) Interest Coverage defined as EBITDA divided by Net Finance Cost.

                                                                                                                                                             46
Attractive Return Profile | Capital Structure

                                     Current Facilities                                                                          Debt Maturity Schedule
     (As at 31 December 2020)                                                         (FRw Millions, as at 31 December 2020)

     Borrowings                                           Currency   FRw bn
                                                                                                                               Maturity Profile - FRw' Millions

     Non-current bank loans                                                             40 000

                                                                                        35 000
          Tranche A                                         FRw        29.45

                                                                                        30 000
     Current bank loans
                                                                                        25 000

          Tranche B                                         FRw           -
                                                                                        20 000

     Capitalised transaction costs                                     (0.43)           15 000

     Total debt                                                        29.02            10 000

                                                                                          5 000
     Cash                                                              (22.21)

                                                                                              -
     Net debt                                                           6.81                            2019           2020         2021        2022         2023   2024   2025

Source:     Company information

                                                                                 47
Strategy & Growth Opportunities
                Mitwa Kaemba Ng’ambi | Chief Executive Officer
Leading Digital solutions for Africa’s progress
MTN Rwanda | Ambition 2025

 Belief statement                         “Everybody deserves the benefits of a modern connected life”

 Strategic intent                        Ambition 2025: “Leading digital solutions for Rwanda’s progress”

                         Build the

    25
                                                        Drive
                        largest                                                            Create                 Accelerate portfolio
                    & most valuable
                                             industry-leading                          shared value               transformation
                                           connectivity operations
    strategic         platforms
    priorities

                                       Best talent, culture &                                                               Technology
                    Leading customer                                 Value based capital                ESG
   Vital enablers                           future skills                                                              platforms second to
                       experience                                       allocation                  at the core
                                                                                                                               none

        Values         Leadership           Integrity                  Relationships                Innovation               Can-Do

                                                                49
MTN Rwanda | Ambition 2025 Targets

                                       2020 Actuals – Rwanda                       2025 – Rwanda                       2025 – MTN Group
 Priorities
  Build the
                            • 0.24m ayoba users                                                             • 100m MoMo users
                                                                        • 4m ayoba users
  largest                                                                                                   • 100m ayoba users
                            • 3.2 MoMo users                            • 6m MoMo users
  & most valuable                                                                                           • #1 NaaS platform in Africa
                            • 62K MoMoPay merchants                     • NaaS platform & API marketplace
  platforms

                            • 1.6m active data users                                                        • +200m active data users
                                                                        • 5m active data users
  Drive                                                                                                     • +10m home broadband users
                            • 1K home broadband users                   • 20K home broadband users
  Industry-leading                                                                                          • +$500m investment over medium-term
                            • Neutral NPS                               • #1 NPS
  connectivity operations                                                                                   • R5bn of expense savings | #1 NPS

                            • Reputation Index ≥ 75%                                                        • Top quartile ESG ratings
                                                                        • Top quartile ESG ratings
  Create                                                                                                    • Broad-based ownership and inclusivity
                                                                        • Reputation Index ≥ 75%
  shared value                                                                                                achieved
                                                                                                            • Reputation Index ≥ 75%

                            • RSE Listing initiated                                                         • ARP proceeds >R25bn
                                                                        • RSE Listed
  Accelerate portfolio
  Accelerate    portfolio                                                                                   • Holdco leverage between ≤ 1,5x
                            • Wholly owned FinCo Subsidiary initiated   • FinCo subsidiary
  transformation                                                                                            • Structural separation of infrastructure assets
     transformation                                                     • FibreCo subsidiary                  and platforms

                                                                              50
Conclusion
                Mitwa Kaemba Ng’ambi | Chief Executive Officer
Leading Digital solutions for Africa’s progress
Medium-term guidance
Continued commercial momentum, with an eye on efficiencies.

                                                           KPI                                                                                                   Target

                                            Subscriber growth                                                                                     Maintain min. avg growth rate of ~5%

                                            Service Revenue                                                                                                   Low- to mid-teen growth

                                            Accelerate Fintech growth                                                                                    Double-digit growth in revenue

                                            EBITDA Margin                                                                                                        Stable margins

                                             Dividend pay out                                                                                     Minimum 50% of Distributable Income

 *MTNR will target a minimum dividend pay-out ratio of 50% of its distributable net income with the exception of 2021 where a pay-out ratio of at least 30% will be targeted to take into account the renewal of MTNR’s license.

                                                                                                                        52
2021 priorities
… as we continue to manage COVID-19 uncertainties

        Accelerate revenue growth and drive for efficiencies

        Position fintech for accelerated growth

        Coverage Expansion in Kigali and Upcountry

        Increase penetration in Home Segment

        Digital Transformation

        Solidify Customer Experience leadership

                                                               53
Conclusion
Key take-aways

        Very strong operational and financial results solidified over the years
   1
           •     16% growth in mobile users and 20% growth in revenue in 2020
           •     EBITDA margin of 49%

        Solid market leadership position
   2
           •     62% customer market share
           •     Strong brand, that serves the community

   3    Business resilience under COVID-19 pandemic pressures
           •     Consistent investments in technology over the years, with US$ 23m invested in 2020
           •     Network quality & coverage remains key focus in 2021 and beyond

         Largest and Most Valuable Platform Business
   4
           •     Largest mobile money network with 3.2m users, >30K agents and >60K MoMoPay merchants
           •     Strong potential in Ayoba whose active users exceeded 200K within 8 months of launch

   5     Business Structure transformation
           •     Listing on RSE
           •     Wholly owned FinCo Business

                                                                                54
Listing Details
                Carine Umutoni | Chief Executive Officer, BK Capital
Leading Digital solutions for Africa’s progress
Rationale for the listing

          1
                  Providing CTL Shareholders with direct ownership of MTN Rwandacell

          2       Create access for broad based investors with a strong local ownership to participate in the growth of MTN
                  Rwandacell

                  Create a stable and supportive long-term shareholder base to ensure a healthy and liquid aftermarket
          3
                  performance

          4       Contribute to the growth and deepening of the Capital Markets and Rwanda Stock Exchange (RSE)

                  The listing is an important milestone for the company and aligns with the Group overall strategy and growth
          5       ambition

                                                                   56
Details of Listing

          Company name               • MTN Rwandacell PLC

             Industry                • Telecommunications

           Sub-Industry              • Mobile Telecommunications

                                     • Listing by Introduction of the issued and paid-up ordinary shares of MTN Rwandacell PLC on the Rwanda Stock Exchange.
                                     • CTL is currently a public company listed on main board of the RSE. Additionally, CTL’s only investment and asset is its 20% shareholding in MTN Rwandacell PLC.
                                     • CTL will cease to operate and thereafter distribute its surplus assets (i.e. the shares it holds in MTN Rwandacell PLC) in specie to its shareholders, including its
                                       shareholding in MTN Rwandacell PLC.
      Transaction description        • Each shareholder shall receive MTN Rwandacell PLC shares on a 1:1 ratio basis i.e. One MTN Rwandacell PLC share for each share owned by the Shareholder in CTL. A
                                       shareholder will thus receive the same number of shares in MTN Rwandacell PLC as they previously held in CTL, upon successful listing by Introduction of MTN
                                       Rwandacell PLC.
                                     • On conclusion of this Transaction the 20% held by CTL in MTN Rwandacell PLC will be held by the current shareholders in CTL.

           Listing mode              • By way of Introduction

               Ticker                • MTNR

  Issued and paid-up share capital   • 1,350,886,600

            Listing price            • FRw 269

       Market capitalization         • FRw 363,388,495,400

         Date of admission           • May 4th,2021

                                                                                                    57
Q&A
Thank You
Disclaimer

This presentation has been prepared by MTN Group Limited (“MTN”) and MTN Rwandacell PLC (the “Company”), and MTN together with its direct and indirect subsidiaries, the “Group”) to provide an overview of
the Group and MTN Rwandacell PLC specifically. “Presentation” means this document, its contents or any part of it, any oral presentation, any question or answer session and any written or oral material discussed
or distributed during the presentation meeting or otherwise in connection with it.

This document is being supplied to you solely for your information and for use at the Company’s presentation. No information made available to you in connection with the presentation may be passed on, copied,
reproduced, in whole or in part, or otherwise disseminated, directly or indirectly, to any other person. Neither this document nor the meeting at which it is presented constitute a recommendation regarding any
loans or securities of the Company or any of its subsidiaries or joint venture companies.

This presentation is not, and should not be construed as, a prospectus, is not intended for potential investors and does not constitute or form part of, and should not be construed as an offer or the solicitation of an
offer to subscribe for or purchase securities of the Company, and nothing contained therein shall form the basis of or be relied on in connection with any contract or commitment whatsoever, in particular, it must
not be used in making any investment decision. Any decision to purchase securities in any offering should be made solely on the basis of information contained in any prospectus or offering circular that may be
published by the Company in final form in relation to any proposed offering.

This document and its contents may not be viewed by persons within the United States (within the meaning of Regulation S under the Securities Act) other than (i) by QIBs or (ii) in “offshore transactions” within the
meaning of Regulation S. The distribution of this Presentation in other jurisdictions may be restricted by law and persons into whose possession this Presentation comes should inform themselves about, and
observe, any such restrictions. Any securities referred to herein have not been, and will not be, registered under the United States Securities Act of 1933 (the “Securities Act”), and may not be offered or sold in the
United States absent registration under the Securities Act except to persons reasonably believed to be qualified institutional buyers (“QIBs”) as defined in Rule 144A under the Securities Act or another exemption
from, or in transactions not subject to, the registration requirements of the Securities Act.

This presentation speaks as of the date hereof and has not been independently verified and no representation, warranty, or undertaking, express or implied, is made by MTN, the Company, its shareholders or any of
their respective affiliates, directors, officers, employees or agents as to the fairness, accuracy, completeness or correctness of the information or the opinions contained in this document or provided at the
presentation. No reliance should be placed on the accuracy, completeness or fairness of such information or opinions for any purpose whatsoever, including but not limited to any investment considerations. To the
fullest extent permitted by law, none of MTN, the Company, its shareholders or any of their respective advisors, representatives, affiliates, directors, officers, employees or agents shall have any responsibility or
liability whatsoever (in negligence or otherwise) for any loss howsoever arising from any use of this document or its contents, or from any use of any information provided at the presentation or otherwise arising in
connection with this document or the presentation at which it was presented. No reliance should be placed on any communication (written or oral) as investment advice or as a recommendation regarding any loans
or securities of the Company or any of its subsidiaries or joint venture companies.

                                                                                                           60
Disclaimer | continued
The presentation includes market share and industry data obtained by MTN and the Company from industry publications and surveys and internal surveys. MTN and the Company may not have access to the facts and
assumptions underlying the numerical data, market data and other information extracted from publicly available sources. As a result, none of MTN, the Company, its shareholders, or any of its or their respective
advisors, representatives, affiliates, directors, officers, employees or agents are able to verify such numerical data, market data and other information and assume no responsibility for the correctness of any market
share or industry data or other information included in this document or provided at the presentation. Accordingly, undue reliance should not be placed on any of the industry, market or competitive position data
contained in this presentation. All information in this document and provided at the presentation is subject to update, revision, verification, correction, completion, amendment and may change materially. Neither
MTN and the Company nor any of its advisers, representatives, affiliates, directors, officers, employees or agents undertake any obligation to amend, correct or to provide the recipient with access to any additional
information or to update this document or any information provided at the presentation or to correct any inaccuracies in any such information.

Matters discussed in this document, at the presentation and any materials distributed in connection with the presentation may constitute or include forward-looking statements. Forward-looking statements are
statements that are not historical facts and may be identified by words such as “believes”, “expects”, “anticipates”, “intends”, “estimates”, “will”, “may”, “continues”, “should” and similar expressions. These forward-
looking statements reflect, at the time made, the Company’s beliefs, intentions and current expectations concerning, among other things, MTN and the Company’s results of operations, financial condition, liquidity,
prospects, growth and strategies. Forward-looking statements include statements regarding: objectives, goals, strategies, outlook and growth prospects; future plans, events or performance and potential for future
growth; liquidity, capital resources and capital expenditures; economic outlook and industry trends; developments of MTN and the Company’s markets; the impact of regulatory initiatives; and the strength of MTN and
the Company’s competitors. Forward-looking statements involve risks and uncertainties because they relate to events and depend on circumstances that may or may not occur in the future. The forward-looking
statements in this document and the presentation are based upon various assumptions, many of which are based, in turn, upon further assumptions, including without limitation, management’s examination of
historical operating trends, data contained in MTN and the Company’s records (and those of its affiliates) and other data available from third parties. Although MTN and the Company believes that these assumptions
were reasonable when made, these assumptions are inherently subject to significant known and unknown risks, uncertainties, contingencies and other important factors which are difficult or impossible to predict and
are beyond its control. Forward-looking statements are not guarantees of future performance and such risks, uncertainties, contingencies and other important factors could cause the actual results of operations,
financial condition and liquidity of MTN and the Company and its affiliates or the industry to differ materially from those results expressed or implied in this document or the presentation by such forward-looking
statements. No representation is made that any of these forward-looking statements or forecasts will come to pass or that any forecast result will be achieved. Forward-looking statements speak as of the date of this
presentation and no one undertakes to release any update or revision of any such forward-looking statement, whether as a result of new information, future events or otherwise. Undue reliance should not be placed
on any forward-looking statement. No statement in this presentation is intended to be nor may be construed as a profit forecast. Past performance is not indicative of future results.

By attending the presentation and/or accepting a copy of this document, you agree to be bound by the foregoing limitations and conditions and, in particular, will be taken to have represented, warranted and
undertaken that (i) you are a person to whom this presentation and the information contained in it may lawfully be communicated; (ii) you have read and agree to comply with the contents of this notice; and (iii) you
will not at any time have any discussion, correspondence or contact concerning the information in this document with any of the directors or employees of MTN and the Company or its subsidiaries nor with any of
their suppliers in respect of MTN and the Company or its subsidiaries without the prior written consent of MTN and the Company.

                                                                                                            61
You can also read