It matters to be in good hands: the relationship between good governance and pandemic spread inferred from cross-country COVID-19 data - Nature
←
→
Page content transcription
If your browser does not render page correctly, please read the page content below
ARTICLE
                  https://doi.org/10.1057/s41599-021-00876-w                 OPEN

                  It matters to be in good hands: the relationship
                  between good governance and pandemic spread
                  inferred from cross-country COVID-19 data
                  Munirul H. Nabin             1,   Mohammad Tarequl Hasan Chowdhury                        2   & Sukanto Bhattacharya             1✉
1234567890():,;

                  This study examines the relationship between good governance and pandemic control using
                  month-wise COVID-19 pandemic data within a time window from April to September 2020.
                  The study argues that countries with better governance are more capable of adopting and
                  implementing appropriate policies and that such governments are considered more trust-
                  worthy by their people. Combined, these factors enable such countries to better control a
                  pandemic like COVID-19. Using several measures of good governance and two measures of
                  pandemic spread, namely the COVID-19 positive rate and the COVID-19 growth rate, this
                  paper tests its argument econometrically in a sample of 185 countries. The results show the
                  existence of a significant inverse relationship between all measures of good governance, and
                  the COVID-19 positive and growth rates. The significant inverse relationship largely persists
                  even after controlling for continent-fixed effects and a host of geographic, demographic, and
                  socio-economic factors. This indicates the presence of a strong systemic linkage between
                  quality of governance and pandemic control. The findings empirically strengthen the argu-
                  ment of eminent medical historians concerning the importance of effective governmental
                  intervention for epidemic control. The study reveals that the quality of governance is a key
                  factor in a country’s success in pandemic management and encourages further investigation.

                  1 Deakin   University, Geelong, Australia. 2 University of Chittagong, Chittagong, Bangladesh. ✉email: sukanto.bhattacharya@deakin.edu.au

                  HUMANITIES AND SOCIAL SCIENCES COMMUNICATIONS | (2021)8:203 | https://doi.org/10.1057/s41599-021-00876-w                                    1
ARTICLE                                HUMANITIES AND SOCIAL SCIENCES COMMUNICATIONS | https://doi.org/10.1057/s41599-021-00876-w

S
Introduction
       ince the beginning of the COVID-19 pandemic, which has             individuals’ personal freedoms and ways of life than those
       devasted the entire world, the social sciences have seen two       required to prevent the spread of HIV. Morens and Fauci (2007)
       broad strands of literature emerge, targeting the pandemic         contended that gaining control over future pandemics would
and its control. One of these strands investigates the efficacy,           depend on resource availability and deployment, and the gov-
from both the socioeconomic and behavioral-anthropological                ernment’s response to the public health crisis, more than on
perspectives, of specific policies or sets of policies that have been      increased medical knowledge about treatment and prevention.
adopted by governments in an attempt to curb the pandemic; see            The COVID-19 pandemic is a public health crisis of a magnitude
for example, Acemoglu et al. (2021), Glaeser et al. (2020),               to test any government’s ability to rise to the occasion and exhibit
Akesson et al. (2020), Atkinson-Clement and Pigalle (2021),               its institutions’ innate strength and ability to gain an upper hand
Abouk and Heydari (2021) and others (interested readers are               over the crisis. It, therefore, presents a fertile testing ground for
directed to Brodeur et al. (2021) for a comprehensive review of           comprehensively testing the hypothesis about the quality of
this strand of the literature).                                           governance influencing a country’s success or otherwise in getting
   The second and perhaps a thinner strand looks at variations in         on top of a public health crisis.
the forms of political regimes and governance as explanatory factors         Each pandemic differs intrinsically from the previous one, and
for the differing degrees of control that have been established over      the earlier notion of ‘pandemic cycles’ has been discredited in the
the pandemic across countries. For example, Alon et al. (2020)            more recent literature (Kilbourne, 2004; Morens and Fauci, 2007).
compared democratic and authoritarian regimes in terms of the             While there are alternative epidemiological mechanisms for
effectiveness of their policy responses to the COVID-19 pandemic.         predicting the emergence of future pandemics even if one dis-
In a similar vein, Bunyavejchewin and Sirichuanjun (2021) found           counts the ‘pandemic cycles’ viewpoint, a compelling argument
that the efficacy of public policy responses to COVID-19 was               can be made for having in place the best response preparedness,
related to the regime type. Perhaps more intriguingly, Toshkov et al.     accepting the rise of a future pandemic as an inevitability. This,
(2020) reported that European countries with more centralized             therefore, calls for a thorough empirical examination of whether
forms of government that scored relatively poorly on measures of          the quality of governance can have an effect on the success or
government effectiveness, trust, and freedom tended to respond            otherwise of a country in managing a pandemic, and if so, to what
more quickly and decisively in controlling the spread of the pan-         extent. This is what motivates the current study, given that pan-
demic than decentralized countries with better scores on those            global public health crises similar to the COVID-19 pandemic are
measures. This obviously counter-intuitive but very interesting           likely to occur again in the future.
finding warrants deeper investigation, as it goes against the findings         “Governance consists of the traditions and institutions by which
of prior research on the relationship between government effec-           authority in a country is exercised. This includes the process by which
tiveness and epidemic control (e.g., Menon-Johansson, 2005).              governments are selected, monitored and replaced; the capacity of the
However, Engler et al. (2021) studied the variations in govern-           government to effectively formulate and implement sound policies;
mental policies combating COVID-19 across a sample of European            and the respect of citizens and the state for the institutions that
democracies and found that the considerable variation cannot be           govern economic and social interactions among them” (Kaufmann
explained only on the basis of pandemic-related factors, as               et al., 1999, p. 1). One of the reasons why good governance can be
entrenched democratic norms and institutions arguably have played         conducive to the controlling of a pandemic like COVID-19 can be
a role. In fact, Liang et al. (2020) found a negative association         explained by the conventional epidemiological susceptible-
between COVID-19 fatalities and government effectiveness, which           infected (SI) model, as proposed by Kermack and McKendrick
is more consistent with intuitive notions.                                (1927), which explains the mechanism of the spread of infectious
   The present paper investigates the relationship between good           disease. The model suggests that the number of people who are
governance and control over the COVID-19 pandemic in a cross-             susceptible to an infectious disease is determined by the repro-
country setting worldwide, covering 185 countries, which is the           duction number, which in turn depends on (i) the recovery rate,
largest number of countries considered thus far in such studies.          that is, the rate at which an infected person becomes susceptible,
Unlike Liang et al. (2020), who considered fatalities as the vari-        and (ii) the contact rate (also known as the mobility rate), that is,
able of interest, this paper considers the spread of the pandemic,        the rate at which a susceptible person becomes infected.
captured through two alternative measures: the positive rate and          If the contact rate is greater than the recovery rate, then more
the growth rate. Thus, it is more broad-based, as it looks at the         people get infected, which increases the reproduction number. If
spread of the disease, irrespective of whether or not the afflicted        the reproduction number is greater than one, this implies that one
persons passed away as a result.                                          infected person transmits the disease to more than one person,
   Eminent social scientists and medical historians have con-             meaning that the infection will spread at a higher rate. Con-
sistently posited that good governance, in various shapes and             versely, a reproduction number smaller than one means that the
forms, has played a crucial role in the control of epidemics in           spread of disease is under control. As good governance implies
countries around the world throughout human history (Farmer,              the adoption and implementation of public health policies that
1999; Zakaria, 2003; Chowell and Viboud, 2016; Snowden, 2019).            are aimed at reducing the reproduction number to below one, it
Menon-Johansson (2005) examined this position empirically with            can thus be hypothesized that good governance will result in
respect to the role of good governance in controlling the spread of       greater control over the spread of a pandemic.
human immunodeficiency virus (HIV) and found evidence that                    In the absence of a globally approved and available vaccine (and
global HIV prevalence is related significantly to poor governance.         arguably for a substantial period of time following the approval and
A respiratory pandemic like COVID-19 may have a lower mor-                availability of a vaccine), the effective management of any global
bidity rate than AIDS, but it has much more rapid transmission            health crisis like the COVID-19 pandemic would be expected to
chains, due to more ubiquitous modes of transmission. Intuitively         require public health measures to remain in place that curb and
then, the relationship between good governance or institutional           control people’s movements and affect their normal way of life. It is
quality and the spread of a respiratory pandemic like COVID-19            these curbs and controls that can test the faith that a country’s
is expected to be more pronounced, given that the necessary               population places in the credibility of their government’s commit-
preventative measures involve far more stringent restrictions on          ment. As Acemoglu et al. (2021) pointed out, the effectiveness of

2                         HUMANITIES AND SOCIAL SCIENCES COMMUNICATIONS | (2021)8:203 | https://doi.org/10.1057/s41599-021-00876-w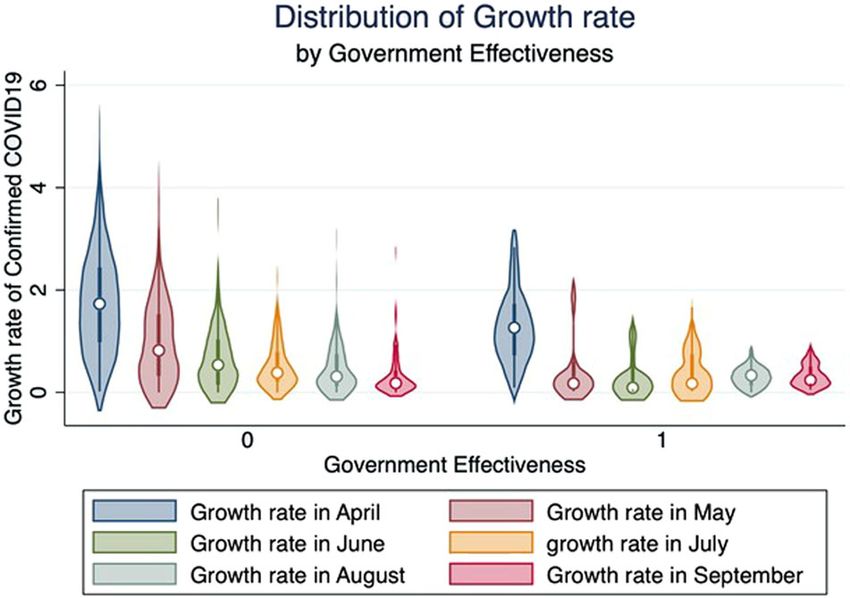
HUMANITIES AND SOCIAL SCIENCES COMMUNICATIONS | https://doi.org/10.1057/s41599-021-00876-w                                             ARTICLE

government regulations in curbing a pandemic depends on whether              control over a pandemic crisis will be impacted adversely by poor
people are compliant with them. The rampant ‘anti-lockdown’                  quality governance.
protests that have been reported in various parts of the world                  The rest of the paper is organized as follows. The next section
during the COVID-19 crisis indicate that people will be particularly         provides details of the data, describes the variables, and illustrates
unwilling to compromise on their freedom of mobility if they do              the research method. The third section then presents the results of
not have faith in the credibility of the commitment made by their            the regression analysis and discusses their implications. The fourth
government and political leadership. Freedom of mobility is of               section presents various robustness checking exercises to support
course the most obvious aspect of normal life that will be impacted          the reported results. The fifth and concluding section discusses the
by the public health measures put in place to break the chains of            study’s limitations and suggests a direction for future research.
transmission and curb the spread of a respiratory pandemic. Var-
ious studies have examined the efficacy of spatial analysis of
population mobility, with policy implications for epidemic control           Research materials and methods
in terms of putting the right response measures into place (Wei and          Data sourcing and description of key variables. Our data on
Wang, 2020). However, a lack of faith in the credibility of the              government effectiveness and other constituents of good governance,
government’s commitment can arguably lead to non-compliance                  namely rule of law, regulatory quality, control of corruption, voice
with public health measures, thus exacerbating a crisis even if the          and accountability, and political stability, were sourced from the
right public health steps are taken.                                         World Bank WGI database. We use the values for 2018. According
   Compliance with government policy requires individuals to                 to the World Bank, the government effectiveness variable “… cap-
sacrifice some of their autonomy in order to adhere to the orders of          tures perceptions of the quality of public services, the quality of the
the state, and very often compliance with public health policy can be        civil service and the degree of its independence from political pressures,
deemed an act of faith on the part of citizens (Goldstein and                the quality of policy formulation and implementation, and the cred-
Wiedemann, 2021). Indeed, to be willing to sacrifice personal free-           ibility of the government’s commitment to such policies” (World
doms (especially the freedoms of mobility and social association) as a       Bank, 2020). This is deemed the most broad-based, catch-all con-
necessary part of compliance with governmental directives, citizens          stituent of WGI with regard to the quality of governance, whereas
must have what Job (2005) refers to as ‘rational trust’: an innate faith     the other five WGI constituents are more specific. This study,
which cuts across political divides and makes citizens feel that             therefore, uses government effectiveness as its main explanatory
complying with governmental directives is in their own best interests        variable, as the best single proxy for governance quality. The data on
rather than solely in the interests of the governing regime. This innate     the COVID-19 positive and growth rates for the months of April to
faith stems from public confidence in the credibility of the govern-          September 2020 were sourced from the WHO online database
mental institutions and machinery to deliver in a time of need; i.e.,        (WHO, 2020) and Our World in Data (OWID, 2020), which in turn
public confidence of being in good hands. What would inspire such             are sourced from the Johns Hopkins University COVID-19 Dash-
an innate faith and resultant public confidence? Among other things,          board. According to WHO, the positive rate is an appropriate metric
the past track record of the governmental institutions and machinery,        for cross-country testing adequacy because it captures the quantum
in terms of how effectively they have met public expectations in             of testing being done in a country relative to the size of the outbreak
delivering the desired public goods, especially at times of crisis.          it is experiencing. For the purposes
                                                                                                                    of this study, the positive rate is
                                                                                              Total tests ´ 100 . According to WHO, a positive rate
                                                                             calculated as Positive  tests
Therefore, one may logically hypothesize that government effective-
ness may result in higher public trust and therefore higher levels of        of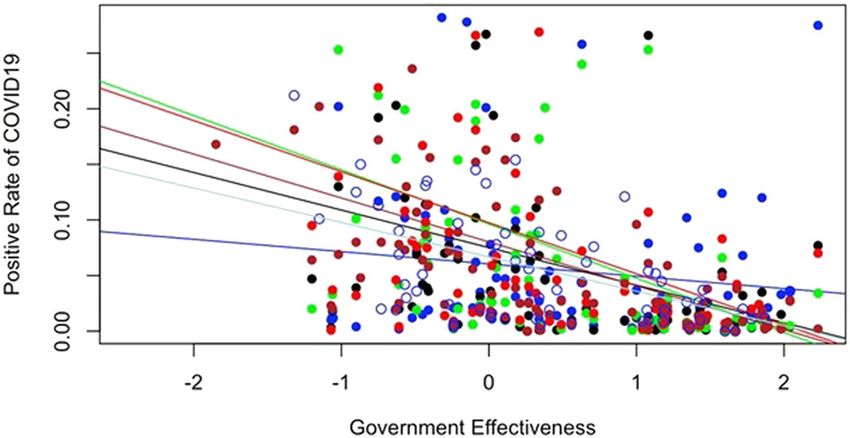
ARTICLE                                       HUMANITIES AND SOCIAL SCIENCES COMMUNICATIONS | https://doi.org/10.1057/s41599-021-00876-w

 Table 1 List of the control variables used in the study with their descriptions, data sources, and years.

 Variable name                          Operating description                                                        Data source
 Ruggedness                             Topological ruggedness is captured via an index that varies from 0 to 7:     Nunn and Puga (2012)
                                        the higher the index, the higher the country’s ruggedness.
 Landlock                               Dummy variable for the landlocked country: it takes a value of 1 if a        Nunn and Puga (2012)
                                        country is landlocked, and is 0 otherwise.
 Distance from centroid to              Distance from the geographical centroid of a country to the nearest coast    Gallup et al. (1999)
 nearest coast/river                    or river.
 Latitude (abs.)                        Absolute value of a country’s latitude.                                      Gallup et al. (1999)
 Level of air pollution (2017 data)     PM 2.5 air pollution, mean annual exposure (microgram per cubic meter).      World Development Indicator (WDI)
                                                                                                                     database of the World Bank
 Urban population (2017 data)           Percentage of a country’s total population that is living in urban areas.    World Development Indicator (WDI)
                                                                                                                     database of the World Bank
 Polity ranking (2018 data)             The net result of subtracting a polity’s institutionalized autocracy score   Polity5 project (2018)
                                        from its institutionalized democracy score to generate an aggregate
                                        democracy variable ranging in value from –10 to 10. The higher the rank,
                                        the more democratic the country’s socio-political institutions are.
 Median age (2017 data)                 Median age of total population.                                              World development indicator (WDI)
                                                                                                                     database of the World Bank
 GDP per capita (log)                   GDP per capita, corrected for purchasing power parity (GDP-PPP), on a        World development indicator (WDI)
 (2018 data)                            log scale.                                                                   database of the World Bank

 Table 2 Descriptive statistics pertaining to the dependent,
 explanatory and control variables.

 Variable                   Obs       Mean       Std. dev.   Min    Max
 Govt. effectiveness        185         0.005      0.994     −2.45     2.23
 Ruggedness                 176         1.37        1.298     0.003    6.74
 Landlock                   177         0.22       0.416      0        1
 Distance from centroid     157       449.126    558.109      1.043 3418.48
 to nearest cost/river
 Latitude (abs.)            175        25.719     17.201       0.446    64.99
 Level of air pollution     184        27.771     19.03        5.861    99.734
 Urban population           232        60.88      24.966       0       100
 Polity ranking             165         4.133      6.16          −10    10
 Median age                 186        30.553      9.073      15.1      48.2
 GDP per capita (log)       184         9.225      1.17        6.535     11.648
 growth rate_apr            173         1.705      1.047       0.02      5.267
 growth rate_may            182         0.885      0.901       0         4.234
 growth rate_jun            185         0.591      0.585       0          3.578
 growth rate_jul            185         0.526      0.533       0          3.108    Fig. 1 Distribution of the COVID-19 positive rate by government
 growth rate_aug            185         0.419      0.478       0          3.031    effectiveness.
 growth rate_sep            185         0.300      0.354       0         2.759
 positive rate_apr           78         0.054      0.067       0         0.282
 positive rate_may           84         0.057      0.097       0         0.528
 positive rate_jun           86         0.072      0.108       0         0.541
 positive rate_jul           83         0.074      0.118       0         0.648
 positive rate_aug           93         0.066      0.086       0         0.483
 positive rate_sep           66         0.056      0.058       0         0.323

Fig. 2 shows violin plots of the COVID-19 growth rate data. The
plots are obtained by splitting the COVID-19 positive (growth)
rate data into two categories: ‘0’, which consists of COVID-19
rates from April to September 2020 for all of those countries in
which the government effectiveness measure is below the global
average; and ‘1’, which consists of COVID-19 rates from April to
September 2020 for those countries in which the government
effectiveness measure is at or above the global average.
   Each figure consists of a traditional box-and-whisker plot that
shows the outlier observations along the whisker (or stem),
combined with a wraparound kernel density plot. The central
white spots in the violins are the medians, with the dark line                     Fig. 2 Distribution of the COVID-19 growth rate by government
through the middle representing the interquartile range. The                       effectiveness.
thicker sections of the violins represent a higher probability of
observations taking on a certain value relative to the thinner                     countries with higher government effectiveness and those with
sections. The visual differences between the ‘0’ and ‘1’ categories                lower government effectiveness. In particular, it is clearly
are stark enough to allow us to posit our main hypothesis that                     observed that the median values for the ‘1’ category plot are lower
there is a systemic difference in pandemic control between                         than the median values for the ‘0’ category, indicating a systemic

4                             HUMANITIES AND SOCIAL SCIENCES COMMUNICATIONS | (2021)8:203 | https://doi.org/10.1057/s41599-021-00876-w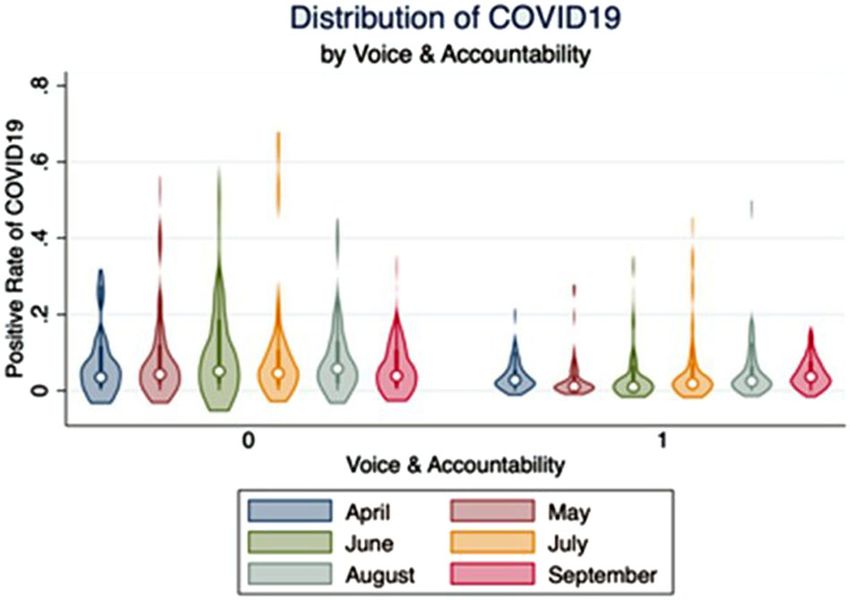
HUMANITIES AND SOCIAL SCIENCES COMMUNICATIONS | https://doi.org/10.1057/s41599-021-00876-w                                                                       ARTICLE

underlying difference. Armed with this visual ratification of our                            differential impacts of the two different categories of control vari-
main hypothesis of an inverse relationship between the quality of                           ables on the hypothesized bivariate relationship.
governance and the spread of the COVID-19 pandemic in any                                      The level of air pollution is deemed an important control variable
given country, we set up a series of regression models, as is                               because several studies have indicated the existence of a positive
described sequentially below.                                                               relationship between air pollution and COVID-19 spread (Zhu et al.,
   Base model with only government effectiveness and a dummy                                2020; Frontera et al., 2020; Accarino et al., 2021). Likewise, the per-
for continent fixed effects plus an error term:                                              centage of a country’s population that lives in urban areas is con-
                                                                                           sidered an important control variable because, given its modes of
           positive ratei ¼ β0 þ β1 government effectiveness  i
                                                                                     ð1Þ   transmission, COVID-19 is expected to spread more rapidly in places
                             þ β2 continent fixed effect dummy i þ ϵi                       with higher population densities, such as big towns and cities, where
   Here (and in subsequent equations), the subscript i represents                           it is relatively more difficult to maintain strict physical distancing.
each country in the sample.                                                                 Polity ranking is used because the form of government can indicate
   Equation (1) is the base model; it hypothesizes a linear rela-                           the extent to which strict physical distancing and other stringent
tionship between the COVID-19 positive rate and the level of                                measures for controlling the spread of infection can be enforced on
government effectiveness, with no other control variables inclu-                            the country’s general population. Autocratic governments with little
ded but continent fixed effects added in. The purpose is to                                  regard for or fear of electoral backlash can enforce physical distan-
determine whether or not the regression coefficient associated                               cing, large-scale lockdowns, and other stringent measures of infection
with government effectiveness comes out as significant, and also                             control much more harshly than democratic governments, which
to check whether the sign of the coefficient is indeed negative, in                          would be expected to take into consideration the effect of harsh
line with the main hypothesis.                                                              measures on future electoral prospects, among other things. In regard
   An expanded model with four additional geographic control                                to the median age of a country’s population, prior studies have shown
variables:                                                                                  a direct relationship between age and susceptibility to severe cases of
                                                                                           COVID-19 (Palmieri et al., 2020; Onder et al., 2020). However, the
positive ratei ¼ γ0 þ γ1 government effectiveness                                           objective of this study is to explore the relationship (if any) between

                                                 i

               þ γ2 continent fixed effect dummy i þ γ3 ruggedness i þ γ4 ðlandlockÞi       government effectiveness and measures of pandemic spread, rather

               þ γ5 distance from centroid to nearest coast=river i                         than disease severity. Thus, we include the median age of a country’s
               þ γ6 ðlatitudeÞi þ ei                                                        population to control for potential mobility, with the underlying
                                                                                            assumption that the pandemic will spread more in countries with
                                                                                      ð2Þ
                                                                                            younger populations because they will be relatively more mobile. In
   Equation (2) includes all of the terms from the base model (1)                           line with prior studies, GDP per capita (on a log scale) adjusted for
plus four geographic control variables—ruggedness, landlock,                                purchasing power parity (PPP) is also included in this study to
distance from the centroid to nearest coast/river, and latitude. The                        control for a country’s socio-economic status.
fact that geographic features can influence the spread and severity                             Three other regression models similar to (1)–(3) were also esti-
of communicable diseases in general, and communicable                                       mated, with the COVID-19 growth rate as the dependent variable in
respiratory diseases in particular, is well-documented in the                               place of the positive rate but the same explanatory and control
pertinent literature (McLafferty, 2010; Hart, 2015; Pearce et al.,                          variables as before. The purpose of this is to lend additional support
2017; Crocker et al., 2020). Because COVID-19 is a respiratory                              to the findings via an alternative operationalization of pandemic
pandemic, we considered it necessary to include a set of geo-                               spread. These three additional regression models are specified below.
graphic control variables to control for geographical variations                               Base model with only government effectiveness and a dummy
among the countries in the data set that might impact the dif-                              for continent fixed effects plus an error term:
ferential spread and progress of the pandemic.
                                                                                                growth rate i ¼ β0 þ β1 government effectiveness i
   An expanded model with additional demographic and socio-                                                                                                                     ð4Þ
economic control variables:                                                                                     þ β2 continent fixed effect dummy i þ ϵi
                                                                                             An expanded model with four additional geographic control
 positive ratei ¼ ϕ0 þ ϕ1 government effectiveness i
                                                                                          variables:
                  þ ϕ2 continent fixed effect dummy i þ ϕ3 ruggedness i
                                                                                            growth ratei ¼ γ0 þ γ1 government effectiveness
                þ ϕ4 ðlandlockÞi þ ϕ5 distance from centroid to nearest coast=river                                                           i
                                                                                     i
                                                                                                            þ γ2 continent fixed effect dummy i þ γ3 ruggedness i þ γ4 ðlandlockÞi
                þ ϕ6 ðlatitudeÞi þ ϕ7 level of air pollution i
                                                                                                          þ γ5 distance from centroid to nearest coast=river i þ γ6 ðlatitudeÞi þ ei
                þ ϕ8 urban population ½% i þ ϕ9 polity ranking i

                þ ϕ10 median age i þ ϕ11 GDP per capita log i þ ξ i                                                                                                              ð5Þ
                                                                                      ð3Þ     An expanded model with additional demographic and socio-
                                                                                            economic control variables:
   Equation (3) includes all of the same terms as Eq. (2) plus our
                                                                                             growth ratei ¼ ϕ0 þ ϕ1 government effectiveness
five demographic and socio-economic control variables—level of                                                                                   i
air pollution, urban population (%), polity ranking, median age                                            þ ϕ2 continent fixed effect dummy i þ ϕ3 ruggedness i þ ϕ4 ðlandlockÞi

and GDP per capita in PPP (log).                                                                           þ ϕ5 distance from centroid to nearest coast=river i

   In accordance with standard OLS assumptions, the error terms in                                         þ ϕ6 ðlatitudeÞi þ ϕ7 level of air pollution i

the regression models under study are all assumed to be distributed                                        þ ϕ8 urban population ½% i þ ϕ9 polity ranking i
normally with zero mean and constant variance. The control vari-
                                                                                                           þ ϕ10 median age i þ ϕ11 GDP per capita log i þ ξ i
ables have been included in stages in order to allow any confounding
effects of geographic vis-à-vis demographic and socio-economic                                                                                                                   ð6Þ
factors on the base model to be isolated as much as possible. An                              These regression models are all estimated by ordinary least
alternative approach could start with the most comprehensive model                          square (OLS) methods. Robust standard errors are reported. For
and then apply a stepwise variable culling algorithm to finally arrive                       each of the dependent variables, we estimate a separate regression
at the most parsimonious model that best fits the data. However, we                          equation for each month from April 2020 to September 2020. An
decided that the approach adopted here would best reveal any                                additional regression is also estimated by taking the average

HUMANITIES AND SOCIAL SCIENCES COMMUNICATIONS | (2021)8:203 | https://doi.org/10.1057/s41599-021-00876-w                                                                            5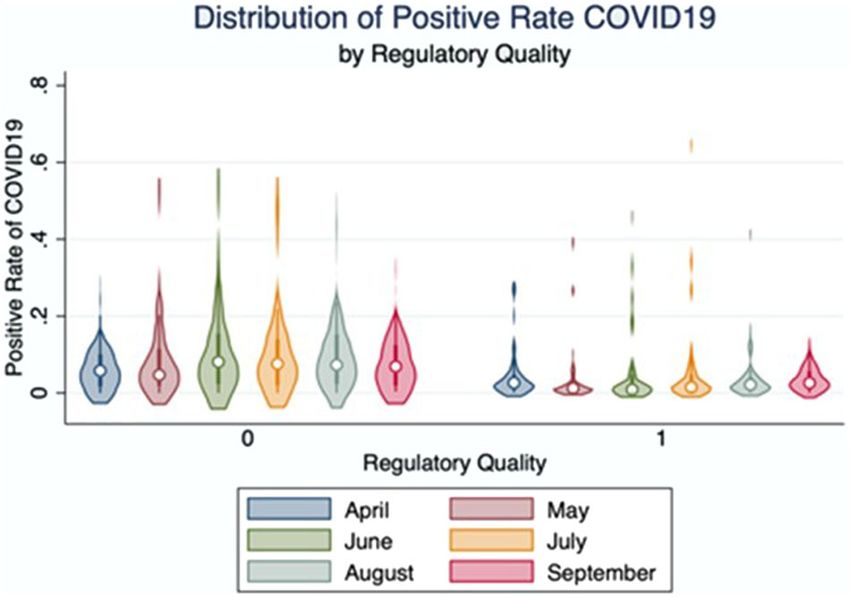
ARTICLE HUMANITIES AND SOCIAL SCIENCES COMMUNICATIONS | https://doi.org/10.1057/s41599-021-00876-w
1.00
(16)
Table 3 Pairwise correlations among the six WGI
constituent dimensions.
0.83*
1.00
(15)
Variables (1) (2) (3) (4) (5) (6)
(1) Control of corruption 1.00
0.90*
0.78*
1.00
(2) Govt. effectiveness 0.92* 1.00
(14)
(3) Regulatory quality 0.88* 0.94* 1.00
(4) Rule of law 0.94* 0.94* 0.93* 1.00
0.90*
0.73*
(5) Political stability 0.77* 0.74* 0.70* 0.76* 1.00
0.81*
1.00
(13)
(6) Voice and 0.77* 0.73* 0.79* 0.78* 0.68* 1.00
accountability
0.67*
0.62*
0.75*
0.91*
1.00
(12)
*Shows significance at the 0.05 level.
values of the dependent variables for six months. Although we
0.70*
0.46*
0.58*
0.57*
0.81*
1.00
(11)
have a maximum sample size of 185 countries, the sample size
varies across regressions depending on the availability of data for
the dependent and explanatory variables.
−0.26*
−0.29*
−0.22*
−0.23*
1.00
−0.09
0.03
(10)
We check the robustness of the hypothesized relationship by
conducting a sub-sample analysis in which we run regressions
after excluding countries from Africa, Asia, Europe, North
−0.45*
−0.34*
−0.39*
Table 4 Pairwise correlations among variables in the study with the COVID-19 positive rate as the dependent variable.
−0.37*
−0.37*
0.81*
1.00
−0.21
America, Oceania, South America, and the Organization of
(9)
Economic Cooperation and Development (OECD) from the total
sample in turn. The objective here is to check the sensitivity of
0.35*
our results to variations in samples. This approach also addresses
0.16*
1.00
0.04
0.06
−0.03
−0.19
−0.17
−0.12
a possible omitted variable bias that may be caused by the
(8)
inclusion of a group of countries. We also run separate regres-
sions using the samples of countries in Africa, Asia, Europe, and
0.55*
0.73*
1.00
0.09
−0.05
0.03
0.01
−0.14
0.12
0.15
the OECD.
(7)
We refrain from using all six WGI constituents as explanatory
variables in the same regression model because there are sig-
−0.50*
0.30*
−0.36*
−0.52*
0.33*
−0.31*
1.00
nificant inter-correlations between these constituents, as Table 3
0.07
0.22
0.10
0.21
(6)
shows. Such significant inter-correlations can cause multi-
collinearity issues in OLS regression models. Therefore, by way
of robustness checking, separate regression models have been
0.69*
0.24*
0.54*
0.43*
−0.28*
−0.39*
−0.38*
−0.27*
−0.25*
−0.31*
1.00
−0.23
estimated using each of the other five WGI constituents as the
(5)
main explanatory variable in place of government effectiveness,
with the COVID-19 positive rate as the dependent variable.
0.16*
1.00
0.00
−0.04
−0.04
−0.02
−0.03
−0.01
0.14
−0.14
−0.14
−0.14
−0.16
(4)
Results and implications
The pairwise correlations are shown in Table 4 inform the first
0.42*
−0.26*
−0.16*
−0.31*
1.00
−0.04
−0.04
−0.09
0.06
−0.03
−0.10
0.16
0.12
0.12
three OLS regression models that use the COVID-19 positive rate
(3)
from April to September 2020 as the dependent variable. The
pairwise correlations are shown in Table 5 inform the next three
0.22*
1.00
0.04
−0.06
−0.06
0.07
0.07
−0.20
−0.05
−0.05
−0.03
−0.01
−0.10
0.14
−0.11
OLS regression models that use the COVID-19 growth rate from
(2)
April to September 2020 as the dependent variable.
The cross-country data distributions for the COVID-19 posi-
0.80*
−0.48*
−0.45*
−0.34*
−0.43*
0.56*
0.78*
0.38*
−0.39*
0.53*
tive rate are shown in Fig. 3, with one panel for each of the
−0.31*
1.00
0.00
−0.09
−0.14
−0.14
6 months in the period considered in the study, April–September
(1)
2020. The red dashed vertical line in each panel of Fig. 3 marks
the 5% level, because a COVID-19 positive rate of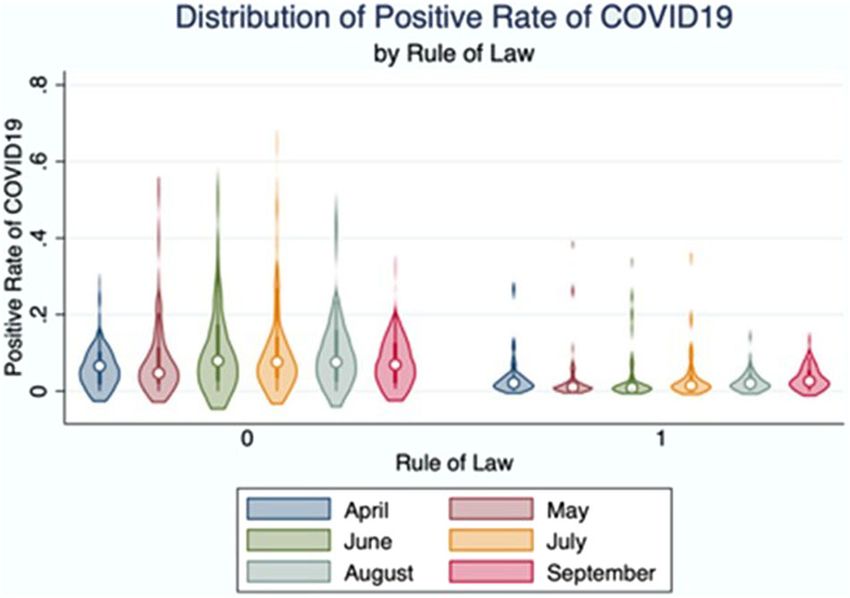
HUMANITIES AND SOCIAL SCIENCES COMMUNICATIONS | https://doi.org/10.1057/s41599-021-00876-w ARTICLE
growth rate as the dependent variable and government effectiveness
1.00
(16)
as the explanatory variable and include all of the control variables.
Table 6 results show that the explanatory variable government
0.45*
1.00
(15)
effectiveness has a statistically significant regression coefficient in
five out of the 6 months that are considered in the study (columns
1–6). In addition, the coefficient is highly significant in column 7
0.39*
1.00
0.04
(14)
where average values of the positive rates for six months are used
as the dependent variable.
The results in Table 7 show that the explanatory variable
0.58*
1.00
−0.06
0.12
government effectiveness has a statistically significant regression
(13)
coefficient in 4 of the 6 months considered here. The coefficient
estimated using the average values of the dependent variable is
−0.20*
0.54*
0.15*
1.00
−0.12 also highly significant. The estimated coefficient is always nega-
(12)
tive, which supports our hypothesis that better governance is
associated with lower COVID-19 infections.
To put the estimated coefficient into perspective, we consider
0.44*
0.21*
1.00
0.03
−0.12
−0.13
column 7 of Tables 6 and 7. For ease of interpretation of the
(11)
estimated coefficient, we have calculated the beta coefficient of
the explanatory variable of interest. The beta coefficient of
−0.40*
−0.50*
−0.29*
−0.22*
government effectiveness is –0.45, corresponding to the esti-
1.00
−0.08
0.09
(10)
mated coefficient reported in column 7 of Table 6.1 This implies
that, on average, one standard deviation higher level of gov-
Table 5 Pairwise correlations among variables in the study with the COVID-19 growth rate as the dependent variable.
−0.48*
ernment effectiveness is associated with a 0.45 standard devia-
−0.54*
−0.34*
−0.27*
0.81*
0.18*
1.00
−0.02
tion lower positive rate. Similarly, the corresponding beta
(9)
coefficient of –0.85 from column 7 of Table 7 implies that one
standard deviation higher government effectiveness is associated
−0.20*
−0.22*
0.35*
0.16*
0.19*
1.00
−0.02
0.03
−0.14
with an 0.85 standard deviation lower growth rate on average
(8)
(Figs. 6 and 7).
Of the various controls, only the level of air pollution and the
0.55*
0.73*
−0.23*
−0.19*
1.00
−0.04
median age of the population seems to show some evidence of
0.10
−0.14
0.12
−0.12
(7)
having any significant bearing on the COVID-19 positive and
growth rates, as per the results in Tables 6 and 7 respectively.
However, for the level of air pollution, neither the level of sig-
−0.50*
0.43*
0.34*
−0.36*
−0.52*
0.33*
−0.31*
1.00
−0.06
−0.07
−0.01
nificance nor the sign of the relationship is observed to be
(6)
consistent enough across the different months understudy to
warrant any special attention. For the median age of the
0.69*
0.24*
0.54*
0.43*
−0.29*
−0.27*
−0.22*
−0.23*
−0.33*
−0.16*
0.17*
1.00
population, the relationships with both the COVID-19 positive
(5)
and growth rates bear negative signs across the months in the
study for which the relevant regression coefficients are observed
0.16*
−0.16*
1.00
0.04
0.04
to be statistically significant. This is consistent with the intuitive
0.14
−0.14
−0.14
−0.14
−0.16
0.16
0.15
−0.13
(4)
position that the lower the median age of the population (i.e.,
the younger the population), the higher the mobility and
therefore the greater the speed of transmission. Thus, an inverse
0.42*
−0.26*
−0.16*
−0.31*
0.00
1.00
−0.09
0.02
−0.05
0.10
0.12
0.12
0.12
0.13
relationship can be observed between the median age of a
(3)
country’s population and both the COVID-19 positive and
growth rates. It should be noted that this does not contradict the
0.22*
−0.23*
1.00
0.04
0.04
−0.06
−0.06
0.07
0.07
−0.07
−0.03
−0.01
0.14
0.14
current medical view that older people infected with the novel
−0.11
(2)
coronavirus tend to have a poorer prognosis than younger
people who are otherwise healthy. Older people may still be
0.80*
−0.48*
−0.42*
0.56*
0.78*
−0.59*
0.38*
−0.27*
0.53*
more prone to serious complications, and therefore the rate of
−0.51*
0.00
1.00
−0.09
0.05
−0.10
−0.14
fatality may be higher in countries with a higher median
(1)
population age than in countries with a lower median age.
However, we consider the positive and growth rates of COVID-
(4) Distance from centroid to nearest coast/river
19, which are indicators of pandemic spread, rather than the rate
of fatality.2
We now go back to the regression results reported in Tables 6
and 7 to obtain further insights into the estimated relationship.
*Shows significance at the 0.05 level.
As can be seen from Table 6, the COVID-19 positive rate retains
a significant negative relationship with government effectiveness
(7) Urban population (%)
(10) GDP per capita (log)
for five of the six months in the study; in fact, it shows stronger
(6) Level of air pollution
(1) Govt. effectiveness
(12) Growth rate_may
(15) Growth rate_aug
(16) Growth rate_sep
(13) Growth rate_jun
(11) Growth rate_apr
(14) Growth rate_jul
levels of significance in the later months of the study than in the
(5) Latitude (abs)
(8) Polity ranking
earlier months. A plausible implication of these findings is that
(9) Median age
(3) Landlock
while the effect of quality of governance may take a while to
(2) Rugged
Variables
crystallize in terms of specific policy measures (e.g. the daily
number of COVID-19 tests conducted relative to the size of a
country’s population), it nevertheless offers an initial resistance to
HUMANITIES AND SOCIAL SCIENCES COMMUNICATIONS | (2021)8:203 | https://doi.org/10.1057/s41599-021-00876-w 7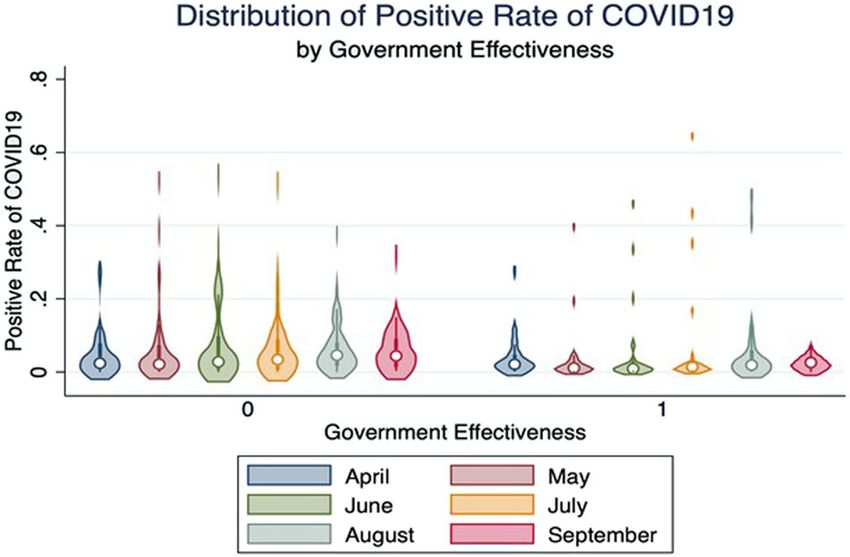
ARTICLE HUMANITIES AND SOCIAL SCIENCES COMMUNICATIONS | https://doi.org/10.1057/s41599-021-00876-w
12 10.0
9 7.5
10
Distribution of data
Distribution of data
Distribution of data
6 5.0
5
3 2.5
0 0 0.0
0.0 0.1 0.2 0.0 0.2 0.4 0.0 0.2 0.4
Positive rate of COVID19 in April Positive rate of COVID19 in May Positive rate of COVID19 in June
10.0 10.0
10.0
7.5 7.5
7.5
Distribution of data
Distribution of data
Distribution of data
5.0 5.0
5.0
2.5 2.5 2.5
0.0 0.0 0.0
0.0 0.2 0.4 0.6 0.0 0.1 0.2 0.3 0.4 0.5 0.0 0.1 0.2 0.3
Positive rate of COVID19 in July Positive rate of COVID19 in August Positive rate of COVID19 in September
Fig. 3 Distribution of the COVID-19 positive rate across countries.
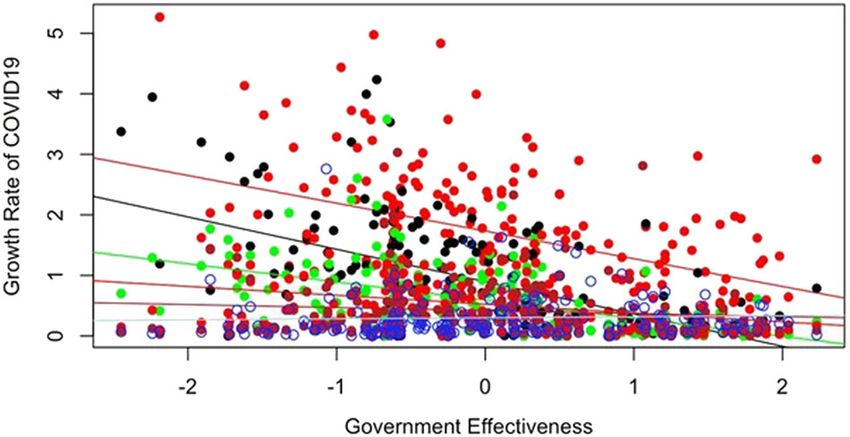
Fig. 4 The relationship between government effectiveness and the COVID- Fig. 5 The relationship between government effectiveness and the COVID-
19 positive rate. 19 growth rate.
the disease’s growth that can probably be attributed to an attributed intuitively to the faith that a country’s population
inherently better allocation of administrative resources, owing to places on its government’s commitment. Such faith is built
institutional efficiency. overtime via quality of governance. However, faith in the
It is interesting, however, to observe that, after showing sig- credibility of a government’s commitment can face a tough test
nificance in the initial months in the study, the relationship in the later stages of a pandemic, when people’s willingness to
between the COVID-19 growth rate and government effective- continue complying with government directives starts to wear
ness in Table 7 (and also Tables S2.1 and S2.2 in the supple- thin as the economic consequences of such compliance become
mentary materials) abruptly becomes insignificant. The more severe. Arguably, this may cause the pandemic growth in
estimated coefficients also become much smaller in the later later stages, especially during the so-called second or third waves
months. The most likely reason for this is that people are gen- of the outbreak, to lose its relationship with government effec-
erally more inclined to comply with government directives on tiveness to a certain degree, as people become less inclined to
social distancing and other measures that restrict their mobility comply with any governmental directives that restrict their
in the initial stages of the pandemic outbreak, which can be mobility. Another possible explanation for the results could be
8 HUMANITIES AND SOCIAL SCIENCES COMMUNICATIONS | (2021)8:203 | https://doi.org/10.1057/s41599-021-00876-w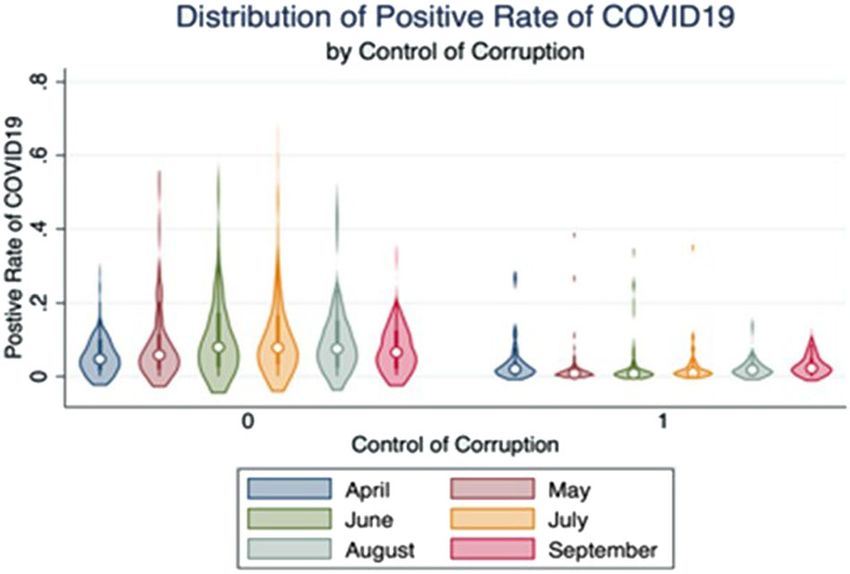
HUMANITIES AND SOCIAL SCIENCES COMMUNICATIONS | https://doi.org/10.1057/s41599-021-00876-w ARTICLE
Predicted values of positive rate at different values of govt. effectiveness
April May June July
.2
.3
.3
.2
0 .05 .1 .15
Linear Prediction
Linear Prediction
Linear Prediction
Linear Prediction
0 .05 .1 .15
.2
.2
.1
.1
0
0
-.05
-.05
-.1
-.1
-1.8 -.8 .2 1.2 2.2 -1.8 -.8 .2 1.2 2.2 -1.8 -.8 .2 1.2 2.2 -1.8 -.8 .2 1.2 2.2
Govt Effectiveness Govt Effectiveness Govt Effectiveness Govt Effectiveness
August September Average
.3
.3
.2
0 .05 .1 .15
Linear Prediction
Linear Prediction
Linear Prediction
.2
.2
.1
.1
0
0
-.05
-.1
-.1
-1.8 -.8 .2 1.2 2.2 -1.8 -.8 .2 1.2 2.2 -1.8 -.8 .2 1.2 2.2
Govt Effectiveness Govt Effectiveness Govt Effectiveness
Fig. 6 Predicted values of the COVID-19 positive rate at different values of government effectiveness.
Predicted values of growth rate at different values of govt. effectiveness
April May June July
.3
3
.3
.2
1 1.5 2 2.5
Linear Prediction
Linear Prediction
Linear Prediction
Linear Prediction
0 .05 .1 .15
.2
.2
.1
.1
0
0
.5
-.05
-.1
-.1
-1.8 -.8 .2 1.2 2.2 -1.8 -.8 .2 1.2 2.2 -1.8 -.8 .2 1.2 2.2 -1.8 -.8 .2 1.2 2.2
Govt Effectiveness Govt Effectiveness Govt Effectiveness Govt Effectiveness
August September Average
.3
.3
.2
0 .05 .1 .15
Linear Prediction
Linear Prediction
Linear Prediction
.2
.2
.1
.1
0
0
-.05
-.1
-.1
-1.8 -.8 .2 1.2 2.2 -1.8 -.8 .2 1.2 2.2 -1.8 -.8 .2 1.2 2.2
Govt Effectiveness Govt Effectiveness Govt Effectiveness
Fig. 7 Predicted values of the COVID-19 growth rate at different values of government effectiveness.
that many countries’ infection curves were flattening in these Another somewhat intriguing observation that emerges from
months, as they were approaching the end of the so-called first the results reported in Tables 6 and 7 is that while the estimated
wave. It is also possible that some other socio-economic or coefficient of government effectiveness in Table 6 gradually
geographic variables may be playing some role in this rela- increases in magnitude over time, that in Table 7 decreases in
tionship. Nevertheless, the estimated coefficients that use the magnitude over time. This could be due to the two different
6-month average values of the dependent variable, reported in operationalizations of the dependent variable. While both capture
column 7 of Tables 6 and 7, consistently show a significant the spread of COVID-19, different denominators are used in their
negative relationship between government effectiveness and the construction: a total number of tests for the positive rate vis-à-vis
spread of COVID-19. the total number of confirmed cases for the growth rate. However,
HUMANITIES AND SOCIAL SCIENCES COMMUNICATIONS | (2021)8:203 | https://doi.org/10.1057/s41599-021-00876-w 910
Table 6 The relationship between government effectiveness and the COVID-19 positive rate.
(1) (2) (3) (4) (5) (6) (7)
Apr May Jun Jul Aug Sep Average
ARTICLE
Govt. effectiveness −0.0261* (0.0145) −0.0285 (0.0186) −0.0452** (0.0194) −0.0552** (0.0236) −0.0520*** (0.0110) −0.0542*** (0.0136) −0.0420*** (0.0099)
Ruggedness −0.0065 (0.0054) −0.0047 (0.0080) 0.0007 (0.0076) 0.0020 (0.0098) 0.0011 (0.0063) −0.0003 (0.0057) 0.0005 (0.0055)
Landlock −0.0080 (0.0227) 0.0034 (0.0326) −0.0050 (0.0306) 0.0112 (0.0291) 0.0181 (0.0199) 0.0398* (0.0208) −0.0003 (0.0197)
Distance from centroid to −0.0000 (0.0000) −0.0000* (0.0000) −0.0000 (0.0000) −0.0000 (0.0000) −0.0000 (0.0000) −0.0000 (0.0000) −0.0000** (0.0000)
nearest coast/river
Latitude (abs.) 0.0000 (0.0006) 0.0000 (0.0009) −0.0009 (0.0009) −0.0010 (0.0010) −0.0002 (0.0008) 0.0004 (0.0009) −0.0003 (0.0006)
Level of air Pollution 0.0011** (0.0005) 0.0015** (0.0007) 0.0013** (0.0005) 0.0000 (0.0005) −0.0002 (0.0004) 0.0001 (0.0004) 0.0004 (0.0004)
Urban population 0.0006 (0.0007) 0.0009 (0.0010) 0.0013 (0.0010) 0.0021* (0.0011) 0.0010 (0.0006) 0.0007 (0.0006) 0.0011* (0.0006)
Polity ranking −0.0010 (0.0016) −0.0006 (0.0017) 0.0014 (0.0021) 0.0039* (0.0020) 0.0031** (0.0012) 0.0020 (0.0019) 0.0004 (0.0018)
Median age −0.0040** (0.0018) −0.0064*** (0.0023) −0.0067*** (0.0024) −0.0056** (0.0025) −0.0033** (0.0014) −0.0019 (0.0018) −0.0051*** (0.0016)
GDP per capita (log) 0.0323 (0.0220) 0.0279 (0.0306) 0.0288 (0.0300) 0.0114 (0.0308) 0.0143 (0.0173) 0.0083 (0.0165) 0.0218 (0.0169)
Cons −0.1811 (0.1822) −0.0760 (0.2499) −0.0762 (0.2481) 0.0089 (0.2760) −0.0484 (0.1408) −0.0142 (0.1658) −0.0518 (0.1346)
Obs. 68 74 75 73 82 59 86
R-squared 0.4480 0.5137 0.5734 0.5722 0.5142 0.4436 0.5416
Continent fixed effect Yes Yes Yes Yes Yes Yes Yes
Robust standard errors are given in parentheses.
***p < 0.01, **p < 0.05, *p < 0.1.
Table 7 The relationship between government effectiveness and the COVID-19 growth rate.
(1) (2) (3) (4) (5) (6) (7)
Apr May Jun Jul Aug Sep Average
Govt. effectiveness −0.3027* (0.1675) −0.3469** (0.1432) −0.2337*** (0.0826) −0.1993** (0.0894) −0.1048 (0.0944) −0.0923 (0.0932) −0.2091*** (0.0417)
Ruggedness −0.1505** (0.0758) 0.0197 (0.0600) 0.0691 (0.0464) 0.0874 (0.0540) 0.0321 (0.0302) −0.0129 (0.0232) 0.0023 (0.0290)
Landlock −0.2118 (0.2448) 0.0737 (0.1578) 0.0802 (0.1143) 0.0729 (0.0967) 0.0158 (0.0810) 0.0921 (0.1005) 0.0254 (0.0676)
Distance from centroid to nearest coast/river 0.0003 (0.0002) 0.0001 (0.0001) −0.0001 (0.0001) −0.0000 (0.0001) −0.0001* (0.0001) −0.0001** (0.0001) −0.0000 (0.0001)
Latitude (abs.) 0.0024 (0.0084) 0.0064 (0.0059) 0.0060 (0.0046) 0.0031 (0.0046) −0.0014 (0.0034) 0.0036 (0.0033) 0.0035 (0.0024)
Level of air pollution 0.0117** (0.0048) 0.0111** (0.0051) 0.0037 (0.0035) −0.0084*** (0.0031) −0.0016 (0.0021) 0.0002 (0.0015) 0.0030 (0.0022)
Urban population 0.0009 (0.0071) 0.0084* (0.0045) 0.0012 (0.0030) −0.0012 (0.0038) −0.0040 (0.0043) −0.0010 (0.0040) 0.0006 (0.0016)
Polity ranking −0.0118 (0.0240) 0.0082 (0.0136) 0.0134 (0.0100) 0.0098 (0.0107) 0.0036 (0.0101) 0.0176* (0.0093) 0.0076 (0.0065)
Median age −0.0197 (0.0270) −0.0304* (0.0154) −0.0217** (0.0108) −0.0181* (0.0103) 0.0085 (0.0111) 0.0127 (0.0128) −0.0106 (0.0067)
GDP per capita (log) −0.0103 (0.2060) −0.1168 (0.1298) 0.0902 (0.0958) 0.1955* (0.1164) 0.0954 (0.1171) 0.0321 (0.0814) 0.0584 (0.0465)
Cons 2.0078 (1.6558) 1.5865 (1.1426) −0.2606 (0.7767) −0.3890 (1.0908) −0.0574 (1.1455) −0.6804 (0.8132) 0.2345 (0.4051)
Obs. 137 142 144 144 144 144 144
R-squared 0.2769 0.4700 0.3730 0.3129 0.1721 0.1147 0.5165
Continent fixed effect Yes Yes Yes Yes Yes Yes Yes
Robust standard errors are given in parentheses.
***p < 0.01, **p < 0.05, *p < 0.1.
HUMANITIES AND SOCIAL SCIENCES COMMUNICATIONS | (2021)8:203 | https://doi.org/10.1057/s41599-021-00876-w
HUMANITIES AND SOCIAL SCIENCES COMMUNICATIONS | https://doi.org/10.1057/s41599-021-00876-wHUMANITIES AND SOCIAL SCIENCES COMMUNICATIONS | https://doi.org/10.1057/s41599-021-00876-w ARTICLE
in spite of any innate variations in the alternative oper-
ationalizations of the dependent variable, the regression results
−0.0433*
(0.0217)
are consistent in terms of the inverse relationship that is revealed
0.4567
OECD
between government effectiveness and pandemic spread. The
(7)
strength of this finding is augmented further when average values
50
of the dependent variable are used (see column 7 of Tables 6
and 7), which supports the idea that the relationship with gov-
ernment effectiveness is consistently negative irrespective of how
the dependent variable of interest is operationalized.
South America
−0.0443***
(0.0093)
Robustness checks
0.5680
Note: The dependent variable is the average value of the positive rate for the 6 months from April to September 2020. Each regression includes a constant, the controls, and continent-fixed effects, but these are not reported.
Robustness check via sub-sample analysis. We report the
(6)
80
regression results estimated with different country sub-samples to
check the robustness of the results obtained regarding the rela-
tionship between government effectiveness and COVID-19
spread. For the sake of brevity, we conduct the regression ana-
lysis using only average values of the dependent variables and
report only the estimated coefficient of the main explanatory
−0.0420***
variable of interest.
(0.0098)
Table 8 reports the regression results when the dependent
Oceania
0.5340
variable is the average value of the COVID-19 positive rate. Thus,
(5)
84
columns 1–7 of Table 8 are based on column 7 of Table 6 when
African, Asian, European, North American, Oceanian, South
American, and OECD countries, respectively, are excluded from
the total sample. As can be seen from Table 8, the coefficient of Table 8 Relationship between government effectiveness and the COVID-19 positive rate: sub-sample analysis.
government effectiveness is negative and significant at the
North America
conventional levels in all cases.
−0.0389***
Table 9 shows the corresponding results with the average value
(0.0091)
0.5376
of the COVID-19 growth rate as the dependent variable, further
corroborating the results found with the alternative operationa-
(4)
79
lization of the dependent variable of interest.
We now turn to regression results obtained using only the sub-
samples of African, Asian, European, and OECD countries,
respectively. To ensure a reasonably large sample size, we conduct
these analyses only for the average values of the growth rates of
−0.0426***
COVID-19 infections and consider only the African, Asian,
European, and OECD sub-samples. Table 10 reports the
(0.0147)
0.4663
Europe
regression results. Columns 1–4 show the results of the full
(3)
model. While the estimated coefficients of government effective-
56
ness are negative in all cases, only the African country sample
shows a significant coefficient. The insignificant coefficients for
the other country groups could be a result of the smaller sample
size or of the greater intra-group homogeneity among the
countries included in a group, which might be exacerbating the
−0.0457***
effects of multicollinearity amongst the explanatory and a number
(0.0143)
of the control variables. We investigate the latter suggestion by
0.5908
running the four regressions again, excluding per capita GDP
Asia
(2)
64
(accepting the risk of an omitted variable bias). The results are
presented in columns 5–8. It can be seen that all regressions
except for 6 (with the Asian sub-sample) are significant at
conventional levels. This provides credence to our contention that
the earlier insignificant results are attributable to multi-
collinearity. Overall, this sub-sample analysis supports the main
−0.0353*
(0.0197)
finding of a significant negative relationship between government
0.5491
Robust standard errors are given in parentheses.
Africa
effectiveness and the spread of COVID-19. It also helps to
(1)
67
counter the findings of Toshkov et al. (2020) that European
countries with relatively lower government effectiveness were
slower in their policy responses to curb COVID-19 spread.
Excluded Countries
Govt. effectiveness
Further robustness check using other WGI constituents as the
***p < 0.01, *p < 0.1.
explanatory variable. As was stated earlier, in addition to gov-
ernment effectiveness, there are five other constituents that make
R-squared
up the World Bank’s WGI compilation: rule of law, regulatory
Obs.
quality, control of corruption, voice and accountability, and
political stability. Figures 8–12 show individual violin plots of the
HUMANITIES AND SOCIAL SCIENCES COMMUNICATIONS | (2021)8:203 | https://doi.org/10.1057/s41599-021-00876-w 11ARTICLE HUMANITIES AND SOCIAL SCIENCES COMMUNICATIONS | https://doi.org/10.1057/s41599-021-00876-w
COVID-19 positive rates for each of these five WGI constituents.
Again, there are two categories, ‘0’ and ‘1’, where ‘0’ includes all
−0.1719***
countries that are ‘below average’ for the particular WGI measure
(0.0533)
and ‘1’ includes all countries that are ‘at or above average’.
0.2989
OECD
108
The violin plots are shown in Figs. 8–12, consistent with what
(7)
was seen for government effectiveness, again present visually
prominent distinctions in the distribution of the COVID-19
positive rate between countries in the ‘0’ and ‘1’ categories, with
lower medians and/or shorter interquartile ranges for countries in
the ‘1’ category than for those in the ‘0’ category.
South America
−0.2137***
We conducted separate regression estimations using each of
(0.0446)
Note: The dependent variable is the average value of the growth rate for the six months from April to September 2020. Each regression includes a constant, the controls, and continent-fixed effects, but these are not reported.
the WGI constituents (besides government effectiveness) as the
0.5140
main explanatory variable in turn. These additional regression
132
(6)
results are not reported here for the sake of brevity but are
included in the supplementary materials that accompany this
paper. The rule of law, regulatory quality, and control of
corruption all show significant negative relationships with the
COVID-19 positive rate across all 6 months under study. Voice
and accountability show a significant negative relationship with
−0.2025***
the COVID-19 positive rate in 4 of the 6 months understudy,
(0.0415)
Oceania
0.5073
while political stability shows a significant negative relationship in
two of the 6 months under study. However, regardless of
(5)
141
significance, the relationship sign is consistently negative for all of
the WGI constituents across all months under study. These
results further corroborate the main finding of the model
Table 9 Relationship between government effectiveness and the COVID-19 growth rate: sub-sample analysis.
reported in the previous section. The fact that voice and
North America
accountability and political stability seem to have weaker
influences on the COVID-19 positive rate than the other WGI
−0.2161***
(0.0439)
constituents may be related to the underlying dimensions of the
0.5043
quality of governance that those two WGI constituents are
(4)
131
designed to capture. It could be argued that they are somewhat
narrower in their focus than the other WGI constituents when it
comes to capturing the quality of governance. As was pointed out
earlier, our reason for choosing government effectiveness as our
main explanatory variable was the fact that it is arguably the most
broad-based among the various WGI constituents.
−0.1705***
(0.0467)
0.3758
Europe
Conclusion and direction for future research
(3)
110
This study has empirically explored data from a large number of
countries, spread across all of the major continents, to investigate
the relationship between the quality of governance and the spread
of COVID-19 infections. It has found statistically significant
evidence of an inverse relationship between quality of govern-
ance, captured via government effectiveness and five other mea-
−0.2544***
(0.0432)
sures, and the spread of the COVID-19 pandemic, captured via
0.6811
two alternative measures, namely the COVID-19 positive rate and
Asia
106
(2)
the COVID-19 growth rate. The study has controlled for the
possible confounding effects of a number of geographic, demo-
graphic, and socio-economic factors, and found the relationship
to be quite persistent, especially when using the COVID-19
positive rate as the dependent variable in the regression models.
This finding corroborates similar results obtained by Menon-
−0.1337**
Johansson (2005) for the global HIV epidemic, albeit using a
(0.0551)
0.6041
Africa
different methodology. Thus, there is mounting statistical evi-
100
dence that it does matter for the people of a country ‘to be in
(1)
Standard errors are given in parentheses.
good hands (i.e., to be administered by an effective government
with a high quality of governance) when it comes to defence
against epidemic outbreaks. However, at this juncture, it is
important to revisit and reconcile our findings with the somewhat
Excluded Countries
Govt. effectiveness
counter-intuitive findings reported by Toshkov et al. (2020). In a
***p < 0.01, **p < 0.05.
related context, Mizrahi et al. (2021) contended that, in the short
run, responsiveness may in fact be valued more than trust during
R-squared
traumatic times, which, if true, could at least partially explain the
Obs.
results obtained by Toshkov et al. (2020). Indeed, Toshkov et al.
(2020) themselves conceded that poorer countries with lower
12 HUMANITIES AND SOCIAL SCIENCES COMMUNICATIONS | (2021)8:203 | https://doi.org/10.1057/s41599-021-00876-wYou can also read


