Impacts of land use change and elevated CO2 on the interannual variations and seasonal cycles of gross - Earth System Dynamics
←
→
Page content transcription
If your browser does not render page correctly, please read the page content below
Earth Syst. Dynam., 11, 235–249, 2020
https://doi.org/10.5194/esd-11-235-2020
© Author(s) 2020. This work is distributed under
the Creative Commons Attribution 4.0 License.

           Impacts of land use change and elevated CO2 on the
            interannual variations and seasonal cycles of gross
                       primary productivity in China
            Binghao Jia1,2,3 , Xin Luo1 , Ximing Cai3 , Atul Jain4 , Deborah N. Huntzinger5 , Zhenghui Xie1 ,
       Ning Zeng1,6 , Jiafu Mao7 , Xiaoying Shi7 , Akihiko Ito8 , Yaxing Wei7 , Hanqin Tian9 , Benjamin Poulter10 ,
                                           Dan Hayes11 , and Kevin Schaefer12
        1 State   Key Laboratory of Numerical Modeling for Atmospheric Sciences and Geophysical Fluid Dynamics
                    (LASG), Institute of Atmospheric Physics, Chinese Academy of Sciences, Beijing, China
               2 Key Lab of Guangdong for Utilization of Remote Sensing and Geographical Information System,

                                      Guangzhou Institute of Geography, Guangzhou, China
                 3 Ven Te Chow Hydrosystems Laboratory, Department of Civil and Environmental Engineering,

                                University of Illinois at Urbana-Champaign, Urbana, Illinois, USA
         4 Department of Atmospheric Sciences, University of Illinois at Urbana-Champaign, Urbana, Illinois, USA
        5 School of Earth Sciences and Environmental Sustainability, Construction Management, and Environmental

                               Engineering, Northern Arizona University, Flagstaff, Arizona, USA
         6 Department of Atmospheric and Oceanic Science, University of Maryland, College Park, Maryland, USA
                              7 Environmental Sciences Division, Climate Change Science Institute,

                                  Oak Ridge National Laboratory, Oak Ridge, Tennessee, USA
         8 Center for Global Environmental Research, National Institute for Environmental Studies, Tsukuba, Japan
          9 International Center for Climate and Global Change Research, School of Forestry and Wildlife Sciences,

                                           Auburn University, Auburn, Alabama, USA
                            10 NASA GSFC, Biospheric Sciences Laboratory, Greenbelt, MD, USA
                             11 School of Forest Resources, University of Maine, Orno, Maine, USA
             12 National Snow and Ice Data Center, Cooperative Institute for Research in Environmental Sciences,

                                   University of Colorado at Boulder, Boulder, Colorado, USA
                                 Correspondence: Binghao Jia (bhjia@mail.iap.ac.cn)

                                   Received: 6 May 2019 – Discussion started: 14 May 2019
                       Revised: 8 October 2019 – Accepted: 24 November 2019 – Published: 9 March 2020

      Abstract. Climate change, rising CO2 concentration, and land use and land cover change (LULCC) are primary
      driving forces for terrestrial gross primary productivity (GPP), but their impacts on the temporal changes in
      GPP are uncertain. In this study, the effects of the three main factors on the interannual variation (IAV) and
      seasonal cycle amplitude (SCA) of GPP in China were investigated using 12 terrestrial biosphere models from
      the Multi-scale Synthesis and Terrestrial Model Intercomparison Project. The simulated ensemble mean value
      of China’s GPP between 1981 and 2010, driven by common climate forcing, LULCC and CO2 data, was found
      to be 7.4 ± 1.8 Pg C yr−1 . In general, climate was the dominant control factor of the annual trends, IAV and
      seasonality of China’s GPP. The overall rising CO2 led to enhanced plant photosynthesis, thus increasing annual
      mean and IAV of China’s total GPP, especially in northeastern and southern China, where vegetation is dense.
      LULCC decreased the IAV of China’s total GPP by ∼ 7 %, whereas rising CO2 induced an increase of 8 %.
      Compared to climate change and elevated CO2 , LULCC showed less contributions to GPP’s temporal variation,
      and its impact acted locally, mainly in southwestern China. Furthermore, this study also examined subregional
      contributions to the temporal changes in China’s total GPP. Southern and southeastern China showed higher

Published by Copernicus Publications on behalf of the European Geosciences Union.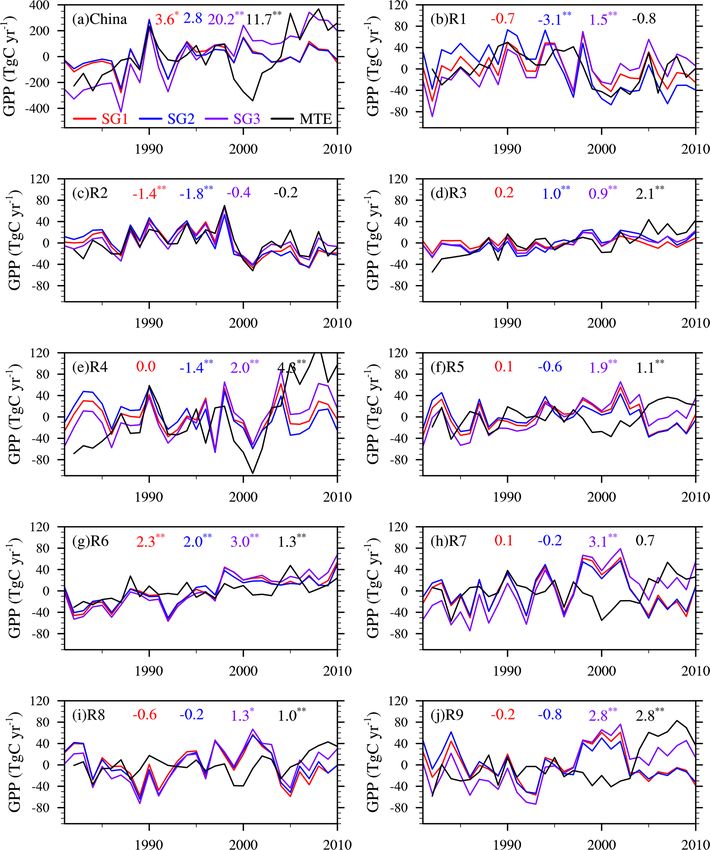
236                                              B. Jia et al.: Impacts of land use change and elevated CO2 on GPP in China

       contributions to China’s annual GPP, whereas southwestern and central parts of China explained larger fractions
       of the IAV in China’s GPP.

1   Introduction                                                       During the past decades, China has experienced tremen-
                                                                    dous LULCC as a result of continued population growth and
Terrestrial ecosystems can function as a major sink in              intensified human development against a broad background
the global carbon cycle, potentially offsetting a significant       of climate change (Piao et al., 2009; Liu and Tian, 2010;
amount of anthropogenic carbon emissions (Le Quéré et al.,          Xiao et al., 2015; Li et al., 2015; Zhang et al., 2016). These
2018). Gross primary productivity (GPP) is the major driver         massive LULCCs have made a significant contribution to re-
of terrestrial ecosystem carbon storage and plays a key role in     gional and global carbon sinks during the past few decades
terrestrial carbon cycle (Yuan et al., 2010; Mao et al., 2012;      (Guo et al., 2013; Fang et al., 2014; Xiao et al., 2015; Li et
Piao et al., 2013; Anav et al., 2015; Zhou et al., 2016; Ito et     al., 2015). Hence, studies on the impacts of LULCC on GPP
al., 2017). Therefore, understanding the spatiotemporal pat-        in China have important theoretical and practical value for
terns of terrestrial ecosystem GPP has been a research focus        understanding the spatiotemporal patterns of terrestrial car-
in quantifying the global carbon cycle (Anav et al., 2015;          bon cycle and forecasting their response to future global and
Zhou et al., 2016; Chen et al., 2017). However, GPP is sus-         regional changes and human activities (Tian et al., 2011a, b).
ceptible to CO2 concentration and human interference (pri-             However, few studies have adequately explored the im-
marily land use and land cover change, hereafter LULCC)             pacts of climate change, atmospheric CO2 concentration, and
besides climate change (Friedlingstein et al., 2010; Ciais et       LULCC to interannual and seasonal variations of GPP in
al., 2013; Li et al., 2015), which complicates the quantifica-      China (Piao et al., 2013; Yao et al., 2018). These studies
tion of the impacts.                                                mainly focused on the climatic driver (temperature, precip-
   Atmospheric CO2 concentration has increased by ∼ 40 %            itation, and solar radiation) of GPP interannual variations
from 1750 to 2011 (IPCC, 2013). Several studies have exam-          (Yao et al., 2018) and responses of GPP to climate varia-
ined the effect of rising CO2 concentration on global terres-       tions and atmospheric CO2 concentration (Piao et al., 2013).
trial carbon uptake (Piao et al., 2013; Schimel et al., 2014;       But the quantitative contributions of these three factors to
Ito et al., 2016). Schimel et al. (2014) found that up to 60 %      GPP in China are still unclear, which urgently needs to be
of the present-day terrestrial sinks was caused by increas-         addressed. Although continuous improvements have been
ing atmospheric CO2 . Simulations from a coupled earth sys-         achieved for the development of terrestrial biosphere mod-
tem indicated that CO2 fertilization increased the global net       els (TBMs) alongside our deepening understanding of ter-
primary productivity by ∼ 2.3 Pg C yr−1 between 1850 and            restrial carbon cycle process, current TBMs still have large
2005 (Devaraju et al., 2016). It suggests that the CO2 effect       uncertainties in GPP simulation (Piao et al., 2013; Devaraju
on land carbon storage may be a key potential negative feed-        et al., 2016; Ito et al., 2016). Multi-model ensemble simula-
back to future climate (Schimel et al., 2014). However, the         tion has been an effective method to reduce the uncertainties
extent to which CO2 fertilization is responsible for current        induced by TBMs (Schwalm et al., 2015; Liu et al., 2016).
and future terrestrial carbon storage is still unclear (Zaehle et   Therefore, in the present study, 12 progress-based TBMs
al., 2010; IPCC, 2013).                                             from the Multi-scale Synthesis and Terrestrial Model Inter-
   Anthropogenic LULCC also has a large effect on terres-           comparison Project (MsTMIP) (Huntzinger et al., 2013; Wei
trial carbon cycles, including the “net effect” of CO2 sources      et al., 2014a) were used to investigate the effects of climate
(e.g., deforestation, logging, harvesting, and other direct hu-     change, increasing CO2 concentration and LULCC on the in-
man activities) and CO2 sinks (e.g., afforestation and vege-        terannual variation and seasonal cycle of GPP in China. The
tation regrowth following land disturbance) (Brovkin et al.,        goals of this work were to (1) investigate the interannual and
2004; Boysen et al., 2014; Pongratz et al., 2014; Houghton          seasonal variations of GPP in China between 1981 and 2010,
and Nassikas, 2017). IPCC (2013) pointed out that LULCC-            (2) quantify the individual influences of climate change, CO2
associated CO2 emissions have contributed ∼ 180 ± 80 Pg C           concentration, and LULCC, and (3) examine the relative con-
to cumulative anthropogenic CO2 emissions (one-third of to-         tributions of major subregions to China’s total GPP.
tal anthropogenic CO2 emissions) since 1750. As indicated
by Le Quéré et al. (2018), CO2 emissions from LULCC
at the global scale have remained relatively constant, at           2     Materials and methods
around 1.3 ± 0.7 Pg C yr−1 , over the past half-century. How-
ever, regional CO2 emissions showed different characteris-          2.1    Model description and experimental design
tics (Houghton and Nassikas, 2017).
                                                                    Twelve TBMs that participated in the MsTMIP were used in
                                                                    this study: CLM4, CLM4VIC, DLEM, GTEC, ISAM, LPJ-

Earth Syst. Dynam., 11, 235–249, 2020                                                 www.earth-syst-dynam.net/11/235/2020/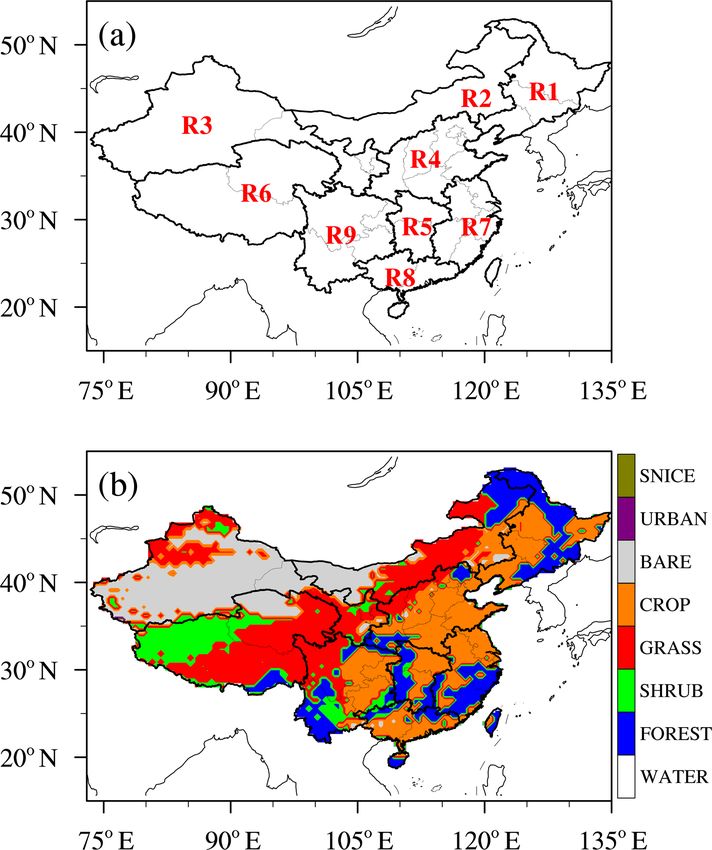
B. Jia et al.: Impacts of land use change and elevated CO2 on GPP in China 237
wsl, ORCHIDEE-LSCE, SiB3-JPL, SiB3CASA, TEM6,
VEGAS2.1 and VISIT (Huntzinger et al., 2013; Wei et al.,
2014a, b). These model simulations all followed the same ex-
perimental design. Three sensitivity model simulations were
used in this study: SG1, driven by time-varying climate data;
SG2, considering the effect of LULCC based on SG1; and
SG3, similar to SG2, but using time-varying atmospheric
CO2 concentration. In this way, these three experiments can
be used to assess the relative contributions of climate change,
LULCC and rising CO2 concentration to temporal changes
in GPP (Sect. S1 of the Supplement). All the simulated re-
sults have a spatial resolution of 0.5◦ ×0.5◦ and are available
at https://doi.org/10.3334/ORNLDAAC/1225 (Huntzinger et
al., 2018). More detailed descriptions of the experimental de-
sign and forcing datasets can be found in the Supplement and
Huntzinger et al. (2013) and Wei et al. (2014a, b). The sim-
ulated monthly GPP from these 12 models for the period of
1981–2010 was used in this work. The mean values calcu-
lated from these models (hereafter “ENSEMBLE”) were also
calculated.
2.2 Evaluation data
This study used an observation-driven global monthly grid- Figure 1. Spatial distributions of (a) nine subregions (R1–R9) in
ded GPP product derived from FLUXNET measurements the study region; and (b) present plant functional types (PFTs) used
by statistical upscaling with the machine-learning algorithm, in SG1 simulations. R1: northeastern China (Heilongjiang, Jilin,
model tree ensembles (Jung et al., 2009, 2011) (hereafter re- Liaoning); R2: Inner Mongolia; R3: northwestern China (Gansu,
ferred to as MTEs). The MTE statistical model consisting Ningxia, Xinjiang); R4: northern China (Beijing, Hebei, Henan,
of a set of regression trees was first trained using site-level Shandong, Shanxi, Shaanxi, Tianjin); R5: central China (Hubei, Hu-
explanatory variables and GPP estimations from eddy flux nan); R6: Tibetan Plateau (Qinghai, Tibet); R7: southeastern China
(Anhui, Fujian, Jiangsu, Jiangxi, Shanghai, Zhejiang) and Taiwan;
tower measurements. These explanatory variables covered
R8: southern China (Guangdong, Guangxi, Hainan, Hong Kong,
climate and biophysical variables such as vegetation types, Macao); and R9: southwestern China (Guizhou, Sichuan, Yunnan,
temperature, precipitation, radiation, and satellite-derived Chongqing). SNICE is snow and ice; BARE is bare soil.
fraction of absorbed photosynthetic active radiation. Then
the MTE GPP product was generated through applying the
trained regression trees for global upscaling using gridded the maximum range of oscillation between peak and trough
datasets of the same explanatory variables. It has a spatial within a calendar year (Ito et al., 2016).
resolution of 0.5◦ × 0.5◦ and is available between 1982 and The nonparametric Mann–Kendall method was used to de-
2011. The uncertainty of the MTE data is ∼ 46 g C m−2 yr−1 termine the statistical significance of trends in Chinese and
(5 %), which was calculated using the standard deviation of regional GPP (area-weighted), where the Sen median slope
the 25 model tree ensembles (Jung et al., 2011). (Sen, 1968) was considered as the trend value in this paper.
Trend analysis was based on annual values averaged from
monthly values. The relative contribution of each subregion
2.3 Analysis method
to the IAV and SCA of China’s GPP was also calculated
The land area of China was divided into nine regions (Fig. 1a) based on the method proposed by Ahlström et al. (2015) and
through a consideration of their climate characteristics, plant Chen et al. (2017). Please see the Supplement for more in-
vegetation types and geopolitical boundaries (Piao et al., formation.
2009, 2010). For the whole of China and each subregion, in-
terannual variations (IAVs), seasonal cycle amplitude (SCA)
3 Results
and GPP trends were analyzed and compared across MsT-
MIP models and MTE data. The IAV of GPP was defined 3.1 Spatial patterns of GPP over China
using the standard deviations of each region’s detrended an-
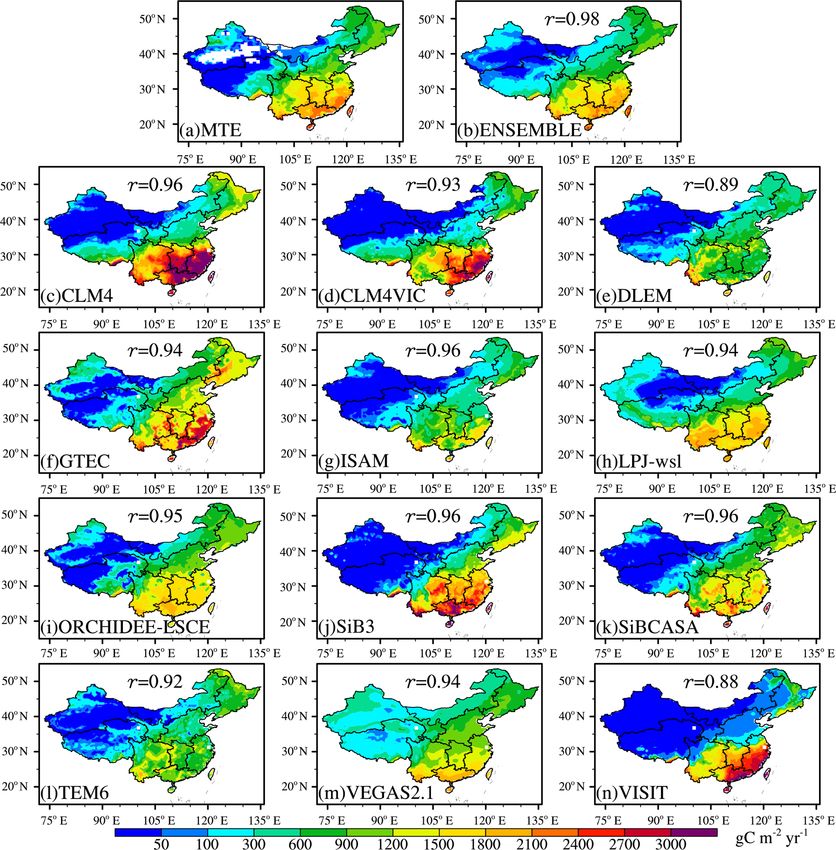
nual time-series data. The SCA of GPP was defined as the In general, the spatial distributions of GPP from MsTMIP
difference between the largest and smallest values, indicating models (SG3) agreed well with the MTE (Fig. 2), with spa-
www.earth-syst-dynam.net/11/235/2020/ Earth Syst. Dynam., 11, 235–249, 2020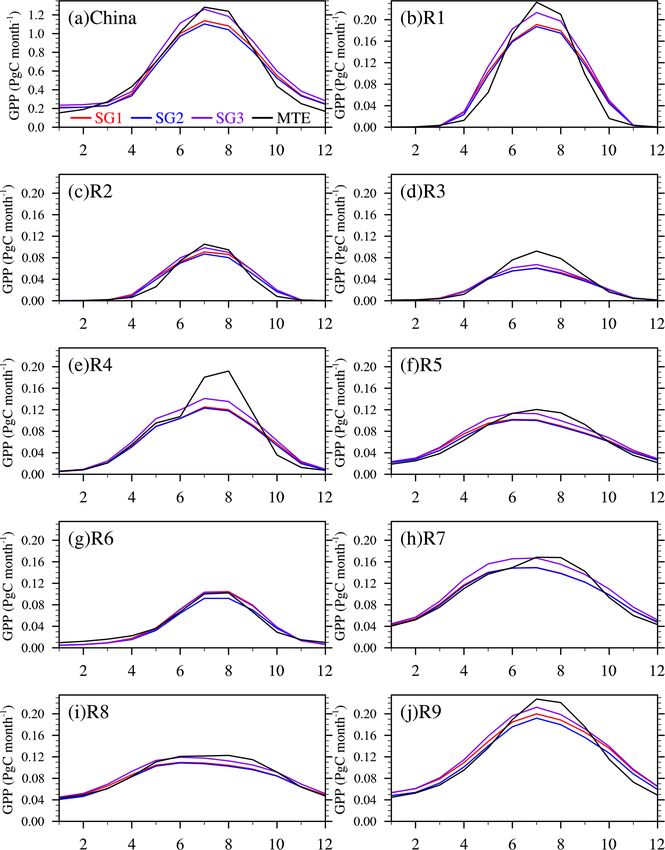
238                                            B. Jia et al.: Impacts of land use change and elevated CO2 on GPP in China

Figure 2. Average annual terrestrial ecosystem gross primary production (GPP) from the MTE (1982–2010) and MsTMIP (1981–2010). r
is the spatial correlation coefficient with the MTE, and ENSEMBLE is the ensemble mean of the 12 MsTMIP models.

tial correlation coefficients for most models higher than 0.9.      GPP were found to diverge, ranging from 4.9 (DLEM) to
The highest GPP values were observed in southeastern (R7)           10.5 (GTEC) Pg C yr−1 (Fig. 3a), with a standard deviation
and southern China (R8) due to the wet climate and high             of 1.8 Pg C yr−1 . The total China GPP from the multi-model
solar radiation, and the smallest GPP values were mainly            ensemble mean was 7.4 Pg C yr−1 , which was slightly higher
in arid regions of China (e.g., northwestern China, R3) and         than the MTE (7.0 Pg C yr−1 , Fig. 3a). The regional sum of
the Tibetan Plateau (R6) due to adverse conditions for plant        GPP in southwestern China from the ENSEMBLE (Fig. 3b)
photosynthetic activities. But the 12 models still have some        was the highest among all nine regions (1.5 Pg C yr−1 , R9),
differences in the spatial variations of GPP. VISIT showed          followed by southeastern China (1.3 Pg C yr−1 , R7) and
a lower spatial correlation with the MTE (0.88) due to its          southern China (1.0 Pg C yr−1 , R8). These top three regions
higher GPP in R7 and lower values in R1. Compared to the            together contributed about 50 % of China’s GPP (Fig. 3c).
MTE, three models (DLEM, TEM6, and VEGAS2.1) pro-                   However, southern China (R8) showed the highest GPP es-
duced lower GPP in R1, and VEGAS2.1 produced higher                 timates per unit area, at > 2000 g C m−2 yr−1 (Fig. 3d). The
GPP in R3 and the western parts of R6. The multi-model en-          relative contributions of each region to total China GPP from
semble mean (ENSEMBLE) showed the highest spatial cor-              the MTE showed results similar to the MsTMIP. To under-
relation with the MTE, suggesting that the ensemble mean            stand more thoroughly the underlying mechanisms of GPP
best captured MTE spatial variability.                              changes during 1981–2010, the effects of LULCC and at-
   Figure 3 shows the annual mean GPP over China and                mospheric CO2 concentration on GPP changes were quanti-
each subregion. The 12 models’ estimates of total China             fied based on the ensemble mean of the 12 MsTMIP mod-

Earth Syst. Dynam., 11, 235–249, 2020                                                 www.earth-syst-dynam.net/11/235/2020/
B. Jia et al.: Impacts of land use change and elevated CO2 on GPP in China                                                         239

                                                                         Table 1. China and regional GPP from the MTE and the ensem-
                                                                         ble mean of the 12 MsTMIP models for three configurations (SG1,
                                                                         SG2 and SG3): (a) mean values (MEAN), (b) interannual variabil-
                                                                         ity (IAV), (c) seasonal-cycle amplitude (SCA).

                                                                                    (a) MEAN (unit Pg C yr−1 )
                                                                                            SG1      SG2       SG3      MTE
                                                                                    China      6.9       6.7      7.4     7.0
                                                                                    R1         0.8       0.8      0.9     0.8
                                                                                    R2         0.4       0.4      0.4     0.4
                                                                                    R3         0.3       0.3      0.3     0.3
                                                                                    R4         0.7       0.7      0.8     0.7
                                                                                    R5         0.8       0.7      0.8     0.7
                                                                                    R6         0.5       0.4      0.5     0.5
                                                                                    R7         1.2       1.2      1.3     1.2
                                                                                    R8         1.0       0.9      1.0     1.0
                                                                                    R9         1.5       1.4      1.5     1.4
                                                                                    (b) IAV (unit Pg C yr−1 )
                                                                                              SG1      SG2       SG3    MTE
                                                                                    China    0.099    0.092     0.105   0.157
Figure 3. Annual mean GPP from (a) China and (b) each subre-                        R1       0.030    0.033     0.030   0.029
gion; (c) regional contributions to China GPP; (d) annual mean GPP                  R2       0.024    0.021     0.023   0.025
per unit square meters. Horizontal lines at top, middle and bottom                  R3       0.010    0.012     0.010   0.015
in the boxplots represent the maximum, ensemble mean, and mini-                     R4       0.030    0.029     0.033   0.048
mum of multi-model simulations, respectively, whereas the box in-                   R5       0.025    0.022     0.024   0.020
dicates 1 standard deviation. All the results in this figure are aver-              R6       0.018    0.016     0.018   0.014
aged for the period of 1981–2010 for the MsTMIP SG3 simulation                      R7       0.034    0.032     0.033   0.025
and 1982–2010 for the MTE. Regional abbreviations used on the x                     R8       0.030    0.031     0.031   0.019
axes are defined in Fig. 1a.                                                        R9       0.031    0.029     0.032   0.029
                                                                                    (c) SCA (unit Pg C yr−1 )
els (Table 1). In general, LULCC (SG2, 7.1 Pg C yr−1 ) de-                                    SG1      SG2       SG3    MTE
creased annual mean GPP by ∼ 0.2 Pg C yr−1 (3 % of SG1)
                                                                                    China     11.1     10.8      12.3    13.6
compared to SG1 (6.9 Pg C yr−1 ). In contrast, elevated at-                         R1         2.3      2.2       2.6     2.8
mospheric CO2 increased GPP by ∼ 0.7 Pg C yr−1 (10 % of                             R2         1.1      1.0       1.2     1.3
SG1), although this response varied among different subre-                          R3         0.7      0.7       0.8     1.1
gions (Table 1a). These results suggested that rising atmo-                         R4         1.4      1.4       1.6     2.2
spheric CO2 concentration seems to have a greater effect on                         R5         0.9      0.9       1.1     1.2
annual mean GPP over China than LULCC.                                              R6         1.2      1.0       1.2     1.1
                                                                                    R7         1.3      1.3       1.5     1.5
                                                                                    R8         0.8      0.8       0.9     1.0
3.2   Interannual variations and trends                                             R9         1.8      1.7       1.9     2.2
During 1981–2010, the MTE estimates suggested that the
IAV of China’s GPP was 0.157 Pg C yr−1 , but the multi-
model ensemble mean values of MsTMIP for the three                       Fig. 4c), with the highest rates of increase over the Ti-
simulations all showed a slight underestimation (Table 1b).              betan Plateau (R6, Fig. 4g) and southeastern China (R7,
Compared to SG1 (0.099 Pg C yr−1 ), LULCC decreased the                  Fig. 4h), which were both more than 3.0 Tg C yr−2 (p < 0.05,
IAV by ∼ 0.007 Pg C yr−1 (7 % of SG1), whereas rising                    1 Tg C = 0.001 Pg C). Compared to SG1 (red line) with pre-
CO2 (SG3) led to an increase (∼ 0.008 Pg C yr−1 , 8 % of                 scribed land cover, LULCC (blue line) decreased GPP trends
SG1). The GPP from SG3 with a consideration of LULCC                     over all regions, which was mainly related to land conver-
and elevated CO2 increased from 7.1 Pg C yr−1 in 1981 to                 sion including forest-to-crop and shrub-to-crop (Tao et al.,
7.6 Pg C yr−1 in 2010, with a significant temporal trend of              2013). On the contrary, elevated CO2 concentration signifi-
0.02 Pg C yr−2 (p < 0.05). The annual mean GPP values                    cantly increased plant growth and thus led to more strongly
from SG3 exhibited significant increasing trends between                 increasing GPP trends (SG3, purple line). Compared to the
1981–2010 over all regions except for Inner Mongolia (R2,                SG3 simulations of MsTMIP, the MTE estimates appeared to

www.earth-syst-dynam.net/11/235/2020/                                                       Earth Syst. Dynam., 11, 235–249, 2020
240 B. Jia et al.: Impacts of land use change and elevated CO2 on GPP in China Figure 4. Interannual variations in GPP of China and each subregion from the MTE (black) and the ensemble mean of the 12 MsTMIP models: SG1 (blue), SG2 (red), SG3 (purple). The anomalies of GPP were calculated as the difference between annual GPP and the long- term mean between 1981 and 2010 (MTE is 1982–2010). The numbers located at the top of each figure indicate the linear trends of SG1 (blue), SG2 (red), SG3 (purple) and MTE (black) with units of Tg C yr−2 (1 Tg C = 0.001 Pg C). Single (∗ ) and double (∗∗ ) asterisks indicate that the trend is significant with p < 0.1 and p < 0.05, respectively. show similar interannual variations (Table 1b). Figure S1 in increasing trend (2.0 Tg C yr−2 ) for R4 and a larger one for the Supplement shows the spatial patterns of the correlation R6 than the MTE (4.3 Tg C yr−2 ). For R2 (Fig. 4c), SG1 and coefficients between annual GPP from MsTMIP and MTE. SG2 show a significant decreasing trend, while trends for It is found that, compared to SG1 and SG2, SG3 captures SG3 and MTE are not significant. A similar increasing trend the interannual variations in GPP of MTE best, with signifi- can be found for SG3 and MTE over R7 (Fig. 4h) except that cantly positive correlations over most areas of China, except the trend of SG3 is significant. Large differences in the trend over the west of R2 and parts of R5 and R1. The highest cor- of GPP can be observed over R1 (Fig. 4b): SG3 shows a sig- relations mainly occur over the middle of R2 and northeast nificant increasing trend, while the GPP of MTE is decreas- of R6. In addition, SG3 has the same trends in GPP (signif- ing. However, the mean values and IAV of GPP over R1 are icantly increasing) with MTE for R3, R4, R5, R6, R8, and close in SG3 and MTE (Table 1a). For all of China (Fig. 4a), R9 (Fig. 4d, e, f, g, i, j), except for some differences in the the trend in GPP from the MsTMIP is lower than that of the magnitude. For example, the SG3 is found to show a weaker MTE due to large discrepancies between 1999 and 2002. To Earth Syst. Dynam., 11, 235–249, 2020 www.earth-syst-dynam.net/11/235/2020/
B. Jia et al.: Impacts of land use change and elevated CO2 on GPP in China                                                        241

further validate the trends in GPP from MsTMIP, we com-
pare their spatial distributions with that from MTE (Fig. S2).
Compared to SG1 (Fig. S2a), LULCC leads to a decrease
in annual mean GPP (e.g., many areas with stronger negative
trend; Fig. S2b). In contrast, rising atmospheric CO2 concen-
tration significantly strengthens the ascending trend in GPP
by increasing the rate of photosynthesis (Fig. S2c). More-
over, SG3 captures the trend in GPP of MTE better than SG1
and SG2, with significantly increasing trends over most areas
of China and decreasing trends over the east of R2. However,
some discrepancies between SG3 and MTE can be observed
over R1, east parts of R7 and R9. We then compared them
with another GPP product from Yao et al. (2018) (hereafter
YAO, Fig. 4a in that paper). It is found that SG3 from MsT-
MIP shows similar trends with YAO over R1 and east parts of
R7. In contrast, MTE shows the same increasing trends with
YAO over east parts of R9. It suggests that both model sim-
ulations from MsTMIP and the MTE GPP product show cer-
tain uncertainties in the GPP trend over some areas of China,
which needs more observations to evaluate the GPP trend in
future work.
   Figure 5 shows the regional contributions to the IAV of
China’s GPP for the three MsTMIP simulations (SG1, SG2
and SG3). The ensemble mean GPP of SG3 over R9 was
                                                                 Figure 5. The relative contributions of each subregion to the inter-
found to explain the largest fraction (17 %) of the IAV for      annual variability (IAV) of China’s GPP. Boxplots indicate the dis-
China’s GPP, followed by R5 (15 %) and R4 (14 %). In con-        tributions of the 12 MsTMIP models. Horizontal lines at top, middle
trast, the contributions of southeastern and southern China      and bottom in the boxplots represent the maximum, ensemble mean
(R7, R8) to the IAV of China’s overall GPP were relatively       and minimum of multi-model simulations, respectively, whereas the
lower (4 % and 11 %), even with higher contributions to          box indicates 1 standard deviation. All the results in this figure are
China’s annual mean GPP (Fig. 3c). The relative contribu-        averaged between 1981–2010 for the MsTMIP models and 1982–
tions of each subregion to the IAV of China’s GPP from the       2010 for the MTE.
ENSEMBLE agreed well with the MTE (within 1 standard
deviation), except for a slight overestimation over southwest-
ern China and an underestimation over R5. The contributions      the same seasonal variations except for a few differences in
from R4, R5 and R9 were all high for all three MsMTIP sim-       summer over R9 (Fig. 6j), suggesting that LULCC had few
ulations and MTE, except for a few differences in magni-         effects on seasonal GPP variation in China. In contrast, el-
tude. Note the significant uncertainties with large standard     evated CO2 concentrations produced higher GPP during the
deviations among the estimated relative contributions of each    growing season through enhancing the plant growth rate and
subregion from the 12 MsTMIP models, especially over R4          thus modulated seasonal GPP variations. Table 1c shows that
and R9. Compared to SG1, SG2 and SG3 showed similar              human activities (e.g., LULCC and elevated CO2 concen-
contributions for each subregion, suggesting that rising at-     tration) exerted influences on the SCA of GPP. The differ-
mospheric CO2 and LULCC have little effect on the rela-          ence between the SG2 and SG3 was mainly caused by ris-
tive contribution of each region to the IAV of China’s GPP.      ing atmospheric CO2 concentrations, whereas LULCC led
However, they modulated the magnitude of the IAV and the         to a small discrepancy between the SG1 and SG2. For ex-
annual mean values of China and regional GPP (Table 1).          ample, compared to SG1, LULCC decreased the SCA by
                                                                 only ∼ 0.3 Pg C yr−1 (3 % of SG1), whereas elevated CO2
3.3   Seasonal variations and regional contributions
                                                                 produced an increase of 1.5 Pg C yr−1 (14 % of SG1). Mean-
                                                                 while, the SCAs of China’s GPP (11.1–12.3 Pg C yr−1 , Ta-
Figure 6 shows the seasonal variations in GPP of over all        ble 1c) from ENSEMBLE were detected with only a slight
of China and each subregion from the MsTMIP and MTE.             underestimation compared to the MTE data (13.6 Pg C yr−1 ).
In general, the MsTMIP ensemble mean showed seasonal                Next, the regional contributions to the seasonality of
cycles similar to the MTE data over China and all sub-           China’s GPP were examined for MsTMIP (SG1, SG2 and
regions, with strong correlations (r > 0.97), except for R4      SG3) and MTE (Fig. 7). The ensemble mean GPP of SG3
(Fig. 6e), where large discrepancies in summer (July and         (Fig. 7c) over R1 explained the largest fraction (20 %) of the
August) could be observed. SG1 and SG2 showed almost             seasonality of China’s GPP, followed by R6 (16 %) and R9

www.earth-syst-dynam.net/11/235/2020/                                                 Earth Syst. Dynam., 11, 235–249, 2020
242 B. Jia et al.: Impacts of land use change and elevated CO2 on GPP in China
Figure 6. Seasonal variations in GPP of China and each subregion from the ensemble mean of the 12 MsTMIP models for the three
simulations (SG1, SG2 and SG3) and the MTE. All the results in this figure are averaged between 1981–2010 for the MsTMIP and 1982–
2010 for the MTE.
(15 %). This could be explained because the GPP in these suggesting that atmospheric CO2 and LULCC had little ef-
regions had strong seasonal cycles (Fig. 6b, g and j). In con- fect on the relative subregional contributions to the seasonal
trast, the contributions of R7 and R8 to the seasonal cycle of cycle of China’s GPP.
China’s GPP were relatively low (3 % and 8 %, respectively).
The relative regional contributions to the seasonal dynam-
4 Discussion
ics of China’s GPP from MsTMIP agreed well with MTE
(within 1 standard deviation). The contributions from R4, R5
4.1 Understanding the contribution of LULCC
and R9 were all high for all three MsTMIP simulations and
MTE, except for a few differences in magnitude. Note the The TBMs used in this study relied on LULCC data by com-
significant uncertainties, with large standard deviations, in bining a static satellite-based land cover product (Jung et al.,
R3 and R4 among the estimated relative regional contribu- 2006) with time-varying land use harmonization version 1
tions from the 12 MsTMIP models. Compared to SG1, SG2 (LUH1) data (Hurtt et al., 2011). Based on this dataset, time
and SG3 showed similar contributions for each subregion, series of different vegetation cover types over China and the
Earth Syst. Dynam., 11, 235–249, 2020 www.earth-syst-dynam.net/11/235/2020/B. Jia et al.: Impacts of land use change and elevated CO2 on GPP in China 243
China Land Use/Cover Dataset (CLUD) (Liu, et al., 2003,
2005, 2010, 2014; Kuang et al., 2016), which was generated
using two satellite datasets: the LandsatTM/ETM+ and HJ-
1A/1B images from the China Centre for Resources Satellite
Data and Application (http://www.cresda.com/; last access:
1 December 2017). The CLUD is a national high-resolution
database (1 km) and contains the longest time-series dataset
available for LULCC in China (Kuang et al., 2016). Its classi-
fication system includes 6 classes (woodland, cultivated land,
grassland, water bodies, built-up land and unused land) and
25 subclasses (Liu et al., 2005; Zhang et al., 2014). The accu-
racy assessments for the CLUD have been addressed in pre-
vious studies (Liu et al., 2003, 2005, 2010, 2014; Kuang et
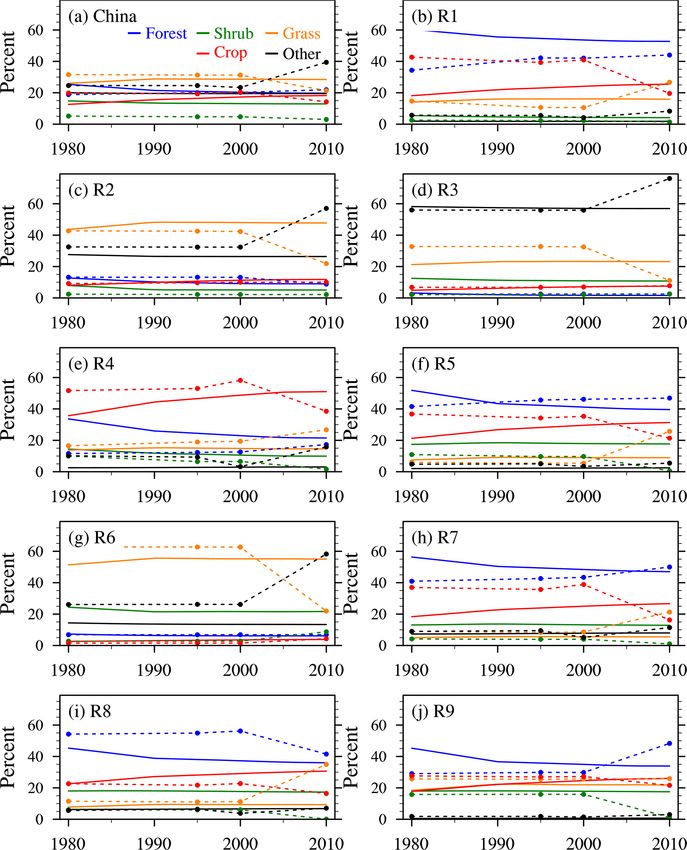
al., 2013, 2016). Based on the CLUD, the maps of main veg-
etation types in 1990, 1995, 2000 and 2010 were used here,
and their temporal changes in China and nine subregions are
shown in Fig. 8 (dashed lines with dots). It is noted that
CLUD is not available before 1990. In general, the LULCC
data used in the MsTMIP agree well with the CLUD between
1990 and 2005, except for some discrepancies in 2010. Com-
pared to that in 2000, the CLUD showed a slight increase
in forest (from 20 % to 22 %) and shrinking cropland (from
31 % to 21 %) and grassland (from 20 % to 14 %) in 2010 for
all of China. The decrease in cropland was mainly from R1
Figure 7. The same as Fig. 5, but for the regional contributions to
the seasonality of China’s GPP.
(Fig. 8b), R4 (Fig. 8e), R5 (Fig. 8f) and R7 (Fig. 8h), while
the changes in grassland occurred mostly in R2 (Fig. 8c), R3
(Fig. 8d) and R6 (Fig. 8g).
The uncertainties in the LULCC dataset could influence
nine subregions were developed and are presented in Fig. 8 its contribution to terrestrial carbon fluxes. For example,
(solid lines). Crop areas showed a persistent increase during the MTE GPP product shows a significantly increasing
the past 3 decades (from 13 % to 18 %), whereas forest areas trend after 2005 over R4 (Fig. 4e), R5 (Fig. 4f) and R7
were shrinking (from 25 % to 20 %). Grassland areas showed (Fig. 4h), while some underestimations can be found for
a slight increase in the 1990s and then changed little during model-simulated GPP. This may be related with the discrep-
the past 2 decades. These changes induced a decrease in the ancies in the LULCC datasets over these areas. In upcom-
mean values of China’s GPP (Table 1a). LULCC in China ing revisions to LUH1, the new LUH2 product (http://luh.
showed significant spatial variations. For example, changes umd.edu/data.shtml; last access: 15 December 2018) will in-
in grassland occurred mostly in Inner Mongolia (R2, Fig. 8c). clude updated inputs, higher spatial resolution, more detailed
Cropland expansion was widely distributed across China, but land use transitions and the addition of important agricultural
at different rates in each subregion. As for forest land, the management layers. Moreover, forest cover gross transitions
largest loss occurred over northern China (Fig. 8e) and parts are now constrained by remote-sensing information and have
of southern China (Fig. 8f, h, i and j). generally been re-estimated. Therefore, future studies are ex-
LULCC in China from the LUH1 product used in this pected to compare the potential effect on GPP with the new
study showed some differences from previous studies. For product.
example, Liu and Tian (2010) reconstructed an LULCC
dataset for China using high-resolution satellite and histor- 4.2 Uncertainties in simulating GPP in China
ical survey data and found that LULCC in China during
1980–2005 was characterized by shrinking cropland and ex- Despite growing efforts to quantify GPP, current TBM sim-
panding urban and forest areas. Chen (2007) also reported ulations still have large uncertainties. Each TBM has differ-
a similar trend of shrinking cropland in China during 1977– ent parameterizations, which leads to its own bias, and the
2003 and attributed it to urbanization. Several studies have ensemble mean of multi-model simulations may reduce the
reported an increase in forest area after 1980 (Fang et al., bias in GPP (Ito et al., 2016; Chen et al., 2017). Therefore,
2001; Houghton and Hackler, 2003; Song and Deng, 2017), this study did not focus on comparisons among the 12 model
which was mainly due to new plantings to protect the en- simulations.
vironment (Wang et al., 2004). To assess the reliability of The multi-model mean of the 12 MsTMIP models (SG3)
LULCC data used in this study, we compared them with the for all of China GPP was 7.4 Pg C yr−1 , which was slightly
www.earth-syst-dynam.net/11/235/2020/ Earth Syst. Dynam., 11, 235–249, 2020244 B. Jia et al.: Impacts of land use change and elevated CO2 on GPP in China Figure 8. Interannual changes of vegetation types over China and nine subregions between 1981 and 2010 from the MsTMIP (solid lines) and the China Land Use/Cover Dataset (dashed lines with dots). Other includes SNICE (snow and ice), water and bare soil. higher than the MTE estimate (7.0 Pg C yr−1 ). The results in trend in this study is very similar to that of Yao et al. (2018), this study also showed some differences with previous stud- with a positive value of 0.02 Pg C yr−2 (p < 0.05). ies. For example, China GPP estimates based on the Eddy- In this study, MsTMIP and MTE were found to show some Covariance Light Use Efficiency model were 5.38 (Yuan et discrepancies in the IAV and trends of GPP. For example, the al., 2010), 5.55 (Cai et al., 2014) and 6.04 Pg C yr−1 (Li et al., trend of MsTMIP is about twice that derived from the MTE 2014), respectively, which was more than 20 % lower than data (Fig. 4). The reason for the differences can be explained in this study. Yao et al. (2018) developed a new GPP prod- through the following two aspects. First of all, uncertainties uct for China with higher spatial resolution (0.1◦ ) based on in meteorological forcing dataset, model structure and pa- a machine-learning algorithm using more eddy flux observa- rameterization can lead to large biases in simulating the spa- tions than the MTE. They found that the annual GPP of China tiotemporal patterns of GPP, although this could be reduced was 6.62±0.23 Pg C yr−1 during 1982–2015. In contrast, the by ensemble simulations from MsTMIP. Secondly, although ensemble mean of nine TBMs produced a higher estimate of a data-oriented GPP product (e.g., the MTE) has been used 7.85 Pg C yr−1 (Yao et al., 2018). In addition, two newly pub- as the reference data to evaluate the TBM simulations (Piao lished studies also generated high estimates of total annual et al., 2012, 2013; Jia et al., 2018; Yao et al., 2018), previ- GPP: 7.85 Pg C yr−1 for 2001–2010 by multiple regression ous studies found that MTE data may underestimate the IAV (Zhu et al., 2014) and 7.81 Pg C yr−1 for 2000–2015 using and trends (Jung et al., 2011; Piao et al., 2013; Yao et al., support vector regression (Ichii et al., 2017). Unlike the dis- 2018). Yao et al. (2018) pointed out that it may be due to the crepancies in the magnitude of annual mean China GPP, the potential biases caused by “spatial gradients extrapolation to Earth Syst. Dynam., 11, 235–249, 2020 www.earth-syst-dynam.net/11/235/2020/
B. Jia et al.: Impacts of land use change and elevated CO2 on GPP in China                                                         245

temporal interannual gradients” (Reichstein et al., 2007; Jung      it has been demonstrated to offer better predictability (Hage-
et al., 2009; Piao et al., 2013), and leaving out some cumula-      dorn et al., 2005). However, there are some missing factors
tive effects like soil moisture (Jung et al., 2007). In addition,   that are not considered in this study. One is that the interac-
most of the stations used by the MTE data only had a short          tion between LULCC and elevated CO2 was not completely
measurement period (Yao et al., 2018), which may affect the         separated in this study. For example, deforestation against the
estimations of long-term temporal variations in GPP (e.g.,          background of rising CO2 induces higher emissions because
IAV, trend). It is noted that the latest version of the MTE data    CO2 fertilization leads to an increase in terrestrial carbon
agreed well with TBM simulations (Jung et al., 2017; Yao et         storage, but higher CO2 concentrations also cause a stronger
al., 2018), which will be compared with the GPP estimations         regrowth (Houghton et al., 2012). Moreover, the uncertainty
over China from MsTMIP in our future work.                          in LULCC datasets remains a serious challenge today. More
                                                                    satellite data with higher spatial resolution are expected to
                                                                    reduce this uncertainty.
5   Conclusions

In this study, a multi-model analysis using 12 MsTMIP-              Data availability. The data used in this paper are available upon
based models was used to investigate the relative contribu-         request. Please contact Binghao Jia at bhjia@mail.iap.ac.cn.
tions of climate change and anthropogenic activities to in-
terannual and seasonal variations in China’s GPP. In addi-
tion, this study examined subregional contributions to tempo-       Supplement. The supplement related to this article is available
ral changes in China’s total GPP. Ensemble simulations from         online at: https://doi.org/10.5194/esd-11-235-2020-supplement.
MsTMIP were compared with an independent upscaling GPP
product (Jung et al., 2011) and with flux-tower-based GPP
                                                                    Author contributions. BJ designed the research, analyzed the
observations in China.
                                                                    data and drafted the paper with contributions from XL, XC, AJ,
   The simulated GPP for China from the 12 MsTMIP mod-              DNH and ZX. AJ, DNH, NZ, JM, XS, AI, YW, HT, BP, DH and KS
els, driven by common climate forcing, LULCC, and CO2               contributed model runs to the MsTMIP products, which were used
data, was 7.4 ± 1.8 Pg C yr−1 , which agreed well with in-          in the paper.
dependent MTE dataset (7.1 Pg C yr−1 ). In general, climate
was the dominant control factor for the trends, interannual
variation and seasonality of China’s GPP. When only con-            Competing interests. The authors declare that they have no con-
strained by climatic driver, mean annual GPP over China             flict of interest.
from 1981 to 2010 is 6.9 ± 1.7 Pg C yr−1 , with a trend of
0.0036 Pg C yr−2 . The overall rise in CO2 enhanced plant
photosynthesis and thus increased total China GPP, with             Acknowledgements. This research was supported by the Na-
increasing annual mean and interannual variability, espe-           tional Key R&D Program of China (2016YFA0600203), the Key
cially in northeastern and southern China, where vegetation         Research Program of Frontier Sciences, CAS (QYZDY-SSW-
is dense. LULCC decreased the IAV of China’s total GPP by           DQC012), the National Natural Science Foundation of China
∼ 7 %, whereas rising CO2 induced an increase of 8 %. Our           (41575096, 41830967), and the Key Lab of Guangdong for Uti-
                                                                    lization of Remote Sensing and Geographical Information Sys-
research examined the joint effects of the three factors and
                                                                    tem, Guangzhou Institute of Geography (2017B030314138). We ac-
their quantitative contributions to the interannual variations
                                                                    knowledge the MsTMIP modelers, including Maoyi Huang from
and seasonal cycles of GPP. Given the important role of GPP         the Pacific Northwest National Laboratory, Shushi Peng from
in regulating terrestrial carbon cycling, this work is expected     Peking University, Joshus B. Fisher from the California Insti-
to help us better understand the interactions of the carbon cy-     tute of Technology and Daniel M. Ricciuto from the Oak Ridge
cle, climate change and human activity. Furthermore, it will        National Laboratory, for contributing model output used in this
also be interesting for policy makers to make public deci-          work. We also thank Wenhui Kuang for providing us with the
sions on how to achieve the balance between an optimized            China Land Use/Cover Dataset (CLUD). Finalized MsTMIP data
economy and minimized carbon loss.                                  products are archived at the ORNL DAAC (https://daac.ornl.gov/
   Note that existing model estimates of GPP from state-of-         NACP/guides/NACP_MsTMIP_TBMO.html, last access: 24 Jan-
the-art TBMs vary widely and still have large uncertainties         uary 2016). The MTE data were downloaded freely from the Max
                                                                    Planck Institute for Biogeochemistry (https://www.bgc-jena.mpg.
driven by biases in environmental driver data and unrealis-
                                                                    de/geodb/projects/Data.php, last access: 20 November 2017). We
tic assumptions in model parameterizations and parameters
                                                                    thank Somnath Baidya Roy and two anonymous reviewers for the
(Friedlingstein et al., 2006; Huntzinger et al., 2012). The         helpful comments that improved the paper.
multi-model ensemble strategy is a means to address model
structural uncertainty by synthesizing outcomes from mul-
tiple models representing different parameterizations of un-
derlying biogeophysical and biogeochemical processes, and

www.earth-syst-dynam.net/11/235/2020/                                                    Earth Syst. Dynam., 11, 235–249, 2020
246 B. Jia et al.: Impacts of land use change and elevated CO2 on GPP in China
Financial support. This research has been supported by the Na- Change, edited by: Stocker, T. F., Qin, D., Plattner, G.-K., Tig-
tional Key R&D Program of China (grant no. 2016YFA0600203), nor, M., Allen, S. K., Boschung, J., Nauels, A., Xia, Y., Bex, V.,
the Key Research Program of Frontier Sciences, CAS (grant and Midgley, P. M., Cambridge University Press, Cambridge, UK
no. QYZDY-SSW-DQC012), the National Natural Science Foun- and New York, NY, USA, 465–570, 2013.
dation of China (grant nos. 41575096, 41830967), and the Key Lab Devaraju, N., Bala, G., Caldeira, K., and Nemani, R.: A
of Guangdong for Utilization of Remote Sensing and Geographi- model based investigation of the relative importance of
cal Information System, Guangzhou Institute of Geography (grant CO2 -fertilization, climate warming, nitrogen deposition
no. 2017B030314138). and land use change on the global terrestrial carbon up-
take in the historical period, Clim. Dynam., 47, 173–190,
https://doi.org/10.1007/s00382-015-2830-8, 2016.
Review statement. This paper was edited by Som- Fang, J., Chen, A., Peng, C., Zhao, S., and Ci, L.: Changes in forest
nath Baidya Roy and reviewed by two anonymous referees. biomass carbon storage in China between 1949 and 1998, Sci-
ence, 292, 2320–2322, https://doi.org/10.1126/science.1058629,
2001.
Fang, J., Guo, Z., Hu, H., Kato, T., Muraoka, H., and Son, Y.: For-
References est biomass carbon sinks in East Asia, with special reference to
the relative contributions of forest expansion and forest growth,
Ahlström, A., Raupach, M., Schurgers, G., Smith, B., Arneth, A., Glob. Change Biol., 20, 2019–2030, 2014.
Jung, M., Reichstein, M., Canadell, J., Friedlingstein, P., Jain, Friedlingstein, P., Cox, P., Betts, R., Bopp, L., von Bloh, W.,
A., Kato, E., Poulter, B., Sitch, S., Stocker, B., Viovy, N., Wang, Brovkin, V., Cadule, P., Doney, S., Eby, M., Fung, I., Bala, G.,
Y., Wiltshire, A., Zaehle, S., and Zeng, N.: The dominant role of John, J., Jones, C., Joos, F., Kato, T., Kawamiya, M., Knorr,
semi-arid ecosystems in the trend and variability of the land CO2 W., Lindsay,K., Matthews, H. D., Raddatz, T., Rayner, P., Re-
sink, Science, 348, 895–899, 2015. ick, C., Roeckner, E., Schnitzler, K.G., Schnur, R., Strassmann,
Anav, A., Friedlingstein, P., Beer, C., Ciais, P., Harper, A., K., Weaver, A. J., Yoshikawa, C., and Zeng, N.: Climate-carbon
Jones, C., Murray-Tortarolo, G., Papale, D., Parazoo, N. C., cycle feedback analysis: results from the C4MIP model inter-
Peylin, P., Piao, S. L., Sitch, S., Viovy, N., Wiltshire, A., comparison, J. Climate, 19, 3337–3353, 2006.
and Zhao, M.: Spatiotemporal patterns of terrestrial gross Friedlingstein, P., Houghton, R. A., Marland, G., Hackler, J., Boden,
primary production: A review, Rev. Geophys., 53, 785–818, T. A., Conway, T. J., Canadell, J. G., Raupach, M. R., Ciais, P.,
https://doi.org/10.1002/2015RG000483, 2015. and Le Quéré, C.: Update on CO2 emissions. Nat. Geosci., 3,
Boysen, L. R., Brovkin, V., Arora, V. K., Cadule, P., de Noblet- 811–812, https://doi.org/10.1038/ngeo1022, 2010.
Ducoudré, N., Kato, E., Pongratz, J., and Gayler, V.: Global and Guo, Z., Hu, H., Li, P., Li, N., and Fang, J.: Spatio-temporal changes
regional effects of land-use change on climate in 21st century in biomass carbon sinks in China’s forests from 1977 to 2008,
simulations with interactive carbon cycle, Earth Syst. Dynam., 5, Sci. China Life Sci., 56, 661–671, 2013.
309–319, https://doi.org/10.5194/esd-5-309-2014, 2014. Hagedorn, R., Doblas-Reyes, F. J., and Palmer, T. N.: The rationale
Brovkin, V., Sitch, S., von Bloh, W., Claussen, M., Bauer, E., and behind the success of multi-model ensembles in seasonal fore-
Cramer, W.: Role of land cover changes for atmospheric CO2 casting – I Basic concept, Tellus, 57A, 219–233, 2005.
increase and climate change during the last 150 years, Glob. Houghton, R. A. and Hackler, J. L.: Sources and sinks of carbon
Change Biol., 10, 1253–1266, 2004. from land-use change in China, Global Biogeochem. Cy., 17,
Cai, W., Yuan, W., Liang, S., Zhang, X., Dong, W., Xia, J., Fu, 1034, https://doi.org/10.1029/2002GB001970, 2003.
Y., Chen, Y., Liu, D., and Zhang, Q.: Improved estimations of Houghton, R. A. and Nassikas, A. A.: Global and re-
gross primary production using satellite-derived photosyntheti- gional fluxes of carbon from land use and land cover
cally active radiation, J. Geophys. Res.-Biogeo., 119, 110–123, change 1850–2015, Global Biogeochem. Cy., 31, 456–472,
https://doi.org/10.1002/2013JG002456, 2014. https://doi.org/10.1002/2016GB005546, 2017.
Chen, J.: Rapid urbanization in China: A real challenge Houghton, R. A., House, J. I., Pongratz, J., van der Werf, G. R.,
to soil protection and food security, Catena, 69, 1–15, DeFries, R. S., Hansen, M. C., Le Quéré, C., and Ramankutty,
https://doi.org/10.1016/j.catena.2006.04.019, 2007. N.: Carbon emissions from land use and land-cover change, Bio-
Chen, M., Rafique, R., Asrar, G. R., Bond-Lamberty, B., Ciais, geosciences, 9, 5125–5142, https://doi.org/10.5194/bg-9-5125-
P., Zhao, F., Reyer, C. P. O., Ostberg, S., Chang, J., Ito, A., 2012, 2012.
Yang, J., Zeng, N., Kalnay, E., West, T., Leng, G., Francois, Huntzinger, D. N., Post, W. M., Wei, Y., Michalak, A. M., West,
L., Munhoven, G., Henrot, A., Tian, H., Pan, S., Nishina, K., T. O., Jacobson, A. R., Baker, I. T., Chen, J. M., Davis, K. J.,
Viovy, N., Morfopoulos, C., Betts, R., Schaphoff, S., Steinkamp, Hayes, D. J., Hoffman, F. M., Jain, A. K., Liu, S., McGuire, A.
J., and Hickler, T.: Regional contribution to variability and trends D., Neilson, R. P., Potter, C., Poulter, B., Price, D., Raczka, B.
of global gross primary productivity, Environ. Res. Lett., 12, M., Tian, H. Q., Thornton, P., Tomelleri, E., Viovy, N., Xiao, J.,
105005, https://doi.org/10.1088/1748-9326/aa8978, 2017. Yuan, W., Zeng, N., Zhao, M., and Cook, R.: North American
Ciais, P., Bala, G., Bopp, L., Brovkin, V., Canadell, J., Chhabra, A., Carbon Project (NACP) Regional Interim Synthesis: Terrestrial
DeFries, R., Galloway, J., Heimann, M., Jones, C., Le Quéré, C., Biospheric Model Intercomparison, Ecol. Model., 224, 144–157,
Myneni, R. B., Piao, S. L., and Thornton, P.: Carbon and other 2012.
biogeochemical cycles, in: Climate change 2013: The Physical Huntzinger, D. N., Schwalm, C., Michalak, A. M., Schaefer, K.,
Science Basis. Contribution of Working Group I to the Fifth King, A. W., Wei, Y., Jacobson, A., Liu, S., Cook, R. B., Post,
Assessment Report of the Intergovernmental Panel on Climate
Earth Syst. Dynam., 11, 235–249, 2020 www.earth-syst-dynam.net/11/235/2020/B. Jia et al.: Impacts of land use change and elevated CO2 on GPP in China 247
W. M., Berthier, G., Hayes, D., Huang, M., Ito, A., Lei, H., Lu, impact assessment studies, Environ. Res. Lett., 12, 085001,
C., Mao, J., Peng, C. H., Peng, S., Poulter, B., Riccuito, D., https://doi.org/10.1088/1748-9326/aa7a19, 2017.
Shi, X., Tian, H., Wang, W., Zeng, N., Zhao, F., and Zhu, Q.: Jia, B., Wang, Y., and Xie, Z.: Responses of the terrestrial carbon
The North American Carbon Program Multi-Scale Synthesis and cycle to drought over China: modeling sensitivities of the interac-
Terrestrial Model Intercomparison Project – Part 1: Overview tive nitrogen and dynamic vegetation, Ecol. Model., 368, 52–68,
and experimental design, Geosci. Model Dev., 6, 2121–2133, 2018.
https://doi.org/10.5194/gmd-6-2121-2013, 2013. Jung, M., Henkel, K., Herold, M., and Churkina, G.: Ex-
Huntzinger, D. N., Schwalm, C. R., Wei, Y., Cook, R. B., Micha- ploiting synergies of global land cover products for car-
lak, A. M., Schaefer, K., Jacobson, A. R., Arain, M. A., Ciais, bon cycle modeling, Remote Sens. Environ., 101, 534–553,
P., Fisher, J. B., Hayes, D. J., Huang, M., Huang, S., Ito, A., https://doi.org/10.1016/j.rse.2006.01.020, 2006.
Jain, A., Lei, H., Lu, C., Maignan, F., Mao, J., Parazoo, N. C., Jung, M., Vetter, M., Herold, M., Churkina, G., Reichstein,
Peng, C., Peng, S., Poulter, B., Ricciuto, D. M., Tian, H., Shi, M., Zaehle, S., Ciais, P., Viovy, N., Bondeau, A., Chen, Y.,
X., Wang, W., Zeng, N., Zhao, F., Zhu, Q., Yang, J., and Tao, Trusilova, K., Feser, F., and Heimann, M.: Uncertainties of
B.: NACP MsTMIP: Global 0.5-degree Model Outputs in Stan- modeling gross primary productivity over Europe: A system-
dard Format, Version 1.0. ORNL DAAC, Oak Ridge, Tennessee, atic study on the effects of using different drivers and terres-
USA, https://doi.org/10.3334/ORNLDAAC/1225, 2018. trial biosphere models, Global Biogeochem. Cy., 21, GB4021,
Hurtt, G. C., Chini, L., Frolking, S., Betts, R., Edmonds, J., Fed- https://doi.org/10.1029/2006gb002915, 2007.
dema, J., Fisher, G., Goldewijk, K. K., Hibbard, K., Houghton, Jung, M., Reichstein, M., and Bondeau, A.: Towards global
R., Janetos, A., Jones, C., Kinderman, G., Konoshita, T., Ri- empirical upscaling of FLUXNET eddy covariance obser-
ahi, K., Shevliakova, E., Smith, S. J., Stefest, E., Thomson, vations: validation of a model tree ensemble approach
A. M., Thornton, P., van Vuuren, D., and Wang, Y.: Harmo- using a biosphere model, Biogeosciences, 6, 2001–2013,
nization of land-use scenarios for the period 1500–2100: 600 https://doi.org/10.5194/bg-6-2001-2009, 2009.
years of global gridded annual land-use transitions, wood har- Jung, M., Reichstein, M., Margolis, H., Cescatti, A., Richardson,
vest, and resulting secondary lands, Climatic Change, 109, 117– A., Arain, M., Arneth, A., Bernhofer, C., Bonal, D., Chen, J., Gi-
161, https://doi.org/10.1007/s10584-011-0153-2, 2011. anelle, D., Gobron, N., Kiely, G., Kutsch, W., Lasslop, G., Law,
Ichii, K., Ueyama, M., Kondo, M., Saigusa, N., Kim, J., Alberto, B., Lindroth, A., Merbold, L., Montagnani, L., Moors, E., Papale,
M., Ardö, J., Euskirchen, E. S., Kang, M., Hirano, T., Joiner, J., D., Sottocornola, M., Vaccari, F., and Williams, C.: Global pat-
Kobayashi, H., Marchesini, L., Merbold, L., Miyata, A., Saitoh, terns of land-atmosphere fluxes of carbon dioxide, latent heat,
T., Takagi, K., Varlagin, A., Bret-Harte, M., Kitamura, K., Ko- and sensible heat derived from eddy covariance, satellite, and
sugi, Y., Kotani, A., Kumar, K., Li, S., Machimura, T., Mat- meteorological observations, J. Geophys. Res., 116, G00J07,
suura, Y., Mizoguchi, Y., Ohta, T., Mukherjee, S., Yanagi, Y., https://doi.org/10.1029/2010JG001566, 2011.
Yasuda, Y., Zhang, Y., and Zhao, F.: New data-driven estimation Jung, M., Reichstein, M., Schwalm, C. R., Huntingford, C.,
of terrestrial CO2 fluxes in Asia using a standardized database Sitch, S., Ahlström, A., Arneth, A., Camps-Valls, G., Ciais,
of eddy covariance measurements, remote sensing data, and sup- P., Friedlingstein, P., Gans, F., Ichii, K., Jain, A. K., Kato,
port vector regression, J. Geophys. Res.-Biogeo., 122, 767–795, E., Papale, D., Poulter, B., Raduly, B., Rödenbeck, C., Tra-
https://doi.org/10.1002/2016JG003640, 2017. montana, G., Viovy, N., Wang, Y. P., Weber, U., Zaehle, S.,
IPCC: Climate change 2013: The physical science basis, in: Con- and Zeng, N.: Compensatory water effects link yearly global
tribution of working group I to the fifth assessment report of land CO2 sink changes to temperature, Nature, 541, 516–520,
the Intergovernmental Panel on Climate Change, edited by: https://doi.org/10.1038/nature20780, 2017.
Stocker, T. F., Qin, D., Plattner, G.-K., Tignor, M., Allen, S. Kuang, W., Liu, J., Zhang, Z., Lu, D., and Xiang, B.: Spatiotem-
K., Boschung, J., Nauels, A., Xia, Y., Bex, V., and Midg- poral dynamics of impervious surface areas across China dur-
ley, P. M., Cambridge University Press, Cambridge, UK, ing the early 21st century, Chinese Sci. Bull., 58, 1691–1701,
https://doi.org/10.1017/CBO9781107415324, 2013. https://doi.org/10.1007/s11434-012-5568-2, 2013.
Ito, A., Inatomi, M., Huntzinger, D. N., Schwalm, C., Michalak, Kuang, W., Liu, J., Dong, J., Chi, W., and Zhang, C.: The rapid and
A. M., Cook, R., King, A. W., Mao, J., Wei, Y., Post, W. M., massive urban and industrial land expansions in China between
Wang, W., Arain, M. A., Huang, S., Hayes, D. J., Ricciuto, D. 1990 and 2010: A CLUD-based analysis of their trajectories, pat-
M., Shi, X., Huang, M., Lei, H., Tian, H., Lu, C., Yang, J., Tao, terns, and drivers, Landscape Urban Plan., 145, 21–33, 2016.
B., Jain, A., Poulter, B., Peng, S., Ciais, P., Fisher, J. B., Parazoo, Le Quéré, C., Andrew, R. M., Friedlingstein, P., Sitch, S., Pongratz,
N., Schaefer, K., Peng, C., Zeng, N., and Zhao, F.: Decadal trends J., Manning, A. C., Korsbakken, J. I., Peters, G. P., Canadell,
in the seasonal-cycle amplitude of terrestrial CO2 exchange re- J. G., Jackson, R. B., Boden, T. A., Tans, P. P., Andrews, O.
sulting from the ensemble of terrestrial biosphere models, Tellus D., Arora, V. K., Bakker, D. C. E., Barbero, L., Becker, M.,
B, 68, 28968, https://doi.org/10.3402/tellusb.v68.28968, 2016. Betts, R. A., Bopp, L., Chevallier, F., Chini, L. P., Ciais, P.,
Ito, A., Nishina, K., Reyer, C. P. O., François, L., Henrot, A. Cosca, C. E., Cross, J., Currie, K., Gasser, T., Harris, I., Hauck,
J., Munhoven, G., Jacquemin, I., Tian, H., Yang, J., Pan, S., J., Haverd, V., Houghton, R. A., Hunt, C. W., Hurtt, G., Ily-
Morfopoulos, C., Betts, R., Hickler, T., Steinkamp, J., Os- ina, T., Jain, A. K., Kato, E., Kautz, M., Keeling, R. F., Klein
tberg, S., Schaphoff, S., Ciais, P., Chang, J., Rafique, R., Goldewijk, K., Körtzinger, A., Landschützer, P., Lefèvre, N.,
Zeng, N., and Zhao, F.: Photosynthetic productivity and its Lenton, A., Lienert, S., Lima, I., Lombardozzi, D., Metzl, N.,
efficiencies in ISIMIP2a biome models: benchmarking for Millero, F., Monteiro, P. M. S., Munro, D. R., Nabel, J. E. M.
S., Nakaoka, S., Nojiri, Y., Padin, X. A., Peregon, A., Pfeil, B.,
www.earth-syst-dynam.net/11/235/2020/ Earth Syst. Dynam., 11, 235–249, 2020248 B. Jia et al.: Impacts of land use change and elevated CO2 on GPP in China Pierrot, D., Poulter, B., Rehder, G., Reimer, J., Rödenbeck, C., Mayorga, E., Mohammat, A., Muraoka, H., Peng, C. H., Peylin, Schwinger, J., Séférian, R., Skjelvan, I., Stocker, B. D., Tian, H., P., Poulter, B., Shen, Z. H., Shi, X., Sitch, S., Tao, S., Tian, H. Tilbrook, B., Tubiello, F. N., van der Laan-Luijkx, I. T., van der Q., Wu, X. P., Xu, M., Yu, G. R., Viovy, N., Zaehle, S., Zeng, N., Werf, G. R., van Heuven, S., Viovy, N., Vuichard, N., Walker, and Zhu, B.: The carbon budget of terrestrial ecosystems in East A. P., Watson, A. J., Wiltshire, A. J., Zaehle, S., and Zhu, D.: Asia over the last two decades, Biogeosciences, 9, 3571–3586, Global Carbon Budget 2017, Earth Syst. Sci. Data, 10, 405–448, https://doi.org/10.5194/bg-9-3571-2012, 2012. https://doi.org/10.5194/essd-10-405-2018, 2018. Piao, S. L., Sitch, S., Ciais, P., Friedlingstein, P., Peylin, P., Wang, Li, X., Liang, S., Yu, G., Yuan, W., Cheng, X., Xia, J., Zhao, T., X., Ahlström, A., Anav, A., Canadell, J. G., Cong, N., Hunting- Feng, J., Ma, Z., Ma, M., Liu, S., Chen, J., Shao, C., Li, S., ford, C., Jung, M., Levis, M., Levy, P. E., Li, J., Lin, X., Lomas, Zhang, X., Zhang, Z., Chen, S., Ohta, T., Varlagin, A., Miyata, M. R., Lu, M., Luo, Y., Ma, Y., Myneni, R. B., Poulter, B., Sun, Z. A., Takagi, K., Saiqusa, N., and Kato, T.: Estimation of gross pri- Z., Wang, T., Viovy, N., Zaehle, S., and Zeng, N.: Evaluation of mary production over the terrestrial ecosystems in China, Ecol. terrestrial carbon cycle models for their response to climate vari- Model., 261, 80–92, 2014. ability and to CO2 trends, Glob. Change Biol., 19, 2117–2132, Li, Z., Chen, Y., Li, W., Deng, H., and Fang, G.: Poten- 2013. tial impacts of climate change on vegetation dynamics in Pongratz, J., Reick, C. H., Houghton, R. A., and House, J. I.: Ter- Central Asia, J. Geophys. Res.-Atmos., 120, 12345–12356, minology as a key uncertainty in net land use and land cover https://doi.org/10.1002/2015JD023618, 2015. change carbon flux estimates, Earth Syst. Dynam., 5, 177–195, Liu, J., Liu, M., Zhuang, D., Zhang, Z., and Deng, X.: Study on https://doi.org/10.5194/esd-5-177-2014, 2014. spatial pattern of land-use change in China during 1995–2000, Reichstein, M., Papale, D., Valentini, R., Aubinet, M., Bern- Sci. China Ser. D, 46, 373–384, 2003. hofer, C., Knohl, A., Laurila, T., Lindroth, A., Moors, Liu, J., Liu, M., Tian, H., Zhuang, D., Zhang, Z., Zhang, W., Tang, E., Pilegaard, K., and Seufert, G.: Determinants of ter- X., and Deng, X.: Spatial and temporal patterns of China crop- restrial ecosystem carbon balance inferred from European land during 1990–2000: An analysis based on Landsat TM data, eddy covariance flux sites. Geophys. Res. Lett., 34, L01402. Remote Sens. Environ., 98, 442–456, 2005. https://doi.org/10.1029/2006GL027880, 2007. Liu, J., Zhang, Z., Xu, X., Kuang, W., Zhou, W., Zhang, S., Li, R., Schimel, D., Stephens, B. B., and Fisher, J. B.: Effect of increasing Yan, C., Yu, D., Wu, S., and Jiang, N.: Spatial patterns and driv- CO2 on the terrestrial carbon cycle, P. Natl. Acad. Sci. USA, 112, ing forces of land use change in China during the early 21st cen- 436–441, 2014. tury, J. Geogr. Sci., 20, 483–494, https://doi.org/10.1007/s11442- Schwalm, C. R., Huntzinger, D. N., Fisher, J. B., Michalak, A. M., 010-0483-4, 2010. Bowen, K., Ciais, P., Cook, R., El-Masri, B., Hayes, D., Huang, Liu, J., Kuang, W., Zhang, Z., Xu, X., Qin, Y., Ning, J., Zhou, W., M., Ito, A., Jain, A., King, A.W., Lei, H., Liu, J., Lu, C., Mao, J., Zhang, S., Li, R., Yan, C., Wu, S., Shi, X., Jiang, N., Yu, D., Peng, S., Poulter, B., Ricciuto, D., Schaefer, K., Shi, X., Tao, B., Pan, X., and Chi, W.: Spatiotemporal characteristics, patterns, Tian, H., Wang, W., Wei, Y., Yang, J., and Zeng, N.: Toward “op- and causes of land-use changes in China since the late 1980s, timal” integration of terrestrial biosphere models, Geophys. Res. J. Geogr. Sci., 24, 195–210, https://doi.org/10.1007/s11442-014- Lett., 42, 4418–4428, https://doi.org/10.1002/2015GL064002, 1082-6, 2014. 2015. Liu, J., Jia, B., Xie, Z., and Shi, C.: Ensemble simulation of Sen, P. K.: Estimates of the regression coefficient based on land evapotranspiration in China based on a multi-forcing Kendall’s tau, J. Am. Stat. Assoc., 63, 1379–1389, 1968. and multi-model approach, Adv. Atmos. Sci., 33, 673–684, Song, W., and Deng, X.: Land-use/land-cover change and ecosys- https://doi.org/10.1007/s00376-016-5213-0, 2016. tem service provision in China, Sci. Total Environ., 576, 705– Liu, M. L. and Tian, H. Q.: China’s land cover and land use 719, 2017. change from 1700 to 2005: estimations from high-resolution Tao, B., Tian, H., Chen, G., Ren, W., Lu, C., Alley, K. D., Xu, X., satellite data and historical archives, Global Biogeochem. Cy., Liu, M., Pan, S., and Virji, H.: Terrestrial carbon balance in trop- 24, GB3003, https://doi.org/10.1029/2009GB003687, 2010. ical Asia: Contribution from cropland expansion and land man- Mao, J., Thornton, P. E., Shi, X., Zhao, M., and Post, W. M.: Re- agement, Global Planet. Change, 100, 85–98, 2013. mote sensing evaluation of CLM4 GPP for the period 2000–09, Tian, H., Melillo, J., Lu, C., Kicklighter, D., Liu, M., Ren, W., J. Climate, 25, 5327–5342, https://doi.org/10.1175/JCLI-D-11- Xu, X., Chen, G., Zhang, C., Pan, S., Liu, J., and Running, 00401.1, 2012. S.: China’s terrestrial carbon balance: Contribution of multiple Piao, S. L., Fang, J., Ciais, P., Peylin, P., Huang, Y., Sitch, S., and global change factors. Global Biogeochem. Cy., 25, GB1007, Wang, T.: The carbon balance of terrestrial ecosystems in China, https://doi.org/10.1029/2010GB003838, 2011a. Nature, 458, 1009–1013, 2009. Tian, H., Xu, X., Lu, C., Liu, M., Ren, W., Chen, G., Melillo, J., and Piao, S. L., Ciais, P., Huang, Y., Shen, Z., Peng, S., Li, J., Zhou, Liu, J.: Net exchanges of CO2 , CH4 , and N2 O between China’s L., Liu, H., Ma, Y., Ding, Y., Friedlingstein, P., Liu, C., Tan, K., terrestrial ecosystems and the atmosphere and their contribu- Yu, Y., Zhang, T., and Fang, J.: The impacts of climate change tions to global climate warming, J. Geophys. Res. 116, G02011, on water resources and agriculture in China, Nature, 467, 43–51, https://doi.org/10.1029/2010JG001393, 2011b. 2010. Wang, S., van Kooten, G. C., and Wilson, B.: Mosaic of reform: Piao, S. L., Ito, A., Li, S. G., Huang, Y., Ciais, P., Wang, X. H., Forest policy in post-1978 China, Forest Policy Econ., 6, 71–83, Peng, S. S., Nan, H. J., Zhao, C., Ahlström, A., Andres, R. J., 2004. Chevallier, F., Fang, J. Y., Hartmann, J., Huntingford, C., Jeong, Wei, Y., Liu, S., Huntzinger, D. N., Michalak, A. M., Viovy, N., S., Levis, S., Levy, P. E., Li, J. S., Lomas, M. R., Mao, J. F., Post, W. M., Schwalm, C. R., Schaefer, K., Jacobson, A. R., Earth Syst. Dynam., 11, 235–249, 2020 www.earth-syst-dynam.net/11/235/2020/
You can also read