The INTENSE project: using observations and models to understand the past, present and future of sub-daily rainfall extremes - ASR
←
→
Page content transcription
If your browser does not render page correctly, please read the page content below
17th EMS Annual Meeting: European Conference for Applied Meteorology and Climatology 2017
Adv. Sci. Res., 15, 117–126, 2018
https://doi.org/10.5194/asr-15-117-2018
© Author(s) 2018. This work is distributed under
the Creative Commons Attribution 4.0 License.

         The INTENSE project: using observations and models
             to understand the past, present and future of
                      sub-daily rainfall extremes
          Stephen Blenkinsop1 , Hayley J. Fowler1 , Renaud Barbero2 , Steven C. Chan1 , Selma B. Guerreiro1 ,
       Elizabeth Kendon3 , Geert Lenderink4 , Elizabeth Lewis1 , Xiao-Feng Li1 , Seth Westra5 , Lisa Alexander6 ,
       Richard P. Allan7 , Peter Berg8 , Robert J. H. Dunn3 , Marie Ekström9 , Jason P. Evans6 , Greg Holland10 ,
            Richard Jones3 , Erik Kjellström8 , Albert Klein-Tank4 , Dennis Lettenmaier11 , Vimal Mishra12 ,
                               Andreas F. Prein10 , Justin Sheffield13 , and Mari R. Tye10
                         1 School     of Engineering, Newcastle University, Newcastle upon Tyne, UK
                          2 National     Research Institute of Science & Technology for Environment
                                              & Agriculture, Aix-en-Provence, France
                                               3 Met Office Hadley Centre, Exeter, UK
                             4 Royal Netherlands Meteorological Institute, De Bilt, the Netherlands
           5 School of Civil, Environmental and Mining Engineering, University of Adelaide, Adelaide, Australia
                   6 Climate Change Research Centre, University of New South Wales, Sydney, Australia
                               7 Department of Meteorology, University of Reading, Reading, UK
                          8 Swedish Meteorological and Hydrological Institute, Norrköping, Sweden
                             9 School of Earth and Ocean Sciences, Cardiff University, Cardiff, UK
                                 10 National Center for Atmospheric Research, Boulder, CO, USA
                                      11 Department of Geography, UCLA, Los Angeles, USA
                                12 Indian Institute of Technology Gandhinagar, Gandhinagar, India
                       13 Geography and Environment, University of Southampton, Southampton, UK

                      Correspondence: Stephen Blenkinsop (stephen.blenkinsop@newcastle.ac.uk)

                         Received: 14 February 2018 – Accepted: 5 June 2018 – Published: 19 June 2018

      Abstract. Historical in situ sub-daily rainfall observations are essential for the understanding of short-duration
      rainfall extremes but records are typically not readily accessible and data are often subject to errors and inho-
      mogeneities. Furthermore, these events are poorly quantified in projections of future climate change making
      adaptation to the risk of flash flooding problematic. Consequently, knowledge of the processes contributing to
      intense, short-duration rainfall is less complete compared with those on daily timescales. The INTENSE project
      is addressing this global challenge by undertaking a data collection initiative that is coupled with advances in
      high-resolution climate modelling to better understand key processes and likely future change. The project has so
      far acquired data from over 23 000 rain gauges for its global sub-daily rainfall dataset (GSDR) and has provided
      evidence of an intensification of hourly extremes over the US. Studies of these observations, combined with
      model simulations, will continue to advance our understanding of the role of local-scale thermodynamics and
      large-scale atmospheric circulation in the generation of these events and how these might change in the future.

Published by Copernicus Publications.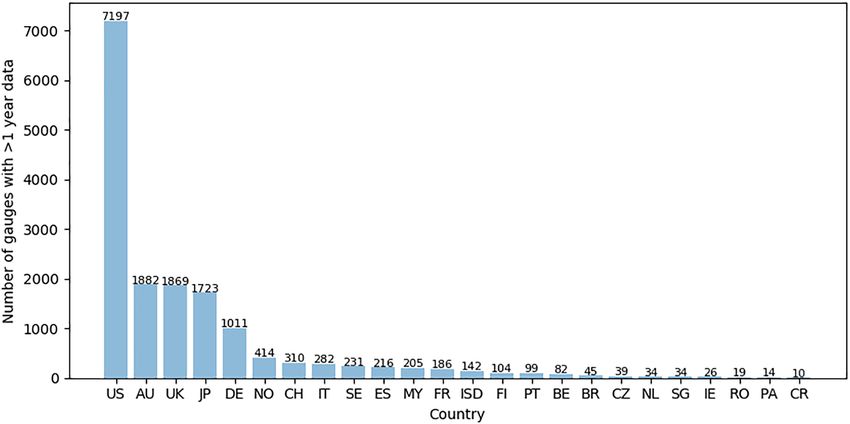
118 S. Blenkinsop et al.: The INTENSE project
1 Introduction – To use this dataset to quantify the nature of global rain-
fall extremes across multiple timescales and, where pos-
Changes in short-duration, heavy rainfall events are an im- sible, quantify recent change (Sect. 2.2);
portant fingerprint of anthropogenic climate change (Hegerl
– To provide new understanding of the influence of cli-
et al., 2015) and are crucial to quantify as they are associ-
mate model resolution and structure on the simula-
ated with flash flooding which poses a significant threat to
tion of rainfall extremes for different climate regimes
lives, infrastructure, and natural ecosystems. Quantified esti-
(Sect. 2.3);
mates of extreme rainfall intensities at sub-daily timescales
(down to a few minutes) and spatial scales of 1–10 km2 are – To combine models and observations to improve un-
needed for urban drainage design (Arnbjerg-Nielsen et al., derstanding of the drivers of rainfall extremes across
2013) and therefore for adaptation to future climate change. multiple timescales, examining the influence of local
Observations confirm basic physics predicting increased at- thermodynamics and large-scale atmospheric circula-
mospheric moisture with warming, fuelling intensification tion modes (Sect. 2.4); and
of heavy rainfall (Trenberth et al., 2003). However, under-
standing how changes to atmospheric moisture will combine – To use this knowledge to (i) provide a better understand-
with changes in circulation dynamics in a warming world to ing of the likely responses to warming of rainfall ex-
strengthen or weaken regional increases in intense rainfall re- tremes at different timescales and geographic locations,
mains a key challenge for climate change research (Pfahl et and (ii) use information from climate models in a more
al., 2017). Achieving this requires the improved availability informed way to improve climate change adaptation de-
of high-quality, high-resolution rainfall observations (Wes- cision making (Sect. 3).
tra, et al., 2014; Wilby et al., 2017), advances in climate mod-
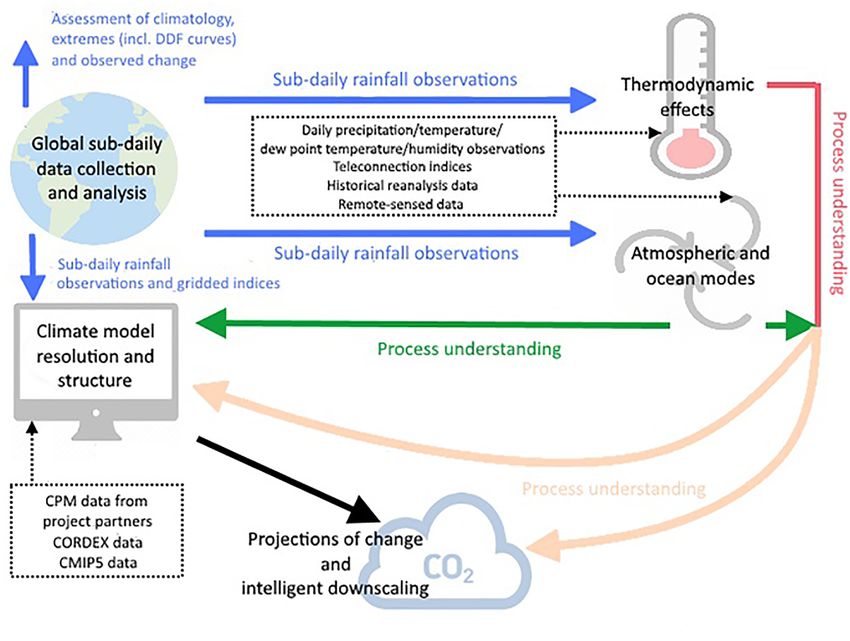
The project structure, main data requirements and outputs
elling on convection-permitting scales (Westra et al., 2014;
are summarised in Fig. 1. Subsequent sections in this pa-
Prein et al., 2015, 2017a) and an improved understanding
per provide a brief review of current understanding around
of atmospheric processes that contribute to intense rainfall
these themes, incorporating the contributions made by IN-
(O’Gorman, 2015; Lenderink and Fowler, 2017; Pfahl et al.,
TENSE researchers and partners (reflected in the authorship
2017).
of this paper) to this literature. More details of project out-
This paper summarises how these challenges are being ad-
puts, including publications, may be found on the INTENSE
dressed by the INTENSE (INTElligent use of climate mod-
website1 and a summary is provided in Table 1.
els for adaptatioN to non-Stationary hydrological Extremes)
project to provide new knowledge relevant to adapting to hy-
droclimatic risks under climate change. 2.1 Data collection and provision
In situ precipitation data at sub-daily timescales are needed
to quantify the characteristics of extreme events for important
2 The INTENSE project research questions including the detection of change and for
practical applications such as urban drainage design. They
INTENSE is the first major international effort to focus on are also valuable for the validation of radar and satellite prod-
global sub-daily rainfall extremes, enabling substantial ad- ucts (Hegerl et al., 2015) and the outputs from climate mod-
vances in quantifying observed historical changes and pro- els (Prein et al., 2015). However, such data are not as exten-
viding the physical understanding of processes necessary for sive, either in time or space, as those for daily rainfall to-
improved regional prediction of change. The project leads tals (Westra et al., 2014; Hegerl et al., 2015), are subject to a
the global research effort within the Global Energy and Wa- range of sampling and instrument errors and inhomogeneities
ter Exchanges (GEWEX) Hydroclimatology Panel Cross- (Blenkinsop et al., 2017; Westra, et al., 2014; Wilby et al.,
Cutting project on sub-daily precipitation extremes, address- 2017) and are less freely available compared with daily data
ing the World Climate Research Programme “Grand Chal- (Hegerl et al., 2015). Consequently, compared with extreme
lenge” on extremes (Alexander et al., 2016). To develop a rainfall on timescales of a day or longer, globally, sub-daily
more thorough understanding of the relationship between events have been little studied.
large-scale warming, atmospheric circulation and sub-daily The INTENSE project is therefore focussing on collect-
extreme rainfall the project is addressing the research areas ing sub-daily rain gauge records, which provide the most
set out by Westra et al. (2014) through the following aims: accurate representation of the amount of water reaching the
ground at a given location. To date, the global sub-daily rain-
fall dataset (GSDR) we have compiled comprises data from
– To undertake a unique, global-scale data collection ef-
23 687 gauges (Lewis et al., 2018a), having an average record
fort of sub-daily rainfall data and apply a set of quality
control methods to construct a new, high-quality global 1 https://research.ncl.ac.uk/intense/outputs/ (last access: 12 June
dataset (Sect. 2.1); 2018).
Adv. Sci. Res., 15, 117–126, 2018 www.adv-sci-res.net/15/117/2018/S. Blenkinsop et al.: The INTENSE project 119
Figure 1. INTENSE project research themes, information flows and outcomes. The collection of in situ sub-daily rain gauge data represents
a core project activity (blue arrows). Thermodynamic and atmospheric/ocean processes are considered independently (red and green arrows)
but also in an integrated manner (yellow arrows). These data and knowledge will be used to evaluate model simulations of extreme rainfall
across different timescales and locations. Model outputs will then be used for the development of process-based downscaling methods and
provide guidance on the use of projections (black arrow). Data in dashed boxes denotes externally produced data used in the project.
Table 1. Key outputs from the INTENSE project researchers and partners at time of publication.
Output Summary
Global sub-daily rainfall dataset Hourly rainfall data collected from 23 countries (excluding ISD).
(GSDR)
Globally applicable quality control Applied to hourly rainfall accumulations. Will be open-source, and
process freely available.
Definition of 13 sub-daily rainfall Consistent with ETCCDI daily indices but reflecting the intensity,
indices frequency and time of occurrence of sub-daily extremes. These will
be freely available to the international community and hosted on the
Deutscher Wetterdienst (DWD) GPCC website.
15 peer reviewed journal articles Published research progressing understanding of observed change of
sub-daily extremes, thermo-dynamic and large-scale drivers, and the de-
velopment and analysis of high resolution convection-permitting mod-
els. Includes continental scale analysis of historical US hourly rainfall.
Great Britain gridded 1 km hourly Hourly 1 km gridded rainfall dataset based on hourly gauge data and
rainfall data (CEH-GEAR1hr) daily gridded dataset. Will be hosted and periodically updated along-
side the CEH-GEAR dataset by the Centre for Ecology and Hydrology
(CEH) in the UK.
www.adv-sci-res.net/15/117/2018/ Adv. Sci. Res., 15, 117–126, 2018120 S. Blenkinsop et al.: The INTENSE project Figure 2. List of countries/data sources contributing at least 10 gauges with a minimum of 1 year of hourly data from the combined data collection exercise and ISD database. Numbers denote the number of gauges. (Abbreviations: US – USA, AU – Australia; UK – United Kingdom, JP – Japan, DE – Germany, NO – Norway, CH – Switzerland, IT – Italy, SE – Sweden, ES – Spain, MY – Malaysia, FR – France, ISD – Non-allocated gauges from the ISD database, FI – Finland, PT – Portugal, BE – Belgium, BR – Brazil, CZ – Czechoslovakia, NL – the Netherlands, SG – Singapore, IE – Republic of Ireland, RO – Romania, PA – Panama, CR – Costa Rica. length of 13 years at an hourly or multi-hourly resolution. rainfall indices based on the ETCCDI indices already avail- Most gauge records commence after 1990 with some con- able for daily data (Peterson, 2005; Donat et al., 2013). These tinuing up to 2017 although there is a decrease in gauge new indices have been identified following discussions with availability in recent years. Just under half of these are from the climate observations and modelling communities and de- the Integrated Surface Database (ISD) (Smith et al., 2011), scribe important attributes of sub-daily extremes, where pos- with the remainder being provided by national meteorologi- sible, corresponding to existing daily ETCCDI indices. For cal and environmental agencies. Figure 2 identifies all those example, indices of monthly maxima of hourly and multi- countries contributing at least 10 gauges with a minimum of hourly rainfall will be provided along with monthly counts 1 year of hourly data. Sub-hourly resolution data has also of threshold exceedances, as well as indices reflecting the di- been obtained for the UK and Australia and similar resolu- urnal cycle (e.g. monthly index of the wettest hour). These tion data will be collected for the US to quantify extremes indices are consistent with the naming and methodological over shorter durations but also to improve estimates of hourly conventions of the ETCCDI daily indices for easy applica- extremes that may be underestimated due to temporal aggre- tion by users and the data will be made freely accessible for gation (Morbidelli et al., 2017). research purposes. The collection process revealed that even where data are available they may not be adequate for the analysis of ex- treme events – for example, undocumented gauge break- 2.2 Quantifying the nature of extremes and observed downs, hourly values accumulated as daily totals, or mechan- change ical failure of the rain gauges may produce erroneous rain- Analysis of this global dataset will help quantify the na- fall amounts (Blenkinsop et al., 2017). Furthermore, changes ture of extremes on multiple timescales, expanding regional such as gauge location, site characteristics or equipment type analyses (e.g. Blenkinsop et al., 2017; Darwish et al., 2018; may introduce inhomogeneities in climatic series (e.g. Bar- Forestieri et al., 2018a), and so improve understanding of bero et al., 2017). We have therefore developed an automated current patterns of extreme rainfall globally. This will in- quality control process for sub-daily data based on methods clude the spatial pattern of extreme intensities, their season- previously applied to the UK (Blenkinsop et al., 2017; Lewis ality and diurnal cycles. Further, whilst existing studies of et al., 2018b) but here used to produce a high-quality global long-term trends and variability in sub-daily extremes have dataset. tended to cover relatively small spatial domains, INTENSE Whilst data licensing restrictions mean that the GSDR has already made progress analysing changes at national to dataset cannot immediately be made freely available, the data continental scales, adding to the national scale studies of Sen collected will be used to produce a set of sub-daily extreme Roy (2009) and Westra and Sisson (2011). Whilst US hourly Adv. Sci. Res., 15, 117–126, 2018 www.adv-sci-res.net/15/117/2018/
S. Blenkinsop et al.: The INTENSE project                                                                                        121

and daily seasonal maxima have increased, the percentage            tion models (Kendon et al., 2017). CPMs may also be neces-
of stations showing significant increasing annual maximum           sary to provide improved quantification of other hazards in-
precipitation trends was generally higher for daily compared        cluding lightning, hail and wind gusts (Kendon et al., 2017;
to hourly extremes (Barbero et al., 2017). Strong evidence          Gadian et al., 2018).
though points to more widespread increases in the magni-               The first study to look at changes in rainfall in long cli-
tude and frequency of hourly extremes in winter compared            mate change simulations at convection-permitting scale was
to daily extremes. Changes in hourly extremes over the UK           carried out by the Met Office Hadley Centre (Kendon et
are currently difficult to detect as substantial natural climate    al., 2014). These simulations at a resolution of 1.5 km pro-
variability reduces the signal-to-noise ratio (Kendon et al.,       vided evidence that intense summer rainfall could become
2018). Although a recent increase in the intensity of UK sum-       heavier over the southern UK with almost five times more
mer extremes has been observed, this is likely to be at least       events exceeding 28 mm in one hour (indicative of poten-
partly related to the natural variability of atmospheric and        tial for surface water flooding in the UK) in the future than
ocean modes.                                                        in the current climate. These simulations have also now
   Our results so far emphasise the importance of considering       been supplemented with corresponding data for the northern
relevant region-specific atmospheric processes in the assess-       half of the UK (Chan et al., 2018a). As part of INTENSE,
ment of change, and the need to examine sufficiently long           projected changes in rainfall extremes across timescales in
time periods and/or large enough datasets. The provision of         these CPM simulations have been explored alongside ob-
quality-controlled data means that INTENSE is providing the         served trends, with implications for detection and attribution
opportunity to further extend these analyses using the GSDR         studies (Kendon et al., 2018). Data at sub-hourly timescales
dataset; approximately 17 % of the gauges obtained so far           from these CPMs have also been investigated, with similar
cover a period of over 30 years necessary for this type of          changes in summer 10 min rainfall over the southern UK pro-
analysis (Lewis et al., 2018a) although this falls to ∼ 4.5 %       jected as for hourly timescales (Chan et al., 2016b), but the
for periods of over 50 years.                                       lack of observed data has precluded model validation to date.
                                                                    The sub-hourly datasets collated in INTENSE will begin to
2.3   Improved modelling capabilities
                                                                    address this deficiency.
                                                                       CPM climate change simulations are now becoming avail-
Traditional approaches to obtaining projections of regional         able across other parts of the globe. For example, using a
precipitation change use an ensemble of regional climate            larger North American domain, Prein et al. (2017c) used
models (RCMs) but these typically only provide outputs at           a 4 km resolution CPM to project increases in the maxi-
a resolution of 10–50 km. Statistical downscaling methods,          mum rainfall rate in mesoscale convective systems (MCS) in
which include temporal disaggregation approaches, may be            the future. Although some consistent messages are emerging
used to derive projections of change in sub-daily rainfall but      from these studies a better understanding of the differences
these rely on the assumption that the relationship between          between models is required, and it is therefore significant that
rainfall at different timescales (e.g. daily to hourly) remains     INTENSE is integrating with the main international effort to
constant in the future. The INTENSE project has applied             produce a coordinated set of convection permitting climate
this statistical approach to produce projected future depth-        simulations through the CORDEX flagship pilot study “Con-
duration-frequency (DDF) relationships for Sicily, Italy, for       vective phenomena at high resolution over Europe and the
rainfall totals down to hourly durations (Forestieri et al.,        Mediterranean”2 . This will maximise the utility of the GSDR
2018b). However, although state-of-the-art climate models           dataset and help to integrate knowledge on the key processes
have a high degree of skill in simulating many features of our      and drivers of extreme sub-daily rainfall. This pilot study is
climate (Flato et al., 2013) they also have a number of known       focused on Europe, with a number of different groups car-
deficiencies. These include the simulation of intense rainfall      rying out < 3 km resolution climate simulations spanning a
due to their relatively coarse resolution that cannot explic-       common Alpine domain plus, in some cases, additional Eu-
itly resolve convection which results in the consequent use         ropean sub-domains.
of convective parameterisation schemes (e.g., Mishra et al.,
2012; Mooney et al., 2017). The INTENSE project is linking
                                                                    2.4   Drivers of changes in intense rainfall in a changing
its observational analyses with the development of very high
                                                                          climate
resolution (< 5 km) convection-permitting models (CPMs)
which allow dynamical representation of convection. These           It has been recognised that analyses of observed changes
have been shown to better simulate sub-daily rainfall charac-       are more powerful if they make use of and diagnose phys-
teristics (Kendon et al., 2012; Chan et al., 2014a; Prein et al.,   ical mechanisms that are, or may be, responsible for change
2017b; Lind et al., 2016) including the relationship between        (Hegerl et al., 2015). INTENSE is therefore investigating the
temperature and extreme rainfall (Chan et al., 2016a), and
produce different projections of change in rainfall intensity,          2 http://www.cordex.org/blog/2018/01/26/endorsed-flagship-
duration and extremes to those from standard coarse resolu-         pilot-studies/ (last access: 8 June 2018).

www.adv-sci-res.net/15/117/2018/                                                              Adv. Sci. Res., 15, 117–126, 2018
122 S. Blenkinsop et al.: The INTENSE project role of local thermodynamics and large-scale atmosphere- large-scale vertical velocity; the most intense events were ocean modes as drivers of changes in intense rainfall through typically associated with high vertical velocities which cause linking observational analyses with those based on CPMs. a convergence of moist air at a scale of hundreds of kilome- Observational evidence and climate models suggest that ters. The use of CPMs is also increasingly offering the po- rainfall will intensify with temperature according to the tential to contribute to such process understanding; Chan et Clausius–Clapeyron (CC) relation (a rate of ∼ 6–7 % ◦ C−1 ) al. (2018b) used simulations over the southern UK to show (Trenberth et al., 2003; Allen and Ingram, 2002; Allan et al., that stability, and to a lesser degree relative vorticity and 2010; Pall et al., 2007) representing an important compo- mean sea level pressure, displayed some skill as predictors of nent of change in the global water cycle (Hegerl et al., 2015). hourly extremes. Prein et al. (2017c) showed that the maxi- However, larger-scale modes of atmospheric and ocean vari- mum rainfall rate in MCS over North America is increas- ability such as the El Niño–Southern Oscillation (ENSO), ing in line with CC but the response in rainfall volume over North Atlantic Oscillation (NAO) and monsoon systems are mesoscale catchments is increasing by up to two times CC also important drivers of regional precipitation and extremes, rates due to the spread of heavy rainfall areas in future MCS. whilst moisture transport features such as atmospheric rivers This is due to changes in the MCS cloud physics and internal have been associated with winter flooding in many regions dynamics (e.g. vertical mass fluxes). (e.g. Lavers and Villarini, 2013a, b). However, the interac- We think that the key challenge to provide improved pro- tion between these large-scale and thermodynamic processes jections of future change in sub-daily extremes will be using and their effect on extreme precipitation is not yet well un- both the global observation datasets and climate models to derstood. understand the contributions from (and interactions between) Our work is using the new observational dataset and mod- large-scale circulation and local thermodynamics (Barbero et elling capabilities to examine how rainfall extremes respond al., 2018b). As the project progresses, the increasing avail- to increasing temperature and moisture availability globally. ability of quality-controlled observations from different cli- Kendon et al. (2018) used a CPM simulation over the south- mate regimes, particularly in tropical regions, and the in- ern UK to identify the earlier emergence of future changes in creasing modelling capability with mesoscale atmospheric hourly extremes compared with daily extremes which might climate models is strengthening our ability to meet this chal- be expected from enhanced scaling at shorter durations. Such lenge. super-CC scaling at hourly timescales has been demonstrated in some regions (e.g. Lenderink and van Meijgaard, 2008) however, CC scaling identified in US daily annual maxima 3 Summary and outlook contrasts with lower scaling during most seasons for hourly extremes (Barbero et al., 2017). In the UK, CC scaling is only The INTENSE project is increasing our understanding of ex- observed for hourly extremes in summer (Blenkinsop et al., treme short-duration rainfall events worldwide, linking ob- 2015) with lower scaling at other times of the year. To date, servations and models to better understand the mechanisms most of such studies have examined the rainfall relation- associated with extreme rainfall that can lead to flash flood- ship with temperature, but dew point temperature is emerg- ing. This is partly derived from a data collection initiative that ing as a more appropriate variable to use in scaling studies has currently yielded 23 687 stations to produce the global as it provides a direct measure of humidity (Lenderink et al., sub-daily rainfall dataset (GSDR) which is being used to 2017), enabling a better physical understanding of the scal- characterise current extremes and, by linking with the lat- ing relationship (e.g. Lochbihler et al., 2017; Barbero et al., est CPM simulations, better understand drivers of change. 2018a). INTENSE is taking advantage of global scale ob- Data collection is ongoing and the project is actively seek- served datasets such as HadISD (Dunn et al., 2016) to per- ing additional contributions to extend coverage (see Lewis form such analyses more widely. et al., 2018a for dataset coverage). We have used the gauge It is becoming increasingly clear however that future rain- data to produce a 1 km resolution gridded dataset of histor- fall extremes cannot be simply extrapolated from present day ical hourly rainfall for Great Britain which will be freely scaling relationships and that multiple other factors – land available to hydrologists, climate modellers and other practi- surface characteristics, temperature range, atmospheric dy- tioners (Lewis et al., 2018b). INTENSE will further explore namics, large scale circulation and moisture availability – all options for combining gauge, radar and satellite data into play key roles (Lenderink and Fowler, 2017; Lochbihler et gridded sub-daily products to add to existing merged prod- al., 2017; Prein et al., 2017d; Ali and Mishra, 2017; Bao ucts as a key resource for the climate modelling community et al., 2017; Barbero et al., 2018a). Barbero et al. (2018b) to validate model outputs (Prein et al., 2015, 2017d). This found that, apart from in summer, mid-latitude synoptic pat- will help to address problems with the representativeness of terns (including the jet stream and cutoff lows) are major rain gauges, as networks are insufficiently dense to capture contributors to hourly annual maxima across the western US. local-scale convective storms. In the future, model outputs Lenderink et al. (2017) also identified the prominent role of could also be incorporated to provide valuable information circulation features over the Netherlands as measured by the in areas with low observational coverage such as mountain- Adv. Sci. Res., 15, 117–126, 2018 www.adv-sci-res.net/15/117/2018/
S. Blenkinsop et al.: The INTENSE project                                                                                      123

ous regions. These INTENSE datasets provide a significant         ensembles of CPM simulations more feasible. Even when
platform for future development by the wider scientific com-      ensemble large-domain CPM simulations become common-
munity and efforts are underway to identify a mechanism for       place, biases will still remain which will require correction
their ongoing maintenance and updating to ensure a long-          with statistical downscaling methods.
term legacy of the project. The gauge data and new, derived          A significant area of focus should also include strength-
dataset of global sub-daily extreme indices will be hosted by     ening the link between climate science and impact science
the German meteorological service (Deutscher Wetterdienst         (Westra et al., 2014) and the wider impact community. Cen-
– DWD) though the availability of the former will be limited      tral to this is the relationship between extreme rainfall and
due to licensing arrangements. An improved international ca-      flood risk. Changes in future rainfall intensity can impact
pacity to both monitor change and share data therefore re-        on the flooding of urban drainage systems and pollution of
mains a significant challenge (Hegerl et al., 2015).              coastal waters, for example, in the UK through combined
   A continental-scale analysis using the sub-daily dataset       sewer overflow (CSO) spills. Our high-resolution observa-
has not provided evidence of super-CC scaling over the US         tions and the UK Met Office CPM simulations have been
(Barbero et al., 2017). This may in part be indicative of dif-    used to demonstrate the need for improved guidance on es-
ficulties associated with capturing changes in localised con-     timates of change in rainfall intensity (uplifts) for UK water
vective storms (Barbero et al., 2017; Kendon et al., 2018)        and sewerage companies and the effect of future increases in
but also emphasises the need to assess the role of large-         intensity on increased spills (Dale et al., 2017).
scale circulation patterns and their relationship with local         INTENSE outputs could also be used to better understand
thermodynamic drivers (Lenderink and Fowler, 2017; Bar-           how river catchments respond to intense rainfall, however,
bero et al., 2018b). This interaction between drivers remains     initial work applying uncorrected CPM simulations to the
one of the fundamental challenges to be addressed by IN-          estimation of river flows across catchments in the southern
TENSE but the global extent of the project also enables it        UK indicates greater biases than those from coarser climate
to address, new, emerging questions, for example, ongoing         models and clear differences in projected flood peaks (Kay
work in the project is examining the contrasting behaviour of     et al., 2015). This demonstrates the need for further work
extreme rainfall over urban and rural areas, linking observa-     investigating the application of new knowledge and tools de-
tional analyses with simulations from CPMs.                       veloped in INTENSE for the assessment of future risks as-
   Pioneering work to gain understanding of the benefits of       sociated with hydrological hazards. INTENSE will provide
CPMs in representing extreme rainfall on climate timescales       stakeholders with up-to-date and reliable return period esti-
by the Met Office Hadley Centre, in collaboration with IN-        mates for different rainfall durations (e.g. Forestieri et al.,
TENSE researchers, has led to the inclusion of CPM ensem-         2018a; Darwish et al., 2018) and so contribute to a better
ble simulations (consisting of 10+ members at 2.2 km res-         understanding of current flood risk. Combining this type of
olution spanning the UK) in the UK’s next set of official         information with CPM simulations of future projections (e.g.
climate change projections (UKCP, 2016) to be released in         Chan et al., 2014b) will help to make societies more resilient
2018. This work at the Met Office Hadley Centre also now          to flooding from intense rainfall.
includes extensions to examine larger model domains, in-
cluding the recent completion of a 2.2 km resolution Euro-
pean domain simulation. Analysis of these simulations in IN-      Data availability. No data sets were used in this article.
TENSE, along with comparison of results with those from
other international modelling centres across Europe, Aus-
tralia and the US (e.g. Ban et al., 2015; Argueso et al., 2014;   Competing interests. The authors declare that they have no con-
Rasmussen et al., 2014), including CORDEX, will lead to a         flict of interest.
better understanding of how results from CPMs differ from
coarser resolution models more generally (Kendon et al.,
2017) to offer robust guidance on their use.                      Special issue statement. This article is part of the special issue
                                                                  “17th EMS Annual Meeting: European Conference for Applied Me-
   One of the key challenges limiting the application of
                                                                  teorology and Climatology 2017”. It is a result of the EMS Annual
CPMs is still the computational demand and consequent fi-         Meeting: European Conference for Applied Meteorology and Cli-
nancial cost they impose. This will in part be addressed by       matology 2017, Dublin, Ireland, 4–8 September 2017.
continued advances in computing capabilities but a more in-
telligent use of these models, aided by novel statistical ap-
proaches is necessary for the foreseeable future (Benestad et     Acknowledgements. Hayley J. Fowler leads the European
al., 2017). Chan et al. (2018b) identified large-scale predic-    Research Council INTENSE project (ERC-2013-CoG-617329)
tors that have some skill in predicting when dynamical down-      which has also funded Renaud Barbero, Stephen Blenkinsop,
scaling using a CPM is needed. This could potentially allow       Selma B. Guerreiro, Geert Lenderink, Elizabeth Lewis and
the targeting of high-resolution models to simulate only peri-    Xiao-Feng Li. Hayley J. Fowler is also funded by the Wolfson
ods with a high likelihood of extremes, thus making larger        Foundation and the Royal Society as a Royal Society Wolfson

www.adv-sci-res.net/15/117/2018/                                                             Adv. Sci. Res., 15, 117–126, 2018
124 S. Blenkinsop et al.: The INTENSE project
Research Merit Award (WM140025) holder. NCAR is sponsored Barbero, R., Westra, S., Lenderink, G., and Fowler, H.
by the National Science Foundation. Richard Allan is funded by J.: Temperature-extreme precpipitation scaling: a two-
the NERC SINATRA project (NE/K00896X/1). Robert J. H. Dunn way causality?, Int. J. Climatol., 38, e1274–e1279,
and Elizabeth Kendon were supported by the Joint UK BEIS/Defra https://doi.org/10.1002/joc.5370, 2018a.
Met Office Hadley Centre Climate Programme (GA01101). The Barbero, R., Abatzoglou, J. T., and, Fowler, H. J.: Contribu-
southern UK high-resolution model simulations were funded by the tion of large-scale midlatitude disturbances to hourly pre-
CONVEX project (NERC Changing Water Cycle: NE/I006680/1) cipitation extremes in the United States, Clim. Dynam.,
and the northern UK simulations were funded by the NUT- https://doi.org/10.1007/s00382-018-4123-5, online first, 2018b.
CAT2050 project (NERC Changing Water Cycle: NE/K002392/1, Benestad, R., Sillmann, J., Thorarinsdottir, T. L., Guttorp, P.,
NE/K002430/1, NE/K002406/1). The UK 1 km dataset was part Mesquita, M. d. S., Tye, M. R., Uotila, P., Fox Maule, C., Thejll,
funded by the NERC SINATRA project (NE/K00896X/1). A sum- P., Drews, M., and Parding, K. M.: New vigour involving statisti-
mary of INTENSE project outputs and activities may be found on cians to overcome ensemble fatigue, Nat. Clim. Change, 7, 697–
the project website: https://research.ncl.ac.uk/intense/aboutintense/ 703, 2017.
(last access: 12 June 2018). We thank the three anonymous Blenkinsop, S., Chan, S. C., Kendon, E. J., Roberts, N. M.,
reviewers for their helpful comments and insight. and Fowler, H. J.: Temperature influences on intense UK
hourly precipitation and dependency on largescale circulation,
Edited by: Rasmus Benestad Environ. Res. Lett., 10, 054021, https://doi.org/10.1088/1748-
Reviewed by: three anonymous referees 9326/10/5/054021, 2015.
Blenkinsop, S., Lewis, E., Chan, S. C., and Fowler, H. J.: An hourly
precipitation dataset and climatology of extremes for the UK,
Int. J. Climatol., 37, 722–740, https://doi.org/10.1002/joc.4735,
References 2017.
Chan, S. C., Kendon, E. J., Fowler, H. J., Blenkinsop, S., Roberts,
Alexander, L., Zhang, X., Hegerl, G., Seneviratne, S., Behrangi, A., N., and Ferro, C. A. T.: The value of high-resolution Met Of-
Fischer, E., Martius, O., Otto, F., Sillmann, J., and Vautard, R.: fice Hadley Centre regional climate models in the simulation of
Implementation plan for WCRP grand challenge on understand- multi-hourly precipitation extremes, J. Climate, 27, 6155–6174,
ing and predicting weather and climate extremes. World Climate 2014a.
Research Programme Report: Geneva, Switzerland, available at: Chan, S. C., Kendon, E. J., Fowler, H. J., Blenkinsop, S., and
http://www.wcrp-climate.org/gc-extremes-documents (last ac- Roberts, N. M.: Projected increases in summer and win-
cess: 22 January 2018), 2016. ter UK sub-daily precipitation extremes from high-resolution
Ali, H. and Mishra, V.: Contrasting response of rainfall extremes to regional climate models, Environ. Res. Lett., 9, 084019,
increase in surface air and dewpoint temperatures at urban loca- https://doi.org/10.1088/1748-9326/9/8/084019, 2014b.
tions in India, Sci. Rep., 7, 1228, https://doi.org/10.1038/s41598- Chan, S. C., Kendon, E. J., Roberts, N. M., Fowler, H. J., and
017-01306-1, 2017. Blenkinsop, S.: Downturn in scaling of UK extreme rainfall
Allan, R. P., Soden, B. J., John, V. O., Ingram, W., and Good, P.: with temperature for future hottest days, Nat. Geosci., 9, 24–28,
Current changes in tropical precipitation, Environ. Res. Lett., 5, https://doi.org/10.1038/ngeo2596, 2016a.
025205, https://doi.org/10.1088/1748-9326/5/2/025205, 2010. Chan, S. C., Kendon, E. J., Roberts, N. M., Fowler, H. J.,
Allen, M. R. and Ingram, W. J.: Constraints on future changes in and Blenkinsop, S.: The characteristics of summer sub-hourly
climate and the hydrologic cycle, Nature, 419, 224–232, 2002. rainfall over the southern UK in a high-resolution con-
Argueso, D., Evans, J. P., Fita, L., and Bormann, K. J.: Temperature vective permitting model, Environ. Res. Lett., 11, 094024,
response to future urbanization and climate change, Clim. Dy- https://doi.org/10.1088/1748-9326/11/9/094024, 2016b.
nam., 42, 2183–2199, https://doi.org/10.1007/s00382-013-1789- Chan, S. C., Kahana, R., Kendon, E. J., and Fowler, H. J.: Pro-
6, 2014. jected changes in extreme precipitation over Scotland and North-
Arnbjerg-Nielsen, K., Willems, P., Olsson, J., Beecham, S., Pathi- ern England using a high-resolution regional climate model,
rana, A., Bülow Gregersen, I., Madsen, H., and Nguyen, V. T. Clim. Dynam., https://doi.org/10.1007/s00382-018-4096-4, on-
V.: Impacts of climate change on rainfall extremes and urban line first, 2018a.
drainage systems: a review, Water Sci. Technol., 68, 16–28, 2013. Chan, S. C., Kendon, E. J., Roberts, N., Blenkinsop, S., and
Ban, N., Schmidli, J., and Schar, C.: Heavy precipitation Fowler, H. J.: Large-scale predictors for extreme hourly pre-
in a changing climate: Does short-term summer precipita- cipitation events in convection-permitting climate simulations,
tion increase faster?, Geophys. Res. Lett., 42, 1165–1172, J. Climate, 31, 2115–2131, https://doi.org/10.1175/JCLI-D-17-
https://doi.org/10.1002/2014GL062588, 2015. 0404.1, 2018b.
Bao, J., Sherwood, S. C., Alexander, L. V., and Evans, Dale, M., Luck, B., Fowler, H. J., Blenkinsop, S., Gill, E., Bennett,
J. P.: Future increases in extreme precipitation exceed J., Kendon, E. J., and Chan, S.: New climate change rainfall esti-
observed scaling rates, Nat. Clim. Change, 7, 128–132, mates for sustainable drainage, Engineering Sustainability, 170,
https://doi.org/10.1038/nclimate3201, 2017. 214–224, https://doi.org/10.1680/jensu.15.00030, 2017.
Barbero, R., Fowler, H. J., Lenderink, G., and Blenkinsop, S.: Is Darwish, M., Fowler, H. J., Blenkinsop, S., and Tye, M.
the intensification of precipitation extremes with global warm- R.: A regional frequency analysis of UK hourly and
ing better detected at hourly than daily resolutions?, Geophys. multi-hourly extreme precipitation, Int. J. Climatol.,
Res. Lett., 44, 974–983, https://doi.org/10.1002/2016GL071917, https://doi.org/10.1002/joc.5694, accepted, 2018.
2017.
Adv. Sci. Res., 15, 117–126, 2018 www.adv-sci-res.net/15/117/2018/S. Blenkinsop et al.: The INTENSE project 125 Donat, M. G., Alexander, L. V., Yang, H., Durre, I., Vose, R., Dunn, Kendon, E. J., Ban, N., Roberts, N. M., Fowler, H. J., Roberts, M. R. J. H., Willett, K. M., Aguilar, E., Brunet, M., Caesar, J., J., Chan, S. C., Evans, J. P., Fosser, G., and Wilkinson, J. M.: Do Hewitson, B., Jack, C., Klein Tank, A. M. G., Kruger, A. C., convection-permitting regional climate models improve projec- Marengo, J., Peterson, T. C., Renom, M., Oria Rojas, C., Rustic- tions of future precipitation change?, B. Am. Meterol. Soc., 98, ucci, M., Salinger, J., Elrayah, A. S., Sekele, S. S., Srivastava, A. 79–93, https://doi.org/10.1175/BAMS-D-15-0004.1, 2017. K., Trewin, B., Villarroel, C., Vincent, L. A., Zhai, P., Zhang, X., Kendon, E. J., Blenkinsop, S., and Fowler, H. J.: When Will and Kitching, S.: Updated analyses of temperature and precipita- We Detect Changes in Short-Duration Precipitation Extremes?, tion extreme indices since the beginning of the twentieth century: J. Climate, 31, 2945–2964, https://doi.org/10.1175/JCLI-D-17- The HadEX2 dataset, J. Geophys. Res.-Atmos., 118, 2098–2118, 0435.1, 2018. https://doi.org/10.1002/jgrd.50150, 2013. Lavers, D. A. and Villarini, G.: The nexus between atmospheric Dunn, R. J. H., Willett, K. M., Parker, D. E., and Mitchell, L.: rivers and extreme precipitation across Europe, Geophys. Res. Expanding HadISD: quality-controlled, sub-daily station data Lett., 40, 3259–3264, https://doi.org/10.1002/grl.50636, 2013a. from 1931, Geosci. Instrum. Method. Data Syst., 5, 473–491, Lavers, D. A. and Villarini, G.: Atmospheric Rivers and Flood- https://doi.org/10.5194/gi-5-473-2016, 2016. ing over the Central United States, J. Climate, 6, 829–7836, Flato, G., Marotzke, J., Abiodun, B., Braconnot, P., Chou, S.C., https://doi.org/10.1175/JCLI-D-13-00212.1, 2013b. Collins, W., Cox, P., Driouech, F., Emori, S., Eyring, V., Forest, Lenderink, G. and Fowler, H. J.: Understanding pre- C., Gleckler, P., Guilyardi, E., Jakob, C., Kattsov, V., Reason, C., cipitation extremes, Nat. Clim. Change, 7, 391–393, and Rummukainen, M.: Evaluation of Climate Models, in: Cli- https://doi.org/10.1038/nclimate3305, 2017. mate Change 2013: The Physical Science Basis. Contribution of Lenderink, G. and van Meijgaard, E.: Increase in hourly precipi- Working Group I to the Fifth Assessment Report of the Intergov- tation extremes beyond expectations from temperature changes, ernmental Panel on Climate Change, edited by: Stocker, T. F., Nat. Geosci., 1, 511–514, 2008. Qin, D., Plattner, G.-K., Tignor, M., Allen, S. K., Boschung, J., Lenderink, G., Barbero, R., Loriaux, J. M., and Fowler, H. J.: Super- Nauels, A., Xia, Y., Bex, V., and Midgley, P. M., Cambridge Uni- Clausius–Clapeyron scaling of extreme hourly convective pre- versity Press, Cambridge, UK and New York, NY, USA, 2013. cipitation and its relation to large-scale atmospheric conditions, Forestieri, A., Lo Conti, F., Blenkinsop, S., Cannarozzo, M., Fowler, J. Climate, 30, 6037–6052, https://doi.org/10.1175/JCLI-D-16- H. J., and Noto, L.: Regional frequency analysis of extreme 0808.1, 2017. precipitation for Sicily (Italy), Int. J. Climatol., 38, e698–e716, Lewis, E., Fowler, H. J., Alexander, L., Dunn, R., McClean, F., Bar- https://doi.org/10.1002/joc.5400, 2018a. bero, R., Guerreiro, S. B., Li, X.-F., and Blenkinsop, S.: GSDR: Forestieri, A., Arnone, E., Blenkinsop, S., Candela, A., Fowler, A Global sub-daily rainfall dataset, J. Climate, submitted, 2018a. H., and Noto, L. V.: The impact of climate change on ex- Lewis, E., Quinn, N., Blenkinsop, S., Fowler, H. J., Freer, J., Tan- treme precipitation in Sicily, Italy, Hydrol. Process., 32, 332– guy, M., Hitt, O., Coxon, G., Bates, P., and Woods, R.: A rule 348, https://doi.org/10.1002/hyp.11421, 2018b. based quality control method for hourly rainfall data and a 1 km Gadian, A., Blyth, A., Bruyere, C. L., Burton, R., Done, J., Groves, resolution gridded hourly rainfall dataset for Great Britain: CEH- J., Holland, G., Mobbs, S., Pozo, J. T., Tye, M., and Warner, J.: GEAR1hr, J. Hydrol., in revision, 2018b. A case study of possible future summer convective precipitation Lind, P., Lindstedt, D., Kjellström, E., and Jones, C.: Spatial and over the UK and Europe from a regional climate projection, Int. Temporal Characteristics of Summer Precipitation over Cen- J. Climatol, 38, 2314–2324, https://doi.org/10.1002/joc.5336, tral Europe in a Suite of High- Resolution Climate Models, 2018. J. Climate, 29, 3501–3518, https://doi.org/10.1175/JCLI-D-15- Hegerl, G. C., Black, E., Allan, R. P., Ingram, W. J., Polson, D., 0463.1, 2016. Trenberth, K. E., Chadwick, R. S., Arkin, P. A., Sarojini, B. B., Lochbihler, K., Lenderink, G., and Siebesma, A. P.: The Becker, A., Dai, A., Durack, P. J., Easterling, D., Fowler, H. J., spatial extent of rainfall events and its relation to pre- Kendon, E. J., Huffman, G. J., Liu, C., Marsh, R., New, M., Os- cipitation scaling, Geophys. Res. Lett., 44, 8629–8636, born, T. J., Skliris, N., Stott, P. A., Vidale, P. L., Wijffels, S. https://doi.org/10.1002/2017GL074857, 2017. E., Wilcox, L. J., Willett, K. M., and Zhang, X.: Challenges in Mishra, V., Dominguez, F., and Lettenmaier, D. P.: Ur- Quantifying Changes in the Global Water Cycle, B. Am. Mete- ban precipitation extremes: How reliable are regional orol. Soc., 96, 1097–1115, https://doi.org/10.1175/BAMS-D-13- climate models?, Geophys. Res. Lett., 39, L03407, 00212.1, 2015. https://doi.org/10.1029/2011GL050658, 2012. Kay, A. L., Rudd, A. C., Davies, H. N., Kendon, E. J., and Jones, R. Mooney, P. A., Broderick, C., Bruyère, C. L., Mulligan, F. J., and G.: Use of very high resolution climate model data for hydrolog- Prein, A. F.: Clustering of Observed Diurnal Cycles of Precipita- ical modelling: baseline performance and future flood changes, tion over the United States for Evaluation of a WRF Multiphysics Climatic Change, 133, 193–208, https://doi.org/10.1007/s10584- Regional Climate Ensemble, J. Climate, 30, 9267–9286, 2017. 015-1455-6, 2015. Morbidelli, R., Saltalippi, C., Flammini, A., Cifrodelli, M., Pic- Kendon, E. J., Roberts, N. M., Senior, C. A., and Roberts, M. J.: Re- ciafuoco, T., Corradini, C., Casas-Castillo, C. M., Fowler, H. alism of rainfall in a very high resolution regional climate model, J., and Wilkinson, S. M.: Effect of temporal aggregation on J. Climate, 25, 5791–5806, 2012. the estimate of annual maximum rainfall depths for the design Kendon, E. J., Roberts, N. M., Fowler, H. J., Roberts, M. J., Chan, S. of hydraulic infrastructure systems, J. Hydrol., 554, 710–720, C., and Senior, C. A.: Heavier summer downpours with climate https://doi.org/10.1016/j.jhydrol.2017.09.050, 2017. change revealed by weather forecast resolution model, Nature O’Gorman, P. A.: Precipitation extremes under climate change, Cur- Clim. Change, 4, 570–576, 2014. rent Climate Change Reports, 1, 49–59, 2015. www.adv-sci-res.net/15/117/2018/ Adv. Sci. Res., 15, 117–126, 2018
126                                                                                        S. Blenkinsop et al.: The INTENSE project

Pall, P., Allen, M. R., and Stone, D. A.: Testing the Clausius–          Sen Roy, S.: A spatial analysis of extreme hourly precip-
   Clapeyron constraint on changes in extreme precipitation under          itation patterns in India, Int. J. Climatol., 29, 345–355,
   CO2 warming, Clim. Dynam., 28, 351–363, 2007.                           https://doi.org/10.1002/joc.1763, 2009.
Peterson, T. C.: Climate Change Indices, WMO Bulletin, 54, 83–86,        Smith, A., Lott, N., and Vose, R.: The integrated surface database:
   2005.                                                                   recent developments and partnerships, B. Am. Meteorol. Soc.,
Pfahl, S., O’Gorman, P. A., and Fischer, E. M.: Understanding the          92, 704–708, 2011.
   regional pattern of projected future changes in extreme precipi-      Trenberth, K. E., Dai, A., Rasmussen, R. M., and Parsons, D. B.:
   tation, Nat. Clim. Change, 7, 423–427, 2017.                            The changing character of precipitation, B. Am. Meteorol. Soc.,
Prein, A. F., Langhans, W., Fosser, G., Ferrone, A., Ban, N., Go-          84, 1205–1218, 2003.
   ergen, K., Keller, M., Tölle, M., Gutjahr, O., Feser, F., Brisson,    UKCP: Technical approach to the delivery of new UK Climate
   E., Kollet, S., Schmidli, J., van Lipzig, N. P. M., and Leung, R.:      Projections (UKCP18 project), UK Climate Projections, avail-
   A review on regional convection-permitting climate modeling:            able at: http://ukclimateprojections.metoffice.gov.uk/media.jsp?
   Demonstrations, prospects, and challenges, Rev. Geophys., 53,           mediaid=88729&filetype=pdf (last access: 23 January 2018),
   323–361, 2015.                                                          2016.
Prein, A. F., Rasmussen, R., and Stephens, G.: Challenges and ad-        Westra, S. and Sisson, S. A.: Detection of non-stationarity in pre-
   vances in convection-permitting climate modeling, B. Am. Me-            cipitation extremes using a max-stable process model, J. Hydrol.,
   teorol. Soc., 98, 1027–1030, 2017a.                                     406, 119–128, https://doi.org/10.1016/j.jhydrol.2011.06.014,
Prein, A. F., Liu, C., Ikeda, K., Bullock, R., Rasmussen, R. M., Hol-      2011.
   land, G. J., and Clark, M.: Simulating North American mesoscale       Westra, S., Fowler, H. J., Evans, J. P., Alexander, L. V., Berg,
   convective systems with a convection-permitting climate model,          P., Johnson, F., Kendon, E. J., Lenderink, G., and Roberts,
   Clim. Dynam., https://doi.org/10.1007/s00382-017-3993-2, on-            N. M.: Future changes to the intensity and frequency of
   line first, 2017b.                                                      short-duration extreme rainfall, Rev. Geophys., 52, 522–555,
Prein, A. F., Liu, C., Ikeda, K., Trier, S. B., Rasmussen, R. M., Hol-     https://doi.org/10.1002/2014RG000464, 2014.
   land, G. J., and Clark, M. P.: Increased rainfall volume from fu-     Wilby, R. L., Clifford, N. J., De Luca, P., Harrigan, S., Hillier, J.
   ture convective storms in the US, Nat. Clim. Change, 7, 880–884,        K., Hodgkins, R., Johnson, M. F., Matthews, T. K. R., Mur-
   2017c.                                                                  phy, C., Noone, S. J., Parry, S., Prudhomme, C., Rice, S.
Prein, A. F., Rasmussen, R. M., Ikeda, K., Liu, C., Clark, M. P., and      P., Slater, L. J., Smith, K. A., and Wood, P. J.: The “dirty
   Holland, G. J.: The future intensification of hourly precipitation      dozen” of freshwater science: detecting then reconciling hy-
   extremes, Nat. Clim. Change, 7, 48–52, 2017d.                           drological data biases and errors, WIREs Water, 4, e1209,
Rasmussen, R., Ikeda, K., Liu, C., Gochis, D., Clark, M., Dai,             https://doi.org/10.1002/wat2.1209, 2017.
   A., Gutmann, E., Dudhia, J., Chen, F., Barlage, M., Yates,
   D., and Zhang, G.: Climate change impacts on the water
   balance of the Colorado headwaters: High-resolution regional
   climate model simulations, J. Hydrometeor., 15, 1091–1116,
   https://doi.org/10.1175/JHM-D-13-0118.1, 2014.

Adv. Sci. Res., 15, 117–126, 2018                                                                    www.adv-sci-res.net/15/117/2018/
You can also read