Alexander Dereviagin3, Julian Murton1 - Ice wedges as archives of winter palaeoclimate: A review - AWI
←
→
Page content transcription
If your browser does not render page correctly, please read the page content below
Ice wedges as archives of winter palaeoclimate: A review

Thomas Opel1,2, Hanno Meyer2, Sebastian Wetterich2, Thomas Laepple2,
Alexander Dereviagin3, Julian Murton1

1
Permafrost Laboratory, Department of Geography, University of Sussex, Brighton, BN1 9QJ, UK
2
Alfred Wegener Institute, Helmholtz Centre for Polar and Marine Research, Telegrafenberg A43, 14473
Potsdam, Germany
3
Department of Geology, Lomonosov Moscow State University, 1 Leninskie Gory, Moscow, 119991,
Russia

Corresponding Author: Thomas Opel, Permafrost Laboratory, Department of Geography,
University of Sussex, Brighton, BN1 9QJ, UK and Alfred Wegener Institute, Helmholtz Centre
for Polar and Marine Research, Telegrafenberg A43, 14473 Potsdam, Germany.

Email: t.opel@sussex.ac.uk, thomas.opel@awi.de

Abstract

Ice wedges are a characteristic feature of northern permafrost landscapes and grow mainly by snowmelt
that refreezes in thermal contraction cracks that open in winter. In high latitudes the stable-isotope
composition of precipitation (δ18O and δD) is sensitive to air temperature. Hence, the integrated climate
information of winter precipitation is transferred to individual ice veins and can be preserved over
millennia, allowing ice wedges to be used to reconstruct past winter climate. Recent studies indicate a
promising potential of ice-wedge-based palaeoclimate reconstructions for more comprehensive
reconstructions of Arctic past climate evolution. We briefly highlight the potential and review the
current state of ice-wedge palaeoclimatology. Existing knowledge gaps and challenges are outlined and
priorities for future ice-wedge research suggested. The major research topics are (1) frost cracking and
infilling dynamics, (2) formation and preservation of the stable-isotope information, (3) ice-wedge
dating, (4) age-model development, and (5) interpretation of stable-isotope time series. Progress in each
of these topics will help to exploit the palaeoclimatic potential of ice wedges, particularly in view of their
unique cold-season information, which is not adequately covered by other terrestrial climate archives.

KEYWORDS
ICE WEDGES, PERMAFROST, STABLE WATER ISOTOPES, WINTER CLIMATE RECONSTRUCTION, HOLOCENE, LATE PLEISTOCENE

1.      INTRODUCTION

Reconstruction of Holocene climate history of high northern latitudes is mainly based on biological climate

proxies that record summer or growing season air temperatures and Greenland and Canadian Arctic ice-

core records. About two thirds of the temperature-sensitive records included in the Arctic2k v1.1

database1, the Arctic Holocene Transitions database2, and the most recent PAGES2k temperature

database3—which share high standards regarding record length, dating and temporal resolution—

represent temperatures of the summer or growing season, whereas annual temperatures and, in

particular winter temperatures are underrepresented. Moreover, the proxies are unevenly distributed

spatially, with few records from Russian high latitudes. This seasonal and spatial bias may explain the

reconstructed trends of summer and annual cooling in the Northern Hemisphere and Arctic from the

Holocene Optimum until the Little Ice Age, reversed only by the ongoing warming e.g. 4,5-8. Such mid to

late Holocene cooling is commonly attributed to decreasing summer insolation in the Northern

Hemisphere. In contrast, transient climate model simulations indicate increasing annual air temperatures

over the Holocene due to rising greenhouse gas concentrations and retreating ice sheets9. This model‒

data mismatch has been attributed to biases in the climate sensitivity of climate models and in the

seasonality of climate proxy reconstructions. The latter underlines the need to reconstruct winter climate,

especially for polar regions, where winter conditions prevail for most of the year.

Winter climate reconstructions from ice wedges in the northeast Siberian permafrost region have recently

identified warming trends during the mid to late Holocene and pronounced modern warming that may be

explained, respectively, by seasonal solar insolation and greenhouse gas forcing10,11. These trends are
supported by a recent study of speleothems in continental Eurasia12 that emphasized the importance of

winter climate dynamics for Holocene temperature evolution there. Overall, attempts to reconstruct

winter temperatures from biological proxies (such as pollen13 and beetles14) have had little success.

Recently, though, a study by Biskaborn et al.15 revealed the potential of using diatoms (Fragilaria spp.) of

the spring bloom as a winter/spring climate proxy, which also confirmed the ice-wedge-based Holocene

winter warming trend10.

In addition to other climate archives, ice wedges may therefore help to bridge the gap between other

proxy data and climate models10, but remain to be evaluated systematically. Here we highlight the

palaeoclimatic value of ice wedges as unique archives of winter palaeoclimate in permafrost regions and

review the current state of such research. In particular, we focus on the potentials and challenges of ice-

wedge palaeoclimatology, and outline priorities for future research to improve the understanding of ice

wedges as climate archive as well as ice-wedge based reconstructions of past climate. The isotope

geochemistry of ice wedges is reviewed by Lacelle and Vasil’chuk16 and their dynamics, structure and

palaeoenvironmental significance by Christiansen et al.17.

2.      ICE-WEDGE GROWTH

Ice wedges hold the largest potential for palaeoclimate reconstructions from analysis of ground ice

because their infill derives from atmospheric moisture, they may grow over centennial to millennial

timescales and they are widely distributed in permafrost environments. Ice wedges grow in polygonal

patterns owing to thermal contraction (frost) cracking of the frozen ground in winter and filling of cracks

mostly by snowmelt in spring18. Minor contributions of snow and/or depth hoar19,20 as well as of mineral

particles and organic material may occur, the latter allowing for direct dating. The melt water refreezes

immediately due to the sub-zero ground temperatures and forms a vertical ice vein21. Ice wedges widen

by repeated frost cracking, snow-melt filling and refreezing, and, therefore, may be identified by their
vertical to subvertical foliation (Figure 1). If the wedges crack in their centres and grow symmetrically,

then the youngest ice veins constitute the central part of a wedge and the ice veins become progressively

older towards its margins. However, such a textbook-like growth pattern has seldom been observed

because ice-wedge growth is often more complex and interrupted by periods of inactivity, thaw or frost

cracking that is not limited to wedge centres.

In general, ice-wedge growth may take place (1) after the formation of permafrost (epigenetic ice wedges

that grow mostly wider), (2) during the formation of new permafrost due to a rise of the permafrost table

following deposition of sediment on the ground surface (syngenetic ice wedges that grow both wider and

higher) or (3) during ground-surface lowering by net removal of active layer material by erosion or mass

wasting (anti-syngenetic ice wedges that grow downwards)22. Growth can be complex in geometry and

extend for centuries or millennia (Figure 1). Syngenetic permafrost development and ice-wedge growth

over several thousands of years may lead to ice-rich formations such as the Late Pleistocene Yedoma Ice

Complex in northeast Siberia, characterized by huge ice wedges more than 20 m high and more than 5 m

wide (Figure 1).

Ice wedges likely include some of the oldest ice preserved in the Arctic. Ages of about 200,000 years from

Bol’shoy Lyakhovsky Island in the eastern Siberian Arctic23 and more than 700,000 years from Yukon,

Canada,24 have been reported. Ice wedges from the last glacial period are abundant in permafrost

sequences across the Arctic, in particular in northern Siberia, Alaska, and Canada.

3.      ICE WEDGES AS PALAEOCLIMATE ARCHIVES

At high latitudes, the stable-isotope ratios of oxygen and hydrogen (δ18O and δD) in precipitation are

sensitive to local air temperatures25. Ice wedges in Siberia, Canada, Alaska, Svalbard, and China have been

studied as they preserve δ18O and δD values over centennial to millennial timescales10,11,17,23,26-41, which

additionally allow calculation of the second-order parameter deuterium excess d (d=δD‒8*δ18O)25. In
spring, frost cracks may fill mostly with melt water from the last winter’s snow pack, whose integrated

isotopic signal is transferred into a single ice vein without additional isotopic fractionation due to rapid

freezing in the frozen ground21. Hence, ice wedges are considered as climate archives for the cold period,

i.e. when precipitation falls as snow. Meyer et al.10 defined the climate recording season as meteorological

winter and spring, i.e. December to May, hereafter referred to as winter. Based on stable isotope data of

modern ice wedges and precipitation, Vasil’chuk42, Nikolayev and Mikhalev43, Konyakhin44, Konishchev et

al.45, and Streletskaya et al.38suggested regression equations (with large errors) to calibrate ice-wedge

stable isotopes to winter air temperatures in northern Eurasia (Table 1). Porter et al.41 used regionally

derived regression lines between temperature and precipitation isotopes based on the GNIP (Global

Network for Isotopes in Precipitation) dataset46. However, as these approaches are based on only a limited

amount of data and may be oversimplified (section 4.2.1), they have not been generally accepted and

applied quantitatively; instead, variations in δ18O and δD are often interpreted as relative changes of

winter temperatures. The interpretation of ice wedge d is complex and local processes have to be taken

into account29. Nevertheless, long-term changes in d have been interpreted as varying evaporation

conditions in the moisture source and/or shifting moisture sources due to changing atmospheric

circulation28-30.

Previous palaeoclimate studies of ice wedges have covered different timescales of the late Quaternary.

Due to syngenetic ice-wedge growth—often over tens of thousands of years—and limited dating

methods, the temporal resolution of ice-wedge paleoclimate studies is often very low and corresponds to

specific stratigraphic units of the Late Pleistocene and the Holocene, depending on the dating techniques

applied23,28,29,47.

Recently, detailed studies have significantly improved the temporal resolution of ice-wedge records. Sub-

millennial to centennial-scale stacked δ18O records have been generated for Lateglacial and Holocene time
periods by combining radiocarbon ages of organic inclusions from horizontal sampling profiles across ice

wedges with the stable-isotope values of the same samples10,11,30. In particular, the wedge-ice δ18O records

obtained by Meyer et al.10 and Opel et al.11 from the northeast Siberian Arctic—with high temporal

resolution and replicable trends consistent with climate model-based and independent proxy-based

winter-climate records of recent millennia—highlight the great potential of ice wedges as archives of

winter climate.

However, compared to other well-established climate archives such as ice cores or speleothems, ice

wedges are relatively understudied and ice-wedge palaeoclimatology faces several open questions,

challenges and limitations (see chapter 4). Ice wedges cannot compete with ice cores or tree rings in terms

of temporal resolution, but they can contribute valuable time-averaged information on past climate

development, in particular for regions that lack other climate archives and/or research questions that

concern past winter climate.

4.      RESEARCH TOPICS – STATE OF THE ART AND FUTURE RESEARCH PRIORITIES

The following interrelated research topics need to be addressed in order to evaluate more fully the

strengths and weaknesses of ice wedges as a palaeoclimate archive and to improve the quality and

temporal resolution of ice-wedge based palaeoclimate reconstructions: (1) modern ice-wedge cracking

and infilling dynamics; (2) formation and preservation of the stable-isotope information stored in ice

veins; (3) improvement of ice-wedge dating; (4) development of ice-wedge age/growth models and

stable-isotope time series; and (5) generation of new ice-wedge stable-isotope records and improved

interpretation.

4.1 Frost cracking and infilling dynamics

The dynamics of frost cracking and crack infilling significantly affect the use of ice wedges as climate

archives. They determine which climate signal is incorporated into the ice veins (e.g. fresh snow, melt
water, or depth hoar, each with different climate‒isotope relationships). Furthermore, they influence the

recorded season, and the resolution and chronology of the climate record. An ice-wedge record can be

continuous or discontinuous, depending on the timing, frequency and position of frost cracking and

infilling.

4.1.1 State of the art

Monitoring studies of ice-wedge growth48 are rare. Most studies of frost cracking cover only short time

periods (one to five years)49-51. Longer-term observations (20 years) on Garry Island in the Canadian Arctic

revealed that frost cracking does not necessarily occur every year but may vary considerably over time

and space52. Per year between 8 and 75% of the 91 ice wedges observed by J.R. Mackay at two study sites

cracked during the 1967 to 1987 period. Some wedges cracked in most years, but one did not crack at all.

Such high variability within and between study sites indicates a major role of local effects (e.g., snow cover

thickness), whereas only a poor correlation of cracking to air temperatures was found. Although the exact

position of cracking may vary, ice wedges tend to crack preferentially near their centre and often year

after year at nearly the same place53. According to observations in Arctic Canada, ice-wedge cracking

occurs between November and April, but mostly between mid of January and late March54. Frost-crack

depths of 2 to 3 m have been reported48. Cracks may narrow before infilling or close without infilling

because of thermal expansion of ground in summer or plugging with ice or sediment55.

Frost-crack filling and ice-vein formation have not been studied systematically over several years.

Snowmelt water is assumed to be the major source for crack infilling of modern ice wedges, even though

hoar crystals may grow in ice-wedge cracks26. Gasanov56 reported crack infilling by desublimation in the

upper part of the crack. Black51 found that the amount of hoar frost added to cracks near Barrow, north

Alaska, generally ranged from ~ 25 to 75% of the void volume, and that the amount of spring meltwater

added to cracks was negligible in some and substantial in others. The width of annual ice infillings at the
top of permafrost was 0.4–6.0 mm at different study sites, with average increments of 1–3 mm,

decreasing with depth.

Climate and site-specific environmental conditions play an important role for infilling of ice-wedge cracks.

St-Jean et al.19 suggested that ice wedges from colder-than-modern periods (e.g. Late Pleistocene) in

Yukon and Alaska may have formed by snow densification or hoarfrost accretion in frost cracks, whereas

late Holocene ice wedges predominantly formed by freezing of liquid water. Boereboom et al.20 inferred

a variable water‒snow mix as a source for crack infilling of Pleistocene and Holocene ice wedges at Cape

Mamontov Klyk in the Siberian Laptev Sea region, with meltwater contributing relatively more during the

warmer Holocene.

The source material of the crack infill may strongly determine the isotopic signature of the wedge ice. For

example, the isotopic composition of depth hoar in the lower part of the snowpack (Figure 2) may vary

from that of the upper snowpack and also of snow melt due to fractionation processes involved. If depth

hoar is a significant component of ice veins, this may explain why significant offsets have been observed

between the isotope composition of winter snow and modern ice veins 29,32. It is unclear whether these

offsets can be primarily attributed to (a) later stages of snowmelt, with enriched isotope values compared

to the earlier stages due to progressive isotope fractionation57; or (b) changes (i.e. enrichment) of the

snowpack’s isotopic composition during winter due to seasonality of precipitation, sublimation, isotopic

exchange between snow and atmospheric water vapour, snow drift and depth-hoar formation e.g. 45,58-60.

It is likely that the timing of crack infilling plays a major role and the material that is available at this specific

moment constitutes the ice vein. Early filling would exclude the later stages of winter precipitation,

whereas late filling may integrate the remaining snow cover of the preceding winter. However,

precipitation that has been falling closer to the infill date might predominate over earlier stages of winter

precipitation, which are likely more affected by post-depositional processes such as redistribution due to
wind drift, sublimation and recrystallization during depth-hoar formation. A significant contribution from

the active layer is assumed to be very unlikely due to its frozen state.

4.1.2 Future research priorities

Improved understanding of frost cracking and crack infilling requires an approach based on observations

and instrumentation, ideally over at least several years. This could be supported by field manipulation

experiments such as installing appropriate sampling devices in artificial cracks in order to collect samples

of newly-formed ice veins at different depths and at different times of crack infilling. Monitoring of frost-

crack timing using shock loggers (accelerometers)61,62 or breaking cables e.g.50,63 should be combined with

measurements of air and ground temperatures as well as snow thickness, even though breaking cables

do not provide information on subsequent events such as crack widening or secondary cracking. This

would help to detect the threshold conditions for frost cracking at specific sites and to assess seasonal

patterns as well as the temporal frequency of precipitation, frost cracking and infilling events. The

characteristics of the frost cracks (spatial patterns, depth, width, potential plugs, and closure) as well as

the crack infilling (time, filling material) of a representative number of polygons should be studied during

repeat surveys until the end of melt season in spring. The use of computed tomography (CT) scans64

(Figure 3) and thin sections of newly formed wedge ice for analysis of air bubbles and ice crystals may

provide an additional source of information on ice-vein formation, in particular on filling material and

characteristics of refreezing.

Promising sites to systematically study modern ice-wedge growth dynamics include recently drained

thermokarst lake basins such as Illisarvik48 in the Western Canadian Arctic (with well-known boundary

conditions of freshly aggrading permafrost) or study sites near meteorological or research stations such

as Longyearbyen on Svalbard or Samoylov Island in the Lena Delta (with good logistical support for winter

observations).
4.2 Formation and preservation of the stable-isotope information stored in ice veins

The stable-isotope composition of precipitation at high latitudes relates to air temperatures25, a relation

widely used in ice-core studies. A precondition for quantitative interpretation of stable isotopes in wedge

ice is to determine the extent to which this temperature‒isotope relation remains constant or changes

during formation of ice veins (snow-cover development, melting and refreezing in the frost crack) and the

preservation of the isotopic signal within ice wedges over thousands of years.

4.2.1 State of the art

Existing δ18O‒temperature relations for ice wedges (Table 1) are based on a spatial comparison of stable-

isotope data of modern ice veins and modern syngenetic ice wedges (i.e. those formed during the last 60

to 100 years37) and respective mean air temperatures from nearby meteorological stations. Streletskaya

et al.38 used only study sites with meteorological stations within 100 km and referred to 1961‒1990 as the

reference period. The studies suggest a strong correlation of ice-wedge δ18O values to January,

meteorological winter, and cold-season temperatures, respectively. These regressions are based on the

assumptions that the ice veins originate only from snow melt and that the isotopic composition has not

changed significantly during snow cover formation, melt and refreezing in the frost cracks. Both

assumptions may be questioned. Hence, Konishchev et al.45 corrected Vasil’chuk’s equation42 for

sublimation effects at the snow surface. However, the regressions rely only on a limited number of study

sites and samples (Table 1) with an uneven spatial distribution, and sampling protocols, sample properties,

dating details, and temperature data handling are not well documented. As only δ18O values have been

reported, potential isotopic exchange processes between ice veins, ice wedges, and host sediments

(detectable by excursions of d) cannot be excluded. The calculated relationships are suggested to be valid

for at least large parts of northern Russia and therefore do not consider regional to local peculiarities.

Furthermore, it is unlikely that the isotope‒temperature relations are constant throughout space and time
(e.g. glacial‒interglacial timescales) due to changing climate, moisture source and ice-vein formation

dynamics.

The preservation of the isotopic signal is also important. The outermost several cm of ice wedges can

show increased ion contents as well as less depleted δ18O and δD and lower d values28,32,65, similar to the

pore and segregated ice of host sediments. This indicates exchange processes at the interface of wedge

ice and host sediments, presumably driven by migration of bound water28. Meyer et al.65 estimated that

these exchange processes may affect 10 to 15 cm of ice and sediment, respectively, per 10,000 years. This

raises the question whether the isotope signature of narrow and/or very old ice wedges or composite

wedges still contains the original climate signal or not. Moreover, whether isotopic diffusion affects the

stable-isotope composition of ice wedges remains to be studied, though Pleistocene ice wedges tend to

have smoother isotope profiles (i.e. less variability in horizontal profiles) than Holocene ice wedges.

4.2.2 Future research priorities

For quantitative reconstructions of past winter temperatures the existing isotope‒temperature relations

need to be validated by means of modern analytical devices and a significantly larger well-documented

dataset. All isotopic fractionation processes during ice-vein formation (from snow-cover development

until freezing in the frost crack) must be evaluated.

Following the hypothesis that snowmelt is the main source for newly formed ice veins, the following steps

should be considered to elucidate the stable-isotope history of ice veins and to constrain the δ18O‒

temperature relations of ice wedges. Analyses should include hydrogen isotopes, which allow the

derivation of δ18O‒δD co-isotope relationships and d data. Hence, both isotopes should be analysed in a

similar manner to better understand the significance of fractionation processes in ice-wedge formation.

This is also needed to interpret ice-wedge d data in terms of climate.
Local air temperatures and stable isotopes in precipitation must be evaluated on an event basis to

calibrate the isotopes on a local to regional scale and derive a corresponding “isotope thermometer” for

different periods of the cold season.

The modern spatial relationship of observed air temperatures and ice-wedge stable isotopes allows an

independent calibration under the common assumption that spatial and temporal relationships are

related. Comparison of temporal trends in ice-wedge isotopes in recent decades and the warming trend

of instrumental temperatures provides a further constraint on isotope‒temperature relationships. Finally,

isotope-enabled climate model simulations e.g.66 allow estimates of the local relationship of air

temperature and the stable-isotope composition of snow.

The period of time between the onset of snow-cover and the infilling of frost cracks, with associated

changes of the snow cover stable-isotope composition, needs to be studied in detail, ideally at the same

ice-wedge polygons studied for the frost-crack dynamics (section 4.1.2) and near the precipitation

monitoring site. Repeated snow surveys (thickness, stratigraphy, proportion of depth hoar, Figure 2) are

needed and repeated sampling of snow profiles, including final snowmelt (for stable-isotope analysis) to

trace the transformation of the stable-isotope composition of the snowpack due to snow drift and

redistribution, sublimation, compaction, recrystallization, melting and refreezing. The focus should be on

the snow cover on polygonal rims (i.e. near the ice-wedge troughs) as new ice veins may develop

specifically from this snow and its melt. The snow-cover and snowmelt isotope data need to be compared

with those of the new ice veins. Finally, the new ice veins should be sampled in very high resolution (sub-

mm scale) for stable-isotope analysis. This allows evaluating whether the freezing within the frost crack is

rapid enough to limit isotopic fractionation due to non-equilibrium conditions, as suggested by Michel21.

High-resolution studies of ice wedges of different ages (e.g. Holocene and Late Pleistocene) are essential

to investigate the preservation of stable-isotope signals. A focus on isotope variability of the ice wedge is
needed to detect potential diffusion effects. Detailed high-resolution sampling (e.g. 1 cm resolution or

even less) across the interface of wedge ice and intrasedimental ice in host sediments may help to

determine modifications due to exchange processes. However, one should exclude the outermost (oldest)

samples of an ice wedge-profile (usually some cm) which show increasing (decreasing) δ18O (d) values

from climate interpretation.

High-resolution mapping of the spatial variability of stable isotopes and statistical comparisons of the

temporal variability recorded by the ice wedges and the driving climate signal, similar to studies

performed for ice-cores67,68, should provide insight into the signal formation and preservation. Both

questions could be supported by numerically modelling signal formation67,69. Very low d values may

indicate that the original climate signal has been overprinted due to disequilibrium fractionation, limiting

the palaeoclimatic significance.

4.3 Improvement of ice-wedge dating

As with other climate archives, age determination is crucial for a meaningful interpretation of ice-wedge

data and generation of high-quality palaeoclimate information.

4.3.1 State of the art

Currently, the ages of ice wedges are determined either indirectly by dating of host sediments or by direct

dating of the wedges themselves. The indirect approach attributes ice wedges to stratigraphic units and

dates the host sediments using radiocarbon 70,71, radioisotope disequilibrium47, luminescence23, or fission-

track dating of tephra24. However, the temporal relation of ice wedges to dated host sediments is complex

and variable. At a given altitude wedge ice is younger than the host sediments due to the downward

directed frost cracking and ice-vein formation. Age offsets may amount to several thousands of years28.

Moreover, complex landscape development with a variety of periglacial processes that may occur
simultaneously in space and time needs to be considered while interpreting late Quaternary permafrost

stratigraphies. Hence, this approach cannot be used for high-quality palaeoclimate records, but may

provide rough age estimates for the studied ice wedges. It remains nonetheless a valuable approach,

especially to ice wedges beyond the limit of radiocarbon dating.

Direct dating of ice wedges based on the cosmogenic nuclide chlorine-36 (36Cl) to chloride (Cl-) ratio

(36Cl/Cl-) in wedge ice72 has been applied to Middle to Late Pleistocene ground ice73. It has yielded local

chronologies, which are in general concordance with geological expectations and other chronological

methods, but only for ice wedges older than 40,000 years. As the 36Cl/Cl- dynamics during ice-wedge

formation are not yet fully understood, this approach cannot be applied for high-quality palaeoclimate

records and needs methodological refinement.

Uranium isotopes and modelling of uranium evolution in ice offer another direct dating approach74. For

dating permafrost cores in Alaska which contained mostly segregated but also wedge ice, this approach

yielded chronologies up to ~200 ky BP but with substantial age uncertainties of up to one order of

magnitude. In combination with other dating methods model parameters may be refined to yield more

precise results.

So far, accelerator mass spectrometry (AMS) radiocarbon dating of organic carbon of different size

                                                                                        75,76
incorporated in wedge ice has provided the majority of direct ages of such ice e.g.         . Preferentially,

plant macro-remains such as roots, leaves or twigs have been used10,30, but also lemming droppings11,30,32.

Pollen36 and fine-dispersed organic material32,35 in ice-wedge samples are other sources of radiocarbon-

based age information, but may lead to age overestimation as they might be reworked. The use of

dissolved organic carbon (DOC) and CO2 from air bubbles for dating of wedge ice is in its infancy. The DOC

is assumed to originate from leaching of surface organic matter77 and also from the active layer during

thaw35. A study of Late Pleistocene wedge ice from interior Alaska by Lachniet et al.35 suggests that dating
of DOC and CO2 may provide significantly younger and geologically more reasonable ages for ice-wedge growth compared with ages inferred from AMS-dated fine-dispersed organic material and plant macro- remains. 4.3.2 Future research priorities Three interrelated research topics should be prioritized to improve ice-wedge dating. Further systematic radiocarbon dating of different carbon fractions (i.e. macro-remains, DOC, bubble CO2) incorporated in ice wedges is required to validate the results of Lachniet et al.35. This should be done at several study sites and involve ice wedges of different ages to test for fraction-specific characteristics such as (dis)-similarities in age distributions. Such testing may help to identify the “ideal” carbon fraction for ice-wedge radiocarbon dating that addresses research questions and possible temporal resolution as well as field and laboratory requirements. Replicate radiocarbon dating might allow for detecting and statistically correcting outlier ages caused by reworked materials, as these will always lead to age estimates that are too old. To date old ice wedges beyond the radiocarbon range, the direct approaches of Blinov et al.73 (36Cl/Cl-) and Ewing et al.74 (uranium isotopes) remain to be evaluated systematically. Ideally, samples for both approaches will be taken from the same ice wedges at study sites where different pre-Marine Isotope Stage (MIS) 3 ice wedges are exposed, as on Bol’hoy Lyakhovsky Island47,78 or at the Batagai megaslump79,80 in northeast Siberia. Complementary sediment dating should be used to validate the ice-wedge ages and to test for syngenetic ice-wedge growth. The temporal relation between growth of ice wedges and deposition of host sediments needs to be assessed in order to better compare ice-wedge palaeoclimate signals and palaeoenvironmental datasets of host sediments (such as pollen, plant macro-remains and beetles). The main questions are: how much younger is syngenetic wedge ice than host sediments at the same sampling height; and whether there are
site-specific or regional age offsets? These questions can be addressed by carefully reassessing existing

samples, datasets and stratigraphic observations or by systematic dating of host sediments and ice-wedge

samples. The most promising sedimentary units are widespread Late Pleistocene (i.e. MIS3 and 2) Ice

Complex deposits in long-term accumulation zones and Holocene thermokarst basin or river terrace

deposits.

4.4 Development of ice-wedge age/growth models and stable-isotope time series

High-resolution stable-isotope records from ice wedges are vital to infer past climate variability and to

relate changes in climate forcing to reconstructed climate changes. These would also facilitate the

comparison of ice-wedge archives with other Arctic climate archives such as glacier ice cores and strongly

enhance the usability of the winter palaeoclimatic information preserved in ice wedges.

4.4.1 State of the art

So far, two types of time-series of ice-wedge stable-isotope data have been developed: age interpolation

between radiocarbon-dated samples in Alaska30 and stacking of stable-isotope data of radiocarbon-dated

samples of several ice wedges per study site in Siberia10,11. These approaches have led to Lateglacial and

Holocene time series of sub-millennial to centennial resolution, whereby the stacking approach leads to

relatively few data points per record. Age-modelling approaches similar to the methods used for

sedimentary climate archives81 might allow construction of high-resolution isotopic records, but have not

been applied to ice wedges yet.

However, ice-wedge samples only rarely contain enough plant macro-remains for AMS radiocarbon

dating, especially in ice wedges from MIS 2 and 3. Age inversions in horizontal ice-wedge profiles due to

irregular cracking or redistribution of older organic material into frost cracks as well as uncertainties of

                                  14
radiocarbon dating (e.g. the       C plateau during the Little Ice Age) hamper the straightforward
development of radiocarbon-based age models. Moreover, ice wedges in the MIS3 Yedoma Ice Complex are sometimes at the temporal (i.e. analytical) limit of radiocarbon dating71. 4.4.2 Future research priorities A major focus of future research should be to overcome the rather simplistic approach of stacking paired age‒isotope data in order to compile high-resolution time series (i.e. sub-centennial for Holocene ice wedges). Similar to age-modelling approaches used for sedimentary climate archives, the use of statistical modelling of the age‒distance relationship in between radiocarbon ages should be investigated. The age modelling has to account for the specific conditions of ice wedges, such as non-regular growth due to varying frost-cracking frequencies and positions. To develop and test this approach high-resolution (~1‒2 cm) horizontal (i.e. along the time axis of ice wedges) sampling profiles with numerous radiocarbon ages (minimum of 20 per ice-wedge profile) are needed. Ideally, several horizontal profiles should be sampled from the same ice wedge (e.g. at different depths) or from different ice wedges of the same polygonal network to assess the representativity of both the chronology and the stable-isotope profiles and the influence of site-specific conditions. Numerous radiocarbon ages allow for statistically assessing and removing outliers due to reworked organic material or spatially irregular cracking. In the ideal case of a symmetric growth, comparing the derived profiles on both sides of the centre allows further constraint of the uncertainty of the age model and the derived isotopic time series. The application of state-of-the art MICADAS AMS devices82 that can date samples of less then 50µg carbon may be the best way to deal with the usually limited amount of organic carbon available in individual ice-wedge samples. Ideally, ages can be derived for single ice veins, which may be feasible in young and relatively wide ice veins like those identified at Lake Illisarvik48. We see the highest potential for a successful time-series development for large syngenetic Holocene ice wedges from thermokarst basin deposits. In such “reset landscapes”, ice-wedge growth dynamics are
independent from those of a palaeo relief. In contrast, Holocene ice-wedge growth on top of the Yedoma

Ice Complex is likely influenced by the polygonal ice-wedge networks of the latter. However, wide

syngenetic ice wedges of the Late Pleistocene Ice Complex likely enable the reconstruction of centennial-

scale time series if sufficient datable material is available.

4.5 Generation of new ice-wedge stable-isotope records and improved interpretation

To take advantage of ice wedges as distinct winter palaeoclimate archives, the few existing ice-wedge

palaeoclimate reconstructions need to be validated, new records generated and interpretations

improved.

4.5.1 State of the art

To date, relatively high-resolution ice-wedge records are very limited in number and spatial distribution.

Only three well-dated δ18O time series exist for two study sites in the Siberian Arctic10,11 and one site in

Alaska30, and only one d record has been published so far30. Furthermore, stable-isotope records of pre-

Holocene ice wedges are generally scarce, often discontinuous and have low temporal resolution and

dating accuracy due to the radiocarbon dating limitations. But they are strongly needed to elucidate

interstadial and stadial winter climate conditions. The best record known is from Bykovsky Peninsula,

northern Siberia, with ca. 50,000 years of continuous accumulation in MIS3 and 2 and associated ice-

wedge growth28.

4.5.2 Future research priorities

New Holocene ice-wedge time series are needed from a circum-Arctic array along spatial and temporal

gradients (i.e. from Greenland, Svalbard, West and Central Siberia, Alaska and Canada) to validate

whether the Holocene winter warming trend detected in two East Siberian δ18O time series is a regional
pattern or an Arctic-wide phenomenon. Replicate records from nearby sites and ice wedges would allow

validation and testing of the ability of ice wedges to record regional scale climate signals.

New ice-wedge records should be derived along spatial climate gradients such as a west‒east transect

across the Arctic, ideally connected to monitoring of frost cracking and snow cover dynamics, as outlined

above. The new time series ought to be based on systematic dating of ice wedges and improved

understanding of the isotope signal. All (new) ice-wedge stable isotope data should be made publicly

available, e.g. in a freely available database analogously to the PAGES2k temperature database3.

New ice-wedge stable isotope time series need to be analysed together with other regional and Arctic

palaeoclimate records for a seasonal assessment of past climate change. A particular focus should lie on

the interpretation of the ice-wedge d signal, considering potentially varying moisture sources and

transport pathways. Furthermore, palaeoclimate simulations, such as from the Paleoclimate Modelling

Intercomparison Project Phase III (PMIP3)83, and simulations of water-isotope-enabled climate models

such as ECHAM5-wiso/MPI-OM66,84 need to be considered for the evaluation and interpretation of ice-

wedge derived records and a refinement of the explicit season recorded by ice wedges.

5.      CONCLUSIONS

During recent years, ice wedges have been increasingly and successfully employed as archives for past

winter climate conditions. The stable-isotope ratios (δ18O and δD) from wedge ice provide temperature

proxies with the potential to contribute to closing existing seasonal and spatial gaps of Arctic

palaeoclimate reconstructions. To fully exploit this potential, it is necessary to improve the understanding

of processes involved in ice-wedge growth and the formation and preservation of winter-precipitation

stable isotopes in wedge ice. Further progress is needed in ice-wedge dating and in developing age

models, taking into account the specific characteristics of ice-wedge growth. As strictly related to the cold

season, new high-resolution ice-wedge stable-isotope records would both spatially and temporally
complement the existing paleoclimate archives. By doing so, ice wedges in concert with other

palaeoclimate archives will significantly contribute to a more comprehensive characterization of Arctic

climate evolution on seasonal scales and of the sensitivity of Arctic past and present climate change to

external and internal forcing.

Funding Information

Deutsche Forschungsgemeinschaft: OP2173-1, WE4390/7-1

H2020 European Research Council: 716092

Helmholtz-Gemeinschaft: VG-NH900
FIGURE 1 Selected photographs of ice wedges and wedge ice. A: About 25 m high river cliff in the Lena
River Delta (Siberian Arctic) consisting of Late Pleistocene Yedoma Ice Complex with typical wide and
high ice wedges and several peaty horizons. B: Complex geometry of Late Pleistocene and Holocene ice
wedges at Muostakh Island (Siberian Arctic), person on top for scale. C: Holocene ice wedge with two
rejuvenation stages at the Oyogos Yar coast (Siberian Arctic), the youngest ice wedge parts show the
typical white ice with numerous small air bubbles. D: Typial foliation of Holocene wedge ice (horizontal
cut) representing ice veins with sedimentary and organic inclusions (Oyogos Yar coast, Siberian Arctic).
E: Holocene ice wedge with non-central rejuvenation stage and suggested high-resolution horizontal
sampling profile (Muostakh Island, Siberian Arctic)
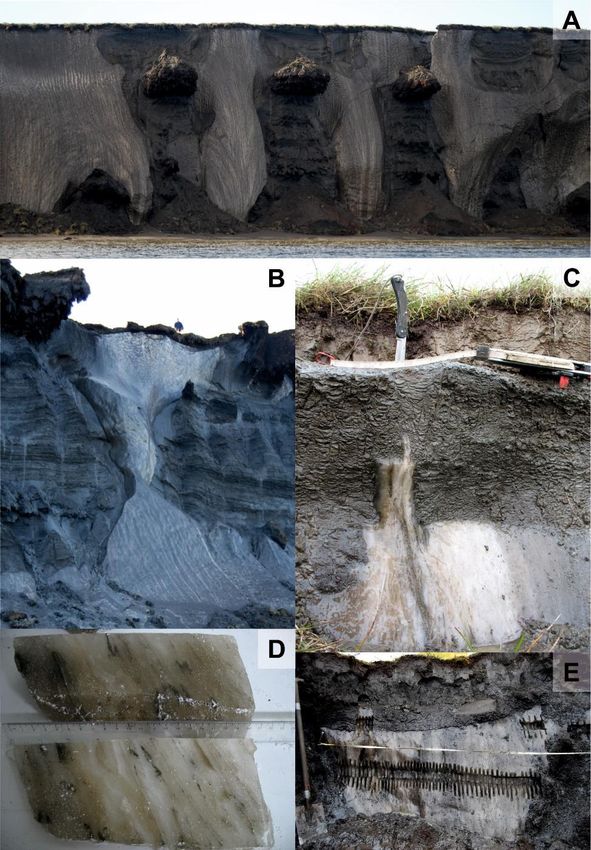
FIGURE 2 Photograph of a snow-filled ice-wedge trough (~ 25 cm deep, 10‒15 cm wide) taken at
Samoylov Island (Lena Delta) on 22 April 2013. Snow-cover thickness is 37 cm, 32‒37 cm from bottom:
snow, 15‒32 cm: depth hoar, 0‒15 cm: void filled with air, vegetation and some broken off depth-hoar
crystals. Below the trough a frost crack 1‒1.5 cm wide and at least 1.3 m deep was observed (not visible)
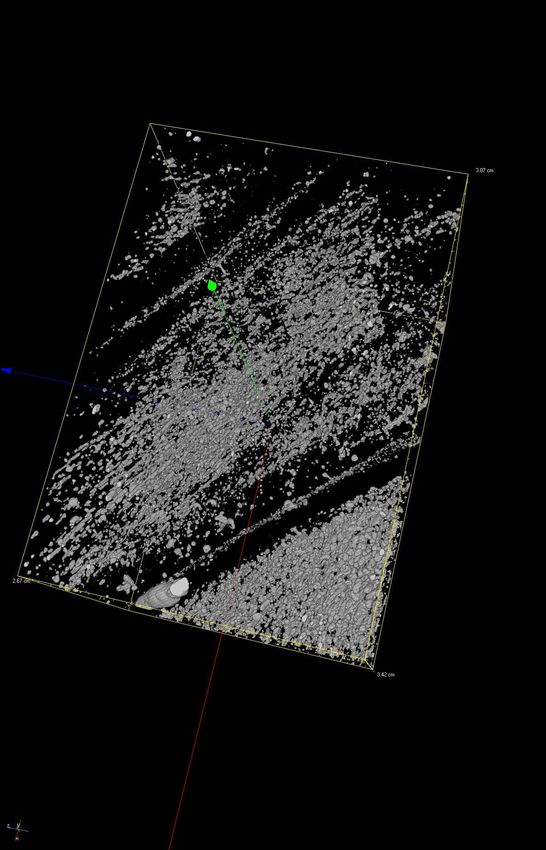
FIGURE 3 CT scan of Holocene wedge ice (sample size 3.87x2.67x3.42 cm) from Muostakh Island
(northeast Siberian Arctic) showing air bubbles in white (total bubble volume ~1%). Note the clearly
detectable ice vein in the lower right and upper left characterized by very small bubbles within bubble-
free ice. The CT scan was performed by means of the AWI-ICE-CT at 140kV in 56µm pixel resolution.
Technical details are given in Freitag et al.64.
TABLE 1 Existing temperature-ice wedge δ18O relations for northern Eurasia

 Study / reference      January                 Winter (December        Cold period
 period                                         to February)            (October to May)
 Vasil’chuk, 199242     T = 1.5 δ18O ± 3        T = δ18O ± 2            n/a
 (34 study sites, 34
 samples)
 Nikolaev and           δ18O = (0.53±0.06) T    δ18O = (0.59±0.07) T    δ18O = (0.86±0.10) T
 Mikhalev, 199543       – (5.39±0.38)           – (4.15±0.37)           – (3.88±0.36)
 (35 study sites)       (r2=0.796)              (r2=0.819)              (r2=0.830)
 Nikolaev and           δ18O = (0.48±0.04) T    δ18O = (0.56±0.05) T    δ18O = (0.83±0.12) T
 Mikhalev, 199543       – (9.02±0.14)           – (6.90±0.13)           – (6.14±0.20)
 (Northern Yakutia,     (r2=0.90)               (r2=0.91)               (r2=0.78)
 15 study sites)
 Konyakhin, 199644      n/a                     T = 1.2 δ18O            n/a
 (27 study sites, 94
 samples)
 Konishchev et al.,     n/a                     δ18O = 1.25 T + 4.0     n/a
 200345
 Streletskaya et al.,   T = 1.12 δ18O – 6.43    T = 1.15 δ18O – 4.6     T = 0.885 δ18O – 2.55
 201538                 (R2 = 0.745, σ = 2.6)   (R2 = 0.754, σ = 2.7)   (R2 = 0.674, σ = 2.7)
 (20 study sites, 140
 samples)

Acknowledgements

We thank Johannes Freitag for providing CT scan of the ice-wedge sample. T.O. and S.W. acknowledge

funding from German Research Foundation DFG (grants OP217/3-1 and WE4390/7-1, respectively). T.L.

was supported by the Initiative and Networking Fund of the Helmholtz Association Grant VG-NH900 and

the European Research Council under the European Union’s Horizon 2020 research and innovation

programme (grant agreement no. 716092). We thank the editor, Mauro Guglielmin, as well as Trevor

Porter and a second, anonymous reviewer for constructive comments that greatly helped improving the

final manuscript.
References

1.     McKay NP, Kaufman DS. An extended Arctic proxy temperature database for the past 2,000
       years. Scientific Data. 2014;1.
2.     Sundqvist HS, Kaufman DS, McKay NP, et al. Arctic Holocene proxy climate database ‒ new
       approaches to assessing geochronological accuracy and encoding climate variables. Climate of
       the Past. 2014;10(4):1605-1631.
3.     PAGES2k Consortium. Data Descriptor: A global multiproxy database for temperature
       reconstructions of the Common Era. Scientific Data. 2017;4:33.
4.     Wanner H, Beer J, Bütikofer J, et al. Mid- to Late Holocene climate change: an overview.
       Quaternary Science Reviews. 2008;27(19-20):1791-1828.
5.     Marcott SA, Shakun JD, Clark PU, Mix AC. A Reconstruction of Regional and Global Temperature
       for the Past 11,300 Years. Science. 2013;339(6124):1198-1201.
6.     Briner JP, McKay NP, Axford Y, et al. Holocene climate change in Arctic Canada and Greenland.
       Quaternary Science Reviews. 2016;147:340-364.
7.     Kaufman DS, Axford YL, Henderson ACG, et al. Holocene climate changes in eastern Beringia
       (NW North America) - A systematic review of multi-proxy evidence. Quaternary Science Reviews.
       2016;147:312-339.
8.     Sejrup HP, Seppa H, McKay NP, et al. North Atlantic-Fennoscandian Holocene climate trends and
       mechanisms. Quaternary Science Reviews. 2016;147:365-378.
9.     Liu Z, Zhu J, Rosenthal Y, et al. The Holocene temperature conundrum. Proc Natl Acad Sci U S A.
       2014;111(34):E3501-E3505.
10.    Meyer H, Opel T, Laepple T, Dereviagin AY, Hoffmann K, Werner M. Long-term winter warming
       trend in the Siberian Arctic during the mid-to late Holocene. Nat Geosci. 2015;8(2):122-125.
11.    Opel T, Laepple T, Meyer H, Dereviagin A, Wetterich S. Northeast Siberian ice wedges confirm
       Arctic winter warming over the past two millennia. The Holocene. 2017;27(11):1789-1796.
12.    Baker JL, Lachniet MS, Chervyatsova O, Asmerom Y, Polyak VJ. Holocene warming in western
       continental Eurasia driven by glacial retreat and greenhouse forcing. Nature Geosci.
       2017;10(6):430-435.
13.    Andreev AA, Klimanov VA, Sulerzhitsky LD. Vegetation and climate history of the Yana River
       lowland, Russia, during the last 6400 yr. Quaternary Science Reviews. 2001;20(1-3):259-266.
14.    Elias SA. Mutual climatic range reconstructions of seasonal temperatures based on Late-
       Pleistocene fossil beetle assemblages in Eastern Beringia. Quaternary Science Reviews.
       2001;20(1):77-91.
15.    Biskaborn BK, Subetto DA, Savelieva LA, et al. Late Quaternary vegetation and lake system
       dynamics in north-eastern Siberia: Implications for seasonal climate variability. Quaternary
       Science Reviews. 2016;147:406-421.
16.    Lacelle D, Vasil'chuk YK. Recent Progress (2007-2012) in Permafrost Isotope Geochemistry.
       Permafrost Periglacial Process. 2013;24(2):138-145.
17.    Christiansen HH, Matsuoka N, Watanabe T. Progress in Understanding the Dynamics, Internal
       Structure and Palaeoenvironmental Potential of Ice Wedges and Sand Wedges. Permafrost
       Periglacial Process. 2016;27(4):365-376.
18.    Lachenbruch AH. Mechanics of Thermal Contraction Cracks and Ice-Wedge Polygons in
       Permafrost. Geological Society of America Special Papers. 1962;70:1-66.
19.    St-Jean M, Lauriol B, Clark ID, Lacelle D, Zdanowicz C. Investigation of Ice-Wedge Infilling
       Processes using Stable Oxygen and Hydrogen Isotopes, Crystallography and Occluded Gases
       (O(2), N(2), Ar). Permafrost Periglacial Process. 2011;22(1):49-64.
20. Boereboom T, Samyn D, Meyer H, Tison JL. Stable isotope and gas properties of two climatically
contrasting (Pleistocene and Holocene) ice wedges from Cape Mamontov Klyk, Laptev Sea,
northern Siberia. The Cryosphere. 2013;7(1):31-46.
21. Michel FA. Isotope investigations of permafrost waters in northern Canada [PhD thesis]:
Department of Earth Sciences, University of Waterloo; 1982.
22. Mackay JR. Some observations on the growth and deformation of epigenetic, syngenetic and
anti-syngenetic ice wedges. Permafrost Periglacial Process. 1990;1(1):15-29.
23. Opel T, Wetterich S, Meyer H, Dereviagin AY, Fuchs MC, Schirrmeister L. Ground-ice stable
isotopes and cryostratigraphy reflect late Quaternary palaeoclimate in the Northeast Siberian
Arctic (Oyogos Yar coast, Dmitry Laptev Strait). Climate of the Past. 2017;13(6):587-611.
24. Froese DG, Westgate JA, Reyes AV, Enkin RJ, Preece SJ. Ancient permafrost and a future, warmer
arctic. Science. 2008;321(5896):1648-1648.
25. Dansgaard W. Stable isotopes in precipitation. Tellus. 1964;16(4):436-468.
26. Mackay JR. Oxygen isotope variations in permafrost, Tuktoyaktuk Peninsula area, Northwest
Territories. Current Research, Part B, Geological Survey of Canada. 1983;Paper 83-1B:67-74.
27. Vaikmäe R. Oxygen isotopes in permafrost and ground ice: A new tool for paleoclimatic
investigations. Paper presented at: 5th Working Meeting Isotopes in Nature, Leipzig, September
1989, Proceedings1989.
28. Meyer H, Dereviagin AY, Siegert C, Hubberten H-W. Paleoclimate studies on Bykovsky Peninsula,
North Siberia-hydrogen and oxygen isotopes in ground ice. Polarforschung. 2002;70:37-51.
29. Meyer H, Dereviagin AY, Siegert C, Schirrmeister L, Hubberten HW. Palaeoclimate reconstruction
on Big Lyakhovsky Island, North Siberia - Hydrogen and oxygen isotopes in ice wedges.
Permafrost Periglacial Process. 2002;13(2):91-105.
30. Meyer H, Schirrmeister L, Yoshikawa K, et al. Permafrost evidence for severe winter cooling
during the Younger Dryas in northern Alaska. Geophys Res Lett. 2010;37:L03501.
31. Michel FA. Isotope Characterisation of Ground Ice in Northern Canada. Permafrost Periglacial
Process. 2011;22(1):3-12.
32. Opel T, Dereviagin AY, Meyer H, Schirrmeister L, Wetterich S. Palaeoclimatic Information from
Stable Water Isotopes of Holocene Ice Wedges on the Dmitrii Laptev Strait, Northeast Siberia,
Russia. Permafrost Periglacial Process. 2011;22(1):84-100.
33. Streletskaya I, Vasiliev A, Meyer H. Isotopic Composition of Syngenetic Ice Wedges and
Palaeoclimatic Reconstruction, Western Taymyr, Russian Arctic. Permafrost Periglacial Process.
2011;22(1):101-106.
34. Yang SZ, Jin HJ. delta O-18 and delta D records of inactive ice wedge in Yitulihe, Northeastern
China and their paleoclimatic implications. Sci China-Earth Sci. 2011;54(1):119-126.
35. Lachniet MS, Lawson DE, Sloat AR. Revised C-14 dating of ice wedge growth in interior Alaska
(USA) to MIS 2 reveals cold paleoclimate and carbon recycling in ancient permafrost terrain.
Quat Res. 2012;78(2):217-225.
36. Vasil'chuk YK. Syngenetic Ice Wedges: Cyclical Formation, Radiocarbon Age and Stable Isotope
Records by Yurij K. Vasil'chuk, Moscow University Press, Moscow, 2006. 404pp. ISBN 5-211-
05212-9. Permafrost Periglacial Process. 2013;24(1):82-93.
37. Vasil'chuk Y, Vasil'chuk A. Spatial distribution of mean winter air temperatures in Siberian
permafrost at 20-18ka BP using oxygen isotope data. Boreas. 2014;43(3):678-687.
38. Streletskaya ID, Vasiliev AA, Oblogov GE, Tokarev IV. Reconstruction of paleoclimate of Russian
Arctic in the Late Pleistocene–Holocene on the basis of isotope study of ice wedges. Kriosfera
Zemli. 2015;19(2):86-94.39. Vasil'chuk YK, Budantseva NA, Christiansen HH, Chizhova JN, Vasil'chuk AC, Zemskova AM.
Oxygen stable isotope variation in Late Holocene ice wedges in Yamal Peninsula and Svalbard.
Geography, Environment, Sustainability. 2015;8(3):36-54.
40. Yang SZ, Cao XY, Jin HJ. Validation of ice-wedge isotopes at Yituli'he, northeastern China as
climate proxy. Boreas. 2015;44(3):502-510.
41. Porter TJ, Froese DG, Feakins SJ, et al. Multiple water isotope proxy reconstruction of extremely
low last glacial temperatures in Eastern Beringia (Western Arctic). Quaternary Science Reviews.
2016;137:113-125.
42. Vasil'chuk Y. Oxygen isotope composition of ground ice (application to paleogeocryological
reconstructions). Vol Moscow: Geological Faculty of Moscow State University; 1992.
43. Nikolayev VI, Mikhalev DV. An Oxygen-Isotope Paleothermometer from Ice in Siberian
Permafrost. Quat Res. 1995;43(1):14-21.
44. Konyakhin MN. Oxygen isotope content of ice wedges. In: Konyakhin MN, Mikhalev V, Solomatin
VI, eds. Oxygen isotope content of ground ices. Moscow: Moscow University Press; 1996:82-129.
45. Konishchev V, Golubev V, Sokratov S. Sublimation from a seasonal snow cover and an isotopic
content of ice wedges in the light of a palaeoclimate reconstruction. Paper presented at: 8th
International Conference on Permafrost; 20-25 July, 2003; Zürich, Switzerland.
46. Global network of isotopes in precipitation. The GNIP database. 2017.
http://www.iaea.org/water.
47. Wetterich S, Tumskoy V, Rudaya N, et al. Ice Complex permafrost of MIS5 age in the Dmitry
Laptev Strait coastal region (East Siberian Arctic). Quaternary Science Reviews. 2016;147:298-
311.
48. Mackay JR, Burn CR. The first 20 years (1978-1979 to 1998-1999) of ice-wedge growth at the
Illisarvik experimental drained lake site, western Arctic coast, Canada. Can J Earth Sci.
2002;39(1):95-111.
49. Christiansen HH. Thermal regime of ice-wedge cracking in adventdalen, Svalbard. Permafrost
Periglacial Process. 2005;16(1):87-98.
50. Fortier D, Allard M. Frost-cracking conditions, Bylot Island, Eastern Canadian Arctic Archipelago.
Permafrost Periglacial Process. 2005;16(2):145-161.
51. Black RF. Ice-Wedge Polygons of Northern Alaska. In: Coates DR, ed. Glacial Geomorphology: A
proceedings volume of the Fifth Annual Geomorphology Symposia Series, held at Binghamton
New York September 26–28, 1974. Dordrecht: Springer Netherlands; 1982:247-275.
52. Mackay JR. The frequency of ice-wedge cracking (1967-1987) at Garry Island, western Arctic
coast. Can J Earth Sci. 1992;29(2):236-248.
53. Mackay JR. Ice-wedge cracks, Garry Island, Northwest Territories. Can J Earth Sci.
1974;11(10):1366-1383.
54. Mackay JR. Air temperature, snow cover, creep of frozen ground, and the time of ice-wedge
cracking, western Arctic coast. Can J Earth Sci. 1993;30(8):1720-1729.
55. Mackay JR. The Closing of Ice-wedge Cracks in Permafrost, Garry Island, Northwest Territories.
Can J Earth Sci. 1975;12(9):1668-1674.
56. Gasanov SS. Sublimation redistribution of material in ice wedges. Problems Cryolithology.
1977;6:224-229.
57. Lauriol B, Duchesne C, Clark ID. Systématique du Remplissage en Eau des Fentes de Gel: Les
Résultats d'une Étude Oxygène-18 et Deutérium. Permafrost Periglacial Process. 1995;6(1):47-
55.
58. Wang F, Li Z, Li H, Zhang M, Wang W, Wang L. Development of depth hoar and its effect on
stable oxygen isotopic content in snow–firn stratigraphy on Ürümqi glacier No. 1, eastern Tien
Shan, China. Annals of Glaciology. 2008;49:135-138.59. Sokratov SA, Golubev VN. Snow isotopic content change by sublimation. J Glaciol.
2009;55(193):823-828.
60. Steen-Larsen HC, Masson-Delmotte V, Hirabayashi M, et al. What controls the isotopic
composition of Greenland surface snow? Climate of the Past. 2014;10(1):377-392.
61. Matsuoka N. Climate and material controls on periglacial soil processes: Toward improving
periglacial climate indicators. Quat Res. 2011;75(2):356-365.
62. O’Neill HB, Christiansen HH. Detection of ice‐wedge cracking in permafrost using miniature
accelerometers. Journal of Geophysical Research: Earth Surface. 2018;123.
63. Kokelj SV, Lantz TC, Wolfe SA, et al. Distribution and activity of ice wedges across the forest-
tundra transition, western Arctic Canada. J Geophys Res-Earth Surf. 2014;119(9):2032-2047.
64. Freitag J, Kipfstuhl S, Laepple T. Core-scale radioscopic imaging: a new method reveals density-
calcium link in Antarctic urn. J Glaciol. 2013;59(218):1009-1014.
65. Meyer H, Schirrmeister L, Andreev A, et al. Lateglacial and Holocene isotopic and environmental
history of northern coastal Alaska - Results from a buried ice-wedge system at Barrow.
Quaternary Science Reviews. 2010;29(27-28):3720-3735.
66. Werner M, Haese B, Xu X, Zhang X, Butzin M, Lohmann G. Glacial-interglacial changes in (H2O)-
O-18, HDO and deuterium excess - results from the fully coupled ECHAM5/MPI-OM Earth
system model. Geoscientific Model Development. 2016;9(2):647-670.
67. Laepple T, Münch T, Casado M, Hörhold M, Landais A, Kipfstuhl S. On the similarity and apparent
cycles of isotopic variations in East Antarctic snow pits. Cryosphere. 2018;12(1):169-187.
68. Münch T, Kipfstuhl S, Freitag J, Meyer H, Laepple T. Regional climate signal vs. local noise: a two-
dimensional view of water isotopes in Antarctic firn at Kohnen Station, Dronning Maud Land.
Climate of the Past. 2016;12(7):1565-1581.
69. Münch T, Kipfstuhl S, Freitag J, Meyer H, Laepple T. Constraints on post-depositional isotope
modifications in East Antarctic firn from analysing temporal changes of isotope profiles.
Cryosphere. 2017;11(5):2175-2188.
70. Wetterich S, Rudaya N, Tumskoy V, et al. Last Glacial Maximum records in permafrost of the East
Siberian Arctic. Quaternary Science Reviews. 2011;30(21-22):3139-3151.
71. Wetterich S, Tumskoy V, Rudaya N, et al. Ice Complex formation in arctic East Siberia during the
MIS3 Interstadial. Quaternary Science Reviews. 2014;84:39-55.
72. Gilichinsky DA, Nolte E, Basilyan AE, et al. Dating of syngenetic ice wedges in permafrost with Cl-
36. Quaternary Science Reviews. 2007;26(11-12):1547-1556.
73. Blinov A, Alfimov V, Beer J, et al. Ratio of Cl-36/Cl in ground ice of east Siberia and its application
for chronometry. Geochem Geophys Geosyst. 2009;10:12.
74. Ewing SA, Paces JB, O'Donnell JA, et al. Uranium isotopes and dissolved organic carbon in loess
permafrost: Modeling the age of ancient ice. Geochim Cosmochim Acta. 2015;152:143-165.
75. Vasil'chuk YK, van der Plicht J, Jungner H, Sonninen E, Vasil'chuk AC. First direct dating of Late
Pleistocene ice-wedges by AMS. Earth Planet Sci Lett. 2000;179(2):237-242.
76. Vasil'chuk YK, Vasil'chuk AC. Validity of radiocarbon ages of Siberian yedoma. GeoResJ.
2017;13:83-95.
77. Fritz M, Opel T, Tanski G, et al. Dissolved organic carbon (DOC) in Arctic ground ice. Cryosphere.
2015;9(2):737-752.
78. Schirrmeister L, Oezen D, Geyh MA. Th-230/U dating of frozen peat, Bol'shoy Lyakhovsky Island
(Northern Siberia). Quat Res. 2002;57(2):253-258.
79. Murton JB, Edwards ME, Lozhkin AV, et al. Preliminary paleoenvironmental analysis of
permafrost deposits at Batagaika megaslump, Yana Uplands, northeast Siberia. Quat Res.
2017;87(2):314-330.You can also read