Climate Risk Management - Contents lists available at ScienceDirect - USQ ePrints
←
→
Page content transcription
If your browser does not render page correctly, please read the page content below
Climate Risk Management 32 (2021) 100281
Contents lists available at ScienceDirect
Climate Risk Management
journal homepage: www.elsevier.com/locate/crm
Temperature and rainfall impacts on robusta coffee
bean characteristics
Jarrod Kath a, *, Vivekananda Mittahalli Byrareddy a, Shahbaz Mushtaq a,
Alessandro Craparo b, Mario Porcel c
a
Centre for Applied Climate Sciences, University of Southern Queensland, Toowoomba, Queensland 4350, Australia
b
International Center for Tropical Agriculture (CIAT), Hanoi, Viet Nam
c
Corporación Colombiana de Investigación Agropecuaria (AGROSAVIA), C.I. La Libertad, Vía Puerto López Km 17, Meta, Colombia
A R T I C L E I N F O A B S T R A C T
Keywords: Robusta coffee is the primary source of income for millions of smallholder farmers throughout the
Drought world’s tropics. The price smallholder farmers can get for their coffee is strongly influenced by
Extreme rainfall bean characteristics (i.e. beans are of a sufficient size and have minimal defects). Climate is a key
Harvest
determinant of successful coffee production, but scant research has been undertaken to test and
Heat
Insect pests
quantify climate impacts on robusta coffee bean physical characteristics. Here we investigate how
climate relates to the risk of poor coffee bean characteristics in one of South East Asia’s key coffee
producing areas, the central highlands of Vietnam. We use 5 years (2012–2016) of coffee bean
characteristic data from 60 farms. Hierarchical modelling was used to investigate how rainfall
and temperature related to two indicators of coffee bean characteristics (1) the probability of
below average coffee bean size and (2) the probability of above average coffee bean defects. Low
rainfall (80% probability) of below average coffee bean size. Conversely, high rainfall (>750 mm) and
high mean minimum temperature (>22 ◦ C) during harvest (October-December) increased the risk
(>75% probability) of above average coffee bean defects. Various coffee bean characteristic
subcomponents (e.g. insect damage and mouldy beans) and different bean sizes were also
examined and were affected by a range of rainfall and temperature predictors across the flow
ering, growing and harvest seasons. With this information targeted risk-management strategies (e.
g. targeted irrigation during hot and dry growing seasons, adjusting harvest timing and
employing drying techniques during wet and cold harvest periods) could be developed to mini
mise the effect of climate conditions that increase the risk of coffee bean defects. Successfully
managing the impacts identified here, could decrease coffee bean defects and in turn increase the
incomes of smallholder coffee farmers.
1. Introduction
Robusta coffee (Coffea canephora, Pierre ex A. Froehner) supplies up to 40% of the world’s coffee and is a critical export for many
tropical developing countries (ICO, 2019). With rainfall and temperatures projected to change in many important coffee producing
* Corresponding author.
E-mail address: jarrod.kath@usq.edu.au (J. Kath).
https://doi.org/10.1016/j.crm.2021.100281
Received 28 October 2020; Received in revised form 17 January 2021; Accepted 24 January 2021
Available online 29 January 2021
2212-0963/© 2021 The Author(s). Published by Elsevier B.V. This is an open access article under the CC BY-NC-ND license
(http://creativecommons.org/licenses/by-nc-nd/4.0/).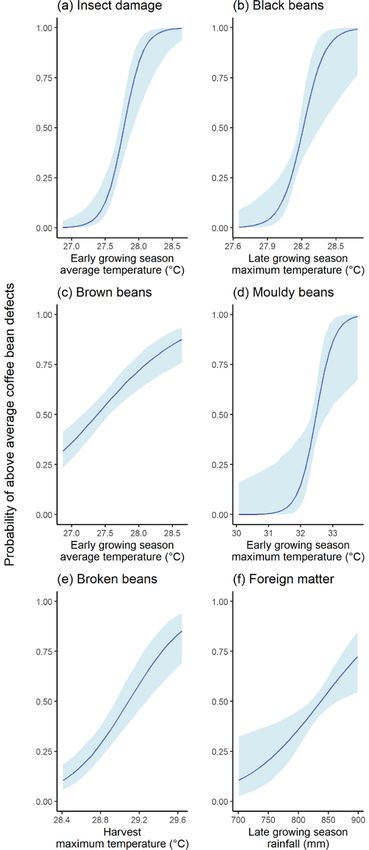
J. Kath et al.                                                                                              Climate Risk Management 32 (2021) 100281

areas (e.g. South East Asia, Chotamonsak et al., 2011; Dai, 2013) a key threat to the future sustainability of coffee production is climate
variability and change (Moat et al., 2017; Kath et al., 2020). There has been some research on how farmers can maintain and increase
robusta coffee yields under different climatic conditions (e.g. by managing biodiversity and optimizing inputs, DaMatta and Ramalho,
2006; Byrareddy et al., 2020), but little on the climatic drivers of robusta coffee bean characteristics. This is a surprising knowledge gap
given that price reductions caused by coffee bean defects and the importance of robusta for millions of the world’s farmers.
    The chemical composition of green coffee beans is not only determined by species and variety, but also influenced by a number of
different factors including; the terroir, harvesting methods (handpicked or mechanical), seed processing (wet, dry, or semi dry) and
storage (Franca et al., 2005; Casas et al., 2017). Ultimately, this chemical composition is what determines the price the coffee will
attain. In order to objectively set a price, the coffee is commonly categorized or graded using three approaches: i) by types and defects,
ii) by bean size (sieve) and iii) beverage quality (Brighenti and Cirillo, 2018). Understanding the factors that affect coffee bean
characteristics is a key knowledge requirement for coffee farmers as it ultimately determines the price farmers can get for their coffee
crop (Boscollo. L. pers comm.). More importantly, the ability to tease apart the determinants of intrinsic coffee defects (quantification
and importance of meteorological variables) underpins the development of management strategies that could mitigate the financial
losses incurred by farmers.
    Research on arabica coffee beans has emphasised the importance of rainfall and temperature (Vaast et al., 2006; Santos et al., 2015;
Bote and Vos, 2017). Higher temperatures accelerate berry ripening and in turn increase bean defects (Vaast et al., 2006; Santos et al.,
2015). The amount and timing of rainfall can also affect coffee beans – too little rainfall during the growing season stresses plants,
causing branch death and defoliation, reducing resources for fruiting and leading to small and damaged coffee beans (DaMatta et al.
2018). High temperatures can accelerate berry development and ripening (Craparo et al., 2015), which reduces bean filling and in turn
causes smaller bean sizes (DaMatta et al., 2018).
    Unfavourable rainfall and temperature can also promote the conditions that damage and discolour coffee beans. Too much rainfall
can dislodge flowers and fruits, or if heavy rain occurs during harvest, increased moisture favours conditions for mould growth, disease
and excessive fermentation, all of which may increase coffee bean defects (Taniwaki et al., 2014). Alongside increased moisture from
high rainfall, higher temperatures can also promote mould growth, as well as damaging insects, such as the coffee berry borer
(Hypothenemus hampei) and mealybugs – the reproductive rates of which are closely linked to temperature (Jaramillo et al., 2009;
Jayakumar and Rajavel, 2019). Despite the potentially important role that climate has in driving factors known to damage coffee beans
there has been little research on the impacts of rainfall and temperature on robusta beans throughout the production cycle (i.e. from
flowering through to harvest).

                 Fig. 1. Vietnam with the study province (Lam Dong) in black in the coffee producing areas of the central highlands.

                                                                         2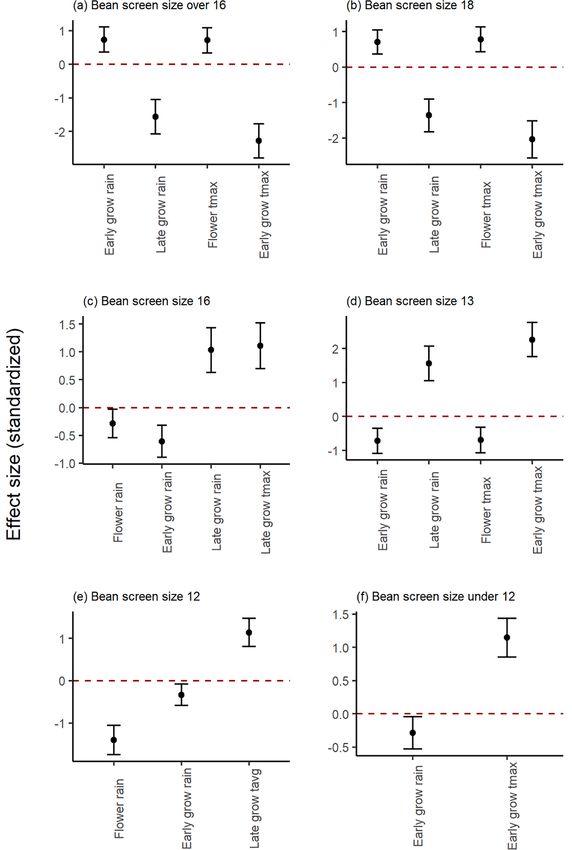
J. Kath et al. Climate Risk Management 32 (2021) 100281
It is not well tested whether robusta coffee bean characteristics respond to temperature and rainfall variation in a similar way as
arabica beans. Arabica yields are more sensitive to temperature increases than robusta (Craparo et al., 2015; Martins et al., 2018; Kath
et al., 2020), but it is unknown whether this is also the case for coffee bean size and defects. Previous studies in the key robusta growing
areas of South East Asia have focused on robusta coffee yields sensitivity to climate variability (Kath et al., 2020; Byrareddy et al.,
2020). Kath et al. (2020) showed strong relationships between temperatures and yields. In the central highlands of Vietnam, Byrareddy
et al. (2020) has also examined the impact of irrigation practices and drought on coffee yields. However, these studies did not look at
the relationship between climate and robusta coffee bean characteristics, which along with yield, are key determinants of how much
farmers get payed for their coffee.
To address this gap, here we investigate the impact of rainfall and temperature on two economically important indicators of coffee
beans, (1) the probability of small coffee bean size and (2) the probability of high coffee bean defects, both of which are metrics used to
determine the price a farmer can get for their coffee crop (K’ Doan ECOM, pers. comm, 5 February 2020). We hypothesise that climatic
conditions will influence the likelihood of undesirable robusta coffee bean characteristics occurring (hereafter referring to bean size
and bean defects) in two ways. First, low rainfall during the growing season will increase plant stress and in so doing, reduce fruit
development and ultimately coffee bean size. Second, high temperatures and rainfall during the growing season and harvest will
promote conditions that increase the risk of bean defects (e.g. mouldy and insect damaged beans).
2. Methods
2.1. Study area
The study was in the central highlands of Vietnam, one of the world’s most important robusta coffee producing areas. To investigate
the impact of climate on robusta coffee beans we used data from Vietnamese farmers. Vietnam is the largest exporter of robusta coffee
in the world, accounting for 40% of the world’s supply (Marsh, 2007). Based on 2018/19 market prices (USD1.62/kg), the estimated
value of robusta coffee exports for Vietnam is ~USD 2.8 billion per annum (USDA, 2019).
The main robusta coffee producing areas are located in the Central Highlands of Southern Vietnam, encompassing the provinces
Lam Dong, Dak Lak, Dak Nong, Gia Lai, and Kon Tum. These areas account for > 90% of Vietnam’s robusta coffee production (D’haeze
et al., 2005). Within the Central Highlands, coffee bean data was collected from 30 farmers from Bao Loc and Bao Lam districts (total
number of farms was 60) in Lam Dong province (Fig. 1) over 5 seasons from 2012 to 16 (total n = 300). This is a different dataset,
covering a smaller spatial and temporal scale, than that examined by Kath et al. (2020).
Over the study period from 2012 to 2016 mean annual minimum and maximum temperatures in the region were 21.8 ◦ C and
29.9 ◦ C respectively, while mean total annual rainfall was 2128 mm (NCHMF, 2018). The coffee growing season in Lam Dong runs
from January to September. Flowering runs from approximately January to February. The early growing season (including cherry
development) from March to June, while the late growing season (including cherry maturation) from July to September. Harvest is
from late October to December.
Rainfall in the Central Highlands is usually concentrated around the summer monsoon (May-October). However, the rainy season
onset data (RSOD) is primarily driven by El Niño-Southern Oscillation (ENSO), which is responsible for substantial variation between
years and regions (Pham-Thanh et al., 2020). The RSOD generally starts later in El Niño years and earlier during a La Niña (Pham-
Thanh et al., 2020). Likewise, total precipitation and precipitation intensity (number of days with heavy rain) has increased over the
years and will continue to do so in future (Schmidt-Thome et al., 2015; Pham-Thanh et al., 2020). In accordance with other regions of
SE-Asia, temperatures have increased over Vietnam and are projected to increase further under future climate scenarios (Schmidt-
Thome et al., 2015).
2.2. Robusta coffee cultivation practices
Coffee in the study area is cultivated under open sun, with some inter-cropping of fruit and timber trees. Overall, farms ranged from
0.2 to 6.0 ha in size and were located between 694 and 905 masl. In the study region, bean yield varied between 2.8 and 6.8 ton− 1 ha,
and average yield recorded at 3.8 ton− 1 ha. Plants are irrigated during the dry season (January – April) to synchronize flowering and
fruit setting, and to protect the crop from droughts and boost production (Byrareddy et al., 2020). The major fertilizer types applied are
blended NPK, urea, superphosphate and potassium chloride) in addition to compost and lime and is applied around four times in year
(Byrareddy et al., 2019). The major pest and disease affecting the crop are respectively mealybugs (Hemiptera: Pseudococcidae) and
anthracnose (Colletotrichum spp.). Farmers rely on chemical control as the main pest and disease management strategy. The harvest is
carried out manually by hand picking in 2–3 rounds, farmers collect the coffee cherries and dry them under open sun prior to pro
cessing. The surveyed farmers reported, drying and hulling of cherries takes about 8 to 10 sunshine days, and if it rains during this
period they protect it by using plastic sheets.
2.3. Coffee bean and climate data
Coffee bean data was collected after the completion of harvest and processing of coffee cherries into beans during January in each
year. Samples were collected directly from coffee farms. At each farm a composite sample was drawn, using a coffee bean sampler to
draw a random sample of beans. Each sample was mixed thoroughly to make a composite representative sample weighing about 1500
g, which was then used for analysis of bean characteristics.
3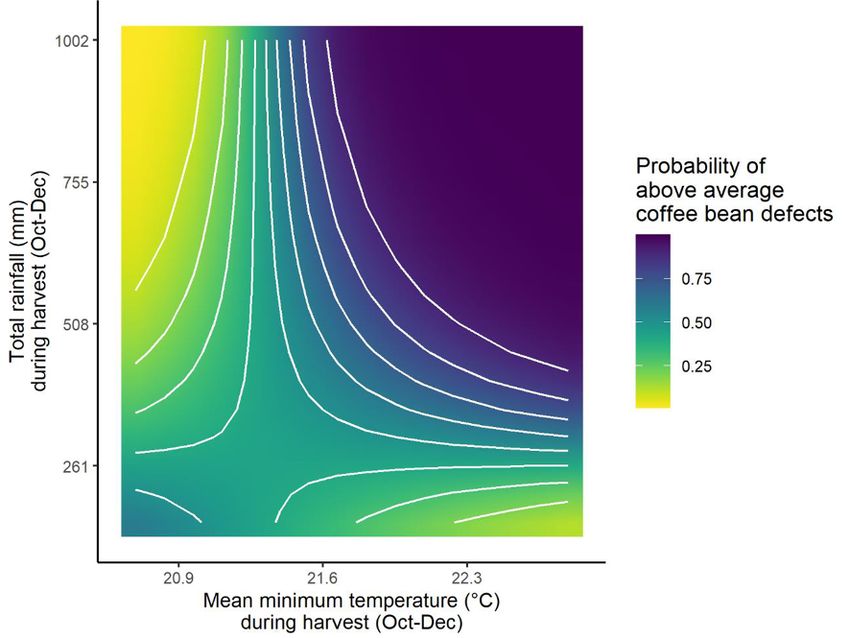
J. Kath et al. Climate Risk Management 32 (2021) 100281
Two indicators of coffee bean characteristics were calculated (1) coffee bean size and (2) total coffee bean defects. These two
indicators are used to price coffee beans, with good scores of coffee bean size and low defects leading to higher prices (up to 25% higher
relative to gross returns), while poor scores can lead to losses of ~ 10%. When these two coffee bean metrics are poor (i.e. when bean
defects are high and bean size small) farmers can lose up to a third of their gross returns (K’ Doan ECOM, pers. comm, 5 February
2020).
Coffee bean size was assessed based on ISO 4150 (Size analysis — Manual and machine sieving). This involved transferring a 100 g
test portion into a series of sieves of descending screen sizes (16 (largest) to 12 (smallest)). Coffee beans were then agitated on sieves by
hand for 3 min so that beans covered the whole perforated surface. After this the sieves were tapped once on a firm surface so that any
beans loosely retained in the holes fell into the next sieve size. The amount of coffee retained on each sieve and in the receiver was then
weighed and transformed to a percentage (ISO, 2011). Bean defects were calculated as in ISO 10,470 (Green coffee — Defect reference
chart). Sample size for defect counts was based on a representative sample of 300 g. The percentage of total defect beans, which
included those with foreign matter (stones, sticks and husk), black, broken and brown beans, mouldy beans and insect damaged beans
(after ISO, 2004), was calculated for each sample. From the dataset collected in this analysis, bean size and bean defects measurements
were converted to above and below average (more than 11% total defects and less than 75% with a bean size above 16) (Table 1) for
analysis so results could be presented as a probability that is directly interpretable by farmers and industry for risk management. All
measurements were made at ECOM Agroindustrials Coffee Laboratory, Ecom Bao Loc factory, Bao Loc (Dist), Lam Dong province.
Descriptive statistics of the coffee bean data used are in Table 1.
Daily precipitation, mean, minimum and maximum temperature data was obtained from weather stations within 3 km of farms, i.e.
Boa Lac (Latitude = 11.55, Longitude = 107.81) and Boa Lam (Longitude = 107.91, Latitude = 11.55) stations from the Vietnamese
National Centre for Hydro-Meteorological Forecasting (NCHMF, 2018). These stations collect daily data on rainfall and temperature.
Climate variables for different coffee phenological stages; flowering (January-February), the early growing season (March-June) the
late growing season (July-September) and harvest (October-December) (adapted from Kath et al., 2020) were calculated for total
rainfall, average temperature, minimum temperature and maximum temperature. Across the study period during the growing and
harvest season mean total rainfall was 1620 and 508 mm respectively. Mean minimum and maximum growing season temperatures
were respectively 21.9 ◦ C and 30.2 ◦ C, while during harvest they were 21.6 ◦ C and 29.0 ◦ C.
2.4. Analyses
The probability of certain coffee bean characteristics occurring was quantified using hierarchical models (also referred to as mixed-
effect or multi-level models), which included climate variables as fixed effects, as well as random effects to account for potential spatial
and temporal correlations (e.g. from annual repeat measurements at a particular site). Traditional non-hierarchal linear regression
models do not account for repeat measures or non-independence in observations. For example, bean characteristic observations at a
site, or within particular years, may be more similar (e.g. higher on average if soils and management techniques are better) relative to
other sites or during different years. To account for this, hierarchical modelling allows for the intercept (or baseline) in the model to
vary amongst the same sites and years. Hierarchical statistical models efficiently account for the influence of these grouping factors (e.
g. site and year) and eliminate many problems associated with spatial and temporal autocorrelation, pseudo-replication and also
reduce the risk of Type I and II errors (Bolker et al., 2009; Harrison et al., 2018). Importantly, in the context of this study because
hierarchical models allow for the intercept to vary, this enabled us to quantify the effect of rainfall and temperature on coffee bean
characteristics, while accounting for differences between sites (e.g. management practices) and the non-independence of coffee bean
data at each site.
Generalized linear mixed models (GLMMs) are a type of hierarchical modelling that extend linear mixed models (which include
random effects) to non-normal data types such as counts or binary data, which widely occur in environmental studies (Bolker et al.,
2009). GLMMs were used to model the probability of coffee bean characteristics for the indicators assessed as a function of climate
parameters. A separate model for each coffee bean characteristic sub-component (i.e. each defect and size class) was fit using a logit
link and a binomial distribution. All models were fit in R version 3.6.0 (R Core Team, 2019) using the lme4 package (Bates et al., 2015).
Climate predictor variables (i.e. inputs) modelled as fixed effects using GLMMs were mean minimum temperature, mean average
temperature, mean maximum temperature and total rainfall during the flowering, early growing, late growing and harvest seasons.
Models included two-way interactions between rainfall and each temperature variable within each season. Predictors were stand
ardised [mean(x)/1.sd(x)] so effect sizes could be compared. Random effects were site and the year of each survey. Predictors which
were correlated at Pearson r ≥ 0.7, the level at which collinearity can bias regressions, were not combined in the same model (Dormann
et al., 2013) (see Supplementary S1 for correlations between all climate predictors). Model performance was assessed by calculating
receiver operator characteristic (ROC) curve values using the Hmisc package (Harrell and Dupont, 2020) in R (R Core Team, 2019).
ROC values over 0.9 indicate an excellent model, values between 0.8 and 0.9 a good model, values between 0.7 and 0.8 an acceptable
Table 1
Descriptive statistics of the two coffee bean deficiency measures (bean size and total defects) used in the study.
Coffee bean response Min Mean Max SD Number above average samples Number below average samples Total N
Bean size (%) 47.9 75.6 93.9 8.7 149 151 300
Total defects (%) 6.1 11.2 19.2 2.2 139 161 300
SD = standard deviation.
4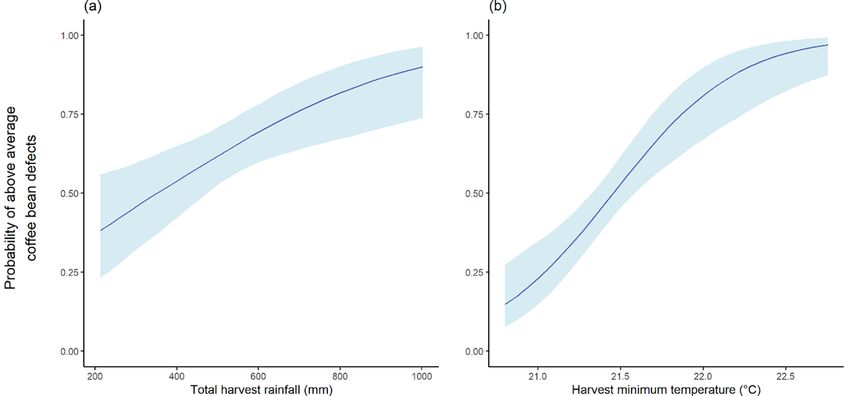
J. Kath et al. Climate Risk Management 32 (2021) 100281
model, values between 0.6 and 0.7 a poor model and values of 0.5 indicate no ability to predict the outcome.
The most parsimonious set of climate predictors for each of the coffee bean characteristic indicators was selected using automated
model selection through subsetting the maximum model using the MuMIn package (Barton et al., 2020) in R (R Core Team, 2019).
Model selection was performed using Akaike’s Information Criterion (AIC). Models with the smallest AIC value are those that most
parsimoniously explain the variation in coffee bean characteristics across the full range of models (i.e. all possible combinations of
climate predictors, except for those with a Pearson r correlation ≥ 0.7, which were not combined in the same model).
3. Results
3.1. Robusta coffee bean defect model selection & performance
Rainfall and temperature predictors were present in all of the best models (i.e. the most parsimonious model) for total coffee bean
defects and coffee beans with a screen size over 16, as well as for each of the subcomponents of these indicators that were modelled
(Table 2). All coffee bean defect models, aside for the one for insect damage, had significant interactions between rainfall and tem
perature in the best models (Table 2). None of the models for coffee bean size included interaction terms. Coefficients for all terms in
the best models are shown for coffee bean defects and coffee bean size indicators in Figs. 2 and 3 respectively.
Models for coffee bean defect and bean size generally performed well with ROC values over 0.7 (Table 2). The model for foreign
matter performed the poorest, with an ROC value of 0.68. The model for insect damage performed the best with an ROC value of 0.98.
The models for the main responses, total defects and bean size over a screen size of 16, both performed well with ROC values of 0.82
and 0.89 respectively (Table 2).
3.2. Climate drivers of coffee bean defects and size
3.2.1. High rainfall during harvest increases the risk of coffee bean defects
Increased rainfall during harvest was associated with an above average probability of total coffee bean defects (Fig. 2a). When
rainfall during harvest was > 750 mm there was an elevated risk (>75% probability) of above average coffee bean defects (Fig. 4a).
The likelihood of several subcomponents of coffee bean defects (i.e. insect damage, mouldy beans and foreign matter) also increased
with rainfall during the late growing season (Fig. 2) Rainfall during harvest was associated with a slight reduction in the likelihood of
above average foreign matter (Fig. 2g).
Higher temperatures were generally associated with an increased likelihood of defects, although there was seasonal variation in
this relationship depending on the subcomponent of coffee bean defect modelled (Figs. 2, 4 and 5). The likelihood of total defects
increased as minimum temperatures increased during harvest (Fig. 4b). Early in the growing season, high average temperatures were
related to above average insect damage and brown beans (Fig. 2bd and 5ac). High maximum temperatures were also associated with
increased risk of mouldy and black beans in the early and late growing season respectively (Fig. 2ce and 5bd). High maximum
temperatures during harvest were also linked with an increased likelihood of mouldy and broken beans (Fig. 2ef and 5e). Conversely,
low maximum temperatures during the late growing season and harvest were respectively associated with an increased risk of broken
and black beans (Fig. 2cf).
Total defects, as well as several of its subcomponents (i.e. black, brown, mouldy and broken beans, as well as foreign matter) were
significantly related to interactions between rainfall and temperature (Table 2). Total defects showed the strongest response to rainfall
and temperature interactions. Co-occurring high harvest rainfall (e.g. > ~ 750 mm) and mean minimum temperatures (> ~ 22 ◦ C)
raised the probability of above average coffee bean defects to over 80% (Fig. 6). Conversely, when rainfall and/or mean minimum
Table 2
Climate predictors selected in the most parsimonious regression model (see Section 2.4 for model selection methods) for each of the indicators of
coffee bean defects and size modelled. Asterisks represent levels of significance for each parameter in the model (see below table).
Response Climate predictors in best model ROC AUC^
Coffee bean defect indicators
Total defects Harvest tmin*** + Harvest rainfall** + Harvest rain × Harvest tmin*** 0.82
Insect Early grow tavg*** + Early grow rain + Late grow rain 0.98
Black Harvest rain + Late grow rain + Late grow tmax** + Harvest tmax*** + Harvest rain × Harvest tmax** 0.88
Brown Late grow rain* + Early grow tavg*** + Late grow tavg + Late grow rain × Late grow tavg*** 0.79
Mouldy Early grow rain* + Late grow rain*** + Early grow tmax*** + Harvest tmax* + Early grow rain × early grow tmax* 0.77
Broken Late grow rain* + Late grow tmax*** + Harvest tmax*** + Late grow rain × late grow tmax 0.75
Foreign matter Late grow rain** + Early grow rain + Harvest rain*** + Late grow tavg + Late grow rain × late grow tavg*** 0.68
Coffee bean size indicators
Screen size over 16 Flower tmax** + Early grow tmax*** + Early grow rain*** + Late grow rain*** 0.89
Screen size 18 Flower tmax*** + Early grow tmax*** + Early grow rain*** + Late grow rain*** 0.87
Screen size 16 Flower rain* + Late grow tmax*** + Early grow rain*** + Late grow rain*** 0.78
Screen size 13 Flower tmax*** + Early grow tmax*** + Early grow rain*** + Late grow rain*** 0.86
Screen size 12 Flower rain*** + Late grow tavg*** + Early grow rain** 0.83
Screen size under 12 Early grow tmax*** + Early grow rain* 0.80
p*
J. Kath et al.                                                                                                   Climate Risk Management 32 (2021) 100281

Fig. 2. Parameter estimates (estimates of standardised effect size) for rainfall and temperature predictors on the probability of key indicators of
coffee bean defects. Error bars are 95% confidence intervals. Positive effect sizes indicate that the parameter increases the risk of that defect, while a
negative effect the opposite. Note different y-axis ranges.

                                                                            6
J. Kath et al.                                                                                                Climate Risk Management 32 (2021) 100281

Fig. 3. Parameter estimates (estimates of standardised effect size) for rainfall and temperature predictors on the probability of particular coffee
bean size classes not occurring. Error bars are 95% confidence intervals. Positive effect sizes indicate that increases in that parameter decrease the
probability of that bean size class occurring, while negative effect sizes the opposite. Note different y-axis ranges.

                                                                          7
J. Kath et al. Climate Risk Management 32 (2021) 100281 Fig. 4. Probability of above average coffee bean total defects in response to (a) total harvest rainfall and (b) harvest minimum temperatures. Results are based on responses from the best model for total defects (see Table 2), Shaded areas are 95% confidence intervals. temperatures decreased the likelihood of above average total coffee bean defects was lower (
J. Kath et al. Climate Risk Management 32 (2021) 100281
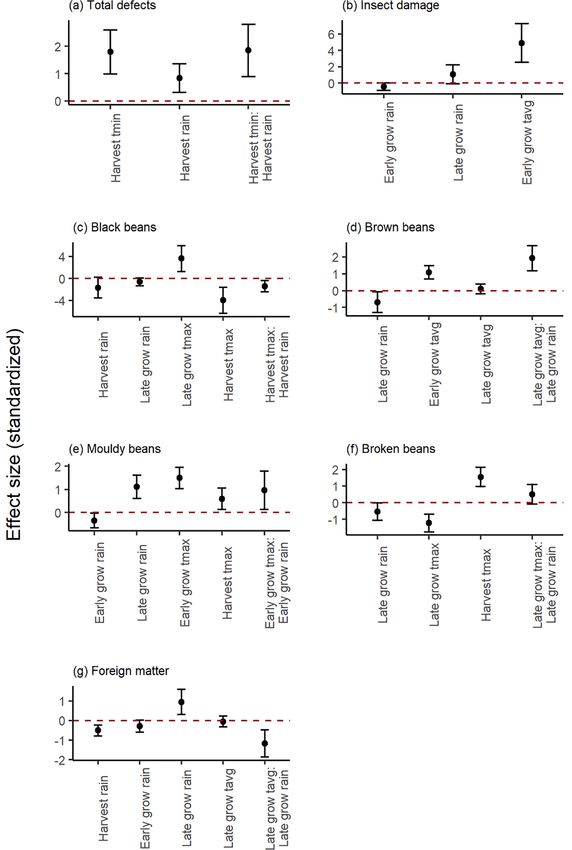
Fig. 5. Probability of above average coffee bean defects related to the different components of coffee bean defects in response to rainfall and
temperature predictors with the strongest effect during different seasons. Results are based on responses from the best model from each component
(see Table 2), while all other predictors are held at their mean. Shaded areas are 95% confidence intervals.
2006). Across South East Asia, Kath et al. (2020) showed that while high temperatures coupled with dry conditions were the most
favourable for robusta productivity during flowering, during growing the opposite was the case, with lower temperatures and high
rainfall during the growing season being most favourable. Likewise, the results of this study suggest robusta coffee bean size is
differentially influenced by climatic factors with responses depending on whether it is the flowering or growing season.
Responses to climate were largely consistent across size classes, with large beans response being the inverse of small beans.
Although, it should be noted that the model for very small beans (bean screen size under 12) only contained variables from the early
growing season, whereas all other size classes contained variables from flowering, early growing and late growing seasons. This could
suggest that climatic conditions during the early growing season as the cherry begins to form, is a key period of vulnerability. It could
be that heat stress during this period increases the risk of stunting coffee beans, causing them to remain very small (under a screen size
9J. Kath et al. Climate Risk Management 32 (2021) 100281
Fig. 6. Probability of above average coffee bean defects in response to interactions between total harvest rainfall and minimum temperatures during
harvest. Results are based on responses from the best model for total defects (see Table 2).
of 12). This however requires further research to verify.
4.2. High rainfall during harvest increases the risk of coffee bean defects
Higher rainfall during harvest was associated with an increased risk of above average total defects. High rainfall during the late
growing season was also associated with a higher risk of mouldy beans. Mould/fungal growth is stimulated under humid tropical
conditions, reinforcing the observations found here that high rainfall late in the growing season increases the risk of coffee bean
defects, and specifically mouldy beans (Poltronieri and Rossi, 2016). Further along the production chain once the cherries have been
harvested, increased precipitation or humidity, night dew and rewetting of partially dried cherries during coffee cherry drying (post
harvest operations) has been identified as one of the crucial factors during which mould formation can take place (Coffee Guide 2014).
The exception to the impact of high rainfall was for foreign matter, where increased rainfall in harvest decreased risk. This may be
because rain during the harvest period removes dust and debris.
Increased temperature during the growing season and harvest was associated with an increased likelihood of total defects, as well
as for many of its subcomponents (e.g. insect damage, black beans, brown beans and mouldy beans). Insect damage consists typically of
beans displaying one or several entry holes and galleries that reduce bean weight and cup quality. This defect is generally attributed to
the coffee berry borer, Hypothenemus hampei (Ribeyre and Avelino, 2012), although the coffee bean weevil (Araecerus fasciculatus), that
may cause a similar damage, has been reported recently from field-collected robusta berries in the study region (Alba-Alejandre et al.,
2018). Being reasonable to assume that H. hampei was behind most of the damage recorded, our results are consistent with previous
research on the species’ thermal biology. We detected a pronounced increase in the probability of obtaining insect damage at 27.5 ◦ C in
early season average temperature, coinciding with the mean temperature at which the pest is predicted to display its maximum
reproductive potential (Jaramillo et al., 2009). Optimum temperatures throughout the growing season contribute to more pest gen
erations and higher population pressure, increasing the likelihood of insect damage at harvest (Jaramillo et al., 2011).
Insect pests are also associated with other bean defects. Mealybugs, regarded as a key pest in the study region, may increase the
presence of black beans due to their sap feeding activity (Ribeyre and Avelino, 2012). High temperatures promote the presence of
mealybugs (Jayakumar and Rajavel, 2019) and might explain the observed relationship between high late season temperatures and the
presence of black beans. Brown beans that may evolve into black beans can be caused by anthracnose. We found no previous infor
mation on the relationship between anthracnose incidence in robusta coffee and temperature. However, in laboratory conditions
Colletotrichum gloeosporioides isolates obtained from coffee berries in Vietnam showed the highest mycelial growth at 30 ◦ C, the highest
temperature evaluated (Nguyen et al., 2009).
The risk of mouldy beans also increased as temperatures rose. This is not surprising as high temperatures promote microorganism
activity, which in turn could promote this coffee bean defect (Poltronieri and Rossi, 2016). Increased temperatures therefore appear to
be an important climate risk that needs to be understood and managed in order to reduce particular causes of coffee bean defects.
The impacts of rainfall and temperature interacted. The impact of rainfall on total defects varied such that at high minimum
temperatures (>22 ◦ C), increasing rainfall increased the risk of defects, while at lower minimum temperatures (~20 ◦ C) increasing
rainfall reduced the risk of defects. The combination of high rainfall and high overnight temperatures are likely favourable for mould
growth (FAO, 2006). These complex interactions highlight the need to take into account multiple climate risks simultaneously when
assessing climate risk impacts on coffee beans.
Additional to interactions between rainfall and temperature, there were also differential responses across seasons. For example,
while the most parsimonious model for explaining total defects contained harvest rainfall and temperature, the best models for specific
defects (e.g. insect damage, mouldy and black beans) comprised climate variables from early growing, late growing and harvest. As
such, while any particular defect might be driven by a particular season(s) climate, the overall combination of defects (that is when the
10J. Kath et al. Climate Risk Management 32 (2021) 100281
Fig. 7. Probability of below average coffee bean size (screen size over 16) in relation to each climate predictor in the best model (see Table 2), while
all other predictors are held at their mean. Shaded areas are 95% confidence intervals.
combination of each defect leads to high total defects) are best explained by climatic conditions during harvest.
4.3. Implications – rainfall and temperature impacts on robusta coffee bean characteristics
The coffee industry in Vietnam, the largest producer of robusta coffee in the world, is dominated by smallholders with 85% of all
farms being under 1 ha and only 1% being more than 5 ha (D’haeze et al. 2005). Smallholder farmers also produce large amounts of
robusta coffee in Indonesia, Brazil, Uganda and India (ICO, 2019). Like Vietnam, these countries are subject to high variability in
rainfall, with droughts and floods common and anticipated to intensify under climate change (Schmidt-Thome et al., 2015; Pham-
Thanh et al., 2020). Climatic conditions that reduce coffee bean profitability (e.g. because of increased defects) has widespread and
high cumulative impacts. This study suggests that the climate poses a key risk to the quality (i.e. beans of sufficient size and limited
defects) of robusta coffee that smallholder farmers can produce. Understanding and managing the impacts of adverse climatic con
ditions on robusta coffee beans should therefore be seen as imperative part of ensuring the future income and sustainability of small
holder robust farmers throughout the world’s tropics.
This study identified seasonally important rainfall and temperature conditions that could inform management actions to mitigate
and reduce the impact of climate on robusta coffee farmers. During flowering high temperatures increased the risk of small beans,
while in the growing season low rainfall and cool temperatures increased the risk of small beans. In the harvest season high rainfall and
11J. Kath et al. Climate Risk Management 32 (2021) 100281
(caption on next page)
12J. Kath et al. Climate Risk Management 32 (2021) 100281
Fig. 8. Probability below average coffee bean size for each particular size class in relation to each climate predictors with the strongest effect in the
best model (see Table 2), while all other predictors are held at their mean. Shaded areas are 95% confidence intervals.
minimum temperatures increased the risk of coffee bean defects. Specific and seasonally adapted management actions (e.g. irrigation,
pest management and the use of shade trees to manage temperatures) (Vaast et al., 2006) are likely needed to target the drivers of
coffee bean defects and small bean size throughout the different stages of the coffee production cycle (i.e. from flowering through
harvest). Successfully mitigating these climate impacts within each season should in turn reduce the risk of defects and small coffee
beans and so increase the price farmers are able to get for their coffee beans - especially during adverse climatic conditions.
The development of seasonally targeted management aimed at reducing the risk of defects and small beans opens the way for
management that can be linked to forecasts. This would allow climate risks to be proactively adapted year to year based on forecasted
climatic conditions. In several South Asian countries that grow robusta, climate forecasts can provide accurate assessments about
drought and excessive rainfall risk 1–4 months in advance (Phelps et al., 2004). With the forewarning of such forecasts, for example an
increased risk of wet harvest conditions then farmers could alter picking times and/or sourcing mechanical drying equipment or
shelter.
Similarly, with forewarning of upcoming drought conditions during the growing season, farmers could also increase irrigation to
offset the negative effects of low rainfall on bean size. However, we acknowledge that trends in future precipitation are highly un
certain and increased use of irrigation may have limited benefit and lead to the unsustainable use of water resources (Byrareddy et al.,
2020). Whether increases in precipitation, or strategic irrigation would be sufficient to offset the increases in risk from rising mean
maximum temperatures is an important avenue for future research.
4.4. Limitations and future directions
Further research is needed to separate the impact of in-field versus post-harvest drivers of poor coffee bean characteristics, which
could help quantify the importance of post-harvest management strategies and how they could be used to mitigate climate induced
coffee bean deficiencies. The current study focused on physical attributes (bean size and defects), which are only two components of
coffee quality. In addition to a bean’s physical attributes, coffee quality is also influenced by biochemical bean content and organo
leptic properties. Understanding the links between these different components of coffee bean quality and how they respond to climate
variability is an important avenue for future research.
Our study was carried out using data at the farm level and so was restricted to understanding the key climatic drivers of coffee bean
defects and size at this scale. We therefore acknowledge that the physiological mechanisms behind the relationship between coffee
bean characteristic and climate needs further research, ideally at the plant scale and in experimental settings. For example, under
standing the physiological mechanisms behind the causes of small bean sizes and the role of differential rainfall and temperature
impacts depending on season could have important implications for minimizing not only small beans, but also help to better un
derstand the drivers of productivity more generally.
Our study was restricted to Lam Dong province in the central highlands of Vietnam. Indonesia, Brazil, Uganda and India all produce
large amounts of robusta coffee and all are frequently impacted by drought that are likely to intensify under climate change (Dai,
2013). In these countries alone, 2018/19 Robusta production exceeded three billion US dollars (Uganda, 388 Million, India 360
Million, Indonesia 942 Million and Brazil 1.6 Billion, USDA 2019) and so any impact on coffee beans that reduces this value is likely to
be collectively large (e.g. in the 10′ s of millions of dollars). Indeed, recent news article report how heavy rainfall increased coffee bean
deficiencies with subsequent impacts on coffee profitability and supply (Binh Minh, 2017; Ionova, 2017). We are not aware of any
research that has quantified the climatic conditions and associated costs of unfavourable rainfall and temperature conditions on coffee
bean characteristics in these countries (but see Martins et al., 2018). The high economic value of robusta to these countries emphasizes
the importance of the results found here and highlights the need for future research to understand and manage the financial impacts of
climate on coffee bean characteristics and coffee production sustainability more generally.
5. Conclusion
Robusta coffee exports underpin the economies and rural communities of countries throughout the tropics. The price farmers can
get for their coffee is largely affected by coffee bean characteristics – however there has been limited research on how climate impacts
robusta coffee bean characteristics. Our results suggest that there are important seasonal differences in how climate affects coffee bean
size and coffee bean defects. Low rainfall during the late growing season was associated with smaller beans, while low rainfall during
the early growing season and flowering had the opposite effect. Higher rainfall during harvest was associated with an increased chance
of coffee bean defects, but the effect of rainfall was moderated, or interacted, with temperature. Several sub-components of coffee bean
defects (e.g. mouldy beans and insect damage) were also related to climate during the early and late growing season. With this in
formation farmers and the coffee industry could develop targeted proactive (e.g. irrigation based on forecasts) systems to manage
climate risks that reduce the likelihood of negative coffee bean characteristics. Ultimately, better management of climate risks that
reduces coffee bean defects and small coffee beans would increase the income of farmers and countries dependent on robusta coffee
production.
13J. Kath et al. Climate Risk Management 32 (2021) 100281
Declaration of Competing Interest
The authors declare that they have no known competing financial interests or personal relationships that could have appeared to
influence the work reported in this paper.
Acknowledgments
We thank the coffee farmers of the Vietnamese Central Highlands and the ECOM Agroindustrial Corporation for providing data for
this research. We also thank staff from Western Highlands Agriculture and Forestry Science Institute (WASI) Dak Lak, Vietnam and
from the International Center for Tropical Agriculture (CIAT), Hanoi, Vietnam for discussions and feedback about coffee and climate
variability. This study was supported by the Federal Ministry for the Environment, Nature Conservation and Nuclear Safety – Inter
national Climate Initiative (IKI) and also implemented as part of the CGIAR Research Program on Climate Change, Agriculture and
Food Security (CCAFS), which is carried out with support from CGIAR Fund Donors and through bilateral funding.
References
Alba-Alejandre, I., Alba-Tercedor, J., Vega, F. E., 2018. Micro-CT to document the coffee bean weevil, Araecerus fasciculatus (Coleoptera:Anthribidae), inside field-
collected coffee berries (Coffea canephora). Insects 9(3):100.
Barton, K. 2020. MuMIn: Multi-Model Inference. R package version 1.43.17. https://CRAN.R-project.org/package=MuMIn.
Bates, D., Maechler, M., Bolker, B., Walker, S., 2015. Fitting linear mixed-effects models using lme4. J. Stat. Softw. 67 (1), 1–48. https://doi.org/10.18637/jss.v067.
i01.
Binh Minh, H., 2017. Unseasonal heavy rains take the flavor out of Vietnamese coffee crop. International Comunicaffe. https://www.comunicaffe.com/unseasonal-
heavy-rains-take-the-flavor-out-of-vietnamese-coffee-crop/ . Accessed 21 June 2019.
Bolker, B.M., Brooks, M.E., Clark, C.J., Geange, S.W., Poulsen, J.R., Stevens, M.H.H., White, J.S.S., 2009. Generalized linear mixed models: a practical guide for
ecology and evolution. Trends Ecol. Evol. 24 (3), 127–135. https://doi.org/10.1016/j.tree.2008.10.008.
Bote, A.D., Vos, J., 2017. Tree management and environmental conditions affect coffee (Coffea arabica L.) bean quality. NJAS - Wageningen J. Life Sci. 83, 39–46.
https://doi.org/10.1016/j.njas.2017.09.002.
Brighenti, Carla Regina Guimarães, & Cirillo, Marcelo Angelo. (2018). Analysis of defects in coffee beans compared to biplots for simultaneous tables. Revista Ciência
Agronômica, 49(1), 62-69. https://doi.org/10.5935/1806-6690.20180007.
Byrareddy, Vivekananda, Kouadio, Louis, Kath, Jarrod, Mushtaq, Shahbaz, Rafiei, Vahid, Scobie, Michael, Stone, Roger, 2020. Win-win: improved irrigation
management saves water and increases yield for robusta coffee farms in Vietnam. Agric. Water Manage. 241, 106350. https://doi.org/10.1016/j.
agwat.2020.106350.
Byrareddy, V., Kouadio, L., Mushtaq, S., Stone, R., 2019. Sustainable production of robusta coffee under a changing climate: a 10-year monitoring of fertilizer
management in coffee farms in Vietnam and Indonesia. Agronomy 9 (9), 499. https://doi.org/10. 3390/agronomy9090499.
Cannell, M.G.R., 1974. Factors affecting arabica coffee bean size in Kenya. J Hortic Sci 49:65-76 https://doi.org/10.1080/00221589.1974.11514552.
Casas, María I., Vaughan, Michael J., Bonello, Pierluigi, McSpadden Gardener, Brian, Grotewold, Erich, Alonso, Ana P., 2017. Identification of biochemical features of
defective Coffea arabica L. beans. Food Res. Int. 95, 59–67. https://doi.org/10.1016/j.foodres.2017.02.015.
Chotamonsak, Chakrit, Salathé Jr, Eric P., Kreasuwan, Jiemjai, Chantara, Somporn, Siriwitayakorn, Kingkeo, 2011. Projected climate change over Southeast Asia
simulated using a WRF regional climate model. Atmosph. Sci. Lett. 12 (2), 213–219. https://doi.org/10.1002/asl.313.
Coffee Guide, 2014. Central Coffee Research Institute, Coffee Research Station, Chikmagalur District, Karnataka, India, pp 120-121;149-151.
Craparo, A.C.W., Van Asten, P.J.A., Läderach, P., Jassogne, L.T.P., Grab, S.W., 2015. Coffea arabica yields decline in Tanzania due to climate change: global
implications. Agric. For. Meteorol. 207, 1–10. https://doi.org/10.1016/j.agrformet.2015.03.005.
D’haeze, D., Deckers, J., Raes, D., Phong, T.A., Loi, H.V., 2005. Environmental and socio-economic impacts of institutional reforms on the agricultural sector of
Vietnam. Agric. Ecosyst. Environ. 105 (1-2), 59–76. https://doi.org/10.1016/j.agee.2004.05.009.
Dai, Aiguo, 2013. Increasing drought under global warming in observations and models. Nature Clim Change 3 (1), 52–58. https://doi.org/10.1038/nclimate1633.
DaMatta F.M., Avila, R.T., Cardoso, A.A., Martins, S.C., Ramalho, J.C., 2018. Physiological and agronomic performance of the coffee crop in the context of climate
change and global warming: A review. J Agric Food Chem 66(21):5264-5274 https://doi.org/10.1021/acs.jafc.7b04537.
DaMatta, Fábio M., Ramalho, José D. Cochicho, 2006. Impacts of drought and temperature stress on coffee physiology and production: a review. Braz. J. Plant Physiol.
18 (1), 55–81. https://doi.org/10.1590/S1677-04202006000100006.
Dormann, Carsten F., Elith, Jane, Bacher, Sven, Buchmann, Carsten, Carl, Gudrun, Carré, Gabriel, Marquéz, Jaime R. García, Gruber, Bernd, Lafourcade, Bruno,
Leitão, Pedro J., Münkemüller, Tamara, McClean, Colin, Osborne, Patrick E., Reineking, Björn, Schröder, Boris, Skidmore, Andrew K., Zurell, Damaris,
Lautenbach, Sven, 2013. Collinearity: a review of methods to deal with it and a simulation study evaluating their performance. Ecography 36 (1), 27–46. https://
doi.org/10.1111/j.1600-0587.2012.07348.x.
Santos, Catia, Leitao, Antonio, Pais, Isabel, Lidon, Fernando, Ramalho, Jose, 2015. Perspectives on the potential impacts of climate changes on coffee plant and bean
quality. Emir. J. Food Agric 27 (2), 152. https://doi.org/10.9755/ejfa.v27i2.19468.
FAO., 2006. Food and Agriculture Organization of the United Nations (FAO), Guidelines for the Prevention of Mould Formation in Coffee.
Franca, Adriana S., Oliveira, Leandro S., Mendonça, Juliana C.F., Silva, Xênia A., 2005. Physical and chemical attributes of defective crude and roasted coffee beans.
Food Chem. 90 (1-2), 89–94. https://doi.org/10.1016/j.foodchem.2004.03.028.
Harrell, Frank, E, Jr, with contributions from Dupont, C and many others. (2020). Hmisc: Harrell Miscellaneous. R package version 4.4-1. https://CRAN.R-project.
org/package=Hmisc.
Harrison, X. A., Donaldson, L., Correa-Cano, M. E., Evans, J., Fisher, D. N., Goodwin, C. E., . . . Inger, R. (2018). A brief introduction to mixed effects modelling and
multi-model inference in ecology. PeerJ, 6, e4794. http://www.fao.org/3/a-au628e.pdf, pp 12 (accessed on 11.09.2020).
ICO (International Coffee Organization), 2019. http://www.ico.org/ accessed 12/03/2019.
International Organization for Standard, 2004. ISO 10470, Green coffee — Defect reference chart, Reference number ISO 10470:2004(E). available at. https://www.
iso.org/standard/40401.html.
International Organization for Standard, 2011. ISO 4150, Green coffee or raw coffee — Size analysis — Manual and machine sieving, Reference number ISO 4150:
2011(E). available at. https://www.iso.org/standard/44602.html.
Ionova, A., 2017. Europe’s coffee roasters hit by poor bean quality after Vietnam rains. Reuters. https://www.reuters.com/article/coffee-robusta-quality-
idUSL5N1HD2TY . Accessed 21 June 2019.
Jaramillo, J., Chabi-Olaye, A., Kamonjo, C., Jaramillo, A., Vega, F.E., Poehling, H.M. and Borgemeister, C., 2009. Thermal tolerance of the coffee berry borer
Hypothenemus hampei: predictions of climate change impact on a tropical insect pest. PloS one, 4(8), p.e6487.
Jaramillo, J., Muchugu, E., Vega, F.E., Davis, A., Borgemeister, C., et al. 2011. Some like it hot: The influence and implications of climate change on coffee berry borer
(Hypothenemus hampei) and coffee production in East Africa. PLoS ONE 6(9): e24528. doi:10.1371/journal.pone.0024528.
Jayakumar, M., Rajavel, M., 2019. Weather based pest forewarning models for mealybug infestation in Robusta coffee (Coffea canephora). J. Agrometeorol. 21 (4),
488–493.
14J. Kath et al. Climate Risk Management 32 (2021) 100281
Kath, Jarrod, Byrareddy, Vivekananda M., Craparo, Alessandro, Nguyen-Huy, Thong, Mushtaq, Shahbaz, Cao, Loc, Bossolasco, Laurent, 2020. Not so robust: robusta
coffee production is highly sensitive to temperature. Glob. Change Biol. 26 (6), 3677–3688. https://doi.org/10.1111/gcb.15097.
Marsh, A., 2007. Diversification by smallholder farmers: Viet Nam Robusta coffee. Food Agric. Organ. U.N. http://www.fao.org/3/ap301e/ap301e.pdf.
Martins, Lima Deleon, Eugenio, Fernando Coelho, Rodrigues, Wagner Nunes, Brinati, Sebastião Vinicius Batista, Colodetti, Tafarel Victor, Christo, Bruno Fardim,
Olivas, Dionicio Belisario Luis, Partelli, Fábio Luiz, Amaral, José Francisco Teixeira do, Tomaz, Marcelo Antonio, Ramalho, José Domingos Cochicho,
Santos, Alexandre Rosa dos, 2018. Adaptation to long-term rainfall variability for robusta coffee cultivation in Brazilian Southeast. AJCC 07 (04), 487–504.
https://doi.org/10.4236/ajcc.2018.74030.
Moat, J., Williams, J., Baena, S., Wilkinson, T., Gole, T.W., Challa, Z.K., Demissew, S., Davis, A.P., 2017. Resilience potential of the Ethiopian coffee sector under
climate change. Nat. Plants 3 (7), 17081. https://www.nature.com/articles/nplants201781.
NCHMF (Vietnamese National Centre for Hydro-Meteorological Forecasting) 2018. (http://www.nchmf.gov.vn/Web/en-US/105/92/Default.aspx).
Nguyen, T.H.P., Säll, T., Bryngelsson, T., Liljeroth, E., 2009. Variation among Colletotrichum gloeosporioides in Vietnam. Plant Pathol. 58, 898–909.
Pham-Thanh, Ha, Linden, Roderick, Ngo-Duc, Thanh, Nguyen-Dang, Quang, Fink, Andreas H., Phan-Van, Tan, 2020. Predictability of the rainy season onset date in
Central Highlands of Vietnam. Int. J. Climatol. 40 (6), 3072–3086. https://doi.org/10.1002/joc.6383.
Phelps, M.W., Kumar, A., O’Brien, J.J., 2004. Potential predictability in the NCEP CPC dynamical seasonal forecast system. J. Clim. 17 (19), 3775–3785.
Poltronieri, P., Rossi, F., 2016. Challenges in specialty coffee processing and quality assurance. Chall 7 (2), 19. https://doi.org/10.3390/challe7020019.
R Core Team, 2019. R: A language and environment for statistical computing. R Foundation for Statistical Computing, Vienna, Austria https://www.R-project.org/.
Ribeyre, F., Avelino, J., 2012. Impact of field pests and diseases on coffee quality. In: Oberthür, T., Läderach, P., Pohlan, H.A.J., Cock, J.H. (Eds.), Specialty Coffee:
Managing Coffee. International Plant Nutrition Institute, Penang, Malaysia, pp. 151–176.
Schmidt-Thome, P., Nguyen, T.H., Pham, T.L., Jarva, J., Nuottimäki, K., 2015. Preface. In: Climate Change Adaptation Measures in Vietnam. Springer Briefs in Earth
Sciences. Springer, Cham. https://doi.org/10.1007/978-3-319-12346-2_1.
Taniwaki, M.H., Teixeira, A.A., Teixeira, A.R.R., Copetti, M.V., Iamanaka, B.T., 2014. Ochratoxigenic fungi and ochratoxin A in defective coffee beans. Food Res. Int.
61, 161–166. https://doi.org/10.1016/j.foodres.2013.12.032.
USDA (United States Department of Agriculture Foreign Agricultural Service) 2019. Coffee: World Markets and Trade https://www.fas.usda.gov/commodities/coffee
accessed 12/06/2019.
Vaast, Philippe, Bertrand, Benoit, Perriot, Jean-Jacques, Guyot, Bernard, Génard, Michel, 2006. Fruit thinning and shade improve bean characteristics and beverage
quality of coffee (Coffea arabica L.) under optimal conditions. J. Sci. Food Agric. 86 (2), 197–204. https://doi.org/10.1002/jsfa.2338.
15You can also read