Using Seasonal Forecast as an Adaptation Strategy: Gender Differential Impact on Yield and Income in Senegal - MDPI
←
→
Page content transcription
If your browser does not render page correctly, please read the page content below
atmosphere
Article
Using Seasonal Forecast as an Adaptation Strategy:
Gender Differential Impact on Yield and Income
in Senegal
Ndeye Seynabou Diouf *, Mathieu Ouedraogo , Issa Ouedraogo , Gnalenba Ablouka and
Robert Zougmoré
 The CGIAR Research Program on Climate Change, Agriculture and Food Security (CCAFS),
 ICRISAT West & Central Africa Regional Office, Bamako BP 320, Mali; M.ouedraogo@cgiar.org (M.O.);
 i.ouedraogo@cgiar.org (I.O.); gnalenbaablouka@gmail.com (G.A.); R.Zougmore@cgiar.org (R.Z.)
 * Correspondence: S.Diouf@cgiar.org; Tel.: +223-221-775-320-427

 Received: 11 August 2020; Accepted: 28 September 2020; Published: 20 October 2020

 Abstract: The use of seasonal forecast has been demonstrated as a good option to reduce the effects
 of climate variability in sub-Saharan African countries. However, its use, benefits and interests may
 be different depending on gender. This paper aims at analyzing the gender differential impact of
 the use of seasonal forecast on the main crop yields (rice, maize, sorghum, millet and groundnut)
 and farm income in Senegal. We collected data from 1481 farmers (44% women) in four regions
 of Senegal. We applied the counterfactual outcomes framework of modern evaluation theory to
 estimate the local average treatment effect (LATE) of the use of the seasonal forecast on crop yield
 and farm income. The results showed a significant impact of the use of the seasonal forecast (SF) in
 the main crop yields and the agricultural income for farmers in Senegal. This impact varies according
 to the sex and the type of the crops. The users (men and women) of the seasonal forecast gained
 on average 158 kg/ha and 140 kg/ha more yield than the non-users, respectively, for millet and rice
 crops. The impact of the use of SF is greater for men on millet (202.7 kg/ha vs. 16.7 kg/ha) and rice
 (321.33 kg/ha vs. −25.3 kg/ha). However, it is greater for women on maize (210 kg/ha vs. −105 kg/ha).
 Potential users of seasonal forecast had also a positive and significant impact of 41$ per ha on the
 income. The additional income is more important for men (56$) than women (11$). These findings
 suggest that the use of seasonal forecast increases the productivity of rural communities and affects
 men and women differently. The access to and use of SF should therefore be widely promoted among
 farmers’ organizations; women’s associations should be particularly targeted.

 Keywords: seasonal forecast; impact; yield; income; LATE

1. Introduction
     Climate change affects men and women differently depending on their level of vulnerability, their
country of residence and the nature of their livelihoods [1–4]. Climate is the primary determinant of
agricultural productivity in sub-Saharan Africa (SSA) [5]. It affects the food systems in several ways,
ranging from direct effects on crop production to changes in market, food prices and supply chain
infrastructure [6].
     In SSA, several studies, e.g., [7–10], have demonstrated the negative impacts of climate change in
agriculture. Jalloh et al. [10] showed that, in Senegal, climate change will lead to an overall yield loss
of between 5 and 25 percent for groundnuts. Roudier et al. [7] found that the temperature increases
have been found to reduce the yields and quality of many crops, most importantly cereal and feed
grains. According to Food and Agriculture Organization (FAO) [11], in SSA, the cultivated area for

Atmosphere 2020, 11, 1127; doi:10.3390/atmos11101127                       www.mdpi.com/journal/atmosphere
Atmosphere 2020, 11, 1127 2 of 19
major crops has doubled since 1960 and the yield per unit of land has been stagnant for these crops.
Blanc [9] disclosed that, in 2100 in SSA, in a case without climate change, yield changes will be near
zero for cassava and will range from −19% to +6% for maize, from −38% to −13% for millet and from
−47% to −7% for sorghum under alternative climate change scenarios. In this context, the use of
weather and climate information services (WCIS) has become an essential tool for adaptation to climate
change. Substantial benefits of WCIS in agroecosystems are reported for several countries in Africa [4].
In Senegal, WCIS has become an agricultural input for crop production for farmers and fisherfolk who
use it to improve their resilience under climate change [12]. In Mali, Niger and Burkina Faso, seasonal
forecast information reportedly helped millet and sorghum farmers to make mixed strategic decisions
such as when to apply manure or chemical fertilizers and when to sow crops [13]. More specifically, a
farmer could sow his corn in June after heavy rain depending on the nature of the seasonal forecast.
Additionally, if a dry spell is planned for 10 days, the farmer can delay sowing in order to avoid losses.
These agricultural decisions informed by the seasonal forecast lead to strategic choices related to crop
variety, site production, etc., and a better allocation of productive resources (labor, land, agricultural
inputs). This will contribute to the improvement of farm productivity through a reduction in cost and
crop losses and an increase or stabilization of yields and farm income [13,14]. Among the services
offered through weather forecast, the seasonal forecast (SF) has been largely identified as one of the
most effective adaptation strategies [13,15–22]. Seasonal weather forecasts are forecasts of average
seasonal conditions over a region that are made at the edge of the onset of the rainy season. A seasonal
forecast uses climate models to predict what the seasonal rainfall might look like. This information is
valuable to farmers for decision-making in agriculture. Seasonal rainfall forecasts for the region of West
Africa are routinely produced within the framework of the West African Regional Climate Outlook
Forums (WARCOF), formerly known as PRESAO (Prévisions Saisonnières en Afrique de l’Ouest) [10].
In Senegal, the seasonal forecast is disseminated through seminars, bulletins and radio broadcast [20]
and includes information related to the total rain, the rainfall frequency, rainfall distribution, the onset
length and the temperature [23]. Various studies have highlighted the impacts of SF on agricultural
productivity in SSA. Lo and Dieng [19] showed that the use of SF in Senegal increased agricultural
yields and this led to the improvement of family welfare. In addition, Rao et al. [24] demonstrated that
farmers with SF achieve higher yields, with attractive returns on investment. Similar results have been
found in South Africa [16,25,26]. However, no study has looked at the gendered perspective on the
impact of SF. Indeed, men and women are differently affected by climate change due to inequalities
between them. Women and men perceive some weather impacts on crops differently and diverge in
how they receive, share, understand and act upon weather-related information [2]. In Africa, 80%
of the agricultural production comes from small farmers who are mostly rural women (almost 50%
in SSA) [27]. Women represent the largest percentage of the workforce in the agricultural sector
but do not have access to or control over all land and productive resources. They make up almost
50% of the agricultural labor force in sub-Saharan Africa, an increase from around 45% in 1980, and
their labor share could well exceed 60% in many African countries [28]. In Senegal, women typically
have less access to land, to labor and to credit, the result of historical social and legal barriers that
have limited their access, their educational opportunities and their economic advancement in rural
areas [27]. Moreover, in many ways, climate change could expose and exacerbate these pre-existing
gender inequalities, making poor women in particular more vulnerable to its effects and preventing
them from participating equally in its solutions [29].
This study is an attempt to (i) determine the gendered access to and use of seasonal forecast and
(ii) identify the gender differential impact of the use of seasonal forecast on the main crop yields and
farmer income.
The following sections are presented below: Section 2 outlines the theoretical framework as well
as the empirical model, study site and the sampling; the results are presented in Section 3, followed by
the discussion in Section 4 and finally the conclusions are developed in Section 5.Atmosphere 2020, 11, 1127 3 of 19
2. Materials and Methods
2.1. Theorical Framework for Impact Assesment
In order to determine the impact of the use of seasonal forecast, a non-experimental approach
was used. This approach is based on the framework of potential incomes proposed by Rubin [30].
Under this framework, the use of SF is considered as the “treatment”, the additional income or yield is
“the result” of the treatment. Indeed, each individual has two potential outcomes (with the treatment
y1 or without treatment y0 ) and the impact of the use of SF on the income (or a yield) for a farmer who
was randomly selected from the population of those who used the SF is given by the average treatment
effect (ATE).
∆ATE = E (∆) = E(y1 ) − E(y0 ) (1)
The method of potential incomes is based on the stable unit treatment values assumption (SUTVA),
which assumes that the potential outcomes for any unit do not vary with the treatments assigned to
other units. In addition, this assumption excludes general equilibrium effects and cross effects [31,32].
However, due to the nature of the data collected (observational data), there may be selection biases.
These biases can be observable biases (the differences in the observed result can occur due to observable
characteristics), unobservable biases (the differences are due to unobservable characteristics such
as motivation) or endogenous biases (treated individuals may not comply with the treatment as
assigned) [33,34]. Thus, the existence of these biases can lead to an overestimation or underestimation
of the observed result [33,35,36]. Specifically, a difference in an individual’s potential outcomes may
not be due to the treatment but merely to unobserved factors. As a result, the average treatment
effect for the whole population is different from the average treatment effect that could be obtained
if the treatment was randomly assigned and if each individual in the population complied with
treatment [33,35]. In this case, a causal interpretation is given only if each individual follows the
assigned treatment. To deal with these biases, Imbens and Angrist [35] suggested the local average
treatment effect (LATE) which gives the treatment effect of the sub-population of compliers (those who
are effectively using the SF). Indeed, the use of SF is an endogenous choice that leads to the existence of
endogenous bias. We have therefore used the LATE parameter to determine the causal effect of the
use of SF in this study. The estimation of such a parameter requires the existence of an instrumental
variable z that influences directly the use of SF but has no direct influence on the outcomes (yield and
agricultural income in this study). We have then chosen the access to and knowledge of the SF as an
instrument because an individual cannot use SF without having access to it and the access does not
directly lead to its use. Moreover, an individual may have access to the SF, but if he did not know
about it, he may not use it effectively. In addition, the access to and the knowledge of the SF does not
directly affect the yield or the income. Furthermore, the use of this parameter requires an assumption
that defines the absence of non-compliers in the population.
With regard to estimators, we used the “local average response function” (LARF) from Abadie [34]
to estimate the LATE parameter because the diffusion of SF was not randomly distributed. In this
case, the instrument is not totally independent of the potential outcomes y1 and y0 but will become so,
conditionally to the independent variables x that determine the result y [30,37]. We used the regression
function ordinary least square (OLS), which considers that the impact of the use of SF is constant for the
whole population. Moreover, for the consistency of the OLS estimation, we assume that there is a linear
relationship between the income/yield, the use of seasonal forecast and the covariates. Under this
assumption and for any function g( y, A, x), an impact estimator for the sub-population of potential
users (LATE) is given by the following equation [34,38]:
1
E[ g( y, A, x) A1 = 1] = E[k.g( y, A, x)] (2)
P ( A1 = 1 )Atmosphere 2020, 11, 1127 4 of 19
where k = 1 − P(z=z 1|x) (1 − A) represents the weight which takes the value 1 for potential users of SF
and negative values otherwise. The conditional probability P(z = 1|x) has been estimated using the
probit model. This last Equation (2) is named the “local average response function (LARF)” and can be
estimated using the following specification [34]:
E( y x, Ai = 1) =∝0 + ∝1 A + βX + γAXd (3)
where α, β, γ are the vectors of covariates and
LATE =∝1 +γX (4)
The aim of this study is to calculate the impact of the use of SF on the agricultural net income per
hectare and on the yield of the five main crops in the area of the study. The net income is the result of
the value of the production deduced from operating expenses. The users of SF are those who took at
least one decision after receiving SF. The non-users or non-adopters are those who did not take any
decision based on SF or any other climate information (cumulative rain forecast, temperature, onset of
the season, etc.). The chi-squared (χ2 ) test (for qualitative data) and the test of Student (for numeric
data) were used for mean comparison and the significance of variables, respectively.
2.2. Empirical Model
The literature review showed that several variables affect the use and the impact of SF on
crop productivity [16,19,25,39–41]. Socioeconomic characteristics such as age, marital status, level of
education and household size influence the access to and use of weather forecast. Moreover, the access to
SF is facilitated by farmers’ organizations and their relations with project or extension services [2,42,43].
The usual dissemination channels are radios or mobile phones through SMS, voice messaging and
mobile applications (web, Facebook, WhatsApp, etc.). People who possess these platforms have a
higher probability of obtaining information [12]. Being a client of a microfinance institution may
increase the capacity of farmers to make appropriate decisions related to crop management. These
variables have also been found in similar studies determining the impact of the use of innovation
technologies in Africa [44–47]. The following table (Table 1) lists the variables used.
Table 1. Description of the variables introduced in the model.
Variables Description
Age Age of the farmer
Marital status Dummy = 1 if the farmer is married
Formal education Dummy = 1 if the farmer has been in formal school
Experience as member of an association No. of years of experience as member of association
Member of farmers’ organization Dummy = 1 if the farmer is member of farmer’s organization
No. of years of experience as a farmer No. of years of experience as farmer
Relation with project/ Non-governmental
Dummy = 1 if the farmer has a relation with project/NGO
organization (NGO)
Dummy = 1 if the farmer has a relation with
Relation with agriculture extension services
technical services
Dummy = 1 if the farmer has a relation with
Microfinance
microfinance institution
Dummy = 1 if the farmer has been trained on climate change
Training in climate change
in 2018
Mobile phone Dummy = 1 if the farmer owns mobile phone
Radio Dummy = 1 if the farmer owns radio
Television Dummy = 1 if the farmer owns television
No. of crops No. of crops practiced
Household size Household size
Dummy = 1 if the farmer is very confident about the
Level of confidence
Met ServicesAtmosphere 2020, 11, x FOR PEER REVIEW 5 of 20
Atmosphere 2020, 11, 1127 5 of 19
Dummy = 1 if the farmer is very confident about
Level of confidence
the Met Services
2.3. Study Site, Sampling and Data
2.3. Study Site, Sampling and Data
The study was carried out in 2019 in five regions in Senegal, namely Kaolack, Kaffrine,
The study was carried out in 2019 in five regions in Senegal, namely Kaolack, Kaffrine, Kolda,
Kolda, Sedhiou and Ziguinchor (Figure 1), where almost 60% of the national cereal production
Sedhiou and Ziguinchor (Figure 1), where almost 60% of the national cereal production is
is concentrated [48]. Agriculture and livestock constitute the mainstay of Senegal, representing
concentrated [48]. Agriculture and livestock constitute the mainstay of Senegal, representing
approximately 17% of the gross domestic product (GDP) and employing 70% of the population [49].
approximately 17% of the gross domestic product (GDP) and employing 70% of the population [49].
Agricultural land in Senegal constitutes approximately 46% of the country’s total land area [50].
Agricultural land in Senegal constitutes approximately 46% of the country’s total land area [50].
Rainfall is the key determinant of the agricultural production as less than 5% of land cultivated is
Rainfall is the key determinant of the agricultural production as less than 5% of land cultivated is
under irrigation. Moreover, the agricultural economy is characterized by the dominance of smallholder
under irrigation. Moreover, the agricultural economy is characterized by the dominance of
farmers cultivating millet, sorghum, maize and rice for subsistence purposes. The country’s main cash
smallholder farmers cultivating millet, sorghum, maize and rice for subsistence purposes. The
crops include groundnut and cotton.
country’s main cash crops include groundnut and cotton.
Figure 1. Site study.
Figure 1. Site study.
Data were collected from a sample of 1500 farmers of whom 56% were men and 44% were
women. DataWewere
usedcollected fromframe
a sampling a sample of 1500
of 12,484 farmers
member of whom
farmers of the 56% wereorganizations,
farmers’ men and 44%locallywere
women. We used a sampling frame of 12,484 member farmers of the farmers’ organizations,
called consolidation networks (CN). The CNs are organizations of farmers grouped around profitable locally
called consolidation
and competitive networks
value chains (CN). The CNs
(rice, millet, are organizations
maize, peanut, etc.).ofThese
farmers grouped
networks around
are similarprofitable
to small
and competitive value chains (rice, millet, maize, peanut, etc.). These networks are similar
enterprises, with qualified staff in charge of the production quality control and the capacity building to small
of
enterprises,
their members.withThey
qualified
includestaff
alsoinadministrative
charge of the production qualityrelations
staff who manage control and
withthe capacity
financial building
institutions
of
andtheir members.
private operatorsThey include alsoThe
for marketing. administrative staff 50
database includes whoCNmanage relations
with 9562 with and
beneficiaries financial
2922
institutions and private operators for marketing. The database includes 50 CN with 9562
non-beneficiaries. Beneficiaries are those who receive weather and climate services from the National beneficiaries
and 2922 non-beneficiaries.
Meteorological Service andBeneficiaries are thoseradios
through community who receive weather
and social and climate
networks. services from the
Non-beneficiaries are
National
those whoMeteorological
do not receive Service
WCIS. Aroundand through community
1500 farmers radios andselected
were randomly social using
networks. Non-
a stratified
beneficiaries are those
two-stage sampling who do
method not CN
where receive WCIS. the
represents Around 1500unit
primary farmers were randomly
and farmers representselected using
the secondary
aunit.
stratified two-stage
The sex and area sampling method
of residence werewhere CN represents
considered the variables
as interest primary unit andsampling.
for the farmers represent
Table 2
the secondary unit. The sex and area of residence
below presents the sample distribution of the present study. were considered as interest variables for the
sampling. Table 2 below presents the sample distribution of the present study.
Table 2. Sample by region and sex.
Table 2. Sample by region and sex.
Region Male Female Total
Region
KAFFRINE 165
Male 94
Female259
Total
KAFFRINE
KAOLACK 111 165 3 94 114 259
KOLDA
KAOLACK 370 111 238 3 608 114
SEDHIOU 70 212 282
KOLDA
ZIGUINCHOR 128
370 109
238237 608
SEDHIOU 70 212 282
Total 844 656 1500Atmosphere 2020, 11, 1127 6 of 19
We interviewed selected farmers using a structured questionnaire to record information on
socioeconomic characteristics, input use, farmers’ access to and use of WCIS, farm income, etc. Stata
software was used for descriptive and econometric analysis.
3. Results
3.1. Descriptive Statistics
3.1.1. Socioeconomic Characteristics
Table 3 presents the socioeconomic characteristics of respondents according to both sex and
access to SF. Adopters of SF represented on average 10%. Among men, 12% used the SF against 8%
among women. Significant differences could be observed among men and women in socioeconomic
characteristics. Around 64% of the respondents were heads of households. This proportion represented
89% and 34%, respectively, among men and women. More than half of the respondents were over
40 years old. The average age was 48 for men and 44 for women (Table 4). The average size of
households was 16 among men and 15 in women. Most of the respondents (98%) were married.
The dominant ethnicity was “Peulh”, followed by “Wolof” and “Diola”. Regarding the level of
education, among women, almost 64% of non-users of SF had not been in school against 39% of users of
SF. Among men, the majority learned Koran/Arabic and no significant difference was observed within
them. The surveyed farmers had, for the most part, more than 20 years of experience in agriculture
and differences were observed in adopters and non-adopters regardless of sex (Table 4).
Agriculture was the main activity of the respondent farmers. Regarding membership of an
association, we note that almost all of the adopters (more than 98%) were part of an association;
significant differences were noted in the adopters and non-adopters. Few farmers (less than 1%) had
relations with the national agricultural research services. On average, 40.72% of men and more than
50% of women had relationships with development projects and/or NGOs.
Regarding climate services, the respondents were confident about the information from the
National Met Service. Among men, 37% of users of SF trusted information from the Met Service,
against 48% in non-adopters. The opposite was observed for women, where 37% of adopters trusted
the information, against 30% among non-adopters. Concerning the means of communication, a
greater number of men had mobile phones (on average 95.6%) compared to 76% among women.
Around 43.86% of adopters against 8% of non-adopters had received training in climate change; 45%
of men and 41% of women (both users of SF) benefitted from training on climate change.
3.1.2. Arable Land and Farm Size
Table 5 depicts the available arable land and farm sizes of farmers. There was a significant
difference between men and women in the sample. Men possessed at least 6 ha and women 2.8 ha.
Female adopters of SF had on average 4.39 ha and those who did not use the SF possessed 2.7 ha of
the area. Regarding the cultivated area, men used at least 6 ha, which was much more compared to
women, who utilized 3.57 ha. Concerning the status of adoption, results show that users of SF had the
largest amount of cultivated area than the others. The difference refers to users and non-users among
men and among women.Atmosphere 2020, 11, 1127 7 of 19
Table 3. Farmers’ socioeconomic characteristics by gender and adoption status.
Sex Male Female All
Users of Seasonal Forecast Yes No All Yes No All Yes No All
N 73 541 614 41 464 505 114 1014 1128
Farmers
% 11.89 88.11 56.04 8.12 91.88 43.96 10.11 89.89 100
Head of household #++ Yes 84.93 88.17 87.79 48.78 33.41 34.65 71.93 62.89 63.81
Under 30 years 1.37 5.91 5.37 9.76 11.64 11.49 4.39 8.56 8.13
Between 30 and 40 years 19.18 21.07 20.85 14.63 26.08 25.15 17.54 23.38 22.79
Age Between 40 and 50 years 26.03 27.91 27.69 24.39 25.65 25.54 25.44 26.87 26.72
Between 50 and 60 years 39.73 28.28 29.64 36.59 28.23 28.91 38.6 28.26 29.31
Over 60 years 13.7 16.82 16.45 14.63 8.41 8.91 14.04 12.94 13.05
Wolof 27.4 21.81 22.48 12.2 9.91 10.1 21.93 16.32 16.89
Peulh 57.53 56.01 56.19 46.34 40.09 40.59 53.51 48.66 49.15
Ethnicity *# Sérère 1.37 0.92 0.98 4.88 1.08 1.39 2.63 1 1.16
Diola 6.85 13.12 12.38 19.51 16.16 16.44 11.4 14.53 14.21
Mandingue 0 3.88 3.42 7.32 23.28 21.98 2.63 12.84 11.8
Marital status ###+++ Married 97.26 97.6 97.56 58.54 84.48 82.38 83.33 91.54 90.71
None 21.92 29.76 28.83 39.02 63.79 61.78 28.07 45.47 43.7
Arab/Coran 46.58 43.81 44.14 17.07 16.38 16.44 35.96 31.14 31.64
Level of instruction ###+++ Literate in a foreign
6.85 5.18 5.37 17.07 5.39 6.34 10.53 5.27 5.81
language
Primary school 12.33 13.68 13.52 19.51 11.21 11.88 14.91 12.54 12.78
Secondary middle school 6.85 4.07 4.4 2.44 1.94 1.98 5.26 3.08 3.31
Less than 10 2.74 3.14 3.09 4.88 8.62 8.32 3.51 5.62 5.41
Between 10 and 20 8.22 17.74 16.61 17.07 24.78 24.16 11.4 20.81 19.86
Number of years of agricultural experience *##+++
Between 20 and 30 45.21 48.24 47.88 39.02 47.63 46.93 42.98 47.53 47.07
More than 30 43.84 30.87 32.41 39.02 18.97 20.59 42.11 26.04 27.66
Principal activity *##+++ Farming/breeding 94.52 98.15 97.72 90.24 98.28 97.62 92.98 98.21 97.68
Member of an association ***###+++ Yes 97.26 77.08 79.48 100 87.72 88.71 98.25 81.99 83.65
Relation with a project Yes 34.25 41.59 40.72 48.78 50.65 50.5 39.47 45.77 45.13
Relation with the National Agricultural Research
Yes 1.37 0.18 0.33 2.44 0 0.2 1.75 0.1 0.27
Institute #++
Very confident 36.99 47.5 46.25 36.59 29.53 30.1 36.84 39.2 38.96
Just confident 34.25 33.46 33.55 34.15 40.3 39.8 34.21 36.62 36.37
Level of confidence in the weather forecast ***+++
Little confident 15.07 15.53 15.47 19.51 25.22 24.75 16.67 20 19.66
Not at all confident 13.7 3.51 4.72 9.76 4.96 5.35 12.28 4.18 5
Mobile phone possession Yes 95.89 95.56 95.6 82.93 75.22 75.84 91.23 86.17 86.68
A member of the house watches TV ###++ Yes 53.42 48.61 49.19 73.17 50.86 52.67 60.53 49.65 50.76
A member of the house listens to the radio ##+++ Yes 95.89 92.05 92.51 97.56 83.41 84.55 96.49 88.06 88.92
Training in climate change ***###+++ Yes 45.21 8.87 13.19 41.46 6.9 9.7 43.86 7.96 11.62
* Significance among men: *** = significant at 1%, * = significant at 10%; # significance among women: (### 1% ## 5%, # 10%); + significance in the whole sample (+++ 1% ++ 5%).Atmosphere 2020, 11, 1127 8 of 19
Table 4. Age, size of household and farmer experience in farming.
Sex Modality N Mean Standard Deviation
Yes 73 49.44 10.99
No 541 47.84 12.55
Male
All 614 48.03 12.38
Age Difference 1.60
Yes 41 48.05 12.87
No 464 43.85 12.57
Female
All 505 44.19 12.63
Difference 4.201798 **
Yes 73 17.01 9.05
No 541 16.13 9.38
Male
All 614 16.24 9.34
Difference 0.88
Size of household
Yes 41 14.66 7.85
No 464 15.41 8.03
Female
All 505 15.35 8.01
Difference −0.76
Yes 73 29.99 10.72
No 541 27.72 11.83
Male
All 614 27.99 11.72
Years of experience Difference 2.269111 *
Yes 41 27.61 12.62
No 464 22.99 11.17
Female
All 505 23.36 11.35
Difference 4.620532 ***
*** = significant at 1%, ** = significant at 5%, * = significant at 10%.
Table 5. Available and cultivated area by sex and status of adoption.
Sex Use of SF N Mean Standard Deviation
Yes 73 7.186986 12.23176
Male No 541 6.100129 6.721459
All 614 6.229349 7.582548
Available area
Difference 1.086857
Yes 41 4.386585 6.537048
Female No 464 2.711207 3.738648
All 505 2.847228 4.054841
Difference 1.675378 ***
Yes 73 6.440411 12.24563
Male No 541 5.055823 5.472056
All 614 5.22044 6.647686
Cultivated area
Difference 1.384588 **
Yes 41 3.565854 4.808761
Female No 464 2.047274 2.284699
All 505 2.170564 2.608225
Difference 1.51858 ***
*** = significant at 1%, ** = significant at 5%.Atmosphere 2020, 11, 1127 9 of 19
3.1.3. Yield and Income Comparison
The mean comparison of the yield and income was conducted according to gender and the use
of SF:
• Yield comparison
Regarding the yield (Table 6), the average yield of millet by farmers was around 740 kg/ha. There
was at least a difference of 200 kg/ha between users and non-users of seasonal forecast in the men’s
group. There was almost no difference between men and women in millet yield. Women who grew
sorghum did not use SF in the sample. However, Table 5 depicts a high yield for women (951 kg/ha)
compared to men (698 kg/ha). There was a significant difference between users of SF and non-users in
the men’s group (1467 kg/ha against 647 kg/ha). Furthermore, no difference was observed between
men and women regarding maize yield. The mean was 880 kg/ha and the maize yield was the highest
for men (902.7 kg/ha) than women (785 kg/ha). With regard to rice crop, there was a difference between
users and non-users among men and women. The yield of men (966 kg/ha) was higher as compared to
the yield for women (663 kg/ha). The mean yield of rice was 761 kg/ha. Regarding the groundnut,
the mean yield was 991 kg/ha. The yield from men was higher (1032 kg/ha) compared to the one for
women (884 kg/ha). A significant difference was noted between users and non-users among women:
645 kg/ha for users of SF and 913.6 kg/ha for non-users.
Table 6. Yield comparison by gender and adoption.
Crops Gender Users of Seasonal Forecast N Mean (kg/ha) Standard Deviation
Yes 46 924.2 504.7
Male No 372 721.4 494.7
All 418 743.7 499.2
Millet Yes 13 726.9 378.4
Female No 105 725.4 453.1
All 118 725.5 444.1
Yes 59 880.8 483.8
All No 477 722.3 485.4
All 536 739.7 487.3
Yes 3 1467.3 1794.6
Male No 45 647.0 536.6
All 48 698.3 668.5
Sorghum
Yes 0
Female No 10 951.2 302.7
All 10 951.2 302.7
Yes 3 1467.3 1794.6
All No 55 702.4 513.8
All 58 741.9 626.3
Yes 36 910.2 994.7
Male No 272 901.8 769.2
All 308 902.7 796.9
Maize Yes 7 757.1 806.4
Female No 64 788.2 869.2
All 71 785.1 857.8
Yes 43 885.3 959.5
All No 336 880.1 789.1
All 379 880.7 808.8Atmosphere 2020, 11, 1127 10 of 19
Table 6. Cont.
Yes 26 1151.4 1001.6
Male No 160 936.1 898.0
All 186 966.2 913.3
Rice Yes 33 783.2 723.3
Female No 358 652.1 515.4
All 391 663.2 536.1
Yes 59 945.4 868.9
All No 518 739.8 669.8
All 577 760.9 694.7
Yes 58 1118.5 620.9
Male No 436 1020.6 771.5
All 494 1032.1 755.5
Groundnut Yes 21 645.1 358.3
Female No 169 913.6 646.7
All 190 884.0 626.5
Yes 79 992.6 599.1
All No 605 990.7 739.8
All 684 990.9 724.6
• Income comparison
Table 7 shows the agricultural income of respondents by gender and level of adoption. Among
men, the results describe a significant difference (27,598 XOF/48$ (1USD = 579 XOF)) between users
and non-users. Among women, the difference was not significant. The mean income of farmers was
137,941 XOF or 238$. In addition, the mean income was 131,364 XOF or 227$ for women, against
143,342 XOF or 248$ for men, and the difference was not statistically different.
Table 7. Income comparison by gender and adoption.
Sex M N Mean (XOF) Standard Deviation
Non-users 541 140,070.8 125,939.4
Male Users 73 167,669.1 122,849.3
All 614 143,352 125,795.4
Difference −27,598.3 **
Non-users 464 130,605 120,289.9
Female Users 41 139,953.9 182,833
All 505 131,364 126,301.7
Difference −9348.92
Non-users 114 157,701.4 147,062.8
Total Users 1005 135,700.5 123,392.6
All 1119 137,941.9 126,109
Difference 22,000.85 12,451.28
** = significant at 5% (Student’s test).
3.1.4. Access and Use of SF
Table 8 presents the access to and use of SF according to gender and the adoption status. Around
28% of respondents had access to SF, from which 56.93% were male and 43% female. Moreover, 10% of
individuals used SF effectively; among these, 64% were men and 36% women.Atmosphere 2020, 11, 1127 11 of 19
Table 8. Access to and use of seasonal forecast by gender and adoption.
Access to SF Users of SF **
Gender Statistic
Yes No All Yes No All
N 234 596 830 73 541 614
Male
% 56.93 55.7 56.04 64.04 53.83 54.87
N 177 474 651 41 464 505
Female
%REVIEW43.07
Atmosphere 2020, 11, x FOR PEER 44.3 43.96 35.96 46.17 45.13 11 of 20
N 411 1070 1481 114 1005 1119
All N% 27.75411 72.25 1070 100 148110.19 114
89.81 1005
100 1119
All
% 27.75
** = significant at72.25
5% (Student’s100
test). 10.19 89.81 100
** = significant at 5% (Student’s test)
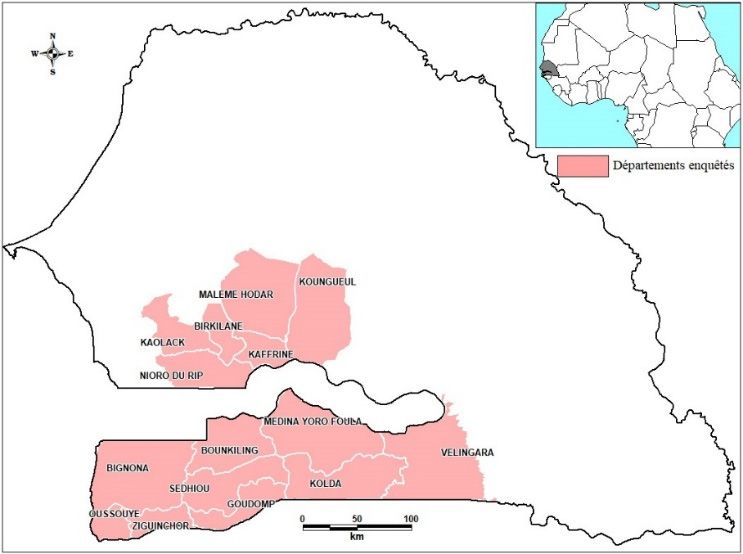
Figure 2 shows the types of decision taken by men and women after the reception of seasonal
Figure
forecast. The2 most
shows the types
common of decision
decisions weretaken by men
“the use of anand women
early aftercrop
maturing the variety”,
receptionfollowed
of seasonal
by
forecast. The most common decisions were “the use of an early maturing crop variety”, followed
“the modification of the sowing period” for both sexes. Few farmers chose to change the date of the by
“the modification
preparation of the of the(labor,
plot sowing period” for both sexes. Few farmers chose to change the date of the
plough).
preparation of the plot (labor, plough).
70%
61%
60% 52%
50%
40%
30% 22% 23%
20%
5% 5% 5% 7% 5% 5% 3%
10% 2% 3% 2%
0%
Choice of Choice of Choice of Choice of Choice of Choice of Choice of
variety production area to be the plot plowing sowing / re- manure /
site planted preparation period sowing compost
period period application
period
Men Women
Figure
Figure 2. Decisions taken
2. Decisions taken after
after the
the reception
reception of
of seasonal
seasonal forecast.
forecast.
3.2. Impact of the Use of SF on Main Crop Yields
3.2. Impact of the Use of SF on Main Crop Yields
The results of the impact of the use of SF on main crops are presented in Table 9. The results show
The results of the impact of the use of SF on main crops are presented in Table 9. The results
an additional yield of 158 kg/ha for millet, 878 kg/ha for sorghum and 139.78 kg/ha for rice. There was
show an additional yield of 158 kg/ha for millet, 878 kg/ha for sorghum and 139.78 kg/ha for rice.
a significant effect of the use SF on yield (202.70 kg/ha) for millet yield among men. This impact was
There was a significant effect of the use SF on yield (202.70 kg/ha) for millet yield among men. This
low (16.67 kg/ha) for women. For sorghum, given that there were non-users in the women’s group, the
impact was low (16.67 kg/ha) for women. For sorghum, given that there were non-users in the
effect was calculated for men only and was +886.53 Kg/ha. However, a negative effect was observed
women’s group, the effect was calculated for men only and was +886.53 Kg/ha. However, a negative
among men in maize yield (−105 kg/ha) and an additional gain of +210 kg/ha for women. For rice
effect was observed among men in maize yield (−105 kg/ha) and an additional gain of +210 kg/ha for
cropping, the impact of SF use was positive (+321 kg/ha) for men and negative for women (−25 kg/ha).
women. For rice cropping, the impact of SF use was positive (+321 kg/ha) for men and negative for
Regarding groundnut, a significant and negative effect was observed for women (−278 kg/ha) and a
women (−25 kg/ha). Regarding groundnut, a significant and negative effect was observed for women
positive effect for men (+85.57 kg/ha).
(−278 kg/ha) and a positive effect for men (+85.57 kg/ha).
Table 9. Impact of the use of SF on the main crops.
Sex
Crop Statistics Total
Male Female
202.7003 *** 16.6704 *** 158.0922 ***
late
(0.000000213) (0.000000636) (0.000000198)
202.8108 *** 1.560541 158.4683 **
diffmo
(78.11952) (110.9722) (66.40393)
924.2391 *** 726.9231 *** 880.7627 ***
mo_N1Atmosphere 2020, 11, 1127 12 of 19
Table 9. Impact of the use of SF on the main crops.
Sex
Crop Statistics Total
Male Female
202.7003 *** 16.6704 *** 158.0922 ***
late
(0.000000213) (0.000000636) (0.000000198)
202.8108 *** 1.560541 158.4683 **
diffmo
(78.11952) (110.9722) (66.40393)
924.2391 *** 726.9231 *** 880.7627 ***
mo_N1
Millet (73.78025) (101.7092) (62.56851)
721.4284 *** 725.3625 *** 722.2944 ***
mo_N0
(25.67361) (44.38536) (22.24103)
N 418 118 536
N1 46 13 59
Nz1 410 115 525
886.527 *** 878.3913 ***
late
(0.0096732) (0.0058903)
820.2892 764.9812
diffmo
(867.949) (863.7879)
1467.333 * 1467.333 *
Sorghum mo_N1
(864.1794) (860.9585)
647.0441 *** 702.3521 ***
mo_N0
(80.80415) (69.85694)
N 48 58
N1 3 3
Nz1 36 42
−105.0478 *** 210.108 *** −54.71325 ***
late
(0.000000604) (0.005296) (0.000000869)
8.430372 −31.02121 5.152838
diffmo
(170.5127) (306.4321) (151.2637)
910.1852 *** 757.1429 *** 885.2713 ***
mo_N1
Maize (163.9917) (286.2584) (144.9938)
901.7548 *** 788.1641 *** 880.1185 ***
mo_N0
(46.70464) (109.347) (43.09885)
N 308 71 379
N1 36 7 43
Nz1 353 80 433
321.3293 *** −25.31179 *** 139.779 ***
late
(0.000000204) (0.000000408) (0.000000299)
215.319 131.0487 205.6047 *
diffmo
(206.322) (127.2601) (116.1548)
1151.372 *** 783.1818 *** 945.4349 ***
mo_N1
Rice (193.6653) (124.3038) (112.3588)
936.0526 *** 652.1331 *** 739.8302 ***
mo_N0
(71.15149) (27.2708) (29.45237)
N 186 391 577
N1 26 33 59
Nz1 205 282 487
85.57264 *** −278.0796 *** −36.6594 ***
late
(0.0239357) (0.000000741) (0.000000537)
97.904 −268.5566 *** 1.935476
diffmo
(89.02992) (91.49708) (73.51857)
1118.466 *** 645.0907 *** 992.6317 ***
mo_N1
Groundnut (80.98535) (76.71514) (67.07537)
1020.562 *** 913.6473 *** 990.6962 ***
mo_N0
(36.98241) (49.86485) (30.09774)
N 494 190 684
N1 58 21 79
Nz1 498 169 667
*** = significant at 1%, ** = significant at 5%, * = significant at 10%.
3.2.1. Impact of the Use of SF on Agricultural Income
Table 10 presents the results of the impact of the use of SF on the agricultural income. Results
show that the users of SF had an additional income of 23,958 XOF per ha (41 $/ha). This impact was
greater among men 32,397 XOF/ha (56$) than women (6181 XOF/ha or 11$).Atmosphere 2020, 11, 1127 13 of 19
Table 10. Impact of the use of SF on agricultural income.
Sex
Parameter Total
Male Female
32,397.39 *** 6181.402 *** 23,958.69 ***
late
(0.0000325) (0.0001088) (0.0000422)
27,598.3 * 9,348.923 22,000.85
diffmo
(15,294.84) (28,806.81) (14,267.06)
167,669.1 *** 139,953.9 *** 157,701.4 ***
mo_N1
(14,302.91) (28,259.36) (13,725.42)
140,070.8 *** 130,605 *** 135,700.5 ***
mo_N0
(5418.383) (5589.377) (3893.842)
N 614 505 1119
N1 73 41 114
Nz1 625 404 1029
*** = significant at 1%, * = significant at 10%.
3.2.2. Determinants of the Use of Seasonal Forecast
We ran regressions for men, women and the entire population. Results (Table 11) show that the
possession of a radio, the marital status, the cultivated area, the relation with extension services and
formal education had significant and positive effects on the use of seasonal forecast among women.
Membership of a farmers’ organization and the relation with extension services had significant and
positive effects on the use of seasonal forecast among men.
Table 11. Determinants of the use of SF.
Male Female Total
0.0034566 0.000378 0.0014755
Age
(0.0082109) (0.0110395) (0.0064131)
0.1812215 0.3810792 *** 0.275444 ***
Marital status
(0.3216277) (0.1146524) (0.0871562)
0.0573637 0.5526512 ** 0.26932 **
Formal education
(0.1701313) (0.2372697) (0.132962)
0.7012365 *** 0.4330179 0.5835314 ***
Member of farmers’ organization
(0.2163828) (0.3008535) (0.1726379)
0.0005645 0.0094195 0.0063591
Experience as farmers
(0.0086495) (0.0117617) (0.0067245)
−0.2798718 * 0.0128041 −0.2015533 *
Relation with project/NGO
(0.1510792) (0.2069646) (0.1177484)
0.5308142 *** 0.4660759 ** 0.4868922 ***
Relation with extension services
(0.1667767) (0.2346389) (0.1326463)
0.3577431 0.0113474 0.2414714
Microfinance
(0.3173143) (0.3863392) (0.2309711)
−0.0259562 −0.0817045 −0.2101631
Mobile phone
(0.3436625) (0.2368866) (0.183789)
−0.0352541 0.6718186 ** 0.2486221
Radio
(0.1961114) (0.3276947) (0.1572521)
−0.0566698 0.1878422 0.068666
No. of crops
(0.0822458) (0.1243009) (0.0638056)
−0.0001077 −0.0167238 −0.0072855
Household size
(0.0083762) (0.0128195) (0.0069477)
−0.0232625 0.0018982 −0.0185195
Confident in Met Services
(0.1481973) (0.1966192) (0.1151159)
0.0062862 0.0737118 ** 0.0151248
Cultivated area
(0.0104398) (0.0344085) (0.009668)
−2.001753 *** −3.567293 *** −2.503482 ***
Constant
(0.6677693) (0.7214265) (0.4097876)
No. of observations 614 418 1104
LR chi2(18) 34.81 41.27 69
Prob > chi2 0.0016 0.0002 0
Pseudo R2 0.0777 0.1539 0.0941
*** = significant at 1%, ** = significant at 5%, * = significant at 10% () standard error.Atmosphere 2020, 11, 1127 14 of 19
4. Discussion
4.1. Impact of the Use of SF on Crops and Income
The results indicate that the use of SF can improve crop yields, especially for cereals such as rice,
millet and maize, and thereby increase production. In doing so, it greatly contributes to achieving food
security as, in Senegal in particular, the diet is largely dominated by cereals. The results also show that
the use of SF has a significant effect on producers’ incomes. Therefore, by increasing the production
and farmers’ incomes, the SF has become a good adaptation strategy for farmers in West Africa.
Several researchers have proposed the use and application of SF as a tool for reducing risks of climate
variability from a number of biophysical and social perspectives [18,51–53]. Similar results were found
by several authors who used ex ante evaluation methods to determine the impact of the use of SF.
Dabire et al. [54] has demonstrated that there is a slight income gain after the use of SF in rural areas in
Burkina. Sultan et al. [14], through the analysis of previous studies, showed that farmers can achieve
an increased income and risk reduction through the use of SF despite its uncertainty and imperfection.
The results of the study confirmed those found by Lo and Dieng [19], who showed that the use of SF in
Senegal increases the agricultural yields. Comparable results have been found also in South Africa by
O’Brien et al. [26]. However, the SF cannot be valued without strategic decision-making in the context
of production management. The benefit arises only through viable decision options that are sensitive
to forecast information [55]. The accompanying operational decision might involve deciding which
variety of crop to plant in order to achieve maximum yields [51]. In the framework of this study, the
following decisions have been considered by men and women: the choice of early maturing variety,
the sowing date, the ploughing period and the type of crop to grow. Similar studies [18,25,26,41,56]
have demonstrated the use of such adaptation strategies in response to seasonal forecasts. The study
of O’Brien et al. [26] examines if and how farmers received, used and perceived the forecasts in the
1997/98 agricultural season in Namibia, South Africa and Tanzania. The results showed that farmers,
in addition to the previous decisions, decide with the SF, the fertilizer spreading date and type and the
choice of the crop location. Farmers from Niger chose in majority to change the sowing date and the
type of crop following the reception of SF as mentioned by Tarhule and Lamb [56]. All these strategic
decisions lead directly to improved crop yields.
4.2. Gendered Impact of the Use of SF
The results show that the use of SF gives different benefits according to sex. Several reasons can
explain these differences. Firstly, men and women play different roles within particular systems of
agricultural production and occupy different socioeconomic positions [1]. Traditionally, there is crop
specialization by sex in rural areas in Senegal: women cultivate cereal crops called food crops while
men focus mainly on cash crops. In the 2000s, Soumaré [57] showed that, in Senegal, women managed
56% of the total area of rice cultivation, 49% of the area under hibiscus (bissap) cultivation, 27% of the
area under bean cultivation and 17% of the area under groundnut cultivation [27]. This means that
women have little opportunity to change the type of crop when it is required after the reception of the
SF. Secondly, women suffer from inequalities in terms of access to land and labor. They have smaller
areas of land, which has resulted from historical social and legal barriers that have limited their access,
their educational opportunities and their economic advancement in rural areas [27]. It is much easier
for men to choose to cultivate on a given type of plot. As an example, depending on the season, it is
sometimes more profitable to use varieties of rice at the level of the plateau. However, in these areas,
most of the women do not have access to the plateau; their plots are in the lowlands. Thirdly, women
also have limited access to credit and financial resources to enable them to make appropriate decisions.
In fact, the decisions resulting from the seasonal forecast may be linked to the application or not of
cropping operations (fertilization, weeding, application of pesticides) at defined periods and the lack
of resources does not favor these operations. In addition to this, women are less adaptive becauseAtmosphere 2020, 11, 1127 15 of 19
of financial or resource constraints because male domination in receiving information and extension
services and because available adaptation strategies tend to create higher labor loads for women [3].
Moreover, the results show that the use of SF has a positive impact in particular on the yield
of millet, sorghum, groundnut and rice for men and maize for women. Two main reasons can be
considered. One is that women are the most involved in household food consumption and maize is a
favored staple in the diet in rural areas in Senegal. Maize is the third most consumed cereal in rural
areas, with an average of 19.5 kg per head per year. In the central–north region of the country and the
south of the groundnut basin (main area of the survey), the consumption averages are significantly
higher [58]. Thus, the price of the maize is quite competitive when compared to other crops. Given
these facts, women can decide with regard to the behavior of the season to maximize their profit on
maize to the detriment of other crops. As demonstrated, men with better access to productive resources
can choose to maximize their profit by focusing one one or more speculations, as shown by our results.
4.3. Determinants and Limits for the Uptake of SF
The study indicates also that the following factors influence actively the use of seasonal forecast
among women: the level of education, the ownership of a radio, the number of cultivated crops and
the collaboration with extension services. Indeed, the level of education can influence the level of
appropriation and understanding of climate information. As an example, an individual who has an
advanced education level is more likely to understand and adopt the seasonal forecast. In sub-Saharan
Africa, women are less likely than men to have a formal education. This can lead to misunderstanding
of SF by women; as Jost et al. [3] showed in their study in Uganda, “Women did not seem to understand
the seasonal forecast or its implication for agricultural decision-making, while men were able to
do so”. Concerning the extension services, sociocultural norms limit women’s interactions with
extension services that are in charge of agroclimatic training [59]. This reduces the chance of women to
use effectively the SF. Besides, appropriate forecast use requires effective communication of relevant
information [55]. The radio is the most used channel for WCIS dissemination. This explains why people
who possess and listen regularly to the radio are likely to obtain weather information [12,22,40,60].
Among men, membership of farmers’ organizations influences significantly the use of SF. Indeed,
membership of a producers’ organization is also an important factor that can improve the use of SF.
Populations in rural areas identify themselves more with their social groups. This is why many authors
have proposed using this group for the dissemination of new technologies. In the area of climate
services in particular, Diouf et al. [40] suggested that to facilitate access to climate information services
for relevant decision-making, it is essential to improve the capacity of farmers in WCIS use and to
consider the producers’ organizations as platforms for WCIS dissemination and training.
One of the major limitations of studies on seasonal forecasting is the impossibility of generalizing
the results. The use of climate prediction by agriculture is still too new to support strong generalizations
about its value [55]. The current study was carried out during the 2017–2018 agricultural season when
the seasonal forecast was predicted to fall within the average status of the last 30-year rainy season
(“normal”). A “normal” amount of rainfall is the middle third (tercile) of the average rainfall for the
past number of years of rainfall data used to develop the forecast [51]. The results may be different if
the season is above normal or below normal and if other decisions are made. Indeed, ex ante studies
have shown that for the different forecast categories (dry year, wet year and normal year), the economic
benefits are different. Sultan et al. [14] have shown that the economic value of using the seasonal
forecast is much greater in a dry year. They found an added value of 80% profit in income compared
to the situation without the use of seasonal forecasting. In Senegal in particular, they found that the
expected profit was higher in wet years (+12%) than in dry years (+7%). This is because, in a wet year,
the use of long-cycle varieties and fertilizers improves yields and these adjustments are less obvious in
a dry year. This leads us to say that the impact observed in this current study may be higher if the
forecast was dry season or wet season. Moreover, despite these observed differences in profits, it has
been also demonstrated that the impact of the forecast error is lower if the year is normal, i.e., theAtmosphere 2020, 11, 1127 16 of 19
economic cost of an error in the forecast is almost zero when the season is forecasted to be a normal
season. Indeed, an error in the forecast may lead the farmer to make the wrong decisions. The type
of decision to be made following the receipt of the seasonal forecast is therefore important because a
farmer who chooses to grow a long-cycle variety when a short rainy season is forecast risks heavy
losses. This is why it is important to make appropriate decisions for each type of forecast. Therefore, it
is essential to strengthen the capacity of SF users for appropriate decision-making. In Senegal, the
weather forecast is very often given during seminars organized by the National Met Service [7,12].
These seminars are an excellent framework for both male and female producers to express themselves
but also to understand the most effective decisions to make during the crop year. Unfortunately, during
these workshops, very few women are represented.
In many cases, even if the effects of weather information are considered very small, it is clear that
the absence of this information further exposes farmers to the highest risks. Predicting a dry year in
Senegal, for example, would avoid investing in crops with high production costs. As highlighted in
this paper, the SF is beneficial for the improvement of crop production in the context of climate change
but there is little uptake and use for both women and men.
5. Conclusions
The seasonal forecast is found to be one of the best adaptation strategies for rural populations
whose farming activities depend mainly on rainfall patterns. This study assessed the gendered impact
of the use of SF on the yield of main cereal crops and on agricultural income in a rural community in
Senegal. It was demonstrated that farmers have an additional yield for millet, sorghum and rice and an
additional gain in their net income. This revealed that the seasonal forecast significantly improves the
productivity and farmer’s income and therefore enhances food security, particularly when appropriate
decisions are taken for crop production. The study also showed that the impact was higher within male
farmers than within female farmers. Male potential adopters of SF have a higher surplus of production
in millet, sorghum and rice, whereas female potential adopters have a higher surplus uniquely of
rice. Thus, the use of SF benefits men and women differently. This is explained by the limited access
of women to productive resources such as land, credit, inputs, etc., which reduce their capacity to
quickly take appropriate decisions after the reception of SF. The low access to information is also a
key constraint for women. It appears that closing the gender gap in agriculture is essential for the
promotion of any resilient technologies.
Considering these findings, we recommend policies to extend the access to SF in rural areas,
particularly among women. The dissemination through training and awareness raising should be
promoted to allow social groups to make good use of it by making appropriate decisions. Selective
targeting should be applied for women during the process of dissemination. Women’s associations
should be targeted. In addition, institutional policies are needed for sustained use of seasonal forecast.
Indeed, the study showed that the impact of the use of SF is lower for female farmers due to inequalities
in rural areas. So, to improve women’s access to and use of SF, it is primordial to facilitate their
access to land, inputs and financial resources. Land access policies must be revised for women and
funding schemes established for them. Subsidy policies should be targeted primarily at female farmers.
These measures will help to sustain the access to and use of SF and reinforce the resilience of rural
communities, particularly female farmers.
Author Contributions: N.S.D., M.O., I.O. and G.A. designed, performed the data collection and analyzed them.
N.S.D., M.O., I.O., R.Z. and G.A. wrote the paper. All authors have read and agreed to the published version of
the manuscript.
Funding: This research received no external funding.
Acknowledgments: The authors acknowledge the USAID funding support to the CINSERE project in Senegal
and we are thankful to the IPAR for data collection and the community (fisherfolk and key informants) for their
collaboration. USAID/CINSERE project is implemented through ICRISAT by the CGIAR Research Program on
Climate Change, Agriculture and Food Security (CCAFS), a strategic partnership of CGIAR and Future Earth,
led by the International Center for Tropical Agriculture (CIAT) and carried out with support from CGIAR FundAtmosphere 2020, 11, 1127 17 of 19
Donors and through bilateral funding agreements (for details, please visit https://ccafs.cgiar.org/donors). We
would like to express our deepest gratitude to the technicians of ANACIM who carried out the training on
the ground.
Conflicts of Interest: The authors declare no conflict of interest.
References
1. Carr, E.R.; Fleming, G.; Kalala, T. Understanding Women’s Needs for Weather and Climate Information in
Agrarian Settings: The Case of Ngetou Maleck, Senegal. Weather Clim. Soc. 2016, 8, 247–264. [CrossRef]
2. Duong, M.T.; Smith, A.; Le, T.T.; Simelton, E.; Coulier, M. Gender-Differences in Agro-Climate Information
Services (Findings from ACIS Baseline Survey in Ha Tinh and Dien Bien Provinces, Vietnam); CCAFS Info Note;
CGIAR Research Program on Climate Change, Agriculture and Food Security (CCAFS): Wageningen, The
Netherlands, 2017.
3. Jost, C.; Kyazze, F.; Naab, J.; Neelormi, S.; Kinyangi, J.; Zougmore, R.; Aggarwal, P.; Bhatta, G.; Chaudhury, M.;
Tapio-Bistrom, M.-L.; et al. Understanding gender dimensions of agriculture and climate change in
smallholder farming communities. Clim. Dev. 2016, 8, 133–144. [CrossRef]
4. Partey, S.T.; Dakorah, A.D.; Zougmoré, R.B.; Ouédraogo, M.; Nyasimi, M.; Nikoi, G.K.; Huyer, S. Gender and
climate risk management: Evidence of climate information use in Ghana. Clim. Chang. 2018, 158, 61–75.
[CrossRef]
5. Adams, M.R.; Hurd, H.B.; Lenhart, S.; Leary, N. Effects of global climate change on agriculture:
An interpretative review. Clim. Res. 1998, 11, 19–30. [CrossRef]
6. Gregory, P.J.; Ingram, J.S.I.; Brklacich, M. Climate change and food security. Phil. Trans. R. Soc. 2005, 360,
2139–2148. [CrossRef] [PubMed]
7. Roudier, P.; Sultan, B.; Quirion, P.; Berg, A. The impact of future climate change on West African crop yields:
What does the recent literature say? Glob. Environ. Chang. 2011, 21, 1073–1083. [CrossRef]
8. Eltayeb, M.M. The Climate Change Impact on Crop Yield in Sub-Saharan African Countries Production Function
Approach; Howard University: Washington, DC, USA, 2017.
9. Blanc, E. The Impact of Climate Change on Crop Yields in Sub-Saharan Africa. Am. J. Clim. Chang. 2012, 1,
1–13. [CrossRef]
10. Jalloh, A.; Nelson, G.C.; Thomas, S.T.; Zougmore, R.; Roy-Macauley, H. West African Agriculture and Climate
Change: A Comprehensive Analysis; International Food Policy Research Institute: Washington, DC, USA, 2013.
[CrossRef]
11. FAOSTAT. Base de Données Statistiques de la FAO. Disponible à L’adresse Suivante: Faostat.Fao.org.; FAOSTAT:
Rome, Italy, 2005.
12. Ouedraogo, I.; Diouf, N.S.; Ouédraogo, M.; Ndiaye, O.; Zougmoré, R. Closing the Gap between Climate
Information Producers and Users: Assessment of Needs and Uptake in Senegal. Climate 2018, 6, 13.
[CrossRef]
13. Roudier, P.; Muller, B.; d’Aquino, P.; Roncoli, C.; Soumaré, M.A.; Batté, L.; Sultan, B. The role of climate
forecasts in smallholder agriculture: Lessons from participatory research in two communities in Senegal.
Clim. Risk Manag. 2014, 2, 42–55. [CrossRef]
14. Sultan, B.; Roudier, P.; Quirion, P. Les bénéfices de la prévision saisonnière pour l’agriculture en Afrique de
l’Ouest. Sécheresse 2013, 24, 304–313. [CrossRef]
15. Roncoli, C.; Ingram, K.; Kirshen, P. Reading the Rains: Local Knowledge and Rainfall Forecasting in Burkina
Faso. Soc. Nat. Resour. 2002, 15, 409–427. [CrossRef]
16. Klopper, E. The use of seasonal forecasts in South Africa during the 1997/98 rainfall season. Water SA 1999,
25, 311–316.
17. Rauch, M.; Bliefernicht, J.; Laux, P.; Salack, S.; Waongo, M.; Kunstmann, H. Seasonal Forecasting of the Onset
of the Rainy Season in West Africa. Atmosphere 2019, 10, 528. [CrossRef]
18. Vogel, C.; O’Brien, K. Who can eat information? Examining the effectiveness of seasonal climate forecasts
and regional climate-risk management strategies. Clim. Res. 2006, 33, 111–122. [CrossRef]
19. Lo, H.M.; Dieng, M. Impact Assessment of Communicating Seasonal Climate Forecasts in Kaffrine; Final Report for
CCAFS West Africa Regional Program; Thies and Fatick (Niakhar) Regions in Senegal: Diourbel, Senegal;
Louga, Senegal, 2015; p. 70.You can also read