ESPON Factsheet Extended version - Molise, Italy - Innova Molise
←
→
Page content transcription
If your browser does not render page correctly, please read the page content below
ESPON
   Factsheet
Extended version

    Molise, Italy

 ESPON Project TerrEvi
    January 2013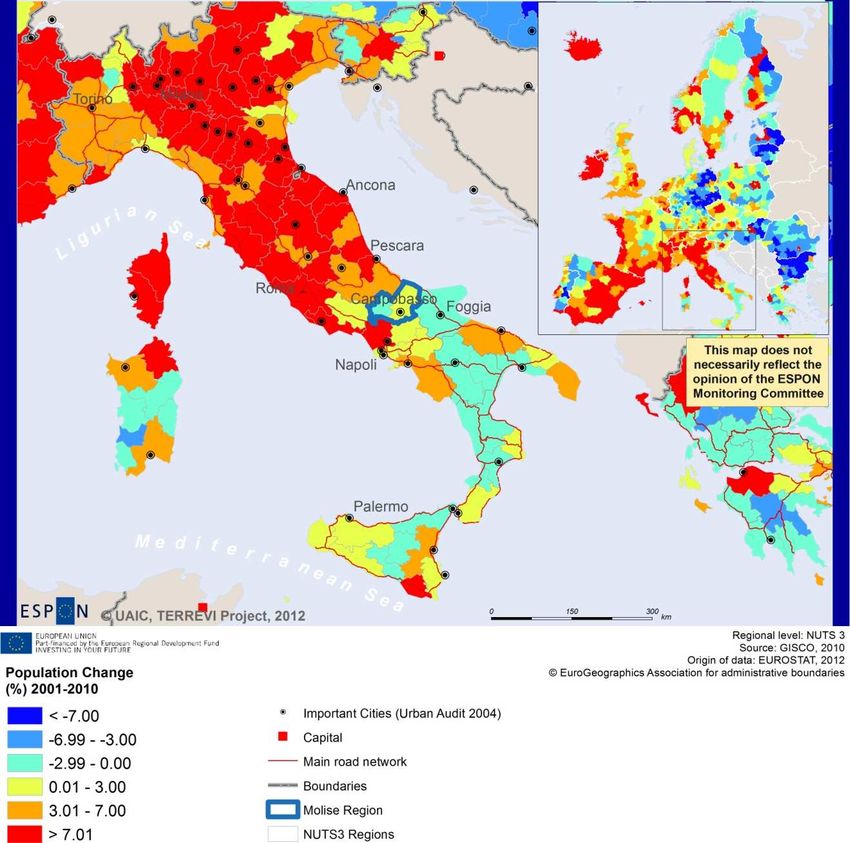
2
Contents
Introduction ............................................................................................................... 5
  Context information .................................................................................................... 6
     Population change .................................................................................................... 6
     Share of old people .................................................................................................. 7
     GDP in PPS per capita ............................................................................................... 8
     Gender gap in unemployment .................................................................................... 9
1.       Smart, Sustainable and Inclusive growth ........................................................ 10
  1.1.     Smart growth ................................................................................................. 10
     Total Intramural R&D expenditure ............................................................................ 11
     Employment in knowledge-intensive sectors .............................................................. 12
     Territorial patterns of innovation .............................................................................. 13
     E-commerce .......................................................................................................... 15
  1.2.     Sustainable Growth ......................................................................................... 16
     Wind energy potential ............................................................................................ 17
     Solar energy potential ............................................................................................ 18
     Ozone concentration .............................................................................................. 19
     Combined adaptive capacity to climate change .......................................................... 20
     Potential vulnerability to climate change ................................................................... 21
  1.3.     Inclusive Growth ............................................................................................. 22
     Change in labour force after different scenarios ......................................................... 22
     Employment rate ................................................................................................... 24
     Long-term unemployment rate ................................................................................ 25
     Persons with upper secondary/tertiary education attainment ....................................... 26
     Participation of adults (aged 25 to 64) in education and training .................................. 27
     At-risk-of poverty rate ............................................................................................ 28
2.       Territorial factors of interest for the programme area .................................... 29
     Urban-rural typology .............................................................................................. 29
     Multimodal accessibility .......................................................................................... 31
Recommended ESPON reading ................................................................................. 32
Scientific references ................................................................................................. 33

                                                                                                                            3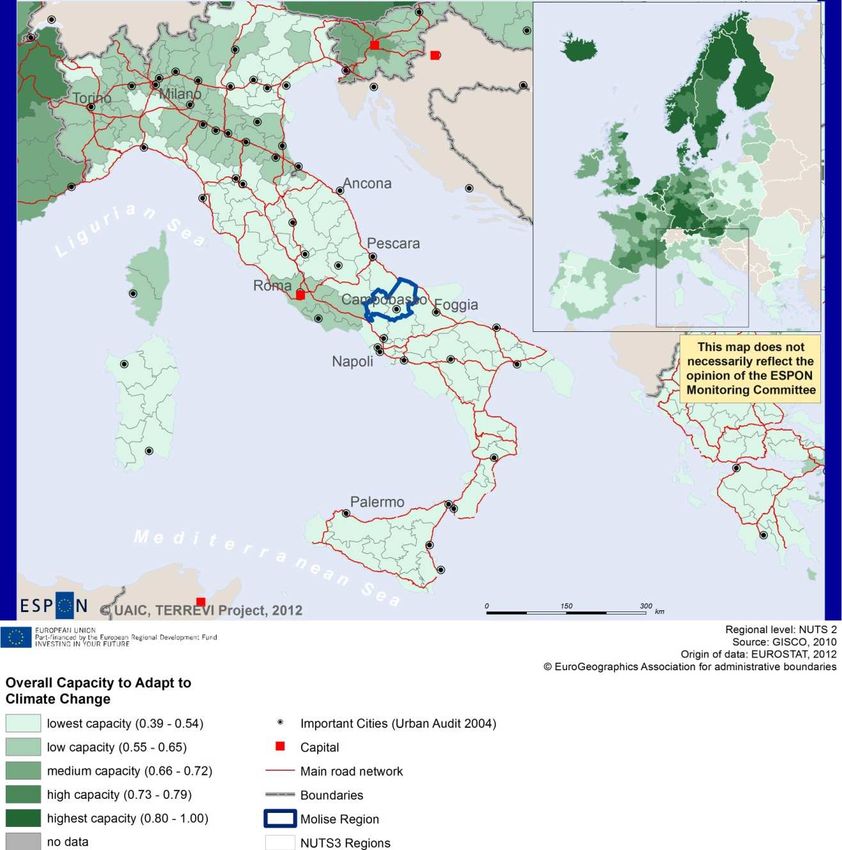
List of Maps

Map   1 Population change ............................................................................................... 6
Map   2 Share of old people .............................................................................................. 7
Map   3 GDP (PPS) per capita ........................................................................................... 8
Map   4 Gender gap in unemployment ............................................................................... 9
Map   5 Share of R&D expenditure on GDP ..................................................................... ...11
Map   6 Employment in knowledge intensive services ..................................................... ....12
Map   7 Territorial patterns of innovation........................................................................... 13
Map   8 Individuals who ordered goods or services over the internet ................................... 15
Map   9 Wind power potential (m/s/km2)......................................................................... 17
Map   10 Solar power potential........................................................................................18
Map   11 Ozone concentration exceedances.......................................................................19
Map   12 Combined adaptive capacity to climate change ....................................................20
Map   13 Potential vulnerability to climate change ............................................................. .21
Map   14 Change in labour force ....................................................................................... 23
Map   15 Employment rate .............................................................................................. 24
Map   16 Long-term unemployment rate ........................................................................... 25
Map   17 Persons with upper secondary or tertiary education ............................................... 26
Map   18 Participation of adults in education and training .................................................... 27
Map   19 Population at risk of poverty or social exclusion .................................................... 28
Map   20 Urban-rural typology of NUTS-3 regions including remoteness..………………………………….30
Map   21 Multimodal potential accessibility ........................................................................ 31

                                                                                                                          4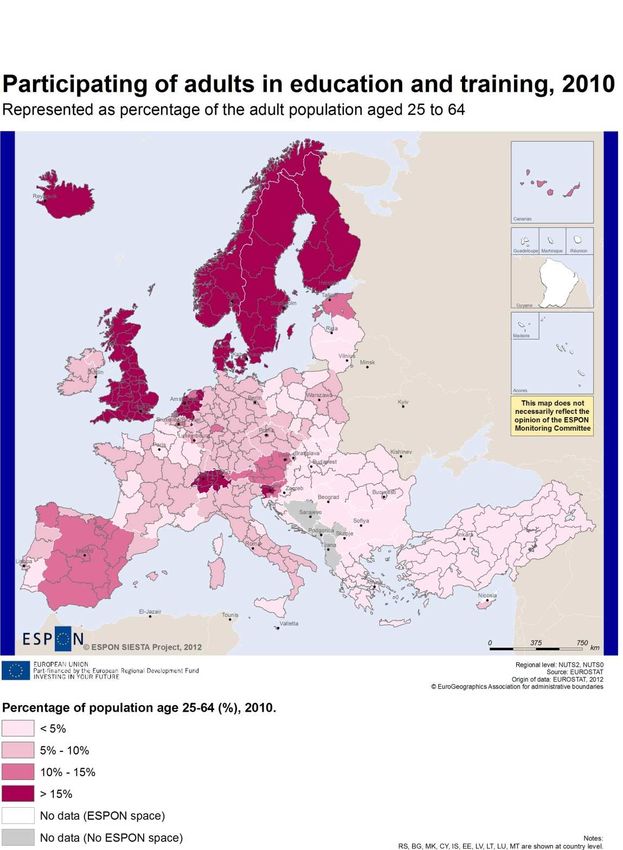
Introduction
ESPON supports policy development in relation to the aims of territorial cohesion and
harmonious development of the European territory. It provides comparable information,
evidence, analysis, and scenarios on territorial dynamics, which reveal territorial capitals and
development potentials of regions and larger territories. Considering the programme area in its
European context adds an important new perspective that can help shaping the programming
and the places of implementing projects.
The ESPON TerrEvi project focuses on producing evidence for Structural Funds programmes
with the aim to support the development of the programmes to be carried out in the 2014-
2020 period. One milestone of this work consisted in presenting selected ESPON research
pieces in easy-to-understand factsheets for all territorial cooperation programme areas. The
aim is to provide the reader with preliminary insight on types of territorial evidence ESPON
holds at hand with regard to the possible investment priorities of future programmes.
(Link to the factsheets on the ESPON website)
In addition to the programme factsheets there will be ten specific programme case studies
illustrating how ESPON material can be used to support the development of future
programmes e.g. by giving a comparative European dimension to the envisaged SWOTs. These
case studies will be carried out in the first quarter of 2013.
Thus ten extended factsheets have been produced to build the basis for the work of the case
studies. This extended factsheet1 comprises the structure of the regular factsheet for the
programme including widespread additional information. Furthermore useful context indicators
for the case study programme have been added.

1
    This extended factsheet does not necessarily reflect the opinion of the ESPON Monitoring Committee.

                                                                                                          5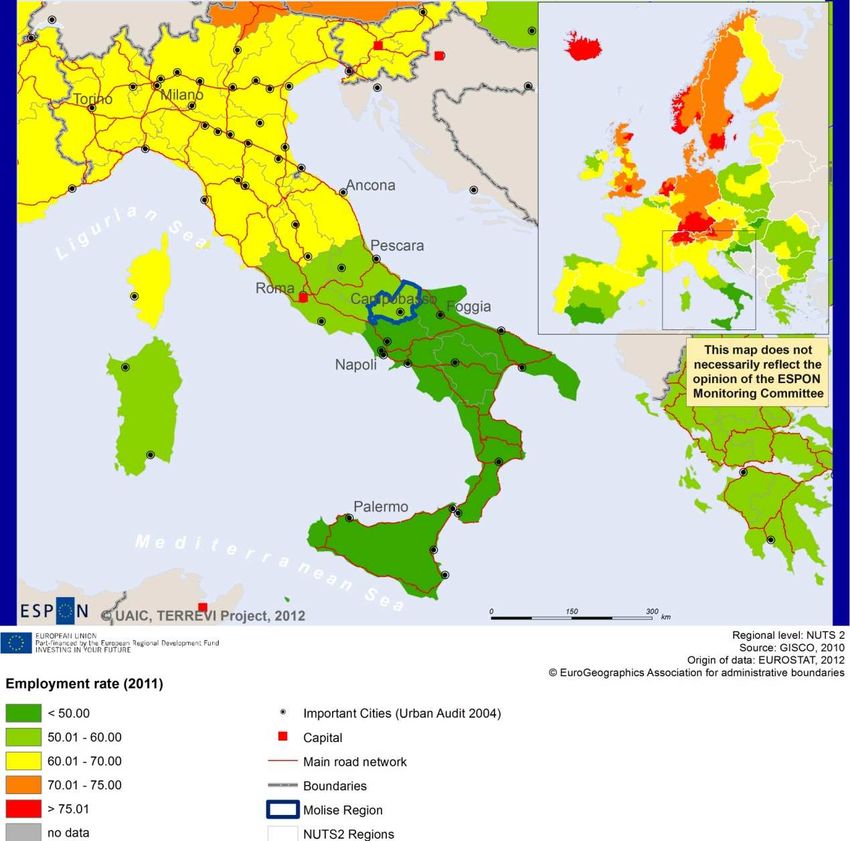
Context information

Population change
Definition
Population change is defined as the difference in population size on 1 January of two
consecutive years2.

                                           Map 1 Population change

Molise region falls in the demographic picture characteristic for Southern Italy (Mezzogiorno),
where selective migration of population caused a steady deterioration of the indicators of
fertility, birth traditionally higher than in other regions of Italy having failed to offset migration.

Key facts
Between 2001 and 2010, the Region of Molise did not have very dynamic population change.
Figures are positive and comprised between 0 and 3.0% for the province of Campobasso and
negative, varying between 0 and -3.0% in the province of Isernia.

2
    See http://epp.eurostat.ec.europa.eu/statistics_explained/index.php/Glossary:Population_change
                                                                                                     6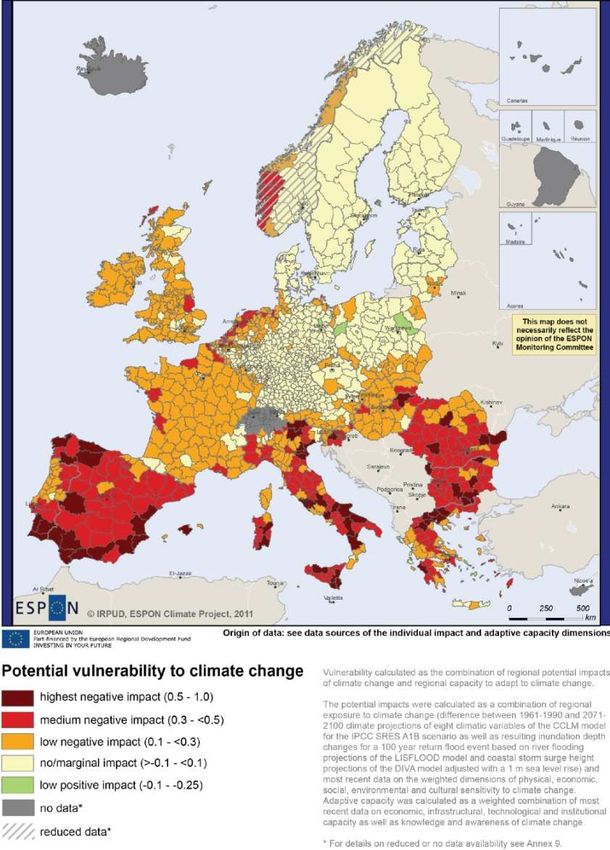
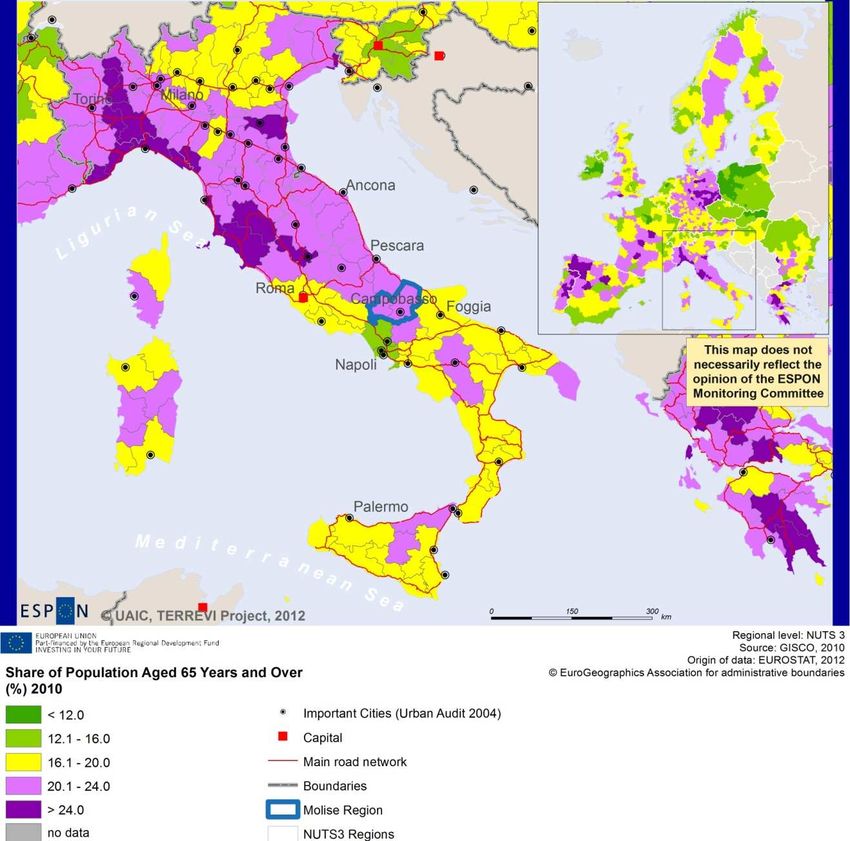
Share of old people
Definition
The indicator measures the ratio between people aged 65 years and over and the total
population. The impact of demographic ageing within the European Union (EU) is likely to be of
major significance in the coming decades. Consistently low birth rates and higher life
expectancy will transform the shape of the EU-27’s age pyramid.

                                Map 2 Share of old people

Key facts
In line with a majority of Italian regions but above the majority of European regions, both
provinces of Molise have a share of population aged over 65 years comprised between 20.1
and 24.0%.
Although located in an area characterized by early and intense manifestation of selective
migration, Molise region managed to maintain a demographic picture less aging compared with
other central-southern regions of Italy, due to less pronounced damage of fertility indices.
The increased share of elderly population in both provinces of the region is influenced by
progress made in recent decades in terms of life expectancy at birth, coupled with the entry
into older cohorts of more numerous generations born after the Second World War emphasized
aging process.

                                                                                            7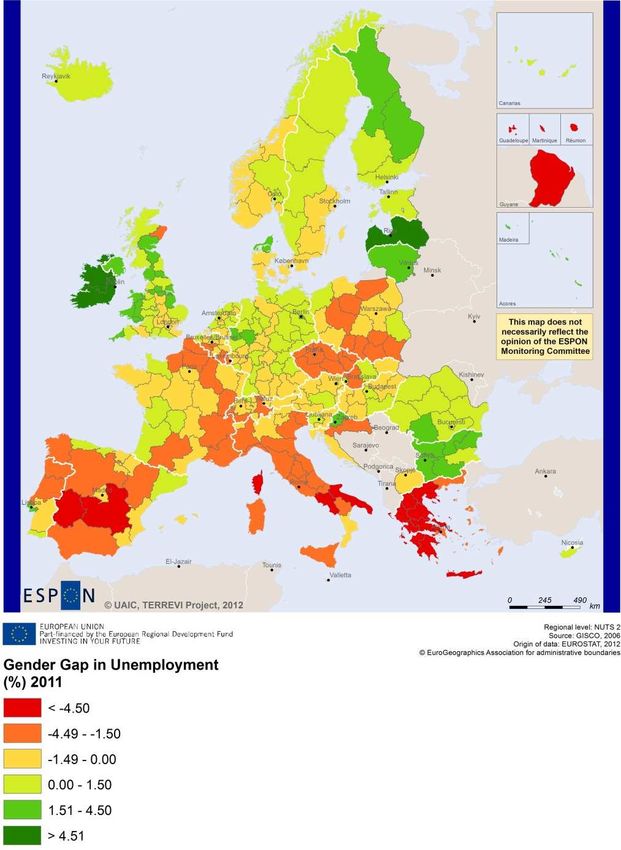
GDP in PPS per capita
Definition
GDP (PPS) per capita is measured by the ratio between the level of gross domestic product,
expressed in purchasing power standards, and total population. Obtained by converting GDP to
a fictive currency using special conversion factors, GDP in PPS per capita can be used to make
comparisons across countries by eliminating both the differences in currency expression and
the differences in the prices levels between the countries. At EU level, the spatial distribution
of GDP respects the principle of spatial autocorrelation, few deviations from the rule being
generated either by the presence of competitive urban centers either by the border effect.

                                Map 3 GDP (PPS) per capita

Key facts
The GDP values of the two NUTS 3 regions composing Molise, i.e. the provinces of Campobasso
and Isernia, correspond to values identified in the rest of Central Italy. Most regions in Old
European Member State, outside capital and main cities, show similar figures.

                                                                                               8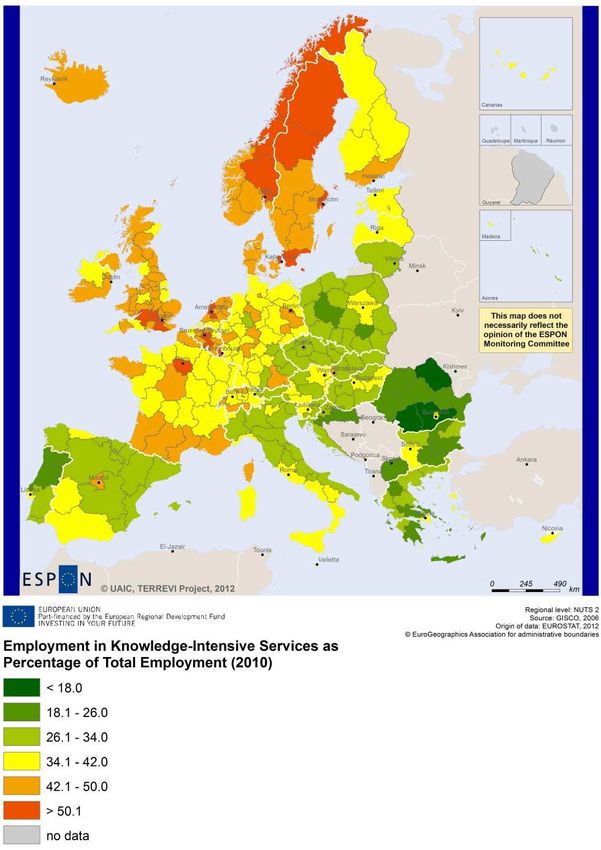
Gender gap in unemployment
Definition
According to Eurostat, the unemployment rate is the ratio between the unemployed people, -
i.e. people aged 15 to 64 that are without work during the reference week, have actively
sought employment and are still available to start work within the next two weeks – and the
labour force (including both unemployed and employed people). Gender gap is calculated as
the difference between male and female unemployment rates. A positive gap indicates a higher
unemployment rate for men than women.

                          Map 4 Gender gap in unemployment

Key facts
Gender gap in unemployment gives hints of disparities existing between men and women. Yet,
their are big discrepancies as far as Molise is concerned. The regional value is amongst the
lowest in Europe. However, it is in the Italian average.

                                                                                          9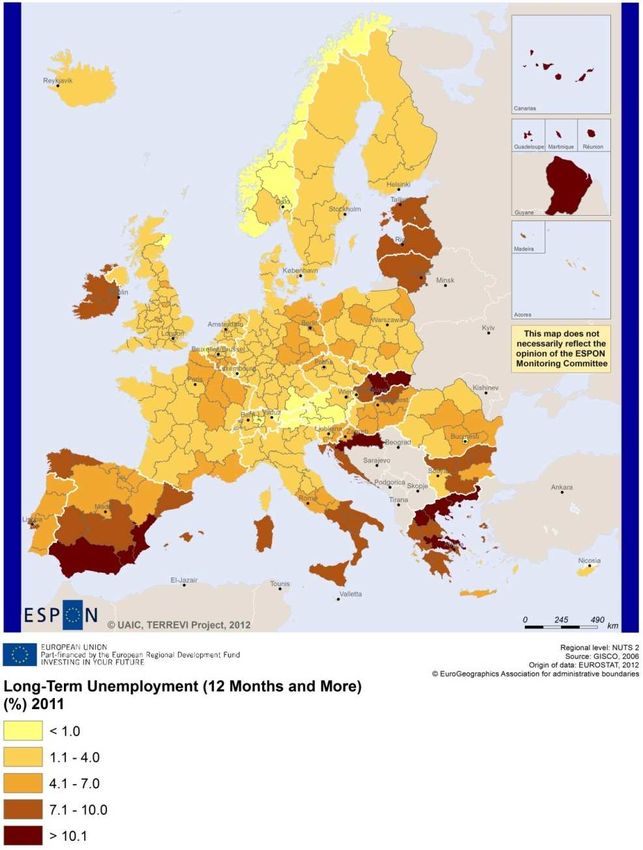
1. Smart, Sustainable and Inclusive growth
Europe, with its member states and their regions, is more exposed to global shocks and
international competition than at any time before. As the world becomes more interdependent
this trend will continue and shape policy thinking across sectors, borders and geographical
scales. At the same time, Europe is characterised by a large territorial diversity meaning that
global developments can imply rather different development possibilities and challenges for
different European regions and cities. The differences are partly associated with urban
systems, accessibility and connectivity, the geographical specificity or population density. At
the same time, the differences are also spelled out in the larger development trends that affect
an area and the way and degree to which it is affected.
The data, indicators and territorial evidence provided by ESPON provides insight on both the
main structures and larger territorial trends. This chapter provides a selection of ESPON data
related to Europe 2020 objectives of smart, sustainable and inclusive growth, giving also hints
as regards the main thematic objectives envisaged in the draft regulations for the next period
of EU Cohesion Policy. The Europe 2020 Strategy aims to enhance smart, sustainable and
inclusive growth. This strategy has clear territorial dimensions.
The following traffic lights for each indicator represent how the programme territory performs
compared with the wider European medians. In the traffic light, green indicates that the TNC
area performs better for that indicator, yellow in a similar way, and red worse. The median
value, calculated depending on the values registered for every NUTS-2 / NUTS-3 region
composing the programme area, was used as the central value indicator. The median of the
programme area was compared to the one computed for EU-27+4 territory. EU 27+4 in traffic
lights means the EU Member States as well as Iceland, Liechtenstein, Norway and Switzerland
– the ESPON space.

   1.1.            Smart growth
Smart growth refers to developing an economy based on knowledge and innovation. In the
framework of the Europe 2020 Strategy it means improving the EU's performance in
education, research/innovation and digital society. This section provides further details on the
definition and the key facts of the indicators used for measuring smart growth as total
intramural R&D expenditure, employment in knowledge-intensive sectors and territorial
pattern of innovation.

                                                                   value of the region                Italy                EU-27+4

           Total Intramural R&D Expenditure (GERD).
           Percentage of the GDP (2009)
                                                                            ●
                                                                            0.50               0.99 ● ●               1.22

           Employment in knowledge-intensive services as
           percentage of total employment (2010)
                                                                              ●

                                                                             33                  33
                                                                                                    ● ●                   39

           Percentage of individuals regularly using
           internet (2011)
                                                                              ●

                                                                             48                  53 ● ●                   71

          The value in front of each traffic-light represents the median value of the country and of the EU-27+4 space.
          Thresholds for detecting disparities using the variation coefficient: low < 15%, medium 15 - 30%, high > 30%
          Regional level of analysis: NUTS 2
          Origin of data: EUROSTAT 2012

Molise has a worse or similar performance to Italy and EU27+4 for all the Smart Growth
Indicators, except for employment in knowledge-intensive services compared to Italy.
                                                                                                                                     10
Total Intramural R&D expenditure
Definition
OECD defines intramural expenditures as all ‘expenditures for research and development
(R&D) performed within a statistical unit or sector of the economy during a specific period,
whatever the source of funds. Expenditures made outside the statistical unit or sector but in
support of intramural R&D (e.g. purchase of supplies for R&D) are included. Both current and
capital expenditures are included’3.
Map 5 Share of R&D expenditure on GDP
Molise is one of the NUTS-2 Italian regions with the lowest shares of R&D expenditure on GDP
(0.5%) compared with the national average (1.08%) and with most of the Southern - Eastern
regions as well. At EU level, the position of Molise for this indicator is even lower: the EU
average is 1.56 %.
Key facts
Total intramural R&D expenditures in Molise are by far the amongst the lowest in both Italy
and Europe. The average value, lower than 0.5% of the GDP, is comparable to values mainly
observed in Romania and Bulgaria.
3
OECD Frascati Manual, Sixth edition, 2002, paras. 358-359, page 108
11Employment in knowledge-intensive sectors
Definition
OECD defines the employment in knowledge-oriented sectors as the ’employment in high-
technology manufacturing sectors and knowledge-intensive services’. In particular the
employment in knowledge-intensive services corresponds to the following ISIC divisions: 61
Water transport, 62 Air transport, 64 Post and telecommunications, 65 Financial
intermediation, except insurance and pension funding, 66 Insurance and pension funding,
except compulsory social security, 67 Activities auxiliary to financial intermediation, 70 Real
estate activities, 71 Renting of machinery and equipment without operator and of personal and
household goods, 72 Computer and related activities, 73 Research and development, 74 Other
business activities, 80 Education, 85 Health and social work and 92 Recreational, cultural and
sporting activities.
Map 6 Employment in knowledge intensive services
Key facts
The whole eastern coast of Italy as well as Central-Northern regions, including Molise, have
lower shares of employment knowledge than the EU median (38.99 %) and the EU average
values (38.59%). The low values in Molise are mainly linked to local specialization (agriculture,
industry) and the lack of major urban and research centres.
12In Molise, employment in knowledge-intensive services represents between 26,1% and 34% of
the total employment. The region performs according to the majority of the Italian region but
slightly underperforming compared to most regions of North-Western Europe.
Territorial patterns of innovation
Definition
The ESPON-KIT project provides a synthesis on different territorial patterns of innovation,
defined by a combination of territorial specificities (context conditions) underpinning various
modes of performing the phases of the innovation process. Each type of territorial pattern is
detailed in the key facts section.
Map 7 Territorial patterns of innovation
Key facts
The regional typology developed by the KIT project (Map 8) identifies several patterns of
innovation. The region is qualified as a “smart and creative diversification area”.
According to the study, this pattern is characterised by a low degree of local diversified applied
knowledge, internal innovation capacity, high degree of local competences, high degree of
creativity and entrepreneurship, external knowledge embedded in technical and organizational
capabilities.
A large majority of the regions, mostly situated in an extended central part, are qualified the
same way. In Europe, this pattern is common in Mediterranean Member States i.e. France,
Portugal, Spain and Greece.
13Box 1 Main features of the KIT clusters
European science-based areas:
• strong enablers (highly educated population, high level of R&D expenditure and high
share of inventors) support the endogenous capacity to: create new knowledge;
efficiently translate it into new products and processes as well as into managerial
and/or organizational changes; have a high accessibility and receptivity;
• a strong specialization in GPTs;
• an innovative attitude above the EU average (i.e. product, process,…);
• a knowledge of greater generality and originality than the EU average;
• lower levels of creativity potential, attractiveness and entrepreneurship than the EU
average.
Applied science areas:
• quite concentration of EU total patents, scientific human capital, R&D expenditures
and GPTs patents;
• quite high level of creativity and capabilities potential, attractiveness and
entrepreneurship;
• strong knowledge and innovation intensity, but lower than the previous cluster.
A smart technological application area:
• medium regional enablers for knowledge and innovation creation: high accessibility
and collective learning; high entrepreneurship (higher than EU average);
• good preconditions for knowledge and innovation acquisition: high creativity and
attractiveness, high receptivity (above EU average);
• very good capabilities and innovation potentials.
A smart and creative diversification area:
• high capabilities and innovation rely upon tacit knowledge and human capital;
• high knowledge and innovation variables under the EU average;
• strong enablers (creativity and attractiveness and above EU average) that help to
absorb and to adopt innovations developed elsewhere.
ESPON KIT project identifies three types of variables:
• the pre-conditions of knowledge economy, intended as the enablers of the innovation
process;
• the pre-conditions for knowledge acquisition;
• the knowledge and innovation flows.
The indicators for the pre-conditions for knowledge, innovation and accessibility are:
• R&D investments (GDP share)
• Patent share
• Specialisation / generalisation / originality of patents in GPTs and in advanced
domains
• Share of managers out of the total employees in SMEs
• Firm innovative capacity
• Share of inventors and researchers
• Share of population at tertiary education level
• Transport accessibility (Km of roads and railways)
The indicators used to measure the pre-conditions for knowledge acquisition are:
• Per capita funding from the Research Framework Programme as a proxy of
‘receptivity’
• Openness to innovation measured by Eurobarometer as a proxy of ‘creativeness’
• Difference from the EU average salary as a measure of attractiveness
In order to measure the knowledge and innovation flows, various indicators are taken into
account as share of GPTs patents, level of human capital in other regions etc.
14E-commerce
Definition
The recent ESPON-SIESTA project provides another relevant indicator for the EU2020 Strategy
which measures the expansion of the digital economy and the information society. This
indicator is defined as a percentage of individuals, aged 16 to 74, who ordered goods or
services over the Internet for private use in 2010.
Map 8 Individuals who ordered goods or services over the internet
Key facts
This picture confirms a similar result to the indicator reporting the use of internet. Molise
performs under the EU27+4 average and has a low value, similar to some Central and
Southern Italian regions.
151.2. Sustainable Growth
Sustainable growth refers to promoting a more resource efficient, greener and more
competitive economy. Within the Europe 2020 Strategy it means e.g. building a more
competitive low-carbon economy that makes efficient, sustainable use of resources, protecting
the environment, reducing emissions and preventing biodiversity loss, capitalising on Europe's
leadership in developing new green technologies and production methods, and introducing
efficient smart electricity grids. In the framework of the Europe 2020 Strategy it means focus
on competitiveness, resource efficiency, climate change and biodiversity.
median value of
the region Italy EU-27+4
Wi nd energy potenti al
●
10454 25597 ● ● 73939
●
Ozone concentration 10.1 24.9
● ● 8.6
Potential vulnerability to
climate change
●
0.51 0.33 ● ● 0.11
The value in front of each traffic-light represents the median value of the country and of the EU-27+4 space.
Thresholds for detecting disparities using the variation coefficient: low < 15%, medium 15 - 30%, high > 30%
Regional level of analysis: NUTS 2 (Wind energy potential), NUTS 3 (Ozone concentration, Potential
vulnerability to climate change)
Origin of data: ESPON ReRisk, ESPON INTERCO & ESPON Climate Projects
This section provides further details on the definition and the key facts of the indicators used
for measuring sustainable growth as wind energy potential, ozone concentration, combined
adaptive capacity to climate change, potential vulnerability to climate change.
16Wind energy potential
Definition
The indicator identifies the on-shore wind power potential and is measured by in m/s per km2,
taking into account for the size of the regions and the presence of Natura 2000 areas.
Map 9 Wind power potential (m/s/km2)
Key facts
The indicator shows a very low wind power potential for the region.
17Solar energy potential
Definition
The indicator identifies the potential for electricity production from photovoltaic panels among
regions. The data refers to the yearly total yield of estimated solar electricity generation within
the built environment.
Map 10 Solar energy potential
Key facts
As a Southern region of Europe, Molise is among the regions with the highest potentials.
However, it should be pointed out that the above pattern is not only dependant on climate, but
also on the degree of urban development, as only the built up areas have been accounted for
given that the installation of plants can ensure substantial amounts of savings in urban areas
rather than in remote and rural areas.
18Ozone concentration
Definition
The indicator measures the number of days with ground level concentration over the European
limit (i.e. 120yg/m3).
Map 11 Ozone concentration exceedances
Key facts
The region generally enjoys a quite low number of days with concentration exceedances, in
particular in comparison to other Italian regions. Figures are 11 to 20 days for the Province of
Campobasso and 6 to 10 for the Province of Isernia. These results are in line with the rest of
Europe.
19Combined adaptive capacity to climate change
Definition
Adaptive capacity to climate change indicates the ability or potential of a system to respond
successfully to climate change and climate variability, and includes adjustments in behaviour,
resources and technologies. The combined adaptive capacity, according to the ESPON CLIMATE
project, takes into account the economic, socio-cultural, institutional and technological ability
of a region to adapt to the impacts of a changing regional climate.
Climate change has a territorialised impact. Indeed, regions are not equally impacted by
climate change. But also, not all regions have the same adaptive capacity. All in all, this makes
territories more or less vulnerable to new climatic stimuli.
Map 12 Combined adaptive capacity to climate change
Key facts
The region, as most southern Italian and south eastern European regions, has the lowest
adaptive capacity. This means that in the long run Molise foreseen capacity to be able to adjust
to the new climate stimuli are very limited.
20Potential vulnerability to climate change
Definition
The potential vulnerability to climate change was assessed taking into account the adaptive
capacity as well as climate change impacts, such impacts being the combination of different
sensitivity dimensions’ and exposure to climate change.
Map 13 Potential vulnerability to climate change
Key facts
As most southern European regions, Molise foreseen potential vulnerability is medium to high.
The province of Campobasso in particular will have to face highest negative impacts.
211.3. Inclusive Growth
Inclusive growth refers to fostering a high-employment economy delivering social and
territorial cohesion. Within the Europe 2020 Strategy it means raising Europe’s employment
rate, helping people of all ages anticipate and manage change through investment in skills &
training, modernising labour markets and welfare systems, and ensuring the benefits of growth
reach all parts of the EU. In short the key factors are employment and avoiding risk of poverty
and social exclusion.
value of the region Italy EU-27+4
Long-term unemployment
Long-term
2011
2011
rate
unempl oyment (12(12
rate months andand
months more) -
more) -
●5.4 3.0 ● ● 3.0
At-ri sk-of-poverty ra te - 2011
●
24 12 ● ● 16
Persons aged 25-64 and 20-24 with upper secondary or
tertiary education attainment (%) - 2011
●
53 58 ● ● 76
The value in front of each traffic-light represents the median value of the country and of the EU-27+4 space.
Thresholds for detecting disparities using the variation coefficient: low < 15%, medium 15 - 30%, high > 30%
Regional level of analysis: NUTS 2
Origin of data: EUROSTAT 2012
This section provides further details on the definition and the key facts of the indicators used
for measuring inclusive growth as change in labour force, employment rate, long-term
unemployment rate, persons with upper secondary/tertiary education attainment, participation
of adults (aged 25 to 64) in education and training, population at-risk-of poverty rate.
Change in labour force after different scenarios
Definition
In the ESPON DEMIFER project, Labour force participation is defined as the proportion of a
specific population (such as women and older workers) considered to be either working or
actively searching for a job.
A prospective vision has been developed based on four scenarios defined by ESPON DEMIFER
project for the period 2005-2050:
• Challenged Market Europe, based on growth limited by environmental constraints and
increasing individualism;
• Expanding Market Europe, based on growth enabled by technical and social innovation
and growing individualism;
• Limited Social Europe, focusing on growth limited by environmental constraints and
growing collectivism;
• Growing Social Europe, shaped by growth enabled by technical and social innovation
and increasing collectivism.
22Map 14 Change in labour force
Key facts
According to the scenario “Challenged Market Europe”, the region will suffer a diminution of
population number from 10 to 30% between 2005 and 2050.
If the “Expanding Market Europe” scenario is applied, the region will know, in the same period,
a diminution of this indicator only from 0 to 10%. The same values are observed if “Growing
Social Europe” scenario is applied.
For the “Limited Social Europe” scenario, the region will record a decrease of active population
from 30 to 77%.
Regardless of the scenario, Molise is foreseen to have its labour force decrease between 2005
and 2050.
23Employment rate
Definition
The employment rate is calculated as the ratio (%) between the employed persons and the
working age population (15-64 years)4. It is considered as a key social indicator for analytical
purposes when studying developments within labour markets.
Map 15 Employment rate
Key facts
Employment rate in the Italian region of Molise is comprised between 50.0 and 60.0%. This is
in the average for Italy but rather low compared to other European regions.
4
The European Union Labour Force Survey, Methods and Definitions, 1998 edition, Eurostat, p.13.
24Long-term unemployment rate
Definition
Long-term unemployment refers to people that are out of work and have been actively seeking
employment for at least a year. It is measured by the ratio (%) between:
• the number of people who were out of work during the reference week and have been
actively seeking unemployment for at least a year;
• and the labour force (including both unemployed and employed people).
Map 16 Long-term unemployment rate
Key facts
Long-term employment rate in the Italian region of Molise is comprised between 4.1 and
7.0%. This is in the average for Italy but rather high compared to other European regions.
25Persons with upper secondary/tertiary education attainment
Education policies have become a milestone with the adoption of the Lisbon Strategy, focusing
on growth and job. The EU2020 strategy identifies a series of benchmarks to be achieved by
2020: the share of early leavers from education and training should be less than 10%; the
share of 30-34 year olds with tertiary educational attainment should be at least 40% an
average of at least 15 % of adults (age group 25-64) should participate in lifelong Learning.
Although each EU country is responsible for its own education policy, the EU's role is to identify
common elements designed to support national actions and help address common challenges
such as: ageing societies, skills deficits among the workforce, and global competition.
Definition
The indicator shows the percentage of the adult population (25-64 years old) that has
completed upper secondary and university or similar (tertiary level) education level. The
importance of this indicator stems from the fact that it has been shown that employment rates
vary considerably according to educational attainment levels.
Map 17 Persons with upper secondary or tertiary education
26Key facts
In Molise 52,8% of persons aged 25-64 and 20-24 graduated upper secondary or tertiary
education. Although this region has a positive trend, the percentage is below the EU 27
average.
Participation of adults (aged 25 to 64) in education and training
The strategic framework for European cooperation in education and training adopted in May
2009 sets a number of benchmarks to be achieved by 2020, including one for lifelong learning,
namely that an average of at least 15 % of adults aged 25 to 64 years old should participate in
lifelong learning.
Definition
The numerator of the LFS-Life-long learning indicator denotes the percentage of persons aged
25 to 64 (excluding the ones who did not answer the question 'participation to education and
training') who received education or training in the four weeks preceding the survey. Both the
numerators and the denominators come from the European Union Labour Force Survey (LFS).
Map 18 Participation of adults in education and training
Key facts
In 2011, the proportion of persons aged 25 to 64 in the EU-27 receiving some form of
education or training in the four weeks preceding the labour force survey was 8.9. With a
percentage of adults attending education and training between 5 and 10%, the region of
Molise is really close to the national average (5.7%) but still far from the European target of
15%.
27At-risk-of poverty rate
The Europe 2020 objective is to lift 20 million people out of being at risk of poverty and
exclusion. The indicator chosen covers the number of people who are at risk of poverty and/or
severely materially deprived and/or living in households with very low work intensity.
Definition
At risk of poverty is defined as having equivalent disposable income (i.e. adjusted for
household size and composition) of less than 60% of the national median household income. It
is a great tool to show regional disparities within countries. However it has several weaknesses
if used in EU-wide comparisons. For example, housing costs are not included, yet access to
affordable and decent housing is one of the main determinants of people’s well-being.
Map 19 Population at risk of poverty or social exclusion
Key Facts
In Molise, 24% of the population is at risk of poverty. This is largely above both the European
and the Italian level.
282. Territorial factors of interest for the programme area
Territorial cooperation programmes can make a difference for the future development of cross-
border and transnational territories in Europe. Some of the factors can be analysed by
European wide data sets and using some studies having specific maps, figures and tables
concerning the region.
Besides a wide range of standard indicators frequently used in the context of European
regional policies, ESPON has established various indicators which focus more on the territorial
dimension. These indicators provide among others information on the development
preconditions of an area. Two standard indicators in this field are rural-urban settings and
accessibility.
Urban-rural typology
Definition
The methodology to define urban and rural typology is fully described in Dijkstra and Poelman
(2008). All local units in each NUTS-3 region is classified as urban or rural, using a criteria of
population density of 150 inhabitants per square kilometre. In particular:
• Predominantly Urban (PU) regions have population living than 15% in rural local units;
• Intermediate (I) regions have rural population between 15% and 50%;
• Predominantly Rural (PR) regions have more than 50% of their population in rural local
units.
Each of these three categories are further divided into:
• Accessible, if more than half of its residents can drive to the centre of a city, of at least
50 000 inhabitants, within 45 minutes;
• Remote, if less than half its population can reach a city within 45 minutes.
29Map 20 Urban-rural typology of NUTS-3 regions including remoteness
Key facts
Molise is one of the few predominantly rural remote Italian region, meaning that more than
50% of the population lives in rural local units and cannot reach a city within 45 min.
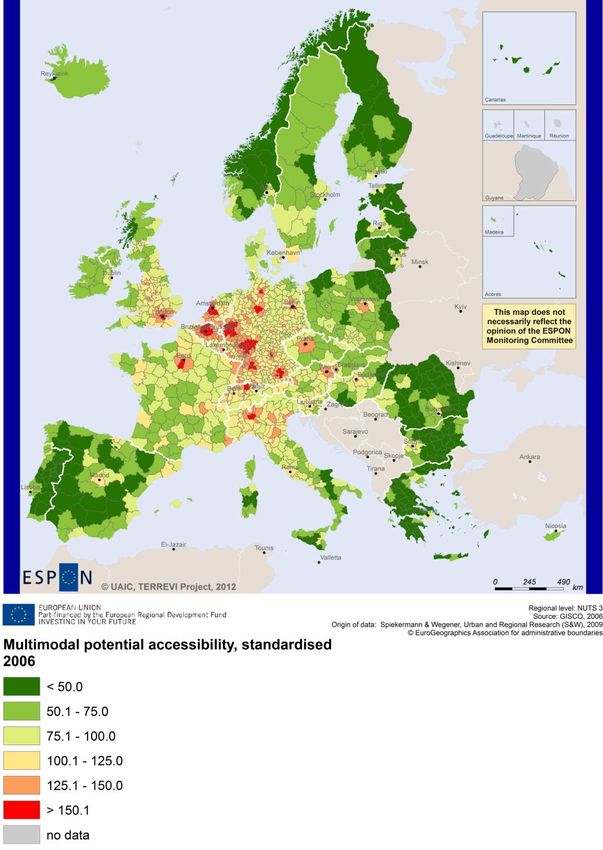
30Multimodal accessibility
Definition
Potential multimodal accessibility synthesises indicators specific for each travel mode (road,
rail and air) and captures a spatial architecture articulated according to the core - periphery
model. Through the specific manner of trading travel costs (strongly dependent on the physical
distances on the ground and on the limits of travel speed), road and rail networks are the main
responsible for concentrating high values of potential accessibility in the central part of the
European Union. On the other hand, in the peripheral areas of EU space, multimodal
accessibility declined as it is essentially based on air accessibility, the only travel mode able to
provide fast connections for such regions.
Map 21 Multimodal potential accessibility
Key facts
Located in the central-southern part of the Italian peninsula, Molise is a typical interstitial
space, outside the major communication axes that define the quadrangle formed by the urban
centres Rome and Naples (on the west façade) and Bari and Pescara (on the eastern one). This
is compounded by the peripheral position in the European context, so that the region
(comprising Campobasso and Isernia provinces) has a potential multimodal accessibility
ranging between 50 and 75% of the European average.
31Recommended ESPON reading
ESPON has published a wide range of reports providing valuable territorial evidence (see the
following table).
ESPON study Topic Content
TRANSMEC European It develops a method providing guidance on how ESPON results can add
cooperation value to support territorial cooperation programmes (see map 27 and
from map 36 to 39 on potential accessibility indicators). The method is
applied for the Northwest-Europe cooperation area.
SGPTD Growth poles It provides evidence on European secondary cities, their performance and
functional roles in different parts of Europe, and the potential policy
intervention affecting their performance (see from figure 2 to 2.12). The
report includes a case study on Leeds, in the UK (annex of the Scientific
Report).
ATTREG Attractiveness It provides a better understanding of the contribution of European
regions’ and cities’ attractiveness to economic performance and it
identifies the key ingredients of attractiveness in different types of
territories. The report includes a case study on the island of Bornholm, in
Denmark (see Annex 4/2).
GEOSPECS Specific types It provides evidence on the strength, weaknesses and development
of territories opportunities of specific types of territories and regions (e.g. border
areas, highly or sparsely populated areas). The project focuses on the
Belgian coast as a case study.
ReRisk Energy It focuses on opportunities to support competitive and clean energy
supplies for regions in Europe and to generate and strengthen sustainable
energy sources. It includes a case study of the Island of Samsø (DK).
TERCO Territorial It provides an assessment of the adequacy of existing territorial
cooperation cooperation areas for meeting current challenges of territorial
development and a proposal of potentially meaningful new cooperation
areas throughout Europe. The project analyses the region of “Scotland-
Sweden-Norway” as a case study (see 2.3.5 in the Scientific Report).
KIT Innovation It takes into account the current state, patterns and potentials of regions
with respect to the knowledge and innovation economy and identifies new
development opportunities through innovation for Europe and its
territories (see from map 3.1.1 to 4.4.1). The case studies include ICT in
Cambridge (volume 2 of the annex of the scientific report), and TV and
digital media in Cardiff (volume 3 of the annex of the scientific report).
RISE Integrated It shows how monitoring and evaluation indicators and methodologies
strategies can be used to enhance the development of Regional Integrated
Strategies. The case studies include Randstad, in the Netherlands, and
Zealand, in Denmark.
TPM Territorial The project analysis how territorial impacts of macro challenges translate
performance at the regional level and how to best deal with these challenges. The
project provides a regional case study on the Flanders, in Belgium (see
the Annex “Vlaanderen”).
EUROISLANDS Islands It gives evidence on the divergence of island's situation and on existing
policy measures for the islands. The project includes a study on Samsø.
Furthermore, some of overall ESPON products of particular interest for territorial cooperation
are:
• ESPON Synthesis report “new evidence on smart, sustainable and inclusive territories”
provides an easy to read overview on ESPON results available.
• ESPON Territorial Observations is a publication series, which on a few pages presents
policy relevant findings deriving from latest ESPON research.
• ESPON 2013 Database provides regional information provided by ESPON projects and
EUROSTAT.
• ESPON Hyperaltas allows comparing and analysing a region’s relative position at
European, national and local scale for a wide range of criteria.
• ESPON MapFinder provides access to the most relevant ESPON maps resulting from
ESPON projects and reports.
• ESPON Typologies provides nine regional typologies for additional analysis of regional
data to be considered in the European context.
All ESPON reports and tools are freely available at
www.espon.eu
32Scientific references
Adger, W.N., Arnell, N.W. & Tompkins, E.L. (2005), "Successful adaptation to climate change
across scales", Global Environmental Change Part A, vol. 15, no. 2, pp. 77-86.
Atmos Counsulting 2009. “Windscan. Recent Research Findings”.
Barnett, J. & O’Neill, S. (2010), "Maladaptation", Global Environmental Change, vol. 20, no. 2,
pp211-213.
Brooks, N., Adger, W.N. & Kelly, M.P. (2005), "The determinants of vulnerability and adaptive
capacity at the national level and the implications for adaptation", Global Environmental
Change Part A, vol. 15, no. 2, pp. 151-163.
Eckerberg, L. (2010), Expert, Info and Energy Efficiency: Energy Agency for Southeast
Sweden. Telephone Interview
EEA European Environment Agency (2009), “Europe's onshore and offshore wind energy
potential. An assessment of environmental and economic constraints”. EEA Technical Report
No 6/2009
Füssel, H.-M. (2007), "Adaptation planning for climate change: concepts, assessment
approaches, and key lessons", vol. 2, no. 2, pp. 265-275.
Füssel, H-M.,;Klein, R.J.T: Assessing Vulnerability and Adaptation to Climate Change: An
Evolution of Conceptual Thinking (2002), A Climate Risk Management Approach to Disaster
Reduction and Adaptation to Climate Change. (Proceedings of the UNDP Expert Group
Meeting on Integrating Disaster Reduction and Adaptation to Climate Change, pp. 45-59.
Gagnon-Lebrun, F. & Agarwala, S. (2006), Progress on adaptation to climate change in
developed countries. An analysis of broad trends, OECD, Paris.
Gagnon-Lebrun, F. & Agarwala, S. (2007), "Implementing adaptation in developed countries:
an analysis of progress and trends", Climate Policy, vol. 7, pp. 392-408.
Gupta, J., Termeer, C., Klostermann, J., Meijerink, S., van der Brink, M., Jong, P., Nooteboom
S. & Bergsma, E. (2010), "The adaptive capacity wheel: A method to assess the
inherencharacteristics of institutions to enable the adaptive capacity of society",
EnvironmentalScience & Policy, vol. 13, pp. 459-471.
Gupta, S., Tirpak, D. A., Burger, N., Gupta, J., Höhne, N., Boncheva, A.I., Kanoan, G.M.,
Kolstad, C., Kruger, J.A., Michaelowa, A., Murase, S., Pershing, J., Saijo, T. & Sari, A.
(2007), Policies, Instruments and Co-operative Arrangements. In Climate Change 2007:
Mitigation. Contribution of Working Group III to the Fourth Assessment Report of the
Intergovernmental Panel on Climate Change.
Hansen, Povl A. (2002), “Energiprojekt Samsø – et regionalt udviklingsprojekt”. Scientific
report, Roskilde University, Denmark.
Hansen, Povl A.; Rasmussen, Rasmus O. (2007), “Samsø – i et alternativt geografisk
perspektiv”. NORS research report, Roskilde University.
Hermansen, S. (2009) Director, Samsø Energy Academy, Personal Communication: Face-to-
face interview [2009-07-02].
Hermansen, Søren - Director, Samsø Energy Academy, 2 June 2009, face-to- face
IPCC [Intergovernmental Panel on Climate Change] (2007): Climate Change 2007 - Impacts,
Adaptation and Vulnerability. Contribution of working group II to the Forth Assessment
report of the Intergovernmental Panel on Climate Change.
IPCC (2007a), Climate Change 2007: The Physical Science Basis. Contribution of Working
Group I to the Fourth Assessment. Report of the Intergovernmental Panel on Climate
Change, Cambridge University Press, Cambridge.
IPCC 2001a. Climate Change 2001. The Scientific Basis. Intergovernmental Panel on Climate
Change.
IPCC 2001b, Climate Change 2001b: Impacts, Adaptation and Vulnerability, Cambridge
University Press, Cambridge.
IPCC 2007a. Climate Change 2007: The Physical Science Basis. Contribution of Working Group
I to the Fourth Assessment. Report of the Intergovernmental Panel on Climate Change,
Cambridge University Press, Cambridge.
IPCC 2007b. Climate Change 2007 - Impacts, Adaptation and Vulnerability. Contribution of
working group II to the Forth Assessment report of the Intergovernmental Panel on Climate
Change.
33IPCC 2001. Climate Change 2001. Third assessment report, Working Group III: Mitigation.
Intergovernmental Panel on Climate Change. Available at
http://www.grida.no/publications/other/ipcc%5Ftar/?src=/climate/ipcc_tar/wg3/index.htm
IPCC 2007a, Assessment of Adaptation Practices, Options, Constraints and Capacity,
Cambridge University Press, Cambridge.
IPCC 2007b, Climate Change 2007: The Physical Science Basis. Contribution of Working Group
I to the Fourth Assessment. Report of the Intergovernmental Panel on Climate Change,
Cambridge University Press, Cambridge.
IPCC 2007c, Contribution of Working Group II to the Fourth Assessment Report of the\\\
Intergovernmental Panel on Climate Change, Cambridge University Press, Cambridge.
IPCC, 2008. Technical paper on climate change and water. Accessible at
www.ipcc.ch/meetings/session28/doc13.pdf.
Keskitalo, E.C.H. (ed) 2010, The Development of Adaptation Policy and Practice in Europe:
Multi-level Governance of Climate Change, Springer Verlag, Berlin.
Keskitalo, E.C.H. (ed) 2010, The Development of Adaptation Policy and Practice in Europe:
Multi-level Governance of Climate Change, Springer Verlag, Dordrecth.
Kont, A., Jaagus, J., Aunap, R. 2003. Climate Change Scenarios and the effect of sea level rise
or Estonia. Global and Planetary Change 36 (2003) 1-15
Leary, N.A. 1999, "A framework for benefit-cost analysis of adaptation to climate change and
climate variability", Mitigation and Adaptation Strategies for Global Change, vol. 4, no. 34,
pp. 307-318.
Marshall, N.A. 2010, "Understanding social resilience to climate variability in primary
enterprises and industries", Global Environmental Change, vol. 20, no. 1, pp. 36-43.
Massey, E. & Bergsma, E. 2008, Assessing adaptation in 29 European countries, IVM Institute
of Environmental Studies, Vrije Universiteit, Amsterdam.
Meyer, Niels L. (2004), “Renewable Energy Policy in Denmark. Energy for Sustainable
Development”, Volume VIII No.1, March 2004, pp.25-35.
Meyer, Niels L. (2007), “Learning from Wind Energy Policy in the EU: Lessons from Denmark,
Sweden and Spain”. European Environment, 17, pp.347-362.
O'Brien, K., Eriksen, S., Sygna, L. & Næss, L.O. 2006, "Questioning Complacency: Climate
Change Impacts, Vulnerability, and Adaptation in Norway", AMBIO: A Journal of the Human
Environment, vol. 35, no. 2, pp. 50-56.
Pelling, M. & High, C. 2005, "Understanding adaptation: what can social capital offer
assessments of adaptive capacity?", Global Environmental Change, vol. 15, no. 4, pp. 308-
319.
Pettersson, Maria (2006), “Legal Preconditions for Wind Power Implementation in Sweden and
Denmark”, Luleå University of Technology, Department of Business Administration and
Social Sciences, 2006:12.
Pryor, S.C., Barthelmie, R.J. 2009. Climate change impacts on wind energy: A review.
Renewable and Sustainable Energy Reviews (2009)
Ribeiro, M., Losenno, C., Dworak, T., Massey, E., Swart, R., Benzie, M. & Laaser, C. 2009,
Design of guidelines for the elaboration of Regional Climate Change Adaptation Strategies,
Ecologic Institute, Vienna.
Schröter, D., et alii (2004), ATEAM Final report. Section 5 and 6 and Annex 1 to 6. Detailed
report, related to overall project duration.
Smit, B. & Wandel, J. 2006, "Adaptation, adaptive capacity and vulnerability", Global
Environmental Change, vol. 16, no. 3, pp. 282-292.
Smit, B.; Pilifosova, O. (2001): Adaptation to climate change in the context of sustainable
development and equity. In: IPCC 2001: Climate Change 2001 - Impacts, Adaptation, and
Vulnerability- Contribution of the Working Group II to the Third Assessment report ofthe
Intergovernmental Panel on Climate Change. Cambridge University Press, Cambridge: 877-
912.
Smith, J.B., Vogel, J.M. & Cromwell III, J.E. 2009, "An architecture for government action on
adaptation to climate change. An editorial comment", vol. 95, no. 1-2, pp. 53-61.
Stratford, P. 2007. Assessing the Financial Viability of Offshore Wind Farms, Contribution to th
e EWEC 2007 Conference
Swart, R., Biesbroek, G.R., Binnerup, S., Carter, T., Cowan, C., Henrichs, T., Loquen, S., Mela,
H., Morecroft, M., Reese, M. & Rey, D. 2009, Europe Adapts to Climate Change. Comparing
National Adaptation Strategies, Vammalan Kirjapaino Oy, Sastamala.
34Twomlow, S., Mugabe, F.T., Mwale, M., Delve, R., Nanja, D., Carberry, P. & Howden, M. 2008,
"Building adaptive capacity to cope with increasing vulnerability due to climatic change in
Africa – A new approach", Physics and Chemistry of the Earth, Parts A/B/C, vol. 33, no. 8-
13, pp. 780-787.
Westerhoff, L., Keskitalo, E.C.H. & Juhola, S. In press, "Capacities across scales: enabling local
to national adaptation policy in four European countries", Climate Policy.
Williamson, T., Hesseln, H. & Johnston, M. "Adaptive capacity deficits and adaptive capacity of
economic systems in climate change vulnerability assessment", Forest Policy and Economics,
vol. In Press, Corrected Proof.
Yohe, G. & Tol, R.S.J. 2002, "Indicators for social and economic coping capacity—moving
toward a working definition of adaptive capacity", Global Environmental Change, vol. 12, no.
1, pp. 25-40.
35The ESPON 2013 Programme is part-financed
by the European Regional Development Fund,
the EU Member States and the Partner States
Iceland, Liechtenstein, Norway and Switzerland.
It shall support policy development in relation to
the aim of territorial cohesion and a harmonious
development of the European territory.
36You can also read