Global component analysis of errors in three satellite-only global precipitation estimates
←
→
Page content transcription
If your browser does not render page correctly, please read the page content below
Hydrol. Earth Syst. Sci., 25, 3087–3104, 2021
https://doi.org/10.5194/hess-25-3087-2021
© Author(s) 2021. This work is distributed under
the Creative Commons Attribution 4.0 License.

Global component analysis of errors in three
satellite-only global precipitation estimates
Hanqing Chen1,2,3 , Bin Yong1 , Pierre-Emmanuel Kirstetter4,5 , Leyang Wang3 , and Yang Hong5
1 StateKey Laboratory of Hydrology-Water Resources and Hydraulic Engineering, Hohai University, Nanjing 210098, China
2 School of Geography and Remote Sensing, Guangzhou University, Guangzhou 510006, China
3 Key Laboratory for Digital Land and Resources of Jiangxi Province,

East China University of Technology, Nanchang 330013, China
4 School of Meteorology, University of Oklahoma, Norman, OK 73072, USA
5 School of Civil Engineering and Environment Sciences, University of Oklahoma, Norman, OK 73019, USA

Correspondence: Bin Yong (yongbin@hhu.edu.cn)

Received: 15 June 2020 – Discussion started: 25 September 2020
Revised: 4 March 2021 – Accepted: 26 April 2021 – Published: 9 June 2021

Abstract. Revealing the error components of satellite-only          1   Introduction
precipitation products (SPPs) can help algorithm develop-
ers and end-users understand their error features and im-
prove retrieval algorithms. Here, two error decomposition           As precipitation is a key input for the hydrological cycle sys-
schemes are employed to explore the error components of the         tem, accurately estimating precipitation is of great signifi-
IMERG-Late, GSMaP-MVK, and PERSIANN-CCS SPPs                        cance when studying the global water cycle (Hou et al., 2014;
over different seasons, rainfall intensities, and topography        Kidd et al., 2017; Skofronick-Jackson et al., 2017; Chen et
classes. Global maps of the total bias (total mean squared          al., 2019a). Traditional methods depend on rain gauge net-
error) and its three (two) independent components are de-           works to obtain precise point-scale precipitation observations
picted for the first time. The evaluation results for similar re-   (Kidd and Huffman, 2011). In addition, ground-based radars
gions are discussed, and it is found that the evaluation results    can provide remotely sensed observations for precipitation
for one region cannot be extended to another similar region.        estimation over a range of approximately 250 km (Zhang et
Hit and/or false biases are the major components of the total       al., 2016; Chen et al., 2019b). However, these two methods
bias in most overland regions globally. The systematic error        for estimating precipitation are affected by a number of fac-
contributes less than 20 % of the total error in most areas.        tors, including the local terrain, weather regimes, environ-
Large systematic errors are primarily due to missed precip-         ment, and economy. It is challenging to obtain continuous
itation. It is found that the SPPs show different topographic       spatiotemporal precipitation estimates for many regions of
patterns in terms of systematic and random errors. Notably,         the world, especially over complex terrain and developing
among the SPPs, GSMaP-MVK shows the strongest topo-                 countries (Baez-Villanueva et al., 2020).
graphic dependency of the four bias scores. A novel metric,            Satellite-based instruments have the ability to overcome
namely the normalized error component (NEC), is proposed            the limitations of rain gauge networks and ground-based
as a means to isolate the impact of topography on the sys-          radar networks to provide precipitation estimates covering
tematic and random errors. Potential methods of improving           large areas globally (Kidd and Levizzani, 2011). However,
satellite precipitation retrievals and error adjustment models      satellite-based precipitation products are affected by biases
are discussed.                                                      and uncertainty, especially over mountainous areas (Tian and
                                                                    Peters-Lidard, 2010; Maggioni et al., 2016a; Chen et al.,
                                                                    2020b). Therefore, it is necessary to comprehensively ana-
                                                                    lyze the structure of uncertainty in satellite-based precipi-
                                                                    tation products, especially those relying on satellite obser-

Published by Copernicus Publications on behalf of the European Geosciences Union.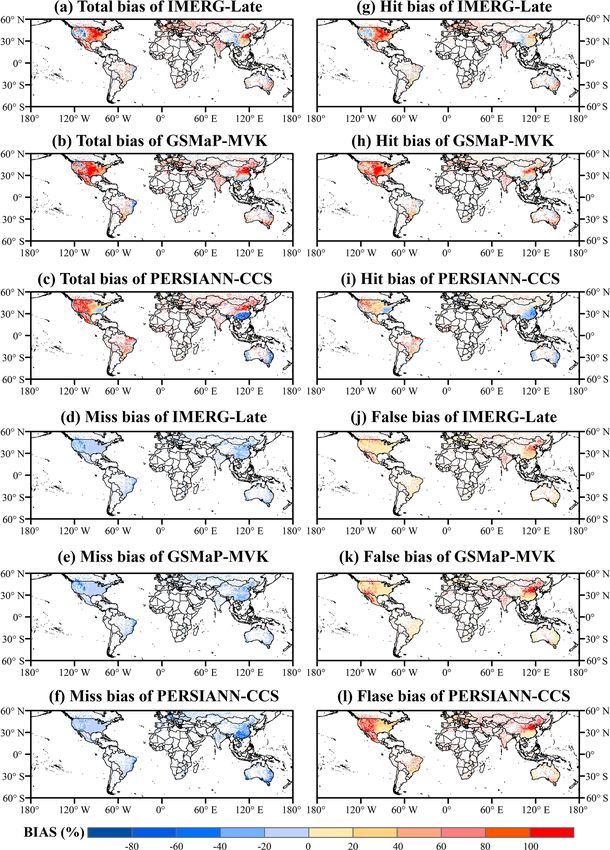
3088             H. Chen et al.: Global component analysis of errors in three satellite-only global precipitation estimates

vations only. Over the past 20 years, a large body of lit-             Precipitation intensity is another important factor driv-
erature investigating error features of satellite precipitation     ing the errors in satellite precipitation estimates (Tian et
products at the global scale (e.g., Yong et al., 2015; Liu,         al., 2009; Kirstetter et al., 2013; Chen et al., 2013, 2020b).
2016; Beck et al., 2017; Chen et al., 2020b) and the regional       Previous efforts found that satellite precipitation products
scale (e.g., AghaKouchak et al., 2011; Yong et al., 2010,           tend to overestimate light rainfall and underestimate heavy
2013, 2016; Takido et al., 2016; Tan et al., 2017; Prakash          rainfall (Tian et al., 2009; Kirstetter et al., 2013; Chen et
et al., 2018; Sungmin and Kirstetter, 2018; Gebregiorgis et         al., 2013). Tian et al. (2009) investigated the major compo-
al., 2018; Beck et al., 2019; Chen et al., 2019b) has accumu-       nents of the total bias in six SPPs (AFWA, the TMPA suite,
lated. These studies have provided a great deal of valuable         CMORPH, PERSIANN, and NRL) for different rainfall in-
information for algorithm developers and end-users. Most            tensities, and Maggioni et al. (2016b) quantified the relation-
studies use the mean error to analyze the error features of         ship between the systematic (random) error of TMPA prod-
SPPs, which could be misleading because the mean error av-          ucts and the rainfall intensity, while Kirstetter et al. (2018) re-
erages different error components. In some cases, the error         vealed the relationship between the systematic (random) er-
components compensate for each other and generate lower             ror in PERSIANN-CCS and the precipitation intensity. Nev-
mean error values than the absolute values of the individual        ertheless, the potential links between the systematic (ran-
components (Chen et al., 2019b).                                    dom) error of IMERG-Late and GSMaP-MVK and the pre-
   Tian et al. (2009) proposed an error decomposition scheme        cipitation intensity are still absent.
to separate the total bias into three independent components           The objective of this study is fourfold: (1) to reveal the ma-
(i.e., hit bias, miss bias, and false bias). Several evaluation     jor components of the errors (including the total bias and the
studies have investigated major bias components of satellite        total mean squared error) for three SPPs, including IMERG
precipitation products over several regions, such as mainland       Late Run (IMERG-Late), GSMaP Microwave–IR Combined
China (Yong et al., 2016; Xu et al., 2016; Su et al., 2018;         Product (GSMaP-MVK), and PERSIANN-CCS for four sea-
Chen et al., 2020b), the United States (Tian et al., 2009),         sons across the global land area; (2) to investigate the trans-
and Central Asia (Guo et al., 2017). AghaKouchack et al.            ferability of regional assessment results to other similar re-
(2012) used an error decomposition technique proposed by            gions; (3) to identify the factors that cause large systematic
Willmott (1981) to separate the total mean squared error into       errors; and (4) to inform users and algorithm developers on
the systematic error and the random error to evaluate three         how to improve these satellite precipitation products.
satellite precipitation products (i.e., CMORPH, PERSIANN,
and real-time TMPA) over the conterminous United States
(CONUS). Maggioni et al. (2016b) further investigated the           2     Study area, datasets, and methodology
systematic errors of TMPA products for CONUS. However,
those studies concentrated on limited regions and did not pro-      2.1     Study area
vide a global focus. Importantly, the question of the transfer-
                                                                    The study area covers all of the land globally between
ability of regional evaluation results to different but similar
                                                                    60◦ N and 60◦ S. Figure 1a shows the topographic relief
areas still needs to be investigated, as this has implications in
                                                                    in terms of the standard deviation of elevation (SDE; see
terms of improving the performance of SPPs in regions of the
                                                                    Sect. 2.3.3). The SDE is introduced here to better de-
world where no ground observations are available. Besides,
                                                                    scribe the topography in each grid cell. In terms of to-
investigations of the major component of the total bias – the
                                                                    pography, the study area encompasses complex terrain ar-
component that produces the largest systematic errors – are
                                                                    eas that include the western CONUS, the Andean Moun-
still needed.
                                                                    tains, southern Europe, Turkey, Iran, Afghanistan, the Ti-
   Topography is a crucial factor that influences satellite pre-
                                                                    betan Plateau (TP), the most humid regions in mainland
cipitation retrievals (Tapiador et al., 2012; Xu et al., 2017;
                                                                    China, and Japan. The studied land area can be divided into
Chen et al., 2019b). While several studies have strived to
                                                                    four climate regions, namely humid regions (average an-
investigate the total bias of satellite precipitation retrievals
                                                                    nual precipitation (AAP) > 800 mm yr−1 ), semi-humid re-
over various topographies (e.g., Takido et al., 2016; Guo et
                                                                    gions (AAP is 400–800 mm yr−1 ), semi-arid regions (AAP is
al., 2017; Xu et al., 2017; Chen et al., 2019b), error com-
                                                                    200–400 mm yr−1 ), and arid regions (AAP < 200 mm yr−1 ),
ponents remain underexplored. In particular, literature that
                                                                    as shown in Fig. 1b. The geographical distribution of these
investigates the potential link between systematic (random)
                                                                    climate regions can be found in Fig. 1c.
error and terrain features is lacking, which limits the charac-
terization of satellite precipitation error. Furthermore, previ-    2.2     Datasets
ous studies used the mean elevation as a way to describe the
underlying terrain. As the mean elevation often does not ob-        2.2.1    Reference products
jectively represent the complexity of the topography present,
a more relevant metric is needed.                                   Three high-accuracy rain-gauge datasets are employed as the
                                                                    references. Climate Precipitation Center unified (CPCU) data

Hydrol. Earth Syst. Sci., 25, 3087–3104, 2021                                          https://doi.org/10.5194/hess-25-3087-2021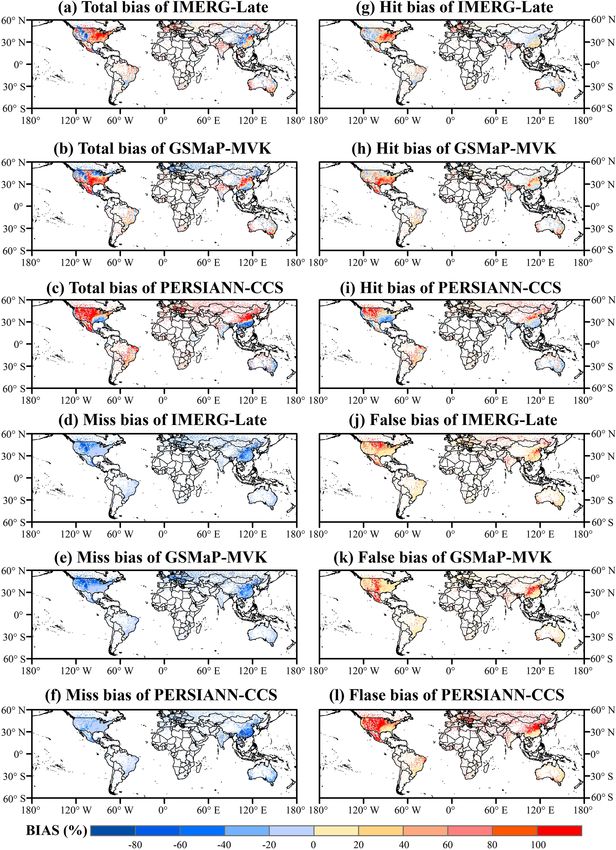
H. Chen et al.: Global component analysis of errors in three satellite-only global precipitation estimates                    3089

                                                                       tion Analysis (CGDPA) data are used. This dataset, with a
                                                                       spatial resolution of 0.25◦ and daily temporal resolution, is
                                                                       developed based on ∼ 2400 rain gauges using the OI method.
                                                                       Assessment results indicate that this ground-based precipi-
                                                                       tation dataset outperforms CPCU and the East Asia gauge
                                                                       analysis (EA_Gauge; Xie et al., 2007) data over mainland
                                                                       China (Shen and Xiong, 2016). To alleviate the effects of
                                                                       reference inconsistency on the analysis, the error scores of
                                                                       SPPs are calculated separately for mainland China and the
                                                                       rest of the world and subsequently merged. The detailed
                                                                       procedure is provided in the supplementary material. Re-
                                                                       garding the component analysis of SPP errors for different
                                                                       topographies, high-accuracy and high spatiotemporal reso-
                                                                       lution (hourly and 0.1◦ ) ground observations derived from
                                                                       25 982 rain gauges (Shen et al., 2014) are used as the bench-
                                                                       mark. The spatial distribution of rain gauges can be found in
                                                                       Chen et al. (2019b, 2020b). However, this product has large
                                                                       uncertainties during cold seasons due to freezing weather.
                                                                       The analysis was executed at a spatial resolution of 0.1◦ to
                                                                       avoid smoothing topographic features as much as possible.
                                                                       In this study, only pixels with at least one rain gauge are
                                                                       considered. The spatial distribution of rain gauges, includ-
                                                                       ing those used to generate CPCU and CGDPA data, is shown
                                                                       in Fig. 1d.

                                                                       2.2.2    Satellite-only precipitation products

                                                                       The main focus of this study is on analyzing the er-
                                                                       ror components of the three SPPs (i.e., IMERG-Late V6,
                                                                       GSMaP-MVK V7, and PERSIANN-CCS). The correspond-
                                                                       ing gauge-adjusted satellite precipitation products (IMERG
                                                                       Final Run, gauge-adjusted GSMaP, and PERSIANN Climate
                                                                       Data Record) that merge ground-based rain-gauge and satel-
                                                                       lite observations were not used in this study, thus ensuring
                                                                       an objective assessment with independent benchmarks (e.g.,
                                                                       the gauge-adjusted GSMaP incorporates CPCU data). Note
                                                                       that other satellite-only SPPs are not included in this study
                                                                       because they are not released to the public (e.g., CMORPH)
                                                                       or they have been decommissioned (e.g., real-time TMPA;
                                                                       https://gpm.nasa.gov/, last access: 20 February 2021). A
Figure 1. (a) Global map of topography; (b) global map of mean
                                                                       5 year period (2015–2019) was chosen to investigate the SPP
annual precipitation from 1891 to 2018 (128 years) based on the
                                                                       error components. Table 1 provides general information on
Global Precipitation Climatology Centre (GPCC) monthly gauge
analysis; (c) division of the study region into four climate areas     the three SPPs; more detailed information about their pro-
(i.e., humid, semi-humid, semi-arid, and arid); (d) the spatial den-   duction processes can be found in Chen et al. (2020b).
sity of rain gauges used to obtain Climate Precipitation Center uni-      To be consistent with CPCU data (0.5◦ , daily), all SPPs
fied (CPCU) data and China Gauge-based Daily Precipitation Anal-       are resampled to the same spatial resolution (0.5◦ ) and ag-
ysis (CGDPA) data.                                                     gregated to daily temporal resolution.

                                                                       2.3     Methodology
are used as the benchmark for the studied land area, except
for mainland China. These are continuous daily precipita-              2.3.1    Error decomposition technique
tion data at a spatial resolution of 0.5◦ produced by the CPC
using optimal interpolation (OI) based on > 17 000 gauges              Tian et al. (2009) proposed an error decomposition scheme
(Xie et al., 2007; Chen et al., 2008). For the benchmark               to separate the total bias (TB) into the hit bias (HB), miss
over mainland China, China Gauge-based Daily Precipita-                bias (MB), and false bias (FB). This technique is effective

https://doi.org/10.5194/hess-25-3087-2021                                            Hydrol. Earth Syst. Sci., 25, 3087–3104, 2021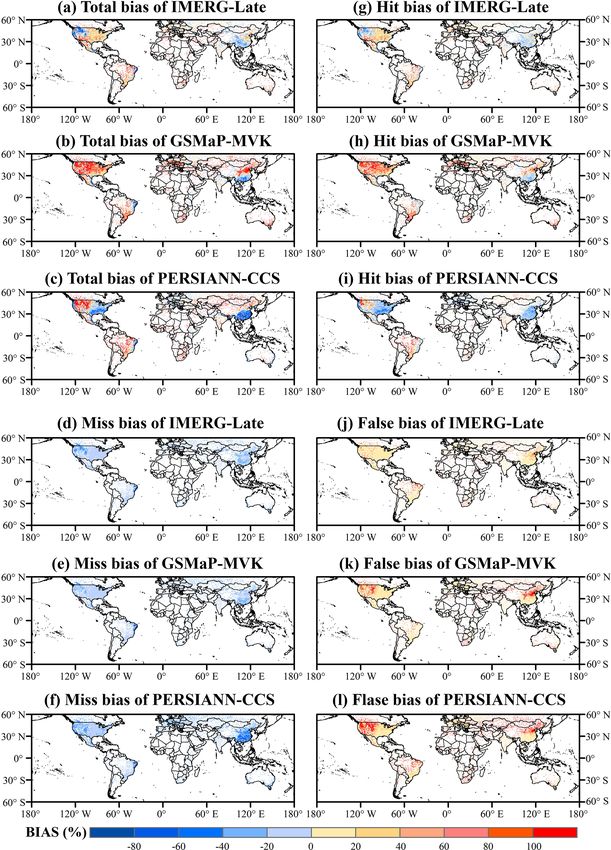
3090              H. Chen et al.: Global component analysis of errors in three satellite-only global precipitation estimates

Table 1. Information about the three satellite-only global precipitation estimates used in this study.

               Product               Full name of product             Data source(s)     Resolution           Reference(s)
               IMERG-Late            Integrated Multi-satellitE       PMW, IR                0.1◦ /0.5 h      Huffman et al. (2019)
                                     Retrievals for GPM Late
                                     Run V06B
               GSMaP-MVK             Global Satellite Mapping of      PMW, IR                  0.1◦ /1 h      Ushio et al. (2009)
                                     Precipitation Microwave–IR
                                     Combined Product V7
               PERSIANN-CCS          Precipitation Estimation         IR                     0.04◦ /1 h       Sorooshian      et      al.
                                     from Remotely Sensed                                                     (2000);
                                     Information using Artificial                                             Hong et al. (2004)
                                     Neural Networks Cloud
                                     Classification System

at identifying the major error components of the total bias,                              !                       !
and can provide valuable information to customize retrieval                    n                   n
                                                                           1 X          2      1 X            2
algorithms and mitigate errors. The four bias scores can be                      (S − G) =             Ŝ − G                                       (6)
                                                                           n i=1               n i=1
defined as follows (Tian et al., 2009):                                                                             !
                                                                                                      n
       P                                                                                         1 X             2
          (S − G)                                                                             +           S − Ŝ
TB =      P        × 100 %                               (1)                                     n i=1
             G                                                                                         !                    !
       P                                                                                   n        2  X     n
          (SH − GH )                                                                     X
                                                                                                                          2
HB =        P         × 100 %                            (2)               ES = 100 % ×       Ŝ − G               (S − G)                          (7)
               G                                                                                 i=1                         i=1
          P
        − GM
                                                                                                                      !                         !
                                                                                                  n                2       n
MB = P           × 100 %                                 (3)
                                                                                                 X                           X
                                                                                                                                            2
             G                                                             ER = 100 % ×                    S − Ŝ                  (S − G)          (8)
       P                                                                                         i=1                         i=1
          SF
FB = P × 100 %                                           (4)               Ŝ = a × G + b,                                                          (9)
          G
TB = HB + MB + FB,                                       (5)               where ES and ER represent the systematic and random error
                                                                           components, respectively; and a and b are the slope and in-
where S and G are the satellite-measured and rain-gauge-                   tercept, respectively, which can be computed using the least
measured precipitation, respectively; SH and GH are the                    squares method. Note that the systematic error component
satellite-derived and rain-gauge-derived precipitation esti-               (ES ) plus the random error component (ER ) add up to 100 %.
mates for hit rainfall events, respectively; GM denotes the
precipitation missed by the satellite in miss rainfall events;             2.3.2   Normalized error component
and SF indicates the precipitation measured by the satellite
in false rainfall events.                                                  The systematic and random errors in SPPs are impacted by
   Another error decomposition technique decomposes the                    several key impact factors, such as season and rainfall in-
total mean squared error into systematic and random er-                    tensity (AghaKouchack et al., 2012; Maggioni et al., 2016b;
ror components. This strategy was used by Willmott (1981)                  Kirstetter et al., 2013, 2018). To isolate the influence of to-
to separate the systematic and random errors in numerical                  pography on the systematic and random errors, a novel met-
weather prediction models. Subsequently, AghaKouchack et                   ric called the normalized error component (NEC) is proposed
al. (2012) employed this technique to investigate the system-              that filters the impact of precipitation intensity. This metric is
atic and random errors in three satellite precipitation prod-              defined as follows:
ucts (i.e., CMORPH, PERSIANN, and real-time TMPA) over                                                !                      !      !
                                                                                         n         2  X      n
CONUS. This error decomposition method can be defined as                               X
                                                                                                                           2
                                                                           NEC =             Ŝ − G               (S − G) × G , (10)
follows (Willmott, 1981; AghaKouchack et al., 2012):                                   i=1                            i=1

                                                                           where G indicates the mean value of ground-based obser-
                                                                           vations for each topographic class. Note that the relation-
                                                                           ship between NEC and topography degenerates into the re-
                                                                           lationship between systematic error and topography when

Hydrol. Earth Syst. Sci., 25, 3087–3104, 2021                                                   https://doi.org/10.5194/hess-25-3087-2021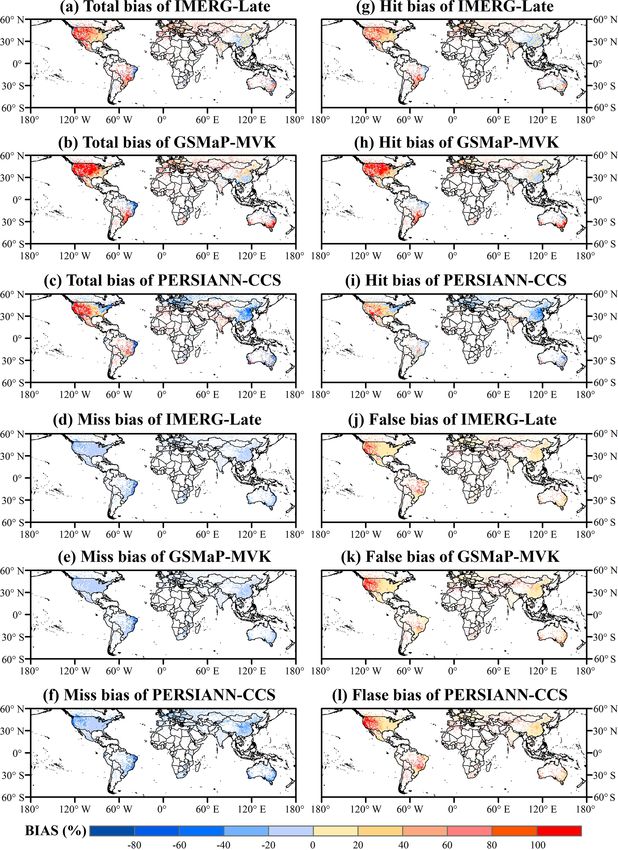
H. Chen et al.: Global component analysis of errors in three satellite-only global precipitation estimates 3091
the mean precipitation (i.e., G) is similar for all topography and false components over CONUS and Brazil, while they
classes. Thus, the NEC metric works only when the rainfall are dominated by false errors over Asia and Mexico.
intensities are significantly different across all topographic Regarding the JJA season (Fig. 3), the three SPPs ex-
categories. hibit large overestimates over most of CONUS (total bias >
80 %), which are primarily due to the hit error component
2.3.3 Index of topography complexity for IMERG and GSMaP. For northwest Mexico, the precip-
itation is evidently overestimated due to hit bias in the three
To better describe the variability of topography in each grid SPPs. Regarding Europe, the hit error is also the major error
cell, the standard deviation of elevation (SDE) is used here component for IMERG and GSMaP. PERSIANN-CCS un-
instead of the average elevation. The larger the SDE value, derestimates the precipitation over most regions of Europe
the higher the terrain gradients within the grid cell, reflecting due to miss errors and hit errors. In addition, the SPPs show
steeper topography. The SDE formula is defined as follows: better performance for mainland China during the JJA season
(summer), with a lower total bias of ±20 %.
E = 1 Ei
P
n q As for the SON season (Fig. 4), the SPPs show consid-
(11) erable differences in their error features. Over most regions
SDE = 1 (Ei − E)2 ,
P
n
of CONUS, IMERG displays relatively low overestimation
and underestimation. However, GSMaP seriously overesti-
where E indicates the mean elevation for each pixel; Ei de- mates the precipitation over CONUS due to its larger hit bias.
notes the ith elevation value of each grid cell; and n repre- PERSIANN-CCS overestimates the precipitation in arid and
sents the elevation sample size for each pixel. The global map semi-arid regions of CONUS, which is attributed to the hit
of SDE is shown in Fig. 1a. The SPP errors and their com- and false components, while it underestimates the precipita-
ponents are computed as functions of the SDE for different tion over southeastern regions due to the hit error component.
topographies. The relationship between error and precipita- Over most regions of China, IMERG shows slight underesti-
tion intensity is similarly established for various rainfall rate mation or overestimation. GSMaP and PERSIANN-CCS sig-
classes to investigate the impact of rainfall intensity. nificantly underestimate the precipitation in humid areas (ex-
cept for humid regions) due to a larger proportion of missed
precipitation, but the also overestimate the precipitation in
3 Results
Chinese other areas due to a large false error component. On
3.1 Global view of the error components the other hand, one feature that all the SPPs have in common
is that their total biases are very similar to their hit error com-
3.1.1 Spatial analysis of error components over ponents over Mexico, Brazil, Europe, and India, because the
different seasons missed precipitation and false bias cancel each other out.
Global maps of the four bias metrics for the three SPPs
As a seasonal dependency of the errors in SPPs has been doc- over the DJF season are shown in Fig. 5. One can notice that
umented (Tian et al., 2009; Chen et al., 2019b), the analy- the three SPPs display an obvious similarity in error charac-
sis first focuses on different seasons. The following seasonal teristics over Brazil and Australia. Again, their total biases
division scheme was implemented: (1) spring (March–May, are very similar to their respective hit error components. On
hereafter referred to as MAM); (2) summer (June–August, the other hand, there are differences between the SPPs in
hereafter referred to as JJA); (3) fall (September–November, the four bias scores for CONUS, Europe, and China. Differ-
hereafter referred to as SON); and (4) winter (December– ences in the retrieval algorithms and input sources used for
February, hereafter referred to as DJF). the satellite products may explain these differences.
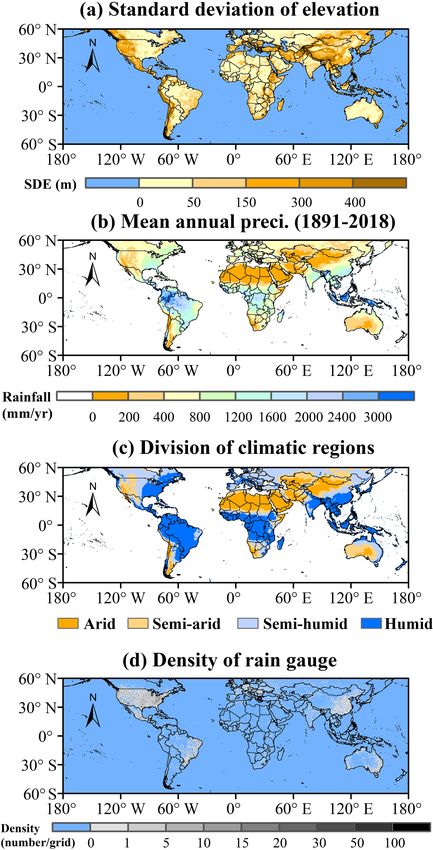
For the MAM season (Fig. 2), the majority of the SPPs A summary of the total bias and its major error compo-
show considerable similarities in total bias. IMERG-Late nents in each of the three SPPs for the main regions of the
and GSMaP-MVK seriously overestimate precipitation (to- world is listed in the supplementary material (Table S1 in
tal bias > 100 %) over most regions of the globe, such as the Supplement). Overall, global maps of the total bias and
the humid regions of CONUS, Mexico, Europe, and India its three independent error components indicate that the hit
and the semi-humid areas of China (see Fig. 2a and e). How- and/or false error components are the major contributors to
ever, the total biases come from different error components the total bias.
in different areas. The total biases in IMERG and GSMaP
are mainly dominated by the hit component in CONUS and 3.1.2 Spatial analysis of the systematic error over
Europe, while hit and false errors dominate in Mexico, India, different seasons
and mainland China. The largest total biases in PERSIANN-
CCS primarily occur in CONUS (except for its humid re- The global maps of systematic error per season for the three
gions), Mexico, Brazil, and most of Asia (except for humid SPPs show considerable similarities for most land areas. The
regions in China). These larger total biases originate from hit systematic error is less than 20 % of the total mean squared
https://doi.org/10.5194/hess-25-3087-2021 Hydrol. Earth Syst. Sci., 25, 3087–3104, 2021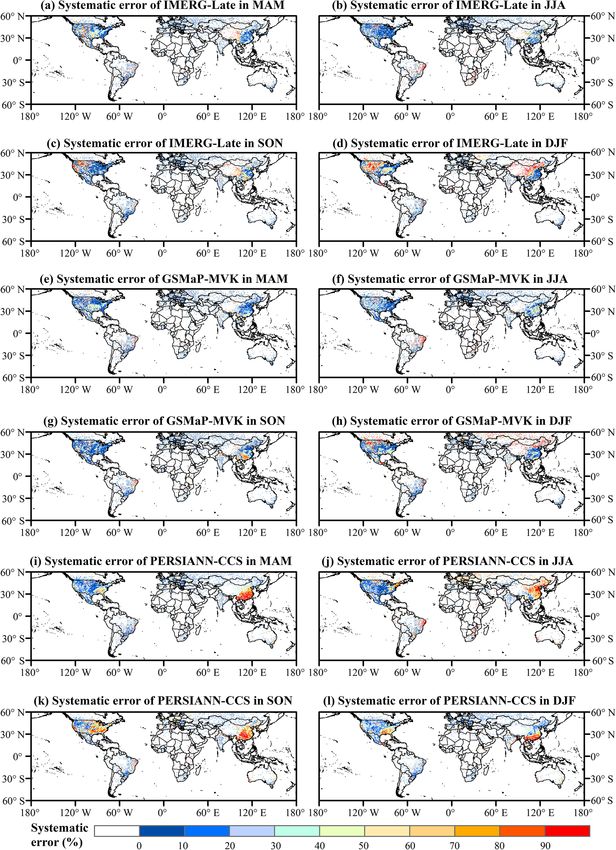
3092             H. Chen et al.: Global component analysis of errors in three satellite-only global precipitation estimates

Figure 2. Global land maps of the total bias and its three independent components for the three satellite-only global precipitation estimates
(i.e., IMERG-Late, GSMaP-MVK, and PERSIANN-CCS) at a spatial resolution of 0.5◦ and daily temporal resolution during the MAM
season (March–May) for the period from 2015 to 2019 (5 years): (a–c) total bias, (d–f) miss bias, (g–i) hit bias, (j–l) false bias.

Hydrol. Earth Syst. Sci., 25, 3087–3104, 2021                                              https://doi.org/10.5194/hess-25-3087-2021
H. Chen et al.: Global component analysis of errors in three satellite-only global precipitation estimates                             3093

Figure 3. Global land maps of the total bias and its three independent components for the three satellite-only global precipitation estimates
(i.e., IMERG-Late, GSMaP-MVK, and PERSIANN-CCS) at a spatial resolution of 0.5◦ and daily temporal resolution during the JJA season
(June–August) for the period from 2015 to 2019 (5 years): (a–c) total bias, (d–f) miss bias, (g–i) hit bias, (j–l) false bias.

https://doi.org/10.5194/hess-25-3087-2021                                              Hydrol. Earth Syst. Sci., 25, 3087–3104, 2021
3094             H. Chen et al.: Global component analysis of errors in three satellite-only global precipitation estimates

Figure 4. Global land maps of the total bias and its three independent components for the three satellite-only global precipitation estimates
(i.e., IMERG-Late, GSMaP-MVK, and PERSIANN-CCS) at a spatial resolution of 0.5◦ and daily temporal resolution during the SON season
(September–November) for the period from 2015 to 2019 (5 years): (a–c) total bias, (d–f) miss bias, (g–i) hit bias, (j–l) false bias.

Hydrol. Earth Syst. Sci., 25, 3087–3104, 2021                                              https://doi.org/10.5194/hess-25-3087-2021
H. Chen et al.: Global component analysis of errors in three satellite-only global precipitation estimates                             3095

Figure 5. Global land maps of the total bias and its three independent components for the three satellite-only global precipitation estimates
(i.e., IMERG-Late, GSMaP-MVK, and PERSIANN-CCS) at a spatial resolution of 0.5◦ and daily temporal resolution during the DJF season
(December–February) for the period from 2015 to 2019 (5 years): (a–c) total bias, (d–f) miss bias, (g–i) hit bias, (j–l) false bias.

https://doi.org/10.5194/hess-25-3087-2021                                              Hydrol. Earth Syst. Sci., 25, 3087–3104, 2021
3096             H. Chen et al.: Global component analysis of errors in three satellite-only global precipitation estimates

Figure 6. Global land maps of systematic error for the three satellite-only global precipitation estimates (i.e., IMERG-Late, GSMaP-MVK,
and PERSIANN-CCS) at a spatial resolution of 0.5◦ and daily temporal resolution over the four seasons (i.e., MAM, JJA, SON, and DJF)
for the period from 2015 to 2019 (5 years): (a–d) IMERG-Late, (e–h) GSMaP-MVK, (i–l) PERSIANN-CCS.

Hydrol. Earth Syst. Sci., 25, 3087–3104, 2021                                           https://doi.org/10.5194/hess-25-3087-2021
H. Chen et al.: Global component analysis of errors in three satellite-only global precipitation estimates 3097
Figure 7. The three bias scores (i.e., total bias, hit bias, and miss bias) for the three satellite-only global precipitation estimates (i.e., IMER-
GLate, GSMaP-MVK, and PERSIANN-CCS) at a spatial resolution of 0.5◦ and daily temporal resolution under different rainfall intensities.
Note that the precipitation intensity categories are from references: (a) IMERG-Late, (b) GSMaP-MVK, (c) PERSIANN-CCS.
error, as shown in Fig. 6. This means that random error is ist because the reference precipitation is positive. In general,
the leading error component of the total mean squared er- the SPPs show a high degree of consistency in the three bias
ror in most regions. As discussed in the previous section, scores for different precipitation intensity classes. The hit
the SPPs show an evident seasonal dependency in several re- bias is the major error component in most classes.
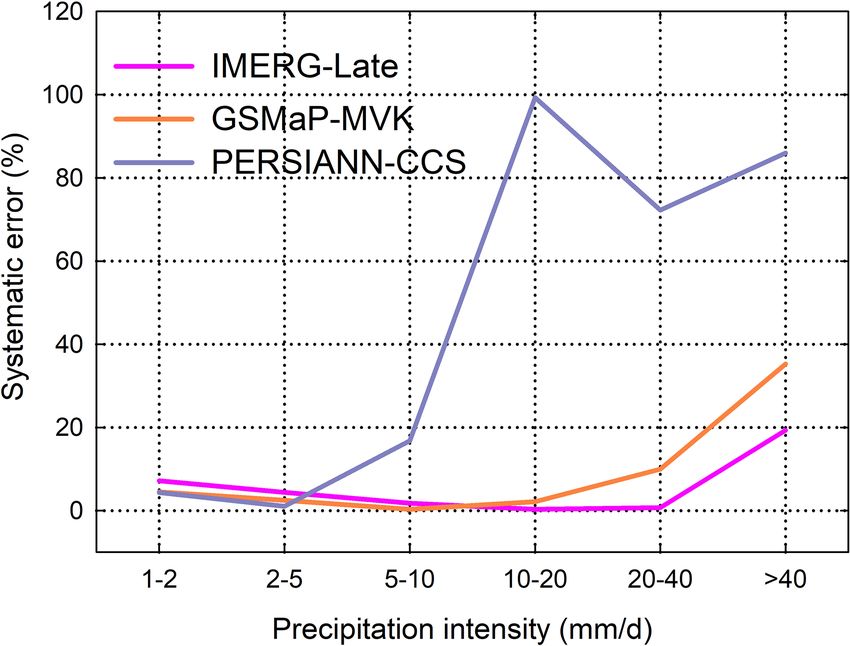
gions, such as CONUS, China, and Russia. IMERG has rel- The systematic errors of the three SPPs with six rainfall
atively large systematic errors (exceeding 80 %) in the semi- intensities are depicted in Fig. 8. Each SPP shows a unique
humid and semi-arid regions of CONUS during DJF. Sim- variation in systematic error with increasing precipitation in-
ilarly, the systematic errors of IMERG are very large (over tensity. One can see that IMERG and GSMaP have less sys-
90 %) over mainland China (except for humid regions) dur- tematic error (close to 0 %) than PERSIANN-CCS for in-
ing DJF. For GSMaP, the seasonal variations mainly occur in tensities of less than 40 mm d−1 . In contrast, the systematic
mainland China and Russia. Systematic errors are larger in error of PERSIANN-CCS shows a strong and increasing re-
DJF than in other seasons over Russia. Meanwhile, it cannot lation with rainfall intensity. Additionally, all the SPPs have
be ignored that GSMaP exhibits large proportions of system- relatively large proportions of systematic error and underes-
atic error during SON in southwest China. Finally, the sys- timate the precipitation volume in rainfall events with inten-
tematic error of PERSIANN-CCS displays an obvious sea- sities of over 40 mm d−1 (see Fig. 7). This underestimation
sonality in mainland China, Europe, and eastern CONUS, for heavy rainfall events certainly results in large systematic
and it is relatively large over mainland China. errors.
3.2 Dependence of error components on the 3.3 Error components for different topographies
precipitation intensity
In this section, the analysis is performed at a finer spatiotem-
The three bias scores (i.e., total bias, hit bias, and miss bias) poral resolution (0.1◦ , hourly). Additionally, the humid re-
of the three SPPs are shown in Fig. 7 for different rainfall gions of mainland China during JJA are chosen to explore the
intensities. Note that the false error component does not ex- major components of the total bias and total mean squared er-
https://doi.org/10.5194/hess-25-3087-2021 Hydrol. Earth Syst. Sci., 25, 3087–3104, 20213098 H. Chen et al.: Global component analysis of errors in three satellite-only global precipitation estimates
itation in hit orographic rainfall events and is affected by
false positives for orographic rainfall (Yamamoto and Shige,
2015).
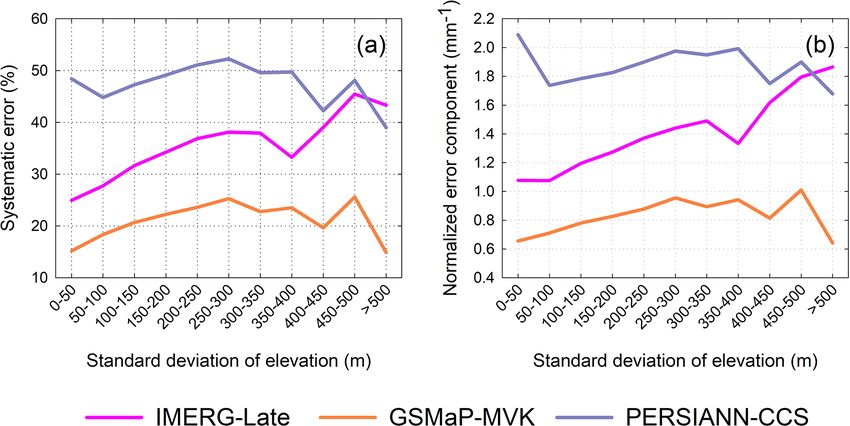
Figure 11a shows the systematic error proportions for the
three SPPs in 11 terrain SDE categories. The systematic er-
rors of all SPPs are strongly dependent on the topography,
although the SPPs exhibit distinct dependency patterns. For
IMERG-Late, the proportion of systematic error increases
with the SDE. GSMaP-MVK and PERSIANN-CCS display
similar trends in that the proportion of systematic error in-
creases with the topographic complexity when the SDE is
below 300 m but decreases with the topographic complex-
ity when the SDE is above 300 m. Compared to the other
SPPs, PERSIANN-CCS has larger systematic errors in all
Figure 8. Systematic errors of the three satellite-only global
topographic categories. Nevertheless, the results shown in
precipitation estimates (i.e., IMERG-Late, GSMaP-MVK, and
Fig. 11a may be influenced by the rainfall intensity, making it
PERSIANN-CCS) at a spatial resolution of 0.5◦ and daily temporal
resolution under different rainfall intensities. Note that the precipi- challenging to draw any inference about the influence of the
tation intensity categories are from references. topography. This issue is investigated in depth in Sect. 4.2.
4 Discussion
4.1 Potential transferability of the regional assessment
to other areas
While there are numerous evaluations of mainstream SPPs
over various regions around the globe such as CONUS, Eu-
rope, India, and China, many other regions such as Africa,
central Australia, and Mongolia lack the ground networks
needed to assess SPPs. This raises the important question of
whether the results of such evaluations can be extrapolated to
other similar areas where no ground observations are avail-
able. Thus, the transferability of evaluation results to other
regions needs to be investigated.
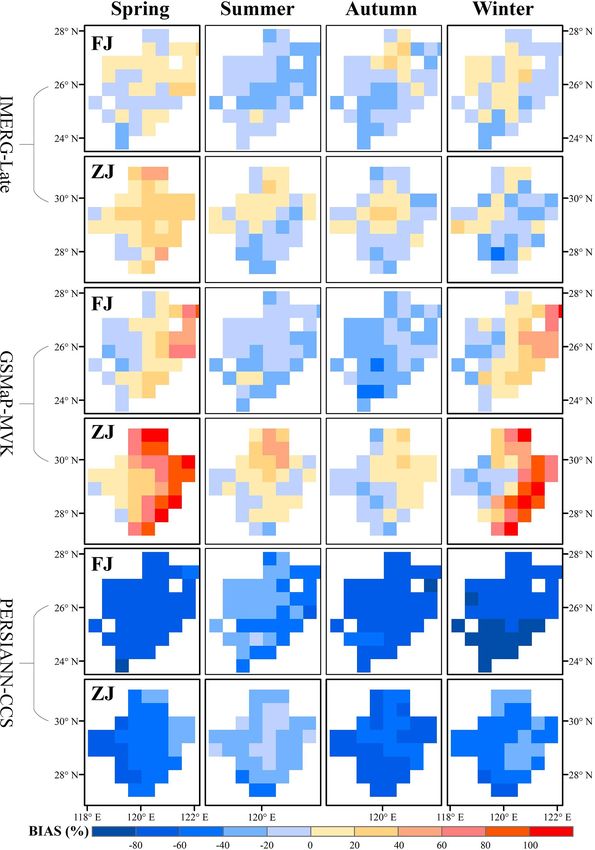
A comparison of the total bias between the Chinese Fujian
Figure 9. Number of gauges in each topography class.
(FJ) and Zhejiang (ZJ) provinces is regarded as a representa-
tive example of such an analysis. The two areas are located
in the humid regions of mainland China. They are dominated
ror in different topography categories in order to exclude in- by the same monsoon climate and have a similar topography.
terference from other factors (e.g., climate and season). Ob- For each SPP, the spatial distribution of the total bias shows
servations from 25 982 rain gauges are used as the bench- large differences between FJ and ZJ provinces, as shown in
mark to ensure the reliability of the error results (Chen et al., Fig. 12. It appears that the evaluation results for one area are
2020a). The number of gauges in each topography category not transferable to another similar area. Chen et al. (2019b)
is displayed in Fig. 9. found that there are large differences in performance between
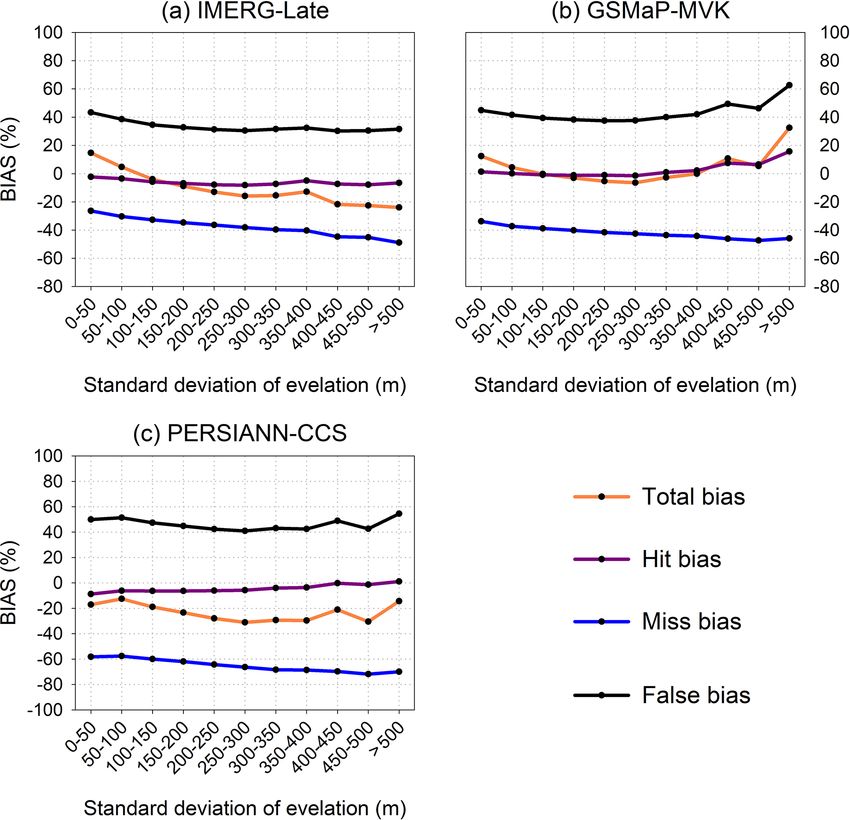
The four bias metrics are shown in Fig. 10 for different various sensors onboard different satellites, which may be re-
terrain classes. The SPPs show similarities in the variations lated to the sampling frequency (see Fig. 2 in Chen et al.,
of the four bias scores with terrain. The miss biases decrease 2019b). Differences in total bias between areas may also be
with increasing SDE. Also, the miss (false) bias is the main caused by other factors (e.g., characteristics of precipitation
contributor to the underestimation (overestimation) of the regimes, such as precipitation types) not captured by satel-
precipitation. SPP performance is influenced by the topogra- lites or the reference. Future evaluation efforts should focus
phy to different extents for different SPPs. Among the SPPs, on ungauged regions and explore novel methods that do not
the four bias metrics of GSMaP-MVK display the strongest depend on ground observations.
topographic dependency, especially in terms of the false and
hit error components. A possible explanation for this is that
the orographic/nonorographic rainfall classification scheme
used in the GSMaP retrieval tends to overestimate precip-
Hydrol. Earth Syst. Sci., 25, 3087–3104, 2021 https://doi.org/10.5194/hess-25-3087-2021H. Chen et al.: Global component analysis of errors in three satellite-only global precipitation estimates 3099 Figure 10. The four bias scores (i.e., total bias, hit bias, miss bias, and false bias) of the three satellite-only global precipitation estimates (i.e., IMERG-Late, GSMaP-MVK, and PERSIANN-CCS) for different terrains. Note that the analysis was executed at a spatial resolution of 0.1◦ and hourly temporal resolution in the humid regions of mainland China over the JJA (summer) season for the period from 2015 to 2019 (5 years): (a) IMERG-Late, (b) GSMaP-MVK, (c) PERSIANN-CCS. Figure 11. (a) Systematic errors of the three satellite-only global precipitation estimates (i.e., IMERG-Late, GSMaP-MVK, and PERSIANN- CCS) for different topographies; (b) variation in the normalized error component (NEC) of each satellite-only global precipitation estimate with increasing terrain complexity. Note that the analysis was executed at a spatial resolution of 0.1◦ and hourly temporal resolution in the humid regions of mainland China over the JJA (summer) season for the period from 2015 to 2019 (5 years). https://doi.org/10.5194/hess-25-3087-2021 Hydrol. Earth Syst. Sci., 25, 3087–3104, 2021
3100              H. Chen et al.: Global component analysis of errors in three satellite-only global precipitation estimates

Figure 12. Spatial maps of the total biases of the three SPPs over the Fujian (FJ) and Zhejiang (ZJ) provinces, respectively, for four seasons.

4.2    Impact of topography on the systematic error                       designed to exclude the impact of the precipitation intensity
                                                                          on the systematic error. It is used to extract the influence of
                                                                          topography on the systematic error.
The results presented in Sect. 3.2 indicate that the system-
                                                                             Figure 11b shows the variations of the NEC with the SDE
atic error is dependent on the rainfall intensity. Although the
                                                                          for the three SPPs over the summer season in the humid
analysis focused on the humid regions of mainland China
                                                                          regions of mainland China. It is obvious that the relation-
during the summer season to alleviate any interference from
                                                                          ship between the NEC and SDE is highly similar to that
climate and seasonal factors in the systematic error, there are
                                                                          between the systematic error and SDE. The similarity of
expected to be discrepancies between topography categories
                                                                          these two relationships can be explained by noting that the
in precipitation intensity, which would in turn affect the sys-
                                                                          mean precipitation (i.e., G, see Eq. 10) of all the SDEs is
tematic error proportions for the SPPs. The NEC metric is

Hydrol. Earth Syst. Sci., 25, 3087–3104, 2021                                               https://doi.org/10.5194/hess-25-3087-2021
H. Chen et al.: Global component analysis of errors in three satellite-only global precipitation estimates 3101
close to 0.24 mm h−1 . The relationship between the NEC and 5 Conclusion
SDE degenerates into the relationship between the system-
atic error and SDE if the mean precipitation is similar for This paper has investigated the major components of the total
all topographic classes. According to the results shown in error for three SPPs (i.e., IMERG-Late, GSMaP-MVK, and
Fig. 11b, the impact of topography on the systematic error PERSIANN-CCS) over different seasons, rainfall intensities,
for IMERG increases with terrain complexity. For GSMaP and topographies. The major conclusions can be summarized
and PERSIANN-CCS, the systematic error increases (de- as follows:
creases) with topographic complexity when the SDE is less 1. This study is the first to depict global maps of the total
than (above) 300 m. bias (total mean squared error) and its three (two) inde-
pendent components for three SPPs over four seasons.
4.3 Which factors cause the largest systematic errors?
The errors were found to have remarkably regional fea-
In general, the proportions of systematic error for the three tures, and the evaluation results showed that there was
evaluated SPPs are below 20 % for all four seasons and over limited transferability from one region to another. This
most of the global land area. However, it cannot be ignored can be attributed to differences in satellite sampling be-
that these SPPs have larger systematic errors in several re- tween areas and may also be caused by other factors
gions, such as parts of CONUS, China, and Russia (see (e.g., characteristics of precipitation regimes, such as
Fig. 6). In addition, in these areas associated with larger sys- precipitation types) that cannot be captured by satellites
tematic errors, the SPPs always have relatively large miss bi- or the reference. This finding highlights the need to as-
ases (see Figs. 2–6), implying that miss bias tends to produce sess satellite precipitation products over various regions
larger systematic errors than hit and false biases do, accord- of the world. Future efforts should focus on areas with a
ing to the definition of systematic and random errors (see lack of evaluation and on investigating novel evaluation
Eqs. 7 and 8). techniques that do not rely on ground-based observa-
tions.
4.4 Potential methods of improving satellite retrieval 2. Hit and/or false errors are the major components of the
algorithms and error adjustment models total bias for the three SPPs over most areas of the world
(see Table S1). The systematic error proportions are be-
The results in this study suggest that the quality of the eval-
low 20 % and display a strong seasonality in several re-
uated SPPs has significant room for further improvement.
gions such as CONUS, China, and Russia. It appears
Several recent studies have attempted to reduce the errors
that missed precipitation is a decisive factor that pro-
in satellite precipitation retrievals by considering only sea-
duces large systematic errors. The evaluation results in-
sonal rainfall intensity and/or topographic factors in their er-
dicate that satellite retrieval algorithms and error ad-
ror adjustment models or blending algorithms (e.g., Tian et
justment algorithms should focus on reducing the hit
al., 2010b; Hashemi et al., 2017; Bhuiyan et al., 2018; Le
and false biases in these SPPs over most regions of the
et al., 2018; Choubin et al., 2019; Shen et al., 2019; Baez-
world.
Villanueva et al., 2020). In practice, the errors show signifi-
cant regional features (at least for the three evaluated SPPs). 3. All the SPPs exhibit a high degree of consistency in
The impact of several key factors (i.e., topography, season, the three bias scores (i.e., total bias, hit bias, and miss
climate, and rainfall intensity) is very significant, suggest- bias) with different rainfall intensities. Their total biases
ing that the incorporation of all four factors (i.e., topography, come primarily from the hit error component. Each SPP
season, climate region/different areas, and rainfall intensity) displays a specific relationship between the systematic
into error adjustment models and blending algorithms should error and precipitation intensity. All the SPPs have rel-
further reduce the errors of satellite precipitation estimates. atively large systematic errors for rainfall events with
Second, the global maps of total bias (total mean squared intensities exceeding 40 mm d−1 .
error) and its three (two) components indicate that hit and/or
false errors are the major contributors to the total bias. Ran- 4. All the SPPs show considerable similarities in terms of
dom error was found to be the major component of the to- the four bias metrics (i.e., total bias, hit bias, miss bias,
tal mean squared error. Consequently, satellite retrieval al- and false bias) for most SDE classes. Among the SPPs,
gorithms and error adjustment algorithms should focus on the four bias scores of GSMaP show the strongest to-
reducing the hit and false biases in these SPPs over most re- pographic dependency, especially for false bias and hit
gions of the world. bias. The three SPPs exhibit different dependencies of
Finally, the findings of this study are relevant to the the systematic error on the topography. The NEC met-
improvement of gauge-adjusted versions of the satellite ric was proposed as a means to isolate the influence of
retrievals (e.g., GSMaP-Gauge blends GSMaP-MVK and topography on the systematic error. It was found that
CPCU data). the relationship between the NEC and topography de-
generates into the relationship between the systematic
https://doi.org/10.5194/hess-25-3087-2021 Hydrol. Earth Syst. Sci., 25, 3087–3104, 20213102 H. Chen et al.: Global component analysis of errors in three satellite-only global precipitation estimates
error and topography, primarily because the mean pre- References
cipitation (i.e., G, see Eq. 10) was ∼ 0.24 mm h−1 in all
terrain categories.
AghaKouchak, A., Behrangi, A., Sorooshian, S., Hsu, K., and Ami-
tai, E.: Evaluation of satellite retrieved extreme precipitation
The new findings reported in this paper will be useful for im- rates across the central United States, J. Geophys., Res.-Atmos.,
proving satellite precipitation retrieval algorithms and error 116, D02115, https://doi.org/10.1029/2010JD014741, 2011.
adjustment models, as well as the potential applications of AghaKouchak, A., Mehran, A., Norouzi, H., and Behrangi,
the products. A.: Systematic and random error components in satellite
precipitation data sets, Geophys. Res. Lett., 39, L09406,
https://doi.org/10.1029/2012GL051592, 2012.
Baez-Villanueva, O. M., Zambrano-Bigiarini, M., Beck, H. E.,
Code and data availability. The IMERG suite data can be obtained
McNamara, I., Ribbe, L., Nauditt, A., Birkel, C., Verbist, K.,
from https://pmm.nasa.gov/data-access/downloads/gpm (last ac-
Giraldo-Osorio, J. D., and Thinh, N. X.: RF-MEP: A novel ran-
cess: 20 February 2021) (NASA, 2021); the GSMaP suite data can
dom forest method for merging gridded precipitation products
be obtained from ftp://rainmap:Niskur+1404@hokusai.eorc.jaxa.
and ground-based measurements, Remote Sens. Environ., 239,
jp/ (last access: 20 February 2021); the ground-based data for main-
111606, https://doi.org/10.1016/j.rse.2019.111606, 2020.
land China can be downloaded from http://data.cma.cn (last access:
Beck, H. E., Vergopolan, N., Pan, M., Levizzani, V., van Dijk,
20 February 2021); and the CPCU data can be downloaded from
A. I. J. M., Weedon, G. P., Brocca, L., Pappenberger, F.,
ftp://ftp.cpc.ncep.noaa.gov/precip/ (last access: 20 February 2021).
Huffman, G. J., and Wood, E. F.: Global-scale evaluation of
The MATLAB codes used in this study can be obtained by contact-
22 precipitation datasets using gauge observations and hydro-
ing the first author (hanqingchen1007@163.com).
logical modeling, Hydrol. Earth Syst. Sci., 21, 6201–6217,
https://doi.org/10.5194/hess-21-6201-2017, 2017.
Beck, H. E., Pan, M., Roy, T., Weedon, G. P., Pappenberger, F., van
Supplement. The supplement related to this article is available on- Dijk, A. I. J. M., Huffman, G. J., Adler, R. F., and Wood, E.
line at: https://doi.org/10.5194/hess-25-3087-2021-supplement. F.: Daily evaluation of 26 precipitation datasets using Stage-IV
gauge-radar data for the CONUS, Hydrol. Earth Syst. Sci., 23,
207–224, https://doi.org/10.5194/hess-23-207-2019, 2019.
Author contributions. HC was responsible for the conceptualiza- Bhuiyan, M. A. E., Nikolopoulos, E. I., Anagnostou, E. N.,
tion, methodology, software, formal analysis, writing, and funding Quintana-Seguí, P., and Barella-Ortiz, A.: A nonparamet-
acquisition. BY was responsible for writing – reviewing and edit- ric statistical technique for combining global precipitation
ing –, project administration, and funding acquisition. PEK was re- datasets: development and hydrological evaluation over the
sponsible for writing – reviewing and editing. LW was responsible Iberian Peninsula, Hydrol. Earth Syst. Sci., 22, 1371–1389,
for writing – reviewing and editing – and methodology. YH was https://doi.org/10.5194/hess-22-1371-2018, 2018.
responsible for the conceptualization. Chen, H., Lu, D., Zhou, Z., Zhu, Z., Ren, Y., and Yong, B.: An
overview of the evaluation of satellite precipitation Products for
Global Precipitation Measurement (GPM) (in Chinese), Water
Competing interests. The authors declare that they have no conflict Resour. Prot., 35, 27–34, 2019a.
of interest. Chen, H., Yong, B., Gourly, J. J., Liu, J., Ren, L., Wang, W., Hong,
Y., and Zhang, J.: Impact of the Crucial Geographical and Cli-
matic Factors on the Input Source Errors of GPM-based Global
Acknowledgements. We would like to express our most sincere Satellite Precipitation Estimates, J. Hydrol., 575, 1–16, 2019b.
thanks to the editor Graham Jewitt, the reviewer Viviana Maggioni, Chen, H., Yong, B., Qi, W., Wu, H., Ren, L., and Hong, Y.: Investi-
and another anonymous reviewer for their efforts in improving the gating the Evaluation Uncertainty for Satellite Precipitation Esti-
quality of this paper. mates Based on Two Different Ground Precipitation Observation
Products, J. Hydrometeorol., 21, 2595–2606, 2020a.
Chen, H., Yong, B., Shen, Y., Liu, J., Hong, Y., and
Financial support. This research has been supported by the Na- Zhang, J.: Comparison analysis of six purely satellite-
tional Key Research and Development Program of China (grant derived global precipitation estimates, J. Hydrol., 581, 124376,
no. 2018YFA0605402), the National Natural Science Foundation https://doi.org/10.1016/j.jhydrol.2019.124376, 2020b.
of China (grant no. 51979073), and the Key Laboratory for Digital Chen, M., Shi, W., Xie, P., Silva, V. B., Kousky, V. E.,
Land and Resources of Jiangxi Province, East China University of Wayne Higgins, R., and Janowiak, J. E.: Assessing ob-
Technology (grant no. DLLJ201907). jective techniques for gauge-based analyses of global
daily precipitation, J. Geophys. Res.-Atmos., 113, D04110,
https://doi.org/10.1029/2007JD009132, 2008.
Chen, S., Hong, Y., Cao, Q., Gourley, J. J., Kirstetter, P. E., Yong,
Review statement. This paper was edited by Graham Jewitt and re-
B., Tian, Y., Zhang, Z. X., Shen, Y., Hu, J. J., and Hardy, J.: Sim-
viewed by Viviana Maggioni and one anonymous referee.
ilarity and difference of the two successive V6 and V7 TRMM
multisatellite precipitation analysis performance over China, J.
Geophys. Res.-Atmos., 118, 13060–13074, 2013.
Hydrol. Earth Syst. Sci., 25, 3087–3104, 2021 https://doi.org/10.5194/hess-25-3087-2021H. Chen et al.: Global component analysis of errors in three satellite-only global precipitation estimates 3103 Choubin, B., Khalighisigaroodi, S., Mishra, A. K., Goodarzi, M., Maggioni, V., Sapiano, M. R., and Adler, R. F.: Estimating Uncer- Shamshirband, S., Ghaljaee, E., and Zhang, F.: A novel bias cor- tainties in High-Resolution Satellite Precipitation Products: Sys- rection framework of TMPA 3B42 daily precipitation data using tematic or Random Error?, J. Hydrometeorol., 17, 1119–1129, similarity matrix/homogeneous conditions, Sci. Total Environ., 2016b. 694, 133680, https://doi.org/10.1016/j.scitotenv.2019.133680, NASA: Precipitation Data Directory, available at: https://pmm.nasa. 2019. gov/data-access/downloads/gpm, last access: 20 February 2021. Gebregiorgis, A. S., Kirstetter, P.-E., Hong, Y. E., Gourley, J. J., Prakash, S., Mitra, A. K., AghaKouchak, A., Liu, Z., Norouzi, H., Huffman, G. J., Petersen, W. A., Xue, X., and Schwaller, M. R.: and Pai, D. S.: A preliminary assessment of GPM-based multi- To what extent is the day 1 GPM IMERG satellite precipitation satellite precipitation estimates over a monsoon dominated re- estimate improved as compared to TRMM TMPA-RT?, J. Geo- gion, J. Hydrol., 556, 865–876, 2018. phys. Res.-Atmos., 123, 1694–1707, 2018. Shen, G., Chen, N., Wang, W., and Chen, Z.: WHU-SGCC: a Guo, H., Bao, A., Ndayisaba, F., Liu, T., Kurban, A., and De novel approach for blending daily satellite (CHIRP) and pre- Maeyer, P.: Systematical Evaluation of Satellite Precipitation Es- cipitation observations over the Jinsha River basin, Earth Syst. timates Over Central Asia Using an Improved Error-Component Sci. Data, 11, 1711–1744, https://doi.org/10.5194/essd-11-1711- Procedure, J. Geophys. Res.-Atmos., 122, 10906–10927, 2017. 2019, 2019. Hashemi, H., Nordin, M., Lakshmi, V., Huffman, G. J., and Knight, Shen, Y. and Xiong, A.: Validation and comparison of a new gauge- R.: Bias Correction of Long-Term Satellite Monthly Precipi- based precipitation analysis over mainland China, Int. J. Clima- tation Product (TRMM 3B43) over the Conterminous United tol., 36, 252–265, 2016. States, J. Hydrometeorol., 18, 2491–2509, 2017. Shen, Y., Zhao, P., Pan, Y., and Yu, J.: A high spatiotemporal gauge- Hong, Y., Hsu, K. L., Sorooshian, S., and Gao, X.: Precipitation satellite merged precipitation analysis over China, J. Geophys. estimation from remotely sensed imagery using an artificial neu- Res.-Atmos., 119, 3063–3075, 2014. ral network cloud classification system, J. Appl. Meteorol., 43, Skofronick-Jackson, G., Petersen, W. A., Berg, W., Kidd, C., 1834–1853, 2004. Stocker, E. F., Kirschbaum, D. B., Kakar, R., Braun, S. A., Huff- Hou, A. Y., Kakar, R. K., Neeck, S., Azarbarzin, A. A., Kum- man, G. J., Lguchi, T., Kirstetter, P. E., Kummerow, C., Menegh- merow, C. D., Kojima, M., Oki, R., Nakamura, K., and Lguchi, ini, R., Oki, R., Olson, W. S., Takayabu, Y. N., Furukawa, K., and T.: The global precipitation measurement mission, B. Am. Mete- Wilheit, T.: The Global Precipitation Measurement (GPM) mis- orol. Soc., 95, 701–722, 2014. sion for science and society, B. Am. Meteorol. Soc., 98, 1679– Huffman, G. J., Bolvin, D. T., Nelkin, E. J., and Tan, J.: Integrated 1695, 2017. Multi-satellitE Retrievals for GPM (IMERG) Technical Docu- Sorooshian, S., Hsu, K. L., Gao, X., Gupta, H. V., Imam, B., mentation, NASA/GSFC, 1, 2019. and Braithwaite, D.: Evaluation of PERSIANN system satellite- Kidd, C. and Huffman, G. J.: Global precipitation measurement, based estimates of tropical rainfall, B. Am. Meteorol. Soc., 81, Meteorol. Appl., 18, 334–353, 2011. 2035–2046, 2000. Kidd, C. and Levizzani, V.: Status of satellite precipita- Su, J., Lü, H., Zhu, Y., Wang, X., and Wei, G.: Component anal- tion retrievals, Hydrol. Earth Syst. Sci., 15, 1109–1116, ysis of errors in four GPM-based precipitation estimations over https://doi.org/10.5194/hess-15-1109-2011, 2011. Mainland China, Remote Sens., 10, 1420, 2018. Kidd, C., Becker, A., Huffman, G. J., Muller, C. L., Joe, P., Sungmin, O. and Kirstetter, P. E.: Evaluation of diurnal variation Skofronick-Jackson, G., and Kirschbaum, D. B.: So, how much of GPM IMERG-derived summer precipitation over the contigu- of the Earth’s surface is covered by rain gauges?, B. Am. Meteo- ous US using MRMS data, Q. J. Roy. Meteorol. Soc., 144, 270– rol. Soc., 98, 69–78, 2017. 281, 2018. Kirstetter, P. E., Hong, Y., Gourley, J. J., Schwaller, M., Petersen, Takido, K., Valeriano, O. C. S., Ryo, M., Tanuma, K., Ushio, T., W., and Zhang, J.: Comparison of TRMM 2A25 products, ver- and Kubota, T.: Spatiotemporal evaluation of the gauge-adjusted sion 6 and version 7, with NOAA/NSSL ground radar-based Na- global satellite mapping of precipitation at the basin scale, J. Me- tional Mosaic QPE, J. Hydrometeorol., 14, 661–669, 2013. teorol. Soc. Jpn., 94, 185–195, 2016. Kirstetter, P. E., Karbalaee, N., Hsu, K., and Hong, Y.: Probabilistic Tan, J., Petersen, W. A., Kirstetter, P. E., and Tian, Y.: Performance precipitation rate estimates with space-based infrared sensors, Q. of IMERG as a function of spatiotemporal scale, J. Hydrometeo- J. Roy. Meteor. Soc., 144, 191–205, 2018. rol., 18, 307–319, 2017. Le, H. M., Sutton, J. R., Du Bui, D., Bolten, J. D., and Tapiador, F. J., Turk, F. J., Petersen, W., Hou, A. Y., García-Ortega, Lakshmi, V.: Comparison and Bias Correction of TMPA E., Machado, L. A. T., Angelis, C. F., Salio, P., Kidd, C., Huff- Precipitation Products over the Lower Part of Red-Thai man, G. J., and de Castro, M.: Global precipitation measurement: Binh River Basin of Vietnam, Remote Sens., 10, 1582, methods, datasets and applications, Atmos. Res., 105, 70–97, https://doi.org/10.3390/rs10101582, 2018. 2012. Liu, Z.: Comparison of ntegrated Multi-satellite Retrievals for Tian, Y. and Peters-Lidard, C. D.: A global map of uncertainties in GPM (IMERG) and TRMM Multi-satellite Precipitation Analy- satellite-based precipitation measurements, Geophys. Res. Lett., sis (TMPA) monthly precipitation products: initial results, J. Hy- 37, L24407, https://doi.org/10.1029/2010GL046008, 2010. drometeorol., 17, 777–790, 2016. Tian, Y., Peters-Lidard, C. D., Eylander, J. B., Joyce, R. J., Huff- Maggioni, V., Meyers, P. C., and Robinson, M. D.: A review of man, G. J., Adler, R. F., Hsu, K. L., Turk, F. J., Garcia, M., merged high-resolution satellite precipitation product accuracy and Zeng, J.: Component analysis of errors in satellite-based during the Tropical Rainfall Measuring Mission (TRMM) era, J. precipitation estimates, J. Geophys. Res.-Atmos., 114, D24101, Hydrometeorol., 17, 1101–1117, 2016a. https://doi.org/10.1029/2009JD011949, 2009. https://doi.org/10.5194/hess-25-3087-2021 Hydrol. Earth Syst. Sci., 25, 3087–3104, 2021
3104              H. Chen et al.: Global component analysis of errors in three satellite-only global precipitation estimates

Tian, Y., Peters-Lidard, C. D., and Eylander, J. B.: Real-Time Bias     Yong, B., Ren, L., Hong, Y., Wang, J. H., Gourley, J. J., Jiang,
   Reduction for Satellite-Based Precipitation Estimates, J. Hy-          S., Chen, X., and Wang, W.: Hydrologic evaluation of Mul-
   drometeorol., 11, 1275–1285, 2010.                                     tisatellite Precipitation Analysis standard precipitation prod-
Ushio, T., Sasashige, K., Kubota, T., Shige, S., Okamoto, K. I.,          ucts in basins beyond its inclined latitude band: A case study
   Aonashi, K., Inoue, T., Takahashi, N., Iguchi, T., Kachi, M., Oki,     in Laohahe basin, China, Water Resour. Res., 46, W07542,
   R., Morimoto, T., and Kawasaki, Z. I.: A Kalman filter approach        https://doi.org/10.1029/2009WR008965, 2010.
   to the Global Satellite Mapping of Precipitation (GSMaP) from        Yong, B., Ren, L., Hong, Y., Gourley, J. J., Tian, Y., Huffman, G.
   combined passive microwave and infrared radiometric data, J.           J., Chen X., Wang W. G., and Wen, Y. X.: First evaluation of
   Meteorol. Soc. Jpn. Ser. II, 87, 137–151, 2009.                        the climatological calibration algorithm in the real-time TMPA
Willmott, J.: On the validation of model, Phys. Geogr., 2, 184–194,       precipitation estimates over two basins at high and low latitudes,
   1981.                                                                  Water Resour. Res., 49, 2461–2472, 2013.
Xie, P., Chen, M., Yang, S., Yatagai, A., Hayasaka, T., Fukushima,      Yong, B., Liu, D., Gourley, J. J., Tian, Y., Huffman, G. J., Ren,
   Y., and Liu, C.: A gauge-based analysis of daily precipitation         L., and Hong, Y.: Global view of real-time TRMM multisatel-
   over East Asia, J. Hydrometeorol., 8, 607–626, 2007.                   lite precipitation analysis: Implications for its successor global
Xu, R., Tian, F., Yang, L., Hu, H., Lu, H., and Hou, A.: Ground val-      precipitation measurement mission, B. Am. Meteorol. Soc., 96,
   idation of GPM IMERG and TRMM 3B42V7 rainfall products                 283–296, 2015.
   over southern Tibetan Plateau based on a high-density rain gauge     Yong, B., Chen, B., Tian, Y., Yu, Z., and Hong, Y.: Error-
   network, J. Geophys. Res.-Atmos, 122, 910–924, 2017.                   component analysis of TRMM-based multi-satellite precipita-
Xu, S., Shen, Y., and Du, Z.: Tracing the source of the errors in         tion estimates over mainland China, Remote Sens., 8, 440,
   hourly IMERG using a decomposition evaluation scheme, At-              https://doi.org/10.3390/rs8050440, 2016.
   mosphere, 7, 161, https://doi.org/10.3390/atmos7120161, 2016.        Zhang, J., Howard, K., Langston, C., Kaney, B., Qi, Y., Tang, L.,
Yamamoto, M. K. and Shige, S.: Implementation of an oro-                  Grams, H., Wang, D., Cocks, S., Martinaitis, S., Arthur, A.,
   graphic/nonorographic rainfall classification scheme in the            Cooper, K., Brogden, J., and Kitzmiller, D.: Multi-Radar Multi-
   GSMaP algorithm for microwave radiometers, Atmos. Res., 163,           Sensor (MRMS) quantitative precipitation estimation: Initial op-
   36–47, 2015.                                                           erating capabilities, B. Am. Meteorol. Soc., 97, 621–638, 2016.

Hydrol. Earth Syst. Sci., 25, 3087–3104, 2021                                             https://doi.org/10.5194/hess-25-3087-2021
You can also read