SEMANTIC SEGMENTATION OF AERIAL IMAGERY VIA MULTI-SCALE SHUFFLING CONVOLUTIONAL NEURAL NETWORKS WITH DEEP SUPERVISION - ISPRS Annals
←
→
Page content transcription
If your browser does not render page correctly, please read the page content below
ISPRS Annals of the Photogrammetry, Remote Sensing and Spatial Information Sciences, Volume IV-1, 2018
ISPRS TC I Mid-term Symposium “Innovative Sensing – From Sensors to Methods and Applications”, 10–12 October 2018, Karlsruhe, Germany

SEMANTIC SEGMENTATION OF AERIAL IMAGERY VIA MULTI-SCALE SHUFFLING
     CONVOLUTIONAL NEURAL NETWORKS WITH DEEP SUPERVISION

          Kaiqiang Chen1,2 , Michael Weinmann3 , Xian Sun1 , Menglong Yan1 , Stefan Hinz4 , Boris Jutzi4 , Martin Weinmann4

  1
   Key Laboratory of Technology in Geo-Spatial Information Processing and Application System, Institute of Electronics, Chinese
  Academy of Sciences, Beijing, P.R. China - chenkaiqiang14@mails.ucas.ac.cn, sunxian@mail.ie.ac.cn, yanmenglong@gmail.com
                                   2
                                     University of Chinese Academy of Sciences, Beijing, P.R. China
                   3
                     Institute of Computer Science II, University of Bonn, Bonn, Germany - mw@cs.uni-bonn.de
          4
            Institute of Photogrammetry and Remote Sensing, Karlsruhe Institute of Technology, Karlsruhe, Germany -
                                          (stefan.hinz, boris.jutzi, martin.weinmann)@kit.edu

                                                        Commission I, ICWG I/IV

KEY WORDS: Semantic Segmentation, Aerial Imagery, Multi-Modal Data, Multi-Scale, CNN, Deep Supervision

ABSTRACT:

In this paper, we address the semantic segmentation of aerial imagery based on the use of multi-modal data given in the form of true
orthophotos and the corresponding Digital Surface Models (DSMs). We present the Deeply-supervised Shuffling Convolutional Neural
Network (DSCNN) representing a multi-scale extension of the Shuffling Convolutional Neural Network (SCNN) with deep supervision.
Thereby, we take the advantage of the SCNN involving the shuffling operator to effectively upsample feature maps and then fuse multi-
scale features derived from the intermediate layers of the SCNN, which results in the Multi-scale Shuffling Convolutional Neural
Network (MSCNN). Based on the MSCNN, we derive the DSCNN by introducing additional losses into the intermediate layers of
the MSCNN. In addition, we investigate the impact of using different sets of hand-crafted radiometric and geometric features derived
from the true orthophotos and the DSMs on the semantic segmentation task. For performance evaluation, we use a commonly used
benchmark dataset. The achieved results reveal that both multi-scale fusion and deep supervision contribute to an improvement in
performance. Furthermore, the use of a diversity of hand-crafted radiometric and geometric features as input for the DSCNN does not
provide the best numerical results, but smoother and improved detections for several objects.

                     1. INTRODUCTION                                     segmentation, a class label should be predicted for each pixel. To
                                                                         achieve this, a rich variety of deep networks has been proposed
The semantic segmentation of aerial imagery refers to the task           (Long et al., 2015; Noh et al., 2015; Badrinarayanan et al., 2017;
of assigning a semantic label (e.g. Building, Impervious Surface,        Chen et al., 2014; Zhao et al., 2016). Meanwhile, CNNs are also
Car or Vegetation) to each pixel and thereby providing meaning-          widely applied to the semantic segmentation of aerial imagery
ful segments. Over the last few years, this kind of image inter-         (Volpi and Tuia, 2017; Marmanis et al., 2016; Maggiori et al.,
pretation has become a topic of great interest not only in remote        2017; Paisitkriangkrai et al., 2016; Chen et al., 2018a).
sensing (Volpi and Tuia, 2017; Chen et al., 2018a; Maggiori et
al., 2017; Marmanis et al., 2016; Paisitkriangkrai et al., 2016) but
also in the field of computer vision (Chen et al., 2016; Zhao et al.,
2016; Liu et al., 2015; Badrinarayanan et al., 2017). Meanwhile,
some benchmarks such as the ISPRS Benchmark on 2D Seman-
tic Labeling (Rottensteiner et al., 2012) have been initiated to
foster research on the semantic segmentation of aerial imagery.
Thereby, the given data consists of true orthophotos and the cor-
                                                                           (a) True orthophoto         (b) DSM               (c) Labeling
responding Digital Surface Models (DSMs) as shown in Figure 1.
                                                                         Figure 1. Semantic segmentation of aerial imagery: given (a) the
Given data in the form of true orthophotos and the correspond-           true orthophoto and (b) the corresponding DSM, the objective is
ing DSMs, the semantic segmentation of aerial imagery has been           to derive (c) a semantic labeling, whereby the classes of interest
addressed by extracting hand-crafted features and using standard         are given by Impervious Surfaces (white), Building (blue), Low
classifiers such as Random Forests (Weinmann and Weinmann,               Vegetation (cyan), Tree (green) and Car (yellow).
2018; Gerke and Xiao, 2014) or Conditional Random Fields
(CRFs) (Gerke, 2014). In recent years, however, the use of mod-          The adaptation of networks designed for image classification is
ern deep learning techniques has become increasingly popular,            the main approach to derive networks for semantic image seg-
as such techniques are famous for their representation capacity          mentation (Long et al., 2015; Noh et al., 2015; Chen et al., 2014;
and their ability of learning features. As one of the most suc-          Zhao et al., 2016). Thereby, several layers are involved which
cessful representatives of deep learning, Convolutional Neural           cause a reduction of resolution so that the derived labeling is very
Networks (CNNs) (Krizhevsky et al., 2012; Simonyan and Zis-              coarse. Consequently, a popular research topic is the question of
serman, 2014; He et al., 2016a) have become the most popular             how to successfully transfer the reduced resolution to the orig-
method in image classification. In the context of semantic image         inal resolution. The proposed methods can be categorized into

             This contribution has been peer-reviewed. The double-blind peer-review was conducted on the basis of the full paper.
                             https://doi.org/10.5194/isprs-annals-IV-1-29-2018 | © Authors 2018. CC BY 4.0 License.                         29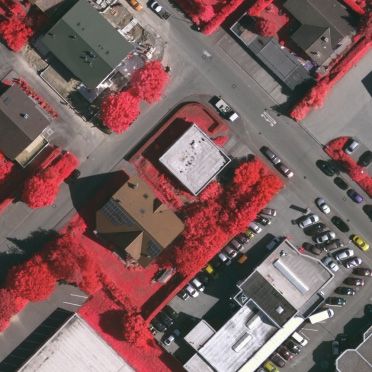
ISPRS Annals of the Photogrammetry, Remote Sensing and Spatial Information Sciences, Volume IV-1, 2018
ISPRS TC I Mid-term Symposium “Innovative Sensing – From Sensors to Methods and Applications”, 10–12 October 2018, Karlsruhe, Germany

two groups, which are fixed upsampling and learnable upsam-              approaches addressing this task has been presented (Noh et al.,
pling. Bilinear interpolation is a method of fixed upsampling for        2015; Badrinarayanan et al., 2017; Chen et al., 2014; Chen et al.,
recovering the resolution (Long et al., 2015; Chen et al., 2014;         2016; Zhao et al., 2016; Liu et al., 2015).
Chen et al., 2016). However, methods using learnable upsam-
pling (Noh et al., 2015; Badrinarayanan et al., 2017; Zhao et al.,       Most of the CNNs presented for semantic segmentation (Long et
2016; Chen et al., 2018a) have become more popular, amongst              al., 2015; Badrinarayanan et al., 2017; Chen et al., 2014; Chen et
which the deconvolution (or transposed convolution) (Noh et al.,         al., 2016) are adapted from popular networks for image classifica-
2015) is widely used in semantic segmentation of aerial imagery          tion such as the VGGNet (Simonyan and Zisserman, 2014) or the
(Volpi and Tuia, 2017; Marmanis et al., 2016). Alternatively, the        Residual Network (ResNet) (He et al., 2016a). As such networks
shuffling operator provides another solution to recover the reso-        for image classification contain several layers that cause a reduc-
lution (Shi et al., 2016; Chen et al., 2018a; Chen et al., 2018b).       tion of resolution, the outputs are of low resolution and therefore
                                                                         rather coarse. Consequently, such networks need to be adapted to
In this paper, we focus on the use of a shuffling operator (Shi          fit in the task of semantic segmentation. In this regard, an intuitive
et al., 2016) to effectively upsample feature maps and take into         solution is given by the removal of all the layers that cause resolu-
account the benefit of using multi-scale predictions. On the one         tion reduction, resulting in no-downsampling networks (Sherrah,
hand, features derived from deeper layers have stronger seman-           2016). However, such networks will suffer from computational
tic information which are robust to translation, rotation and scale,     overload and cost much more training time (Chen et al., 2018a;
but such features lack spatial information. In contrast, features        Sherrah, 2016). To reach a trade-off between computational effi-
derived from shallower layers contain more spatial information           ciency and a reasonable resolution, DeepLab (Chen et al., 2016)
due to the higher resolution and are thus significant for local-         keeps the first three layers that will cause resolution reduction
ization (e.g. in terms of boundaries between objects). Accord-           and removes the remaining ones of such layers, resulting in an
ingly, we address a multi-scale extension of the Shuffling Con-          output stride of 8. To recover the resolution to the original size,
volutional Neural Network (SCNN) (Chen et al., 2018a; Chen et            DeepLab adopts bilinear interpolation. Instead, Shuffling Convo-
al., 2018b). To achieve this, we fuse multi-scale features derived       lutional Neural Networks (SCNNs) (Chen et al., 2018a) replace
from the intermediate layers of the SCNN, which results in the           the bilinear interpolation with the shuffling operator (Shi et al.,
Multi-scale Shuffling Convolutional Neural Network (MSCNN).              2016) to recover resolution. Besides, encoder-decoder architec-
In addition, we introduce additional losses to the fused features        tures (Noh et al., 2015; Badrinarayanan et al., 2017) provide an-
of the MSCNN and thus derive the Deeply-supervised Shuffling             other solution to recover resolution, where the encoder part is re-
Convolutional Neural Network (DSCNN) as an MSCNN with                    sponsible for encoding the input to a compressed representation
deep supervision. These additional losses address the suscepti-          with a low resolution and the decoder part adequately transfers
bility of deep networks to the vanishing gradient problem by in-         the compressed representation to the original image size.
jecting additional errors into the intermediate layers of the deep
network, resulting in a better convergence. Besides the presen-          Features derived from deeper layers have stronger semantic infor-
tation of the MSCNN and the DSCNN, we involve a variety of               mation but lack spatial information. In contrast, features derived
hand-crafted radiometric and geometric features extracted from           from shallower layers contain more accurate spatial information
the true orthophotos and the corresponding DSMs for the clas-            due to the higher resolution, which in turn can be beneficial for
sification task. Based on a separate and combined consideration          a better localization. Therefore, an intuitive idea is borrowing
of these features, we explore the value of the different modalities      spatial information from features with high resolution, which has
for the classification task. For performance evaluation, we test         actually been adopted by many approaches (Long et al., 2015;
our approaches on a benchmark dataset provided with the ISPRS            Noh et al., 2015; Badrinarayanan et al., 2017; Zhao et al., 2016;
Benchmark on 2D Semantic Labeling.                                       Ronneberger et al., 2015). For the DecovNet (Noh et al., 2015)
                                                                         and the SegNet (Badrinarayanan et al., 2017), the unpooling oper-
After briefly describing related work in Section 2, we explain           ator has been proposed to transfer the values in the low-resolution
our methodology for the semantic segmentation of aerial imagery          feature maps to the corresponding positions in the high-resolution
based on multi-modal data in Section 3. Thereby, we focus on             feature maps. Alternatively, a more intuitive solution is given by
the extraction of hand-crafted features as the basis for classifi-       fusing high-resolution features from shallower layers with low-
cation and on the construction of three different types of deep          resolution features from deeper layers progressively (Long et al.,
networks given by the SCNN, the MSCNN and the DSCNN, re-                 2015; Ronneberger et al., 2015) or at once (Zhao et al., 2016). In
spectively. To demonstrate the performance of these networks,            this paper, we adopt the intuitive way of fusing multi-scale fea-
we present the results achieved for a standard benchmark dataset         tures progressively instead of using the unpooling operator.
in Section 4. A detailed analysis and discussion of the derived
results is given in Section 5. Finally, we provide concluding re-        Especially for very deep networks, the vanishing gradient prob-
marks and suggestions for future work in Section 6.                      lem represents a big challenge for the optimization of neural
                                                                         networks. More specifically, the gradient of the error func-
                                                                         tion decreases when being backpropagated to previous layers
                     2. RELATED WORK                                     during training and, if the gradient becomes too small, the re-
                                                                         spective weights of the network remain unchanged (He et al.,
Since the great success of the AlexNet (Krizhevsky et al., 2012)         2016b). Though some concepts like batch normalization (Ioffe
in the ImageNet Large Scale Visual Recognition Challenge                 and Szegedy, 2015) and residual connection (He et al., 2016a)
(ILSVRC) (Russakovsky et al., 2015), Convolutional Neural Net-           have been proposed to address this issue, it cannot be thoroughly
works (CNNs) have become the most popular method in com-                 solved. Deep supervision (Szegedy et al., 2015; Marmanis et al.,
puter vision regarding image classification, object detection and        2016; Lee et al., 2014; Lin et al., 2016) provides an option for
semantic segmentation. The Fully Convolutional Network (FCN)             better training by appending additional losses in the intermedi-
(Long et al., 2015) can be considered as the first approach to ap-       ate layers. In this paper, we inject two additional losses in the
ply CNNs for semantic segmentation. Since then, a variety of             intermediate layers in order to achieve deep supervision.

             This contribution has been peer-reviewed. The double-blind peer-review was conducted on the basis of the full paper.
                             https://doi.org/10.5194/isprs-annals-IV-1-29-2018 | © Authors 2018. CC BY 4.0 License.                         30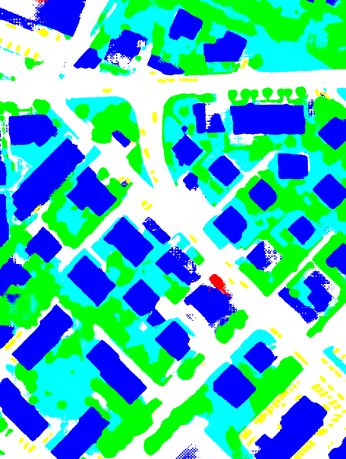
ISPRS Annals of the Photogrammetry, Remote Sensing and Spatial Information Sciences, Volume IV-1, 2018
ISPRS TC I Mid-term Symposium “Innovative Sensing – From Sensors to Methods and Applications”, 10–12 October 2018, Karlsruhe, Germany

Further approaches directly address the deep semantic segmenta-          al., 2012). Furthermore, we involve normalized colors as a sim-
tion of aerial imagery based on multi-modal data, e.g. by involv-        ple example of color invariants with improved robustness with
ing an encoder-decoder architecture (Volpi and Tuia, 2017) or            respect to changes in illumination (Gevers and Smeulders, 1999),
adaptations of the VGGNet (Chen et al., 2018a) and the ResNet            yielding normalized near-infrared (nNIR), normalized red (nR)
(Chen et al., 2018b). To aggregate multi-scale predictions within        and normalized green (nG) values. Finally, we also consider the
a deep network, a modification of the SegNet introduces a multi-         Normalized Difference Vegetation Index (NDVI) (Rouse, Jr. et
kernel convolutional layer allowing for convolutions with several        al., 1973) as a strong indicator for vegetation and a slight varia-
filter sizes (Audebert et al., 2016). Alternatively, a deep network      tion represented by the Green Normalized Difference Vegetation
in which spatial features are learned at multiple resolutions and a      Index (GNDVI) (Gitelson and Merzlyak, 1998) which is more
specific module which learns how to combine these features can           sensitive to the chlorophyll concentration than the original NDVI.
be combined (Maggiori et al., 2017). Further strategies to fuse
the multi-modal geospatial data within a deep learning frame-            Geometric Features: Based on the DSM, we derive the nor-
work have been presented in (Marmanis et al., 2016; Audebert et          malized DSM (nDSM) describing the heights of objects above
al., 2016; Audebert et al., 2018; Liu et al., 2017). An alternative      ground, which might be more informative than the DSM itself.
strategy to better retain boundaries between objects in the clas-        For this purpose, we use the approach presented in (Gerke, 2014)
sification results is to take into account semantically meaningful       which classifies pixels into ground and off-ground pixels using
boundaries, e.g. by including an explicit object boundary detector       LAStools1 and then adapts the height of each off-ground pixel by
in the SegNet encoder-decoder architecture or in FCN-type mod-           subtracting the height of the closest ground point. Furthermore,
els (Marmanis et al., 2018). While all these approaches focus on         we consider geometric features in the form of local 3D shape
the classification pipeline, only little attention has been paid to      features extracted from the DSM. Based on the spatial 3D coor-
the input data itself. Few investigations involve very basic hand-       dinates corresponding to a local 3 × 3 image neighborhood, we
crafted features given by the Normalized Difference Vegetation           efficiently derive the 3D structure tensor (Weinmann and Wein-
Index (NDVI) and the normalized Digital Surface Model (nDSM)             mann, 2018) and normalize its three eigenvalues by their sum.
(Gerke, 2014; Audebert et al., 2016; Liu et al., 2017). Other            The normalized eigenvalues, in turn, are then used to calculate
kinds of hand-crafted radiometric or geometric features which            the features of linearity (L), planarity (P), sphericity (S), om-
can be extracted from a local image neighborhood (Gerke and              nivariance (O), anisotropy (A), eigenentropy (E) and change of
Xiao, 2014; Weinmann and Weinmann, 2018) have however only               curvature (E) (West et al., 2004; Pauly et al., 2003) which have
rarely been involved, although, in the context of classifying aerial     been involved in a variety of investigations for 3D scene analysis
imagery based on given true orthophotos and the corresponding            (Demantké et al., 2011; Weinmann, 2016; Hackel et al., 2016).
DSMs, it has recently been demonstrated that the additional con-
                                                                         3.2   Supervised Classification
sideration of such hand-crafted radiometric and geometric fea-
tures on a per-pixel basis may lead to improved classification re-       Once feature maps have been extracted, we use them as input to
sults (Chen et al., 2018b). In this paper, we focus on a multi-scale     a deep network. Relying on the idea of a Shuffling Convolutional
extension of Shuffling Convolutional Neural Networks (Chen et            Neural Network (SCNN, presented in Section 3.2.1), we intro-
al., 2018a; Chen et al., 2018b) involving deep supervision, and          duce the fusion of features of different scales as common strategy
we thereby also involve a diversity of hand-crafted radiometric          to address the localization/recognition trade-off (Maggiori et al.,
and geometric features extracted from the true orthophotos and           2017). This results in a Multi-scale Shuffling Convolution Neu-
their corresponding DSMs, respectively.                                  ral Network (MSCNN, presented in Section 3.2.2). Furthermore,
                                                                         we present an extension in the form of an MSCNN with deep su-
                                                                         pervision (DSCNN, presented in Section 3.2.3) which allows an
                     3. METHODOLOGY
                                                                         improved classification due to the use of additional losses.

In this section, we describe our methodology for the semantic in-        3.2.1 SCNN: In theory, any network designed for image clas-
terpretation of aerial imagery by exploiting data of several modal-      sification can be adapted to a Shuffling Convolutional Neural
ities. Thereby, we first focus on the extraction of hand-crafted ra-     Network (SCNN) for dense semantic image segmentation. The
diometric and geometric features and the creation of feature maps        original SCNN (Chen et al., 2018a) is adapted from the VGGNet
(Section 3.1). Subsequently, we provide a detailed explanation of        (Simonyan and Zisserman, 2014), while the Residual Shuffling
our proposed deep networks receiving the defined feature maps            Convolutional Neural Network (RSCNN) (Chen et al., 2018b) is
as input (Section 3.2). The result is a dense labeling, i.e. each        adapted from the ResNet (He et al., 2016a). Thereby, the adap-
pixel is assigned a respective semantic label.                           tation consists in involving a shuffling operator as an efficient
                                                                         operator to realize the upscaling of feature maps without intro-
3.1   Feature Extraction                                                 ducing additional parameters. The concept of a shuffling opera-
                                                                         tor has originally been introduced for super-resolution (Shi et al.,
Given an orthophoto and the corresponding DSM on a regular               2016) and also been used for the semantic segmentation of aerial
grid, we first extract a set of hand-crafted radiometric and geo-        imagery (Chen et al., 2018a; Chen et al., 2018b). More specif-
metric features for all points on the grid. The derived features         ically, the upscaling of feature maps is achieved by combining
may thus be stored in the form of a stack of feature maps (i.e. im-      feature maps in a periodic shuffling manner to increase the reso-
ages containing the values of a respective feature on a per-pixel        lution, which forces the network to learn upscaling. For example,
basis) which later serves as input to a deep network.                    if we need to double the resolution of the feature map, we can
                                                                         combine four feature maps as illustrated in Figure 2. The only
                                                                         hyper-parameter of a shuffling operator is the upscaling rate u.
Radiometric Features: We take into account the three spectral
                                                                         Generally, the process of constructing an SCNN can be split into
bands used for defining the orthophoto, whereby we assume that a
                                                                         four steps as described in the following:
representation with respect to the reflectance in the near-infrared
(NIR), red (R) and green (G) domains is given (Rottensteiner et             1 http://rapidlasso.com/lastools/

             This contribution has been peer-reviewed. The double-blind peer-review was conducted on the basis of the full paper.
                             https://doi.org/10.5194/isprs-annals-IV-1-29-2018 | © Authors 2018. CC BY 4.0 License.                       31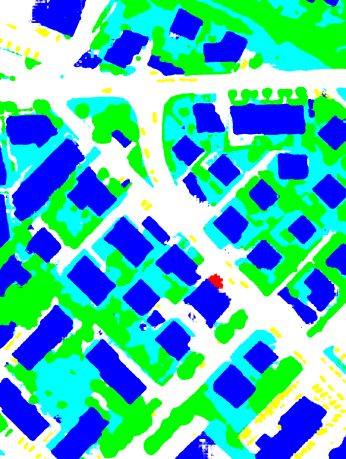
ISPRS Annals of the Photogrammetry, Remote Sensing and Spatial Information Sciences, Volume IV-1, 2018
ISPRS TC I Mid-term Symposium “Innovative Sensing – From Sensors to Methods and Applications”, 10–12 October 2018, Karlsruhe, Germany

         A1    A2    B1   B2
                                             A1   B1   A2   B2                                                                 Shuffling    Prediction
         A3    A4    B3   B4
                                             C1   D1   C2   D2

                                             A3   B3   A4   B4
          C1   C2    D1   D2
                                Shuffling
                                Operator     C3   D3   C4   D4
          C3   C4    D3   D4

Figure 2. Basic concept of the shuffling operator: it converts
c × u2 feature maps of size H × W into c feature maps of size
(H × u) × (W × u). Here: H = 2, W = 2, u = 2, c = 1.                                                 (a) Original SCNN

Backbone Network Extraction: Given a CNN for image clas-
sification such as the VGGNet (Simonyan and Zisserman, 2014)
or the ResNet (He et al., 2016a), we will get the corresponding
                                                                                                         Fusion_1
backbone network after removing the last pooling layer and its
subsequent layers. In this paper, we use the respective adaptation                                                  Fusion_2   Shuffling    Prediction
of the ResNet-101 as backbone network. This is motivated by
the fact that the use of standard networks such as the VGGNet
(Simonyan and Zisserman, 2014) with many layers allows learn-
ing complex non-linear relationships, yet the performance of such
networks tends to decrease when adding further layers via simply
stacking convolutional layers due to the vanishing gradient prob-                                   (b) Multi-scale SCNN
lem. To effectively address this issue, we use the ResNet (He
et al., 2016a) which is motivated by the idea that optimizing the
residual mapping is easier than optimizing the original mapping.                                                               Shuffling   Prediction_1

The additional gain in computational efficiency allows to form
                                                                                                         Fusion_1              Shuffling   Prediction_2
deep networks with more than 100 convolutional layers.
                                                                                                                    Fusion_2   Shuffling   Prediction_3
Resolution Adjustment: Pooling layers or convolutional lay-
ers with a stride larger than 1 will cause a reduction of resolution.
We refer to such layers as Resolution Reduction Layers (RRL).
Based on the backbone network, we keep the first three RRLs
and change the strides of the remaining RRLs to 1. Though net-
works without RRLs (Sherrah, 2016) have been proposed, such                              (c) Multi-scale SCNN with deep supervision
networks always suffer from a severe computational overload
(Sherrah, 2016; Chen et al., 2018a). Therefore, to have a trade-           Figure 3. The used networks: the prediction of the SCNN is based
off between computational efficiency and a reasonable resolution,          on the feature maps with an output stride of 8, while the MSCNN
keeping three or four RRLs is an acceptable choice (Chen et al.,           fuses outputs with strides of {16, 8, 4} and the DSCNN
2014; Chen et al., 2017b; Chen et al., 2018a).
                                                                           of {16, 8, 4} are fused as shown in Figure 3(b). Correspondingly,
Field-of-View Enhancement: RRLs have been shown to not                     the shuffling operator and the softmax operator are applied on the
only be beneficial to learning features robust to the translation,         finest fused feature maps. The details of the used fusion module
but also to increase the field-of-view of filters (Chen et al., 2016).     are presented in Figure 4. Thereby, the kernel of the convolution
To compensate for the decrease of the field-of-view after remov-           layers represented by Convolution 1, Convolution 2 and Convo-
ing some RRLs, atrous convolution (Chen et al., 2014; Chen et              lution 4 is (1, 1) and the kernel of Convolution 3 is (3, 3). We
al., 2016) is introduced. Once the stride of an RRL is set to 1, the       adopt deconvolution with a kernel of (4, 4), a stride of (2, 2) and
strides of its subsequent convolution layers are doubled.                  a padding of (1, 1) to realize upsampling. The number of filters
                                                                           for all these convolution/deconvolution layers is 512 and 256 for
Constructing SCNNs: On top of the modified backbone net-
                                                                           Fusion 1 and Fusion 2, respectively.
work, we append one convolution layer to generate a reasonable
number of feature maps for the shuffling operator. This is fol-
lowed by a shuffling operator and a softmax operator. An intu-             3.2.3 Multi-scale SCNN with Deep Supervision: Deep su-
itive description can be seen in Figure 3(a). For simplicity, the          pervision (Lee et al., 2014) is a technique used to achieve a bet-
shuffling operator in Figure 3(a) includes the convolution layer           ter training (Marmanis et al., 2016; Szegedy et al., 2015), espe-
for creating the correct number of feature maps.                           cially for very deep networks. Based on the MSCNN, we insert
                                                                           two additional losses in the form of cross-entropy losses into the
3.2.2 Multi-scale SCNN: By fusing feature maps of different                intermediate layers as shown in Figure 3(c) and thus construct
scales, we construct a Multi-scale Shuffling Convolutional Neu-            our Deeply-supervised Shuffling Convolutional Neural Network
ral Network (MSCNN). Deeper features with lower resolution                 (DSCNN). Compared with the original SCNN, though additional
are assumed to provide semantic information which are robust               fusion modules and additional prediction modules are introduced,
to variations in translation, rotation and scale. In contrast, fea-        the DSCNN is computationally more efficient than the original
tures with higher resolution are assumed to contain more spatial           SCNN as four RRLs are kept instead of three. Also, these addi-
information for better localization.                                       tional modules introduce some additional parameters for training.
                                                                           When e.g. using the adaptation of the ResNet-101 as backbone
Focusing on computational efficiency, we keep the first four               network, the number of trainable parameters of the RSCNN-101,
RRLs instead of only three RRLs. The feature maps with strides             MSCNN-101 and DSCNN-101 are shown in Table 1.

               This contribution has been peer-reviewed. The double-blind peer-review was conducted on the basis of the full paper.
                               https://doi.org/10.5194/isprs-annals-IV-1-29-2018 | © Authors 2018. CC BY 4.0 License.                              32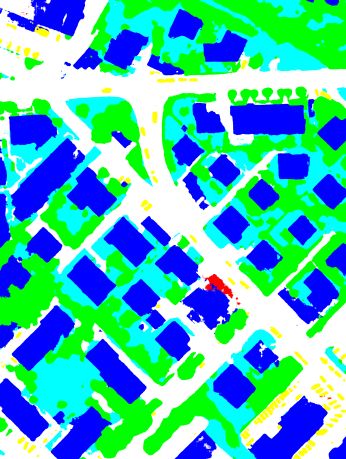
ISPRS Annals of the Photogrammetry, Remote Sensing and Spatial Information Sciences, Volume IV-1, 2018
ISPRS TC I Mid-term Symposium “Innovative Sensing – From Sensors to Methods and Applications”, 10–12 October 2018, Karlsruhe, Germany

                                                 Coarser features                           Flip+Rotate   MSA      OA     mIoU
                                                                                                                  83.89   57.76
                                                  Convolution_1                                 X                 84.29   58.60
                                                                                                X          X      84.65   58.48
                                                   Upsampling              Table 2. The contribution of data augmentation. In this experi-
                                                                           ment, only the reflectance values in the near-infrared (NIR), red
                                                  Convolution_2
                                                                           (R) and green (G) bands are used as features.
         Finer features    Convolution_4         Concatenation
                                                                           learning (Chen et al., 2016), whereby the learning rate is multi-
                                                                                             Niter
                                                  Convolution_3            plied by (1 − Nmax    iter
                                                                                                      )p with Niter and Nmax iter denoting the
                                                                           number of iterations and the maximum number of iterations (and
                                                     Output
                                                                           with p = 0.9 in our experiments). During training, we first use
Figure 4. The fusion module: we adopt a deconvolution layer                cropped patches of 224×224 pixels for 60k iterations with an ini-
with a kernel of (4, 4), a stride of (2, 2) and a padding of (1, 1)        tial learning rate of 0.007, and we then fine-tune the network us-
to realize upsampling.                                                     ing cropped patches of 448 × 448 pixels for further 15k iterations
                    Network       # Parameters   ttrain                    with an initial learning rate of 0.001. As evaluation metrics, we
                    RSCNN-101        43.2M       15.3 h                    consider the Overall Accuracy (OA) and the mean Intersection-
                    MSCNN-101        55.9M        7.0 h                    over-Union (mIoU). To reason about the performance for single
                    DSCNN-101        59.2M        7.8 h
                                                                           classes, we additionally consider the classwise F1 -scores.
Table 1. Number of parameters and time ttrain required for train-
ing when using the same hyper-parameters for all networks.                 Inference Strategy: When making inference for the tiles in
                                                                           the evaluation set, two different strategies may be applied. The
                  4. EXPERIMENTAL RESULTS                                  first strategy relies on resizing the tiles to suitable sizes in or-
                                                                           der to meet the size requirement of the networks. After making
In this section, we first provide a brief description of the dataset       the prediction, the results are resized to the original sizes of the
used in our experiments (Section 4.1). Subsequently, we explain            tiles. In this way, the shapes of objects are always distorted be-
implementation details as well as experimental configurations be-          fore the resized tiles are fed into networks. Therefore, we denote
fore presenting the derived results (Section 4.2).                         this strategy as “warp”. The second strategy is based on making
                                                                           predictions for the cropped patches from the tiles as the Field-
4.1   Dataset
                                                                           of-View Enhancement (FoVE) (Chen et al., 2018a; Chen et al.,
To evaluate the performance of our methods, we use the Vaihin-             2017a). This involves two hyper-parameters given by the size of
gen Dataset (Cramer, 2010; Rottensteiner et al., 2012). This               the cropped patches and the step size.
dataset was acquired over a small village with many detached
buildings and small multi-story buildings. It contains 33 tiles of         Data Augmentation: To address the problem of overfitting, we
different sizes and the spatial resolution is specified with 9 cm.         apply data augmentation by randomly scaling the input images
For each tile, a very high-resolution true orthophoto (with three          from 0.5 to 2.0 (known as Multi-Scale Augmentation, MSA),
channels corresponding to the near-infrared, red and green do-             horizontally flipping and rotating by 90◦ , 180◦ or 270◦ , respec-
mains) and the corresponding DSM derived via dense image                   tively. Based on the RSCNN-101, we investigate the importance
matching techniques are provided. In addition, a reference la-             of data augmentation for which numerical results are provided in
beling with respect to six semantic classes represented by Imper-          Table 2. In this experiment, we only make use of features based
vious Surfaces, Building, Low Vegetation, Tree, Car and Clut-              on the reflectance values in the near-infrared (NIR), red (R) and
ter/Background is given for 16 of the 33 tiles on a per-pixel              green (G) bands. To get the prediction for each tile, we crop
basis. For extensive tests, we split the set of 16 labeled tiles           patches of 992 × 992 pixels with a step size of 812 pixels from
into two subsets (Volpi and Tuia, 2017). One subset comprises              the tile and make a patch-wise prediction following (Chen et al.,
the tiles with IDs ∈ {1, 3, 5, 7, 13, 17, 21, 23, 26, 32, 37} and is       2018a). As can be seen in the table, the overall accuracy increases
used for training. The other subset comprises the tiles with IDs           from 83.89% to 84.65% when involving data augmentation.
∈ {11, 15, 28, 30, 34} and is used for evaluation. Please note that
the definition of training and test data thus differs from the one         Multi-scale Feature Fusion and Deep Supervison: To ex-
used for the ISPRS Benchmark on 2D Semantic Labeling.                      plore the contribution of multi-scale fusion and deep supervision,
                                                                           we train the RSCNN-101, the MSCNN-101 and the DSCNN-101,
4.2   Experiments and Results                                              respectively, and evaluate their performance on the validation set.
                                                                           The numerical results are provided in Table 3 and corresponding
Our implementations are based on the MXNet deep learning                   visualizations for Patch 30 are provided in Figure 5. Here, we
framework (Chen et al., 2015) and tested on a high-performance             only make use of features based on the reflectance values in the
computer (Dual Intel Xeon E5-2609, 2.4 GHz, 256 GB RAM)                    near-infrared (NIR), red (R) and green (G) bands. When mak-
equipped with a NVIDIA TITAN X GPU with 12 GB memory.                      ing predictions, we feed a whole tile into the respective network
The network parameters are initialized with the method intro-              after being resized to a suitable size. As can be seen in this ta-
duced in (He et al., 2015). As loss function, we adopt the cross-          ble, the OA increases from 84.37% to 85.71% and the mIoU in-
entropy loss which is summed over all the pixels in a batch of             creases from 58.31% to 60.64% after fusing multi-scale features
8 patches. To optimize this objective function, we use the stan-           and adopting deep supervision.
dard Stochastic Gradient Descent (SGD) with a momentum of
0.9. Each patch fed into the network is cropped randomly and               Multi-modal Data: To explore the influence of additionally us-
temporarily as proposed in (Chen et al., 2017a) and then normal-           ing hand-crafted features to define the input to the deep network,
ized by the subtraction of the mean value and a subsequent divi-           we focus on a separate and combined consideration of radiomet-
sion by the standard deviation of the patch. We employ “poly”              ric and geometric information (cf. Section 3.1) as input to the

               This contribution has been peer-reviewed. The double-blind peer-review was conducted on the basis of the full paper.
                               https://doi.org/10.5194/isprs-annals-IV-1-29-2018 | © Authors 2018. CC BY 4.0 License.                       33
ISPRS Annals of the Photogrammetry, Remote Sensing and Spatial Information Sciences, Volume IV-1, 2018
ISPRS TC I Mid-term Symposium “Innovative Sensing – From Sensors to Methods and Applications”, 10–12 October 2018, Karlsruhe, Germany
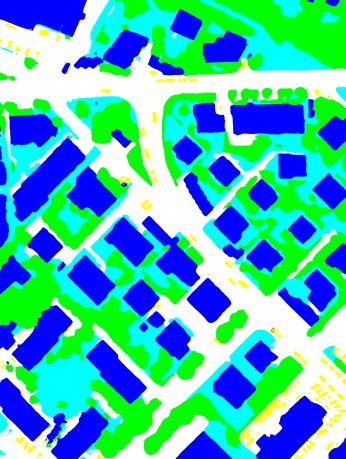
DSCNN-101. The achieved classification results when relying Multi-modal Data: Height features such as the DSM and the
on the Prediction 3 are provided in Table 4. In this table, we list nDSM can provide complementary information to the spectral
the results derived for the use of both inference strategies given features (near-infrared, red and green). As can be seen in the
by FoVE and “warp”, respectively. For Patch 30 of the dataset, first block of Table 4, the combinations of spectral features and
a visualization of the ground truth and the semantic labelings de- height features yield the best results. The highest OA (86.31%) is
rived with the DSCNN-101(3) based on different sets of involved reached with the combination of NIR, R, G and nDSM. The high-
features is given in Figure 6. est mIoU (61.33%) is reached with the combination of NIR, R, G,
DSM and nDSM. Similarly, as can be seen in Figure 6, the height
5. DISCUSSION information provides vital information for identifying some spe-
cific objects, e.g., the building at the top left corner. Interestingly,
Inference Strategy: Table 4 reveals that the inference strategy there is no numerical improvement when using additional hand-
of “warp” is not as stable as FoVE. Especially when the input crafted features (cf. Section 3.1) in comparison to the standard
contains the DSM, the performance of “warp” is much worse than RSCNN where an improvement can be observed (Chen et al.,
that of FoVE (more than 1% drop with respect to OA). In other 2018b). One reason might be that these features can be learned
cases, there is no big difference between these two strategies. by this deep network. However, in Figure 6, it can be observed
for some objects that the additional use of hand-crafted features
Data Augmentation: Data augmentation is an efficient way to contributes to the classification, while they also introduce some
address the problem of overfitting. As can be seen in Table 2, noise which may result in incorrect classification. Therefore, we
when training with horizontal flip and rotation, the OA increases believe that the consideration of hand-crafted radiometric and ge-
by 0.40% and the mIoU increases by 0.84%. Adding MSA, ometric features is still significant.
the OA is further increased by 0.36% while the mIoU shows a
slight drop by 0.12%. This drop is due to the unbalanced con-
vergences between classes as the F1 -score of the class Car drops 6. CONCLUSIONS
from 74.39% to 71.37% when adding MSA.
In this paper, we have proposed the Deeply-supervised Shuf-
Multi-scale Feature Fusion and Deep Supervison: Both the fling Convolutional Neural Network (DSCNN) for semantic im-
fusion of multi-scale features and deep supervision contribute to age segmentation. The DSCNN extends the standard SCNN by
the improvement in performance. As can be seen in Table 3, fus- fusing multi-scale features and introducing deep supervision. The
ing multi-scale features results in an improvement of 0.65% in results derived for a benchmark dataset reveal that our proposed
OA and 1.21% in mIoU, respectively. Additionally considering network outperforms the baseline network, where both the multi-
deep supervision leads to a further improvement of 0.69% in OA scale fusion and the additional losses contribute to the improve-
and 1.12% in mIoU when considering the prediction based on ment. By fusing multi-scale features, the proposed network effec-
DSCNN-101(3). Therefore, compared with the original RSCNN- tively addresses the gridding effect and produces much smoother
101, our proposed network yields an improvement of 1.37% in results than the original network. Via feeding different combina-
OA and 2.23% in mIoU. This improvement comes from two as- tions of the multi-modal data and derived hand-crafted features,
pects. On the one hand, an improvement arises from the fusion we have investigated the value of the data of both modalities and
of multi-scale features, where high-level features provide more the derived features. The derived results reveal that using all ra-
semantic information and low-level features provide more spa- diometric and geometric features does not achieve the best result.
tial information. Through the fusion modules, the network can However, via analyzing the visualization of the results, we find
take advantage of both high-level features and low-level features. that the results derived from using all features are smoother and
On the other hand, an improvement arises from the deep supervi- the predictions of some objects are improved. However, it also
sion which provides a better optimization of the network. Though introduces some misclassifications. Hence, we conclude that the
there exist skip connections in the residual modules, the vanish- effective use of hand-crafted features remains a challenge to be
ing gradient problem cannot be eliminated thoroughly. With deep addressed in future work.
supervision, it can be alleviated to some extent and put more se-
mantic constraints on the intermediate layers. Furthermore, the
ACKNOWLEDGEMENTS
derived results reveal that predictions based on finer features out-
perform predictions based on coarser features. As can be seen
This work is supported by the foundation of China Scholarship
in Table 3, DSCNN-101(3) outperforms DSCNN-101(2) which
Council under Grant 201704910608. The Vaihingen Dataset
in turn outperforms DSCNN-101(1) in OA. The same conclusion
was provided by the German Society for Photogrammetry, Re-
can be obtained through observing the second row of Figure 5.
mote Sensing and Geoinformation (DGPF) (Cramer, 2010):
Meanwhile, taking the average of the score maps of Prediction 1,
http://www.ifp.uni-stuttgart.de/dgpf/DKEP-Allg.html.
Prediction 2 and Prediction 3 in the DSCNN-101 does not con-
tribute to an improvement in performance. As can be seen in
Table 3, the OA achieved with the DSCNN-101(E) is only 0.01% REFERENCES
higher than the OA achieved with the DSCNN-101(3) while the
mIoU drops by 0.08%. Therefore, in the experiments of explor- Audebert, N., Le Saux, B. and Lefèvre, S., 2016. Semantic segmen-
tation of Earth observation data using multimodal and multi-scale deep
ing the contribution of multi-modal data for classification, we networks. In: Proc. 13th Asian Conference on Computer Vision (ACCV),
adopt the results of DSCNN-101(3). Visualizations of the pre- Taipei, Taiwan, Vol. I, pp. 180–196.
dictions of different networks are shown in Figure 5. The figures Audebert, N., Le Saux, B. and Lefèvre, S., 2018. Beyond RGB: very high
reveal the gridding effect (i.e. the result is not very smooth and resolution urban remote sensing with multimodal deep networks. ISPRS
Journal of Photogrammetry and Remote Sensing 140, pp. 20–32.
contains many scatters in grids) in the prediction of RSCNN-101.
The gridding effect is alleviated to a large extent with the fusion Badrinarayanan, V., Kendall, A. and Cipolla, R., 2017. SegNet: a
deep convolutional encoder-decoder architecture for image segmentation.
of multi-scale features. Adding deeper supervision, the result be- IEEE Transactions on Pattern Analysis and Machine Intelligence 39(12),
comes much smoother. pp. 2481–2495.
This contribution has been peer-reviewed. The double-blind peer-review was conducted on the basis of the full paper.
https://doi.org/10.5194/isprs-annals-IV-1-29-2018 | © Authors 2018. CC BY 4.0 License. 34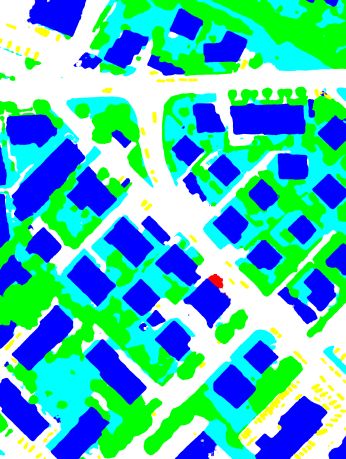
ISPRS Annals of the Photogrammetry, Remote Sensing and Spatial Information Sciences, Volume IV-1, 2018
ISPRS TC I Mid-term Symposium “Innovative Sensing – From Sensors to Methods and Applications”, 10–12 October 2018, Karlsruhe, Germany
Networks F1 (IS) F1 (B) F1 (LV) F1 (T) F1 (C) OA mIoU
RSCNN-101 87.05 91.93 74.92 83.51 71.90 84.37 58.31
MSCNN-101 87.45 92.55 74.96 84.51 75.13 85.02 59.52
DSCNN-101(1) 87.76 93.07 75.97 84.64 72.60 85.38 59.47
DSCNN-101(2) 88.14 93.46 76.21 84.67 75.72 85.66 60.68
DSCNN-101(3) 88.20 93.55 76.26 84.66 76.57 85.71 60.64
DSCNN-101(E) 88.18 93.45 76.31 84.75 76.23 85.72 60.56
Table 3. The contribution of multi-scale fusion and deep supervision when solely using the reflectance information in the near-infrared
(NIR), red (R) and green (G) domains. The expressions DSCNN-101(1), DSCNN-101(2) and DSCNN-101(3) denote the results of Pre-
diction 1, Prediction 2 and Prediction 3 in Figure 3(c), respectively. The expression DSCNN-101(E) means that the final predictions
are based on taking the average of the score maps of Prediction 1, Prediction 2 and Prediction 3 in Figure 3(c).
Input FoVE Warp F1 (IS) F1 (B) F1 (LV) F1 (T) F1 (C) OA mIoU
NIR-R-G X 87.77 93.42 75.96 84.99 74.40 85.61 60.04
NIR-R-G-DSM X 88.07 94.14 76.75 85.01 77.57 86.00 61.20
NIR-R-G-nDSM X 88.59 94.00 77.21 85.23 75.82 86.31 61.06
NIR-R-G-DSM-nDSM X 88.36 93.81 77.97 85.09 77.93 86.11 61.33
NIR-R-G-nDSM-L-P-S X 88.34 93.92 76.53 85.36 77.16 86.15 61.15
NIR-R-G-NDVI-nDSM-L-P-S X 88.77 94.04 76.68 84.93 74.48 86.20 61.08
Radiometry & Geometry X 88.66 93.78 76.18 84.61 75.28 85.89 60.52
NIR-R-G X 88.20 93.55 76.26 84.66 76.57 85.71 60.64
NIR-R-G-DSM X 87.48 93.41 75.32 83.69 76.79 84.93 60.01
NIR-R-G-nDSM X 88.50 93.84 77.22 85.09 76.12 86.23 61.03
NIR-R-G-DSM-nDSM X 87.61 93.21 74.83 84.04 75.22 84.95 59.63
NIR-R-G-nDSM-LPS X 88.42 94.11 76.88 85.22 76.99 86.23 61.23
NIR-R-G-NDVI-nDSM-L-P-S X 88.76 93.85 76.94 84.91 76.94 86.18 61.18
Radiometry & Geometry X 88.93 93.81 76.69 84.80 75.09 86.13 60.72
Table 4. The influence of different combinations of features and of different inference strategies on the result of the DSCNN-101(3).
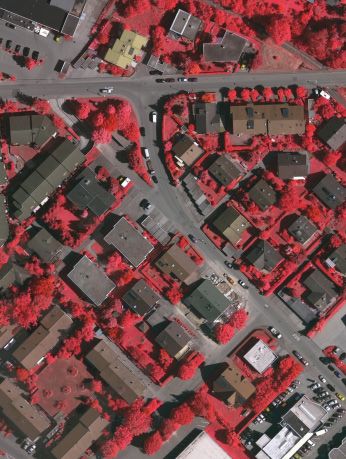
(a) True orthophoto (b) Ground truth (c) RSCNN-101 (d) MSCNN-101
(e) DSCNN-101(1) (f) DSCNN-101(2) (g) DSCNN-101(3) (h) DSCNN-101(E)
Figure 5. Visualization of the true orthophoto of Tile 30, the corresponding ground truth and the results for semantic segmentation
when using the different deep networks defined in Section 3.2 and the “warp” inference strategy (Impervious Surfaces: white; Building:
blue; Low Vegetation: cyan; Tree: green; Car: yellow; Clutter/Background: red).
(a) Ground truth (b) NIR-R-G (c) NIR-R-G-nDSM (d) All defined features
Figure 6. Visualization of the ground truth of Tile 30 and the classification results achieved with the DSCNN-101(3) when using
different subsets of the features defined in Section 3.1 and the “warp” inference strategy, and the same color encoding as in Figure 5.
This contribution has been peer-reviewed. The double-blind peer-review was conducted on the basis of the full paper.
https://doi.org/10.5194/isprs-annals-IV-1-29-2018 | © Authors 2018. CC BY 4.0 License. 35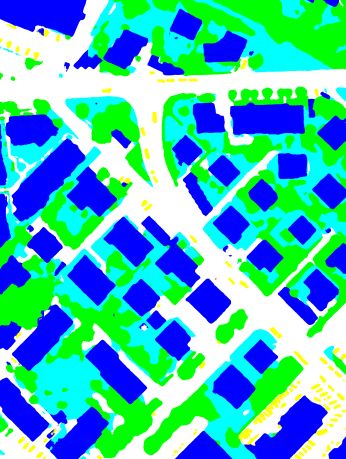
ISPRS Annals of the Photogrammetry, Remote Sensing and Spatial Information Sciences, Volume IV-1, 2018
ISPRS TC I Mid-term Symposium “Innovative Sensing – From Sensors to Methods and Applications”, 10–12 October 2018, Karlsruhe, Germany

Chen, K., Fu, K., Gao, X., Yan, M., Sun, X. and Zhang, H., 2017a. Build-      Liu, Y., Piramanayagam, S., Monteiro, S. T. and Saber, E., 2017. Dense
ing extraction from remote sensing images with deep learning in a super-      semantic labeling of very-high-resolution aerial imagery and lidar with
vised manner. In: Proc. 2017 IEEE International Geoscience and Remote         fully-convolutional neural networks and higher-order CRFs. In: Proc.
Sensing Symposium (IGARSS), Fort Worth, TX, USA, pp. 1672–1675.               2017 IEEE Conference on Computer Vision and Pattern Recognition
Chen, K., Fu, K., Yan, M., Gao, X., Sun, X. and Wei, X., 2018a. Se-           Workshops (CVPRW), Honolulu, HI, USA, pp. 1561–1570.
mantic segmentation of aerial images with shuffling convolutional neural      Long, J., Shelhamer, E. and Darrell, T., 2015. Fully convolutional net-
networks. IEEE Geoscience and Remote Sensing Letters 15(2), pp. 173–          works for semantic segmentation. In: Proc. 2015 IEEE Conference on
177.                                                                          Computer Vision and Pattern Recognition (CVPR), Boston, MA, USA,
                                                                              pp. 3431–3440.
Chen, K., Weinmann, M., Gao, X., Yan, M., Hinz, S., Jutzi, B. and Wein-
mann, M., 2018b. Residual shuffling convolutional neural networks for         Maggiori, E., Tarabalka, Y., Charpiat, G. and Alliez, P., 2017. High-
deep semantic image segmentation using multi-modal data. In: ISPRS            resolution image classification with convolutional networks. In: Proc.
Annals of the Photogrammetry, Remote Sensing and Spatial Information          2017 IEEE International Geoscience and Remote Sensing Symposium
Sciences, Riva del Garda, Italy, Vol. IV-2, pp. 65–72.                        (IGARSS), Fort Worth, TX, USA, pp. 5157–5160.
Chen, L.-C., Papandreou, G., Kokkinos, I., Murphy, K. and Yuille, A. L.,      Marmanis, D., Schindler, K., Wegner, J. D., Galliani, S., Datcu, M. and
2014. Semantic image segmentation with deep convolutional nets and            Stilla, U., 2018. Classification with an edge: improving semantic image
fully connected CRFs. arXiv preprint arXiv:1412.7062.                         segmentation with boundary detection. ISPRS Journal of Photogramme-
                                                                              try and Remote Sensing 135, pp. 158–172.
Chen, L.-C., Papandreou, G., Kokkinos, I., Murphy, K. and Yuille, A. L.,
2016. DeepLab: semantic image segmentation with deep convolutional            Marmanis, D., Wegner, J. D., Galliani, S., Schindler, K., Datcu, M. and
nets, atrous convolution, and fully connected CRFs. arXiv preprint            Stilla, U., 2016. Semantic segmentation of aerial images with an ensem-
arXiv:1606.00915.                                                             ble of CNNs. In: ISPRS Annals of the Photogrammetry, Remote Sensing
                                                                              and Spatial Information Sciences, Prague, Czech Republic, Vol. III-3,
Chen, L.-C., Papandreou, G., Schroff, F. and Adam, H., 2017b. Rethink-        pp. 473–480.
ing atrous convolution for semantic image segmentation. arXiv preprint
arXiv:1706.05587.                                                             Noh, H., Hong, S. and Han, B., 2015. Learning deconvolution network for
                                                                              semantic segmentation. In: Proc. 2015 IEEE International Conference on
Chen, T., Li, M., Li, Y., Lin, M., Wang, N., Wang, M., Xiao, T., Xu, B.,      Computer Vision (ICCV), Santiago, Chile, pp. 1520–1528.
Zhang, C. and Zhang, Z., 2015. MXNet: a flexible and efficient machine
learning library for heterogeneous distributed systems. arXiv preprint        Paisitkriangkrai, S., Sherrah, J., Janney, P. and van den Hengel, A., 2016.
arXiv:1512.01274.                                                             Semantic labeling of aerial and satellite imagery. IEEE Journal of Se-
                                                                              lected Topics in Applied Earth Observations and Remote Sensing 9(7),
Cramer, M., 2010. The DGPF-test on digital airborne camera evaluation         pp. 2868–2881.
– Overview and test design. PFG Photogrammetrie – Fernerkundung –
Geoinformation 2/2010, pp. 73–82.                                             Pauly, M., Keiser, R. and Gross, M., 2003. Multi-scale feature extraction
                                                                              on point-sampled surfaces. Computer Graphics Forum 22(3), pp. 81–89.
Demantké, J., Mallet, C., David, N. and Vallet, B., 2011. Dimensional-
ity based scale selection in 3D lidar point clouds. In: The International     Ronneberger, O., Fischer, P. and Brox, T., 2015. U-Net: convolu-
Archives of the Photogrammetry, Remote Sensing and Spatial Informa-           tional networks for biomedical image segmentation. arXiv preprint
tion Sciences, Calgary, Canada, Vol. XXXVIII-5/W12, pp. 97–102.               arXiv:1505.04597.
                                                                              Rottensteiner, F., Sohn, G., Jung, J., Gerke, M., Baillard, C., Benitez, S.
Gerke, M., 2014. Use of the stair vision library within the ISPRS 2D
                                                                              and Breitkopf, U., 2012. The ISPRS benchmark on urban object classi-
semantic labeling benchmark (Vaihingen). Technical report, ITC, Uni-
                                                                              fication and 3D building reconstruction. In: ISPRS Annals of the Pho-
versity of Twente.
                                                                              togrammetry, Remote Sensing and Spatial Information Sciences, Mel-
Gerke, M. and Xiao, J., 2014. Fusion of airborne laserscanning point          bourne, Australia, Vol. I-3, pp. 293–298.
clouds and images for supervised and unsupervised scene classification.       Rouse, Jr., J. W., Haas, R. H., Schell, J. A. and Deering, D. W., 1973.
ISPRS Journal of Photogrammetry and Remote Sensing 87, pp. 78–92.             Monitoring vegetation systems in the Great Plains with ERTS. In: Proc.
Gevers, T. and Smeulders, A. W. M., 1999. Color based object recogni-         3rd Earth Resources Technology Satellite-1 Symposium (ERTS), Wash-
tion. Pattern Recognition 32(3), pp. 453–464.                                 ington, D.C., USA, Vol. I, pp. 309–317.
Gitelson, A. A. and Merzlyak, M. N., 1998. Remote sensing of chloro-          Russakovsky, O., Deng, J., Su, H., Krause, J., Satheesh, S., Ma, S.,
phyll concentration in higher plant leaves. Advances in Space Research        Huang, Z., Karpathy, A., Khosla, A., Bernstein, M., Berg, A. C. and
22(5), pp. 689–692.                                                           Fei-Fei, L., 2015. ImageNet large scale visual recognition challenge. In-
                                                                              ternational Journal of Computer Vision 115(3), pp. 211–252.
Hackel, T., Wegner, J. D. and Schindler, K., 2016. Fast semantic seg-
mentation of 3D point clouds with strongly varying density. In: ISPRS         Sherrah, J., 2016.        Fully convolutional networks for dense se-
Annals of the Photogrammetry, Remote Sensing and Spatial Information          mantic labelling of high-resolution aerial imagery. arXiv preprint
Sciences, Prague, Czech Republic, Vol. III-3, pp. 177–184.                    arXiv:1606.02585.
He, K., Zhang, X., Ren, S. and Sun, J., 2015. Delving deep into rectifiers:   Shi, W., Caballero, J., Huszár, F., Totz, J., Aitken, A. P., Bishop, R.,
surpassing human-level performance on ImageNet classification. In:            Rueckert, D. and Wang, Z., 2016. Real-time single image and video
Proc. 2015 IEEE International Conference on Computer Vision (ICCV),           super-resolution using an efficient sub-pixel convolutional neural net-
Santiago, Chile, pp. 1026–1034.                                               work. In: Proc. 2016 IEEE Conference on Computer Vision and Pattern
                                                                              Recognition (CVPR), Las Vegas, NV, USA, pp. 1874–1883.
He, K., Zhang, X., Ren, S. and Sun, J., 2016a. Deep residual learning for
image recognition. In: Proc. 2016 IEEE Conference on Computer Vision          Simonyan, K. and Zisserman, A., 2014. Very deep convolutional net-
and Pattern Recognition (CVPR), Las Vegas, NV, USA, pp. 770–778.              works for large-scale image recognition. arXiv preprint arXiv:1409.1556.
He, K., Zhang, X., Ren, S. and Sun, J., 2016b. Identity mappings in deep      Szegedy, C., Liu, W., Jia, Y., Sermanet, P., Reed, S., Anguelov, D., Er-
residual networks. In: Proc. European Conference on Computer Vision           han, D., Vanhoucke, V. and Rabinovich, A., 2015. Going deeper with
(ECCV), Amsterdam, The Netherlands, pp. 630–645.                              convolutions. In: Proc. IEEE Conference on Computer Vision and Pat-
                                                                              tern Recognition (CVPR), Boston, MA, USA, pp. 1–9.
Ioffe, S. and Szegedy, C., 2015. Batch normalization: accelerating deep
network training by reducing internal covariate shift. In: Proc. 32nd         Volpi, M. and Tuia, D., 2017. Dense semantic labeling of subdecimeter
International Conference on Machine Learning (ICML), Lille, France,           resolution images with convolutional neural networks. IEEE Transactions
pp. 448–456.                                                                  on Geoscience and Remote Sensing 55(2), pp. 881–893.
Krizhevsky, A., Sutskever, I. and Hinton, G. E., 2012. ImageNet classi-       Weinmann, M., 2016. Reconstruction and analysis of 3D scenes – From
fication with deep convolutional neural networks. In: Proc. 25th Inter-       irregularly distributed 3D points to object classes. Springer, Cham,
national Conference on Neural Information Processing Systems (NIPS),          Switzerland.
Lake Tahoe, NV, USA, Vol. I, pp. 1097–1105.                                   Weinmann, M. and Weinmann, M., 2018. Geospatial computer vision
                                                                              based on multi-modal data – How valuable is shape information for the
Lee, C.-Y., Xie, S., Gallagher, P., Zhang, Z. and Tu, Z., 2014. Deeply-
                                                                              extraction of semantic information? Remote Sensing 10(1), pp. 2:1–2:20.
supervised nets. arXiv preprint arXiv:1409.5185.
                                                                              West, K. F., Webb, B. N., Lersch, J. R., Pothier, S., Triscari, J. M. and
Lin, T.-Y., Dollár, P., Girshick, R., He, K., Hariharan, B. and Belongie,    Iverson, A. E., 2004. Context-driven automated target detection in 3-D
S., 2016. Feature pyramid networks for object detection. arXiv preprint       data. Proceedings of SPIE 5426, pp. 133–143.
arXiv:1612.03144.
                                                                              Zhao, H., Shi, J., Qi, X., Wang, X. and Jia, J., 2016. Pyramid scene
Liu, W., Rabinovich, A. and Berg, A. C., 2015. ParseNet: looking wider        parsing network. arXiv preprint arXiv:1612.01105.
to see better. arXiv preprint arXiv:1506.04579.

              This contribution has been peer-reviewed. The double-blind peer-review was conducted on the basis of the full paper.
                              https://doi.org/10.5194/isprs-annals-IV-1-29-2018 | © Authors 2018. CC BY 4.0 License.                                  36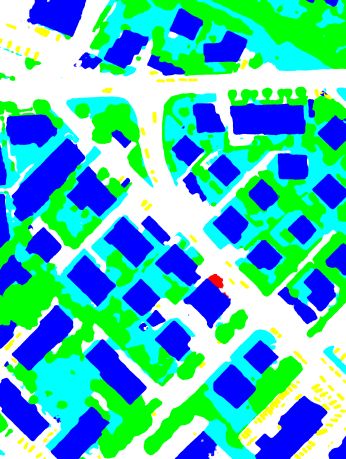
You can also read