Retail Sourcing Report - Facts & Insights - Q4 2020 - Newswire
←
→
Page content transcription
If your browser does not render page correctly, please read the page content below
Q4
                     2020

Retail Sourcing Report
Facts & Insights

Sponsored By
1

    FORWARD

    RETAIL SOURCING REPORT

    CBX Software’s Retail Sourcing Report provides
    research and analysis aimed at informing global
    sourcing and buying decisions for retailers, brands
    and other sourcing and supply chain professionals.
    Each issue includes a snapshot of key information and
    trends impacting global sourcing, such as economic
    conditions in sourcing countries, container shipping
    trends, currency exchange and commodity rates. We
    also cover hot topics ourselves and include insight
    from analysts and other experts.

    If you like this content, please share:                           The Number 1 Collaborative Sourcing
    LinkedIn                                                             App for Retailers and Suppliers!

    Americas +1.858.264.1133                                                 www.tradebeyond.com
    Asia +852.2378.6300
    EMEA +49.89.9040.5110
    www.cbxsoftware.com

    Statement of Indemnity: CBX Software recommends that any information provided in this report be
    weighed against other sources and experts on the individual topics covered. As such, CBX Software
    bears no legal or fiscal responsibility for any potential harm or outcome which may result directly or
    indirectly from information provided in this report.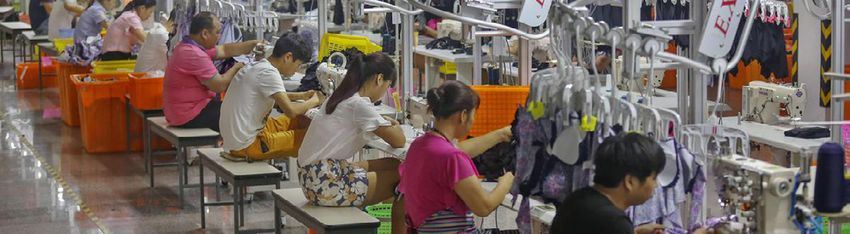
2

CONTENT

RETAIL SOURCING REPORT                               0
FORWARD                                              1
MANUFACTURING OUTLOOK (PMI)                          3
LOW COST COUNTRY SOURCING (LCCS) HIGHLIGHTS          4
     SOUTH EAST ASIA                                 4
     SOUTH AND WEST ASIA                             5
CHINA MINIMUM WAGE TRENDS                            6
LOW-COST COUNTRY SOURCING WAGE TRENDS                7
CONTAINER FREIGHT RATES & TRENDS                     8
TRADE CURRENCY RATES & TRENDS                        9
GLOBAL COMMODITY RATES & TRENDS                      10
     CRUDE OIL                                       10
     RUBBER                                          10
     METALS                                          10
     COTTON                                          11
     PLASTICS AND SYNTHETIC FIBERS                   11
QUALITY CONTROL INDICATORS                           12
FOCUS TOPICS                                         13
     COVID-19, E-COMMERCE ACCELERATOR                13
     THE OUTLOOK FOR GLOBAL TRADE IN Q4 AND BEYOND   14
ABOUT CBX SOFTWARE & TRADEBEYOND                     15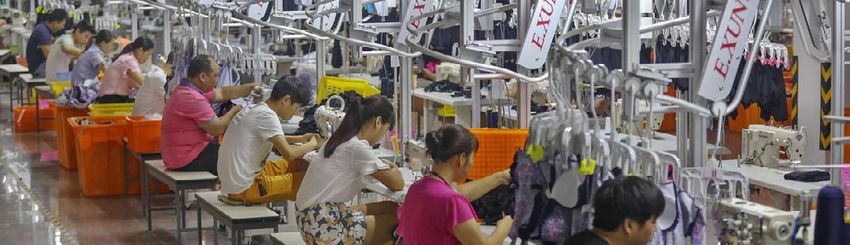
3        Purchasing Manager’s Index (PMI)

         To help understand industry and economic conditions in a country, the PMI Index tracks variables such as
         output, new orders, stock levels, employment and prices across private companies in the manufacturing,
         construction, retail and service sectors. Over 30 countries and regions participate in various PMI surveys.
                                                                                                                 4

         Manufacturing             Outlook (PMI)
         A reading below 50 indicates contraction from the previous month, while a reading above 50 indicates growth.
         This update looks at a selection of emerging economies and key sourcing countries, providing indicators for
         recent months based on data provided by IHS Markit, NIKKEI, CAIXIN and other sources.
       To help understand industry and economic conditions in a country, the Purchasing Manager’s Index (PMI)
       tracks variables such as output, new orders, stock levels, employment, and prices across private companies
       in the manufacturing, construction, retail, and service sectors. A reading below 50 indicates contraction
       from the previous month, while a reading above 50 indicates growth. While over 40 countries and economic
Q4   2020  News
       regions     and Analysis:
               participate in various PMI surveys, this update looks at a short-list of emerging economies and key
       sourcing countries to provide indicative trends. (Data Source: IHS Markit)
As businesses reopened and consumer demand picked-up following lockdowns and closures due to the
pandemic,
        Q4 global  manufacturing
            2020 Summary:           rebounded
                             As businesses       throughand
                                             reopened    Q3consumer
                                                             and into Q4  as output,
                                                                        demand        exports
                                                                                 picked-up      and new
                                                                                            following    orders expanded
                                                                                                      lockdowns    and
to one of the highest levels since 2018. The upcoming Christmas season also pushed trade flow and stretched
        closures due to the pandemic, global manufacturing rebounded through Q3 and into Q4 as output, exports
global supply chains still recovering from the impact of Covid-19. While input costs have reached record levels,
        and new orders expanded to one of the highest levels since 2018. The upcoming Christmas season also
businesses felt more confident about the coming year. Overall the global trend was recovery and growth, with
        pushed trade
some exceptions       flowasand
                    such        stretched
                             Mexico,       global supply
                                       Indonesia,        chains
                                                   Malaysia  andstill recovering
                                                                  Myanmar,       from economies
                                                                              whose    the impact of  Covid-19.to
                                                                                                   continued    While
                                                                                                                   contract
under the impact of the pandemic. The economic picture for 2021 is still unclear, given the potentialthe
        input costs have  reached  record levels, businesses felt more  confident about  the coming  year. Overall  of new
        global
outbreaks      trend
           across    was recovery
                   Europe   and NorthandAmerica.
                                         growth, with some exceptions such as Mexico, Indonesia, Malaysia and
         Myanmar, whose economies continued to contract under the impact of the pandemic. The economic picture
         for 2021 is still unclear, given the potential of new outbreaks across Europe and North America.

                       Jul    Aug     Sep
           Country                            Summary of Indicators
                      2020    2020    2020
                                              Brazilian manufacturing continued to recover at pace, supported by a weaker local
          Brazil      58.2    64.7    64.9
                                              currency; new orders, production and exports saw record growth, despite higher costs.
                                              Chinese manufacturers maintained their robust growth momentum through Q3, with
          China       52.8    53.1    53.0
                                              new business growing at the fastest rate since 2011.
                                              Columbia’s manufacturing economy continued to improve in Q3, despite easing off in
          Columbia    54.2    51.2    50.4
                                              September as quarantines eased, resulting in output growth and optimism for 2021.
          Czech                               Manufacturing in Czechoslovakia continued to improve through Q3 as domestic and
                      47.0    49.1    50.7
          Republic                            export orders and production increased, while competition pushed input costs lower.
                                              India’s economy rebounded strongly through Q3, as factories ramped up production
          India       46.0    52.0    56.8
                                              and increased headcount to fill new orders, following 6 months of contraction.
                                              Indonesia’s manufacturing had a setback in September following new outbreaks of
          Indonesia   46.9    50.8    47.2
                                              Covid-19, with new lockdowns limiting production, employment and purchasing.
                                              Malaysia saw some pullback in manufacturing activity in late Q3 following an initial
          Malaysia    50.0    49.3    49.0
                                              rebound from the pandemic effect, with businesses confident for a stronger 2021.
                                              Mexico’s manufacturing continued to feel the impact of Covid-19 through Q3 and into
          Mexico      40.4    41.3    42.1
                                              Q4 as many businesses remained closed, yet businesses confidence remains high.
                                              Manufacturing came to a standstill in September after new lockdowns measures were
          Myanmar     51.7    53.2    35.9
                                              enforced, reducing output and headcount, making for an uncertain end to the year.
                                              Despite easing off in Aug/Sept, Polish manufacturing improved marginally though Q3
          Poland      52.8    50.6    50.8
                                              reflecting growth in employment, despite weakness in output and new orders.
                                              In line with other economies that saw a rebound in Q3, then a drop-off in September,
          Russia      48.4    51.1    48.9
                                              Russia’s production sector lost momentum into Q4 with uncertainty for the new year.
          South                               Easing of South Africa’s lockdowns in Q3 resulted in growth in output, new orders,
                      44.9    45.3    49.4
          Africa                              employment and purchasing, as companies attempted to recoup pandemic losses.
          South                               Manufacturing in South Korea stabilized through Q3 as businesses reopened and
                      46.9    48.5    49.8
          Korea                               output grew; ongoing recovery will depend on both domestic and foreign demand.
                                              Turkey’s manufacturing sector saw a sustained recovery through Q3, with further
          Turkey      56.9    54.3    52.8
                                              gains in output and new orders, along with job creation and optimism for 2021.
                                              Vietnam’s manufacturing economy picked up in September from the effects of
          Vietnam     47.6    45.7    52.2
                                              lockdowns in Q3, with output growth and stronger business confidence for 2021.

     © 1995-2020 Copyright by CBX Software. All rights reserved.
                                                                               Q4 2020 Retail Sourcing Report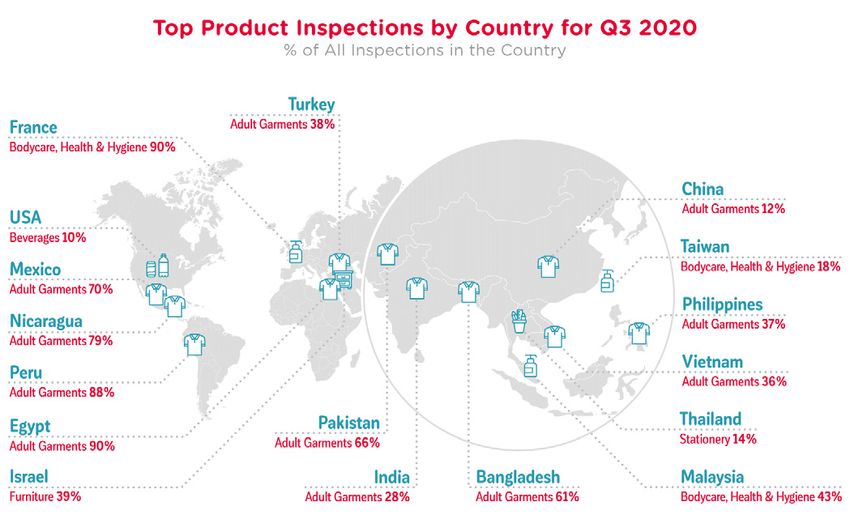
Low Cost Country Sourcing (LCCS) Highlights                                                                       4

This section looks at selected issues impacting sourcing from key LCCS destinations based on data available at the
time of printing the report, alongside official import/export numbers highlighting global sourcing trends.

Summary: Asian economies continue to be heavily impacted by pandemic lockdowns, given they rely on trade with
each other as much as they do on consumer product exports to Western countries. Garment producing countries such
as Bangladesh and Cambodia continue to be hard hit by cancelled orders and factory shutdowns which have resulted
in mass unemployment and social unrest. The only Asian countries who are seeing growth, now and into 2020, are
China and Vietnam.

South-East Asia

Cambodia – Cambodia’s garment workers turned to the streets to protest the sudden loss of income due to Covid-19
factory related closures. Over 200 factories have closed, thousands of workers receiving dismissal notices and no
severance pay – in violation of labor laws. The garment sector in Cambodia employs over 800,000 people, mostly
women at an average wage of US$ 190/month ($1.30 an hour).

Indonesia – Indonesia is another country hit hard by the pandemic, with over 400,000 cases, leading to shutdowns and
mass unemployment. The Indonesian government passed a new law in October opening the door to labor intensive
manufacturing and foreign investment, aimed at creating jobs. Labor-intensive industry makes up less than 2% of
Indonesia’s GDP, much lower than other Asian countries.

Philippines – The Philippines continues to experience a severe fallout from the pandemic with the International
Monetary Fund (IMF) predicting a GDP contraction of 8.3% in 2020. To put it in context, Asian economies together are
projected to contract by 2.2%. This is the sharpest projected contraction among South-East Asian countries. As of mid-
October, the Philippines had almost 350,000 COVID-19 cases.

Thailand – In mid-October, Thailand’s new central bank governor predicted that the country’s economic recovery is
expected to take at least 2 years to reach pre-pandemic levels. He warned that Thailand, South-East Asia’s second
largest economy, could contract by a record 7.8% in 2020, partly due to the heavy impact of tourism. Anti-government
protests are also reportedly limiting consumption and business confidence

Vietnam – Aside from China, Vietnam is one of the only Asian economies to report economic growth in Q3 and into the
busy Christmas and 2021 pre-Chinese New Year season. Vietnam’s GDP rose by 2.62% in Q3, with exports increasing
11%, partly due effective management of the pandemic through strict lockdowns allowing for rapid business
reopening. Vietnam also continues to benefit as manufacturers shift from China.

                                                  Q4 2020 Retail Sourcing Report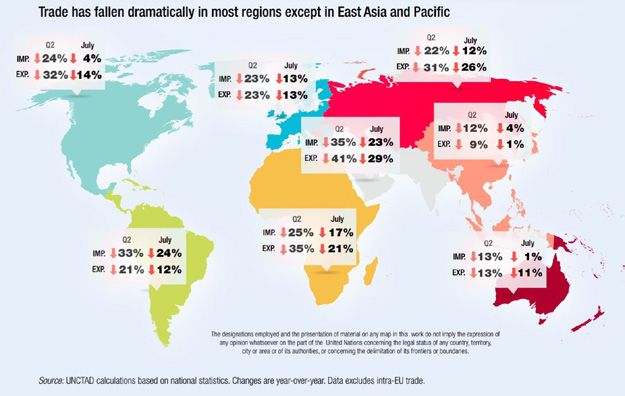
5
        South and West Asia

        Bangladesh – Manufacturing in Bangladesh continues to bear the impact of the pandemic, with order
        cancellations and factory closures resulting in layoffs and tough times for garment workers living on already
        sub-standard wages. According to the Bangladesh Garment Manufacturer’s and Exporters Association
        (BGMEA), 1,150 factories have been impacted, with $3.18 billion in pandemic related order cancellations.

        India – India continues to be hit hard by the pandemic with around 8 million cases and over 100,000 deaths
        by mid-October. While average daily numbers are on the decline, India is still the worst affected country
        after the US. Given the substantial number of potential cases in a population of 1.3 billion, the government
        has enforced lockdowns to some extent, but is also trying to balance the economic fallout of halting the
        economy.

        Pakistan – Despite a relatively low-number of Covid-19 related deaths, Pakistan’s economy is still set to
        contract through 2020. To stimulate their economy and create jobs, the Pakistani government is pushing
        hard for the $6.8 billion, 2.655 ML-1 railway project, part of the China-Pakistan Economic Corridor that will
        connect Karachi in the South to Peshawar in the North. This project will be 90% funded by Chinese loans.

        Turkey – Turkey’s COVID-19 death toll reached 10,000 in mid-October with almost 370,000 cases, with new
        lockdowns in place as the country fights off a second wave. While Turkish President Erdogan focused on
        pushing a political agenda across the Muslim world, the Turkish economy went into a free-fall, with the lira
        falling to record lows against the USD, inflation at 11.7% in Q3 and economic growth reached a 10-year low.

                       Sources: News Reports, Statistical Bureaus, Li & Fung Group (charts)

    © 1995-2020 Copyright by CBX Software. All rights reserved.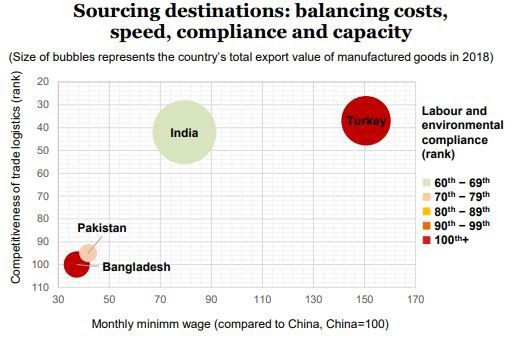
China Minimum Wage Trends                                                                                                                              6

  Q4 2020 News & Analysis:

   It is almost redundant to still look at individual Chinese provinces and regions for the purpose of finding an edge
  in labor cost. For more than a decade the Chinese central government has pushed their economy away from
  labor intensive industry towards higher value production and focused on growing domestic consumption versus
7 exports. Despite this policy exports grew strongly in Q3 and should continue to grow through Q2, 2022 assuming
  the pandemic recovery trend continues.
 China Minimum Wage Trends
  Since 2005, the Chinese economy has grown from $2.3 trillion in GDP to $14.4 trillion in 2019, with average
  annual income increasing by at a similar ratio from $1750 to over $10,000. As China’s leaders sit down for
 Q4 2020 News & Analysis: It is almost redundant to still look at individual Chinese provinces and regions for the purpose of finding
  their
 an edge next
          in laborfive-year    plan,
                   cost. For more  than we   canthe
                                        a decade  beChinese
                                                      sure central
                                                             that government
                                                                    similar policies
                                                                                has pushed oftheir
                                                                                               managing      growth
                                                                                                   economy away          will
                                                                                                                 from labor    mean steadily increasing
                                                                                                                            intensive
  minimum
 industry towardswages      across
                    higher value       China’s
                                 production      provinces
                                            and focused       anddomestic
                                                        on growing   regions. consumption versus exports. Despite this policy exports
 grew strongly in Q3 and should continue to grow through Q2, 2022 assuming the pandemic recovery trend continues.

 Since 2005, the Chinese economy has grown from $2.3 trillion in GDP to $14.4 trillion in 2019, with average annual income increasing
 by at a similar ratio from $1750 to over $10,000. As China’s leaders sit down for their next five-year plan, we can be sure that similar
  Note:ofThese
 policies   managing   are  official
                         growth        wage
                                will mean       guidelines
                                          steadily              mandated
                                                   increasing minimum           by each
                                                                       wages across   China’sprovince
                                                                                               provinces andorregions.
                                                                                                                region based on information     publicly
  available    as   of  Oct   1, 2020.     As   such   these   numbers       serve   as   an   indicator.    Actual     wages
 Note: These are official wage guidelines mandated by each province or region based on information publicly available as of Oct 1,
                                                                                                                                   may include benefits,
  food,
 2020. Ashousing      etc. Minimum
          such these numbers   serve as anwage     isActual
                                           indicator. typically
                                                            wages40-60%
                                                                 may includeofbenefits,
                                                                                average food,total  wage.
                                                                                              housing etc. Minimum wage is typically
 40-60% of average total wage.

                                          2020 Minimum Wage Updates (official)
                                  Monthly Min Avg Wage
   City/Region/Province                                           Increase %                      Official Update
                                  (RMB)
   Anhui                          1,550                           20.6%                           Nov 1, 2019
   Beijing                        2,200                           3.8%                            Jul 1, 2019
   Fujian                         1,800                           7.4%                            Jan 1, 2020
   Chongqing                      1,800                           20.0%                           Jan 1, 2019
   Gansu                          1,620                           10.2%                           Jun 1, 2019
   Guangxi                        1,680                           16.7%                           Jan 1, 2020
   Guangdong                      2,200                           12.3%                           Jul 1, 2019
   Guizhou                        1,790                           6.6%                            Dec 1, 2019
   Hainan                         1,670                           12.6%                           Feb 1, 2019
   Heilongjiang                   1,680                           15.4%                           Oct 1, 2019
   Henan                          1,900                           8.2%                            Oct 1, 2018
   Hebei                          1,900                           14.8%                           Nov 1, 2019
   Hubei                          1,750                           13.1%                           Nov 1, 2019
   Hunan                          1,700                           13.6%                           Oct 1, 2019
   Inner Mongolia                 1,760                           8.0%                            Aug 1, 2019
   Jiangsu                        2,020                           8.1%                            Aug 1, 2018
   Jiangxi                        1,680                           15.1%                           Jan 1, 2019
   Jilin                          1,780                           22.5%                           Oct 1, 2019
   Liaoning                       1,810                           7.6%                            Nov 1, 2019
   Ningxia                        1,660                           12.4%                           Jan 1, 2019
   Qinghai                        1,700                           15.2%                           Jan 1, 2020
   Shaanxi                        1,800                           7.0%                            May 1, 2019
   Shandong                       1,910                           6.7%                            Jun 1, 2018
   Shanghai                       2,480                           2.5%                            Apr 1, 2019
   Shenzhen                       2,200                           4.9%                            Jul 1, 2018
   Sichuan                        1,780                           7.1%                            Jul 1, 2019
   Tianjin                        2,050                           5.1%                            Jul 1, 2019
   Tibet                          1,650                           17.8%                           Jan 1, 2019
   Xinjiang Uyghur                1,820                           12.9%                           Jan 1, 2019
   Yunnan                         1,670                           10.6%                           May 1, 2019
   Zhejiang                       2,010                           8.4%                            Jan 1, 2019

                                                                   Q4 2020 Retail Sourcing Report
 © 1995-2020 Copyright by CBX Software. All rights reserved.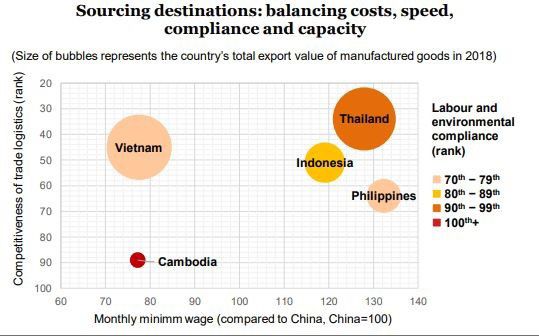
7       Low-Cost Country Sourcing Wage Trends

        Below is a snapshot of minimum wages in selected Asian sourcing locations, with the addition of Egypt,
        Ethiopia, and Turkey to give a comparative view. Wages vary by region or province and indicate either
        an estimated or actual/official rate. In cases with a distinct variance, we provide an average.8 Currency
        fluctuations mean that these figures are approximate at the time of finalizing this report.
        Low-Cost Country Sourcing Wage Trends
        Below is a snapshot of minimum wages in selected Asian sourcing locations, with the addition of Egypt,
Q4 2020   News & Analysis:
     Ethiopia, and Turkey to give a comparative view. Wages vary by region or province and indicate either an
        estimated or actual/official rate. In cases with a distinct variance, we provide an average. Currency
With no clear horizon for the end of COVID-19, there is little cause for optimism on the labor front in low cost
        fluctuations mean that these figures are approximate at the time of finalizing this report.
sourcing countries, in some cases the gains in compliance and the movement towards a living wage might
be going backwards. While Bangladesh approved a wage increase for leather goods and footwear workers,
        Q4 2020 News & Analysis: With no clear horizon for the end of COVID-19, there is little cause for optimism
the first for them since 2013, Indonesia is pushing ahead with a controversial Omnibus Bill aimed at relaxing
        on the labor front in low cost sourcing countries, in some cases the gains in compliance and the movement
business, labor, and environmental laws to encourage foreign investment and create more labor-intensive jobs
        towards a living wage might be going backwards. While Bangladesh approved a wage increase for leather
with minimum wages set by regional governors. Similarly, workers in low-cost countries such as Cambodia and
        goods and footwear workers, the first for them since 2013, Indonesia is pushing ahead with a controversial
Myanmar face an uncertain future until the pandemic ends.
        Omnibus Bill aimed at relaxing business, labor, and environmental laws to encourage foreign investment and
        create more labor-intensive jobs with minimum wages set by regional governors. Similarly, workers in low-
        cost countries such as Cambodia and Myanmar face an uncertain future until the pandemic ends.
        Note: Figures are provided in USD/month based on currency exchange as of Oct 1, 2020. Minimum wage
        Note: Figures are provided in USD/month based on currency exchange as of Oct 1, 2020. Minimum wage
        policies are updated as per data available at the time of finalizing this report and are based primarily on
        policies
        unskilledarewages.
                     updatedConsult
                             as per data available
                                     sources  suchatastheFair
                                                          timeWage
                                                               of finalizing
                                                                     Guide this  report and are based
                                                                             or Wageindicator.org   toprimarily
                                                                                                       assess onand calculate
        unskilled wages. Consult sources  such as  Fair Wage  Guide  or Wageindicator.org
        benchmarks for wages in particular countries and regions not covered here.         to assess and calculate
        benchmarks for wages in particular countries and regions not covered here.

         BANGLADESH                CAMBODIA                   CHINA                    EGYPT                      ETHIOPIA
         $95 (Sep 2020)            $190 (Jan 1, 2020)         $163-$359 (Jan 2020)     $116 (April 2019)          $26 (Jan 2015)
         As of September 2020,     Cambodia announced         Minimum wages in         Egypt raised their         Ethiopia is still
         the Bangladesh            an increase to their       China are set by local   minimum age to 2000        working on a system
         Ministry of Labor and     minimum wage from          governments and have     Egyptian pounds ($116)     to determine a
         Employment approved       US$182, to $190 a          varying wage formulas    from 1200 pounds,          minimum wage for the
         a 94% minimum wage        4.4% increase, to take     (with housing, food,     applying to all workers,   private sector. Entry
         increase for leather      effect from January 1,     overtime etc.)           with higher increases      level wages in the
         goods and footwear        2020. Political and        Actual 2020 wages for    going to the private       textile sector range
         workers from 3,652        labor tension              manufacturing jobs in    sector. This increase      from $35 to $40. The
         taka (2013) to 7,100      continues as               China are much higher    came ahead of a June       base minimum wage
         taka (US $85).            opposition push for        at US$870/month          30, 3029 target date.      is officially
                                   more rights and pay.                                                           $18/month.
         INDIA                     INDONESIA                  LAO PDR                  MALAYSIA                   MYANMAR
         $94-$236 (Oct 2020)       $120-$298 (Oct 2020)       $124 (May 2018)          $270-$295 (Jan 2019)       $80 (Mar 2018)
         The Indian Parliament     As of Q4 2020,             The Lao Government       Malaysia implemented       Myanmar revised its
         is in the process of      Indonesia is working to    approved an increase     a nationwide minimum       minimum wage from
         reforming labor           finalize a controversial   in minimum wage from     wage of RM 1,100 as of     K600 ($2.70) per day
         policies. By September    Omnibus Bill focused       Kip 900,000 (US$107)     January 2019. Wages        to K4,800 (3.60) or
         of 2020 3 of 4 labor      on creating jobs in        to Kip 1,100,000         vary by region and are     K600/ hour for an
         bills passed through      labor heavy industries,    (US$142)) in key         supposed to be             eight-hour workday in
         and await final           to create jobs and         provinces which took     reviewed every 2 years.    2018. This is increase
         approval from the         incentivize foreign        effect in May 2018.      The new directive is       of 33%, mostly affects
         Indian President.         investors.                                          being enforced widely.     garment workers.
         PHILLIPPINES              SRI LANKA                  THAILAND                 TURKEY                     VIETNAM
         $132-$190 (Jan 18)        $67 (Mar 2016)             $248-$265 (Apr 1/18)     $482 (Jan 2020)            $132-190 (Jan 1/19)
         Wages in the              Sri Lanka adopted two      Thailand is in the       To combat inflation of     Vietnam announced
         Philippines vary by       laws on minimum            process of updating      close to 12%, Turkey       they will increase their
         region, skill level and   wages as of early          their minimum wage       announced a minimum        minimum wage by
         wage classification.      2016, mandating a          from a current           wage increase of 15%,      5.3% in 2019. This
         Negotiations are still    minimum wage of Rs         minimum of 308 – 330     effective Jan 1, 2020 to   increase was relatively
         underway, but Manila      10,000 (+/- $67) and       Baht per day to a        2,324 liras/month          lower than the 2018
         for example saw a 21      an increase of Rs          proposed 400 Baht per    (US$381) net. This         increase of 6.5%.
         Peso ($0.42) increase     2,500 (+/-f$17) for        day. Most businesses     brings the gross           Wages range from
         in their daily wage to    workers earning less       are opposed to this      minimum wage (before       $125-$180 / month
         491 Pesos ($9.82) in      than Rs 40,000 per         higher wage as being     deductions) to 2,943       across 4 key regions
         Q4 2017.                  month (+/- $270)           too high.                liras/month (US$482).      in Vietnam.

         Sources: WageIndicator.org, SAFSA, Local News Reports
                                                       Q4 2020 Retail Sourcing Report

    © 1995-2020 Copyright by CBX Software. All rights reserved.
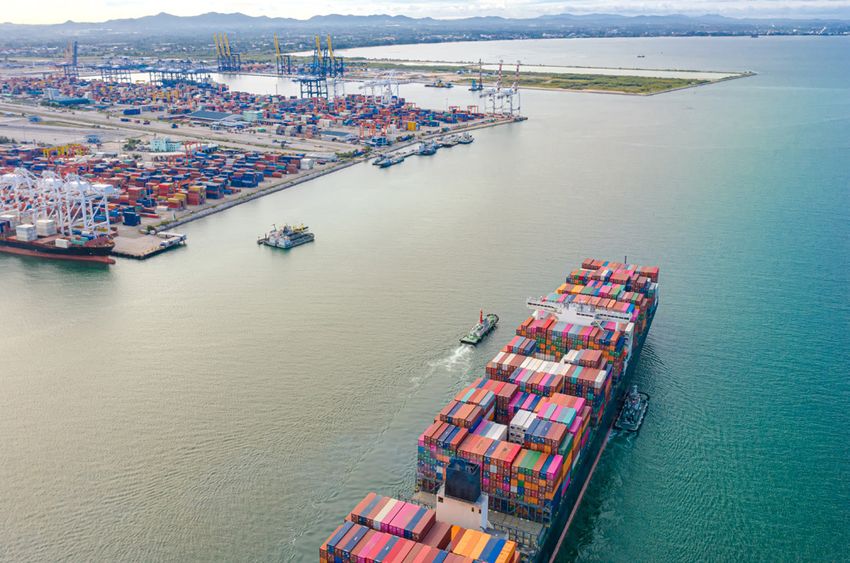
Container Freight Rates & Trends                                                                                 8

  Q4 2020 News and Analysis:

  While spot rates on major East-West shipping routes have climbed higher through Q2 and Q3, carrier service
  levels and on-time arrivals of container ships has plummeted. Through late Q3, carrier reliability was below 50%
  on shipments from Asia to US East and West Coasts and down 69% for Asia-North Europe. Container ships were
  on average five days late in September, according to Sea-Intelligence Maritime Analysis. Carriers have continued
  to reduce capacity through the pandemic, which has kept prices high but left importers frustrated. Importers are
  also dealing with port congestion and unpredictability in inventory forecasting and replenishment. With concern
  over a second wave of Covid-19 and economic and political uncertainty in the US and Europe, container shipping
  rates and service are unlikely to improve until well into 2021, if at all.

Asia - North Europe Trade Lanes

Asia-North Europe container shipping rates have
continued to increase through 2020, based on limited
capacity and strong demand, especially following
pandemic shut-downs and approaching the busy
Christmas and pre-Chinese New Year season.

Container shipping rates are expected to remain high
given that carriers are carefully managing capacity
below the level of demand to protect their interests.
According to Sea-Intelligence, shipping volumes on
Asia – North Europe routes were up 2% year-on-year in
July to 1.5 million TEU.

Asia – North America Trade Lanes

Both East and West coast US spot container shipping
rates reached annual highs in Q3 and continue to climb
into Q4. Similar to Asia-North Europe lanes, carriers
cut capacity by blanking sailings from Asia to North
America during the first half of 2020 (the pandemic),
but as demand increased, they have not reintroduced
sufficient capacity.

Heading into the peak Chr istm as seaso n and
subsequent peak pre-Chinese New Year period, the
current trend in shipping rates/capacity is most likely to
continue. Reports show that consumer goods spending
is up dramatically, driven by e-commerce growth and by
consumer’s shifting spend from services to goods such
as furniture, home office, exercise and other products
which should continue to drive demand for shipping.

 Sources: IHS Markit, Joc.com, Alphaliner, SeaIntel

                                                     Q4 2020 Retail Sourcing Report
9 Trading Currency Rates & Trends
Following are exchange rates and indicators for major currencies commonly factored into global sourcing
costing estimations. The fallout from Covid-19 has extended to foreign exchange with many investors selling
currencies in countries that are hard hit with the virus and placing their assets in safe-haven currencies
– especially the US dollar. The dollar is likely to hold11 strong since there are few alternatives, given the
Euro’s limited role as a reserve currency and the fact that the Chinese Renminbi is still tightly controlled.
11
11Trading Currency Rates & Trends
Currency volatility continues to impact purchasing, resulted in higher costs and threatening margins. Other
factors driving volatility are the upcoming US election, uncertainty over future stimulus packages, the Brexit
Tradingongoing
negotiation, Currency Rates
uncertainty & Trends
with US/China trade andFollowing
the potential resurgence of Covid-19
indicatorsthis Winter.
Trading Currency Rates & Trends
are exchange rates and for major currencies comm
costing estimations. The fallout from Covid-19 has extended to foreign ex
Following are exchange rates and indicators for major currencies commonly factored into global sourcing
currencies in countries that are hard hit with the virus and placing their
costing estimations. The fallout from Covid-19 has extended to foreign exchange
Following areUS with manyrates
exchange investors
and isselling
indicators for major currencies comm
especially the dollar. The dollar likely to hold strong since there are
CBX Software
currencies helps
in countries that you
are hard hit stay
with theup toand
virus date with
placing theirchanging
costing
limited
assets
estimations.
role as a reserve trading
in safe-haven currencies
Thecurrency
fallout from –
and Covid-19 has the
the fact that extended
Chineseto foreign
Renminb e
especially the US dollar. The dollar is likely to hold strong since there are fewinalternatives,
currencies countries given
that arethe
hardEuro’s
hit Learn
with More
the virus and placing thei
policies
limited role as and new
a reserve tariffs
currency andrule with
the fact our
that the AI sourcing
Chinese Renminbi solution.
volatility
especially
continues to impact purchasing, resulted in higher costs and t
is still
the UStightly controlled.
dollar. Currency
driving volatility are the The dollar
upcoming isUS likely to holduncertainty
election, strong since there
over a
futu
volatility continues to impact purchasing, resulted in higher costslimited
and threatening
role as a margins.
reserve Other and
currency factors the fact that
negotiation, ongoing uncertainty with US/China tradethe Chinese
and Renminb
the potential re
driving volatility are the upcoming US election, uncertainty over futurecontinues
volatility stimulus to packages, the Brexit resulted in higher costs and
impact purchasing,
negotiation, ongoing uncertainty with US/China trade and the potential drivingresurgence
volatility of
areCovid-19 this Winter.
EUR / USD (Oct 2019 –the
Octupcoming
2020) US election, uncertainty over fut
negotiation, ongoing uncertainty with US/China trade and the potential r
EUR / USD (Oct 2019 – Oct 2020) EUR/USD Low High
EUR / USD (Oct 2019 – Oct 2020)
2 year 1.06 1.94
1 year 1.06 1.19
1 month 1.16 1.87
T
U
The Euro appreciated against the th
USD through Q3 on optimism over wT
the European economy but flattened wU
with fears of a second COVID-19 et
wave. The EUR/USD pair is 1w
expected to trade in the range of thw
1.17 until 2021. Assuming stability in the
the US and Covid-19 containment, 1
EUR
The/ Chinese
CNY (Julycould
the Euro 2019reach
Yuan – July
made 2020)
1.20 nextagainst
gains year. the Euro t
EUR / CNY (July 2019 – July 2020) through Q3, weakening into Q4. Chinese government t
EUR/CNY
CNY (July 2019 – Low
July 2020) High
officials have warned of risks of CNY fluctuation in
EUR /
both directions
2 year through 2021. Most
7.49 8.31predictions are
that the Chinese currency
1 year 7.55 will continue
8.31 to appreciate
against both the Euro7.83
1 month and the USD.
8.01
T
a
The Chinese Yuan made gains w
against the Euro through Q3, gT
weakening into Q4. Chinese ria
government officials have warned of dw
risks of CNY fluctuation in both pg
directions through 2021. Most cur
predictions are that the Chinese ad
USD / currency
CNY (Julywill
2019continue to appreciate
– July 2020) p
against both the Euro and the USD. c
USD / CNY (July 2019 – July 2020) a
The Chinese Yuan appreciated against the USD USD / CNY (July 2019 –Low
USD/CNY July 2020) High
through Q3 to 2018 levels, after plunging to
2008 lows in Q1 early this year. Drivers for Yuan 2 year 6.64 7.17
appreciation are a fast recovery in the domestic 1 year 6.64 7.16
economy and ongoing strength in exports. Volatility 1 month 6.64 6.82 T
is expected to continue through Q4 and into 2020 The Chinese Yuan appreciated
a
based on the US election outcome and COVID-19 le
against the USD through Q3 to 2018 QT
containment. levels, after plunging to 2008 lows in aa
Q1 early this year. Drivers for Yuan dl
appreciation are a fast recovery in the stQ
domestic economy and ongoing ea
strength in exports. Volatility is ind
Sources: XE.com, News/Analyst Reports
expected to continue through Q4 and os
Sources: XE.com, News/Analyst Reports into 2020 based on the US election e
outcome
© 1995-2020
Sources: and COVID-19
Copyright
XE.com, containment.
by CBX Software.
News/Analyst All rights reserved.
Reports i
© 1995-2020 Copyright by CBX Software. All rights reserved. Sources: XE.com, News/Analyst Reports o
© 1995-2020 Copyright by CBX Software. All rights reserved.
© 1995-2020 Copyright by CBX Software. All rights reserved.Global Commodity Rates & Trends 10
12
Global Commodity Rates & Trends
Q4 2020 News and Analysis:
Q4 2020 News & Analysis: Almost all commodity prices recovered in the third quarter of 2020 following
Almost all commodity prices recovered in the third quarter of 2020 following steep declines earlier in the
steep declines earlier in the year due to the COVID-19 pandemic. Following a strong summer rebound, as
year due to the COVID-19 pandemic. Following a strong summer rebound, as lockdowns lifted, momentum in
lockdowns
commodity lifted,prices
momentum in commodity
has stalled in recentprices
weekshasasstalled
second in recent
wavesweeks
of theas second waves
pandemic of the
and economic uncertainty
pandemic and economic uncertainty continued. A levelling off in demand is coinciding with limited supply
continued. A levelling off in demand is coinciding with limited supply suggesting that commodity prices face
suggesting
an uphillthat commodity
battle. prices
Oil prices, facetend
which an uphill battle.
to lead mostOil prices, which prices
commodity tend toin
lead mostdirection,
either commodity areprices
likely to have a slow
in either direction, are likely to have a slow recovery into 2021. The forecast for
recovery into 2021. The forecast for commodities depends on geopolitical factors such as thecommodities depends on outcome of the
geopolitical
US election, the ongoing Brexit scenario and how long it takes for a COVID-19 vaccine to roll-out.it
factors such as the outcome of the US election, the ongoing Brexit scenario and how long
takes for a COVID-19 vaccine to roll-out.
Crude Oil
Crude Oil Crude oil prices have doubled
since their April low, supported
70
70 Oil US$ per barrel Crude oil prices have doubled since their
65 Dated by sharp supply cuts by OPEC.
65 Dated April low, supported by sharp supply cuts
60
60 Brent,light
Brent,light However, prices remain a third
55
55
blend 38
blend 38 by OPEC. than
lower However, prices remain a third
pre-pandemic
API
50 API
lower
50
45
45
levels.than pre-pandemic
Oil prices levels. Oil prices
are expected
40
40
Dubai,mediu
Dubai,mediu
m, fob
fob
are expected
to increase to increase
gradually gradually
in 2021 as in
m,
35
35 Dubai Fateh
Dubai Fateh demand
2021 is matched
as demand by an
is matched by an easing
30
30
25
25
32 API
32 API easing
of supply. of supply. The
20
20 West Texas
West Texas pandemic could have lasting
15
15 Intermedia
Intermedia effects on oil demand though
10
10 40 API,
API, The pandemic could have lasting effects
40 as changes in consumer
Midland
Midland on oil demand though as changes in
Texas
Texas behavior influence demand.
consumer behavior influence demand.
Rubber
Rubber Natural rubber prices have
soared through the pandemic
Rubber, No. 3 Smoked Sheet (RSS3), Singapore Natural
partly onrubber
strong prices
demand have soared
for PPE
Exchange through
such as the pandemic
protective partlyOn
gloves. on strong
2.0
2.0 Price in US cents per kilogram demand
the supplyfor PPE suchpandemic
side, as protective
related On
gloves. labor shortages
the supply side, and
pandemic
1.8
1.8 weatherlabor
issues in Thailand
1.6
related shortages andandweather
1.6 Vietnamin (key producers) have (key
issues Thailand and Vietnam
1.4
1.4 resulted in reductions in rubber
producers) havefactors
production. Key resulted in reductions in
in rubber
1.2
1.2 rubber
price volatility into 2021 include in rubber
production. Key factors
1.0
1.0 price volatility into 2021
COVID-19 recovery, US include
China COVID-19
recovery, US China
trade tension and the trade tension and the
American
13 American election outcome.
election outcome.
Metals
Metal
Despite the steepest global
Metals US$ per metric ton economic
Despite contraction
the steepest in recent
global economic
20000
history,
contraction base metal
in recent prices
history, have
base metal
18000
16000 3000 pricessurged well well
have surged above
abovetheir
their pre-
pre-
14000 pandemic
pandemic levels.levels. Key drivers
Key drivers are
are Chinese
12000 2442 Chinese stimulus measures
stimulus measures and the pandemic and
2000
10000 thewhich
recovery pandemic recovery
has fueled which
an industrial
8000 1873
6000 and manufacturing rebound. Going and
has fueled an industrial
1000 manufacturing rebound. Going
4000 forward, waning stimulus measures and
2000 124
forward, waning stimulus
the potential of over-supply might impact
0 0 measures and the potential of
pricing. Metals are expected to see a
over-supply might impact pricing.
modest gain in prices in the range of 2%
Metals are expected to see a
for 2021.
Tin Aluminum Copper Nickel
modest gain in prices in the
Zinc Lead Iron range of 2% for 2021.
Q4 2020 Retail Sourcing Report
Cotton
Q4 2020 Retail
Latest reports indicate a decrease in global cotton production Sourcing
(-934,000 bales toReport
116.3 million) along
with an increase in global mill-use (+1.5 million bales to 114.2 million) through Q3/Q4. This has led to
2.7 million bale reduction for 2020/2021 forecasts, which still leaves stockpiles at the one of the highest12000 20002000 Chineselevels.
pandemic
Chinese stimulus
stimulus Key measures
drivers
measures are and
and
10000 12000
10000
14000
10000
2442
2000
2000
the pandemic
the
the pandemic
pandemic recovery
recovery
recovery whichwhich
which
10000
12000
80008000 18732442
1873 Chinese
has the
hasfueled stimulus
pandemic
fueled an an measures
recovery
industrial
industrial and
which
and and
8000 1873
2000 has fueled an an industrial
industrial and
10000
8000
60006000 1873
10001000 the
has pandemic
fueled recovery whichand
6000
8000
6000
40004000 1000
1873 manufacturing
manufacturing
manufacturing rebound.
rebound.
rebound. GoingGoing
Going
4000 1000 has fueled an industrial
manufacturing rebound. and
Going
6000
4000
20002000 1241000
forward,
forward, waning
forward, waning
waning stimulus
stimulus
stimulus
2000 124
124 manufacturing
forward, rebound. Going
waning stimulus
4000
0 2000
0 0 0 0 124 measures
measures
measures and and
andthe the potential
the potential
potential of of
ofof
Cotton
0 forward,
measuresmight waning
and theimpactstimulus
potential
11 2000
0
0 0
0
124
over-supply
over-supply
over-supply
measures
over-supply and might
mightimpact
the
might
pricing.
impact
potential
impact
pricing.
pricing.
of
pricing.
Metals
Metalsareare
Metals expected
are expected
expected to pricing.
see
to see a aa
over-supply
Metals
modest are
gain
might impact
inexpected
prices toto see
see a
Tin TinTin Aluminum
Aluminum Copper
Copper Nickel
Nickel
modest
Metals
modest
modest
gain
aregain
expected
gain in
inin pricesto in
prices
prices see the
in
in
the
inathethe
Aluminum Copper Nickel
Tin
Zinc Zinc
Zinc
Aluminum
LeadLead
Lead
Copper
Iron Iron
Iron
Nickel range
modestof
range
rangeof2%
of for
2%
gain
of2%2%in 2021.
for 2021.
prices
2021. in the
for2021.
Tin
Zinc Aluminum
Lead Copper
Iron Nickel range for
Zinc Lead Iron range of 2% for 2021.
Cotton Latest reports indicate a decrease in global cotton production (-934,000 bales to 116.3 million) along with
Cotton
Cotton
Cotton
Cotton
an increase in global mill-use (+1.5 million bales to 114.2 million) through Q3/Q4. This has led to 2.7 million
Latest reports
Latest
bale
Latest reportsindicate
reduction
reports indicate
reports indicate
a for
decrease
a adecrease
a2020/2021
in global
decrease cotton
ininglobal
forecasts,
global production
cotton
cotton production
which
production (-934,000
(-934,000
still bales
leaves
(-934,000
(-934,000
balesto 116.3
toto116.3
stockpiles
bales
bales 116.3million)
million)
at the
million) alongalong
onealong of the highest on record.
Latest
withwith
anLatest
with an reports
increase
an increase in
increase
indicate
indicate
global
ininglobal
global
decrease in
a decrease
mill-use
mill-use
mill-use in
(+1.5
global
global
million
(+1.5
(+1.5
cotton
cotton
bales
million
million
production
production
to
bales
bales 114.2
to to114.2 (-934,000
million)
114.2 million) bales
through
million) toto
through
through
116.3
116.3
Q3/Q4Q3/Q4
Q3/Q4.
million)
million)
This
. . has
This
This
along
along
led
has
has to
led to
ledtoto
2.7 2.7
Both
with
with
million
an China
bale
million
increase
an increase and
reduction
bale
in
reduction
India
global
in global
for for
reported
mill-use
mill-use
2020/2021
2020/2021 (+1.5higher
(+1.5 million
million
forecasts,
forecasts,
than
bales
bales
which
predicted
to
tostill
still
which
114.2
114.2
leaves
mill-use
million)
million)
stockpiles
through
through and
at the Q3/Q4 China
Q3/Q4
one
.
. This
of the
imported
Thishashasled
highest to more than forecast.
led
2.7
2.7 million
million bale
bale reduction
reduction for
for 2020/2021
2020/2021 forecasts,
forecasts, which
which stillleaves
still leaves
leaves stockpiles
stockpiles
stockpiles at
at
at the one
theone
the one of
of the
ofthe highest
thehighest
highest
Prices
onon2.7
on record. million
record.
on Both
record. have
Bothbale
China
Both increase
reduction
Chinaandand
China India for
andIndia
and steadily
2020/2021
reported
India reported
reported since
higher
higherpandemic
forecasts,
higher than which
predicted
than
than predicted
predicted induced
still leaves
mill-use
mill-use and
mill-use lows
stockpiles
China
and
and inatimported
China
China early
the oneApril
imported
imported
of
morethe and
morehighest
than
more have held steady partly due to
than
than
onrecord.
record. Both
Both China
China and India
India reported
reported higher
higher than
than predicted
predicted mill-use
mill-use andand China
China imported
imported moremore than
than
Hurricane
forecast.
forecast.Prices
forecast.
forecast.
forecast.
Prices
PricesDelta
have
Prices
Prices
have
have
have
have
which
increase
increase
increase impacted
steadily
steadilysince
steadily
increase steadily
increase steadilysince the
pandemic
since
since US
pandemic
pandemic
sincepandemic cotton
induced
induced
pandemicinduced inducedbelt.
lows
inducedlows lowsin
lowsWhile
early
in
in indicators
April
early
early
lowsininearly and
April
April
earlyApril
April have
and
and
and are
haveheld
have
have that
steady
held
held
held cotton
steady
steady
steady prices should continue
partly due
partly
partly
to todue
due
rise
partly dueHurricane
to Hurricane
to
into
to 2021, Delta
Hurricane
Hurricane Deltawhich
Delta
volatility
Delta impacted
which
which
which impacted the
impacted
could
impactedcome US
the
the cotton
theUS UScotton
from
US belt.
cotton
cottonthe While
belt.
belt. While
outcome
belt. indicators
While
While indicators
indicators
of areand
the
indicators that
are
US
are
have
arethatthat
held
cotton
cotton
cotton
election,
that cotton
steady
prices
prices
prices
ongoing
prices US/China (and US/
partly due to Hurricane Delta which impacted the US cotton belt. While indicators are that cotton prices
should
shouldcontinue
should
should continue to rise
continue toto into
rise
rise 2021,
into
into2021,
into volatility
2021, could
volatility
volatility come
could
could comefrom
come from the the
from outcome
the outcome
outcomeof the
of US
ofthe
the election,
USUS election,ongoing
election, ongoing
ongoing
should continue
Vietnam) trade
continue to
to rise
tension
rise into 2021,
and
2021, volatility
how
volatility could
long
could come
recovery
come from
from the
from
the outcome
outcome ofofthe
COVID-19 theUSUStakes. election,
election, ongoing
ongoing
US/China
US/China (and
US/China
US/China US/Vietnam)
(and
(and US/Vietnam)
US/Vietnam) trade tension
trade
trade tension andand
tension how
andhowlonglong
how recovery
long recovery
recovery from COVID-19
from
from COVID-19
COVID-19 takes. takes.
takes.
US/China (and
(and US/Vietnam) trade tension
US/Vietnam) trade tensionand
andhow
howlong
longrecovery
recoveryfrom
fromCOVID-19
COVID-19 takes.
takes.
Speed
Scale
Simplicity
Source: Cotton Inc, News Reports
Source:
Source:
Source: Cotton
Cotton
Source: Inc,
Inc,Inc,
Cotton News News Reports
Reports
News Reports
Sources: Cotton Inc, News Reports
Plastics and Synthetic Fibers
© 1995-2020 Copyright by CBX Software. All rights reserved.
©
© 1995-2020 Q4 2020 Snapshot:
© 1995-2020
1995-2020 Copyright
Copyright by
Copyright
© 1995-2020 by CBX
Copyright
by CBX
by CBX
CBX Software.
Software. All
Software.
All rights
All rights
Software.
rights reserved.
reserved.
reserved.
All rights reserved.
14
Synthetic fiber prices, especially for nylon and polyester fell dramatically through Q3 on lower oil
Plastics and
prices, Synthetic
currency Fibers
devaluations and lower demand for finished goods from Asia, Europe, and the US.
Stability on the supply is also an issue going forward. Synthetic fiber prices in Asia fell by more than
Q4 2020 News: Synthetic fiber prices, especially for nylon and polyester fell dramatically through Q3 on lower
20% year-on-year, mostly due to price drops in polyester, the most widely used fiber.
oil prices, currency devaluations and lower demand for finished goods from Asia, Europe, and the US.
Stability on the supply is also an issue going forward. Synthetic fiber prices in Asia fell by more than 20%
year-on-year, mostly due to price drops in polyester, the most widely used fiber.
Plastics & Fibers, Regrind/ Flakes (Euros/kg)
1.0
0.9
0.8
Nylon
0.7
0.6 Polyester
0.5 ABS
0.4 PVC
0.3
PP
0.2
PS
Sources: IMF data, Plasticker, ICIS
© 1995-2020 Copyright by CBX Software. All rights reserved.12
Quality Control Indicator
This report frequently covers quality control and quality assurance issues. Audit and inspection data which tend to mirror
sourcing activity, provide an indicator of activity and trends in various sourcing regions.
According to data from Quality Inspection provider QIMA, while sourcing and global trade picked up dramatically
through Q3 to meet demand, inspection and audit trends suggest that the recovery scramble has meant a sacrifice on
sustainability and social compliance. Many businesses went into survival mode, cutting costs where they can, adding
pressure on suppliers, in turn putting worker safety and product quality at risk.
Most of the issues around quality we have seen are related to inconsistencies with suppliers and the ability to adapt to
the added demands of the pandemic, both at the buyer and supplier level.
Demand for inspections in China grew at the rate of 11% (year-on-year) overall in Q3, especially from US and European
buyers in the electrical and electronics sectors. Lower demand for inspections (down 15% in Q3) in the Chinese textile
and apparel sector reflected the ongoing shift in apparel production to lower cost countries such as Bangladesh,
Vietnam, and others.
Overall, South-East Asia saw a pick-up in demand for inspections of 10% year-on-year, with growth in Myanmar,
Indonesia, the Philippines, and Vietnam – who all took business from China. South-Asia also saw growing demand for
inspections and audits, led by Bangladesh where inspections grew 86% in September.
Sources: QIMA Data, News Reports
The trend of nearshoring, which was picking up in recent years appears different for US and European buyers. The QIMA
data suggests that US brands were more likely to buy from factories reopening in South Asia than from Latin or South
America, whereas European brands continued to increase their sourcing (and inspections) from countries such as
Morocco, Egypt and Tunisia, which all saw double digit growth.
Sources: QIMA Data, News Reports
Q4 2020 Retail Sourcing Report13 Focus Topic: COVID-19, E-Commerce Accelerator
One of the bright spots that emerged through the COVID-19 pandemic is online retail. Already a growing force
prior to 2020, world-wide implementation of physical-distancing and stay-at-home orders has accelerated the
progression of e-commerce. To put it in perspective, according to Statista (chart below) in 2015 e-commerce
represented 7.4% of total global retail sales, by late 2020 e-commerce’s share of total retail will be above
16.1%. By 2023, online retail should comprise 22% of total retail.
This pandemic driven fundamental shift in consumer behavior will bring lasting effects as consumers shop
more online and retailers improve service levels. The cliché of “adapt or die” applies to retail more than ever.
Online shopping trends we see now provide a sense of where e-commerce is headed.
Lining the Nest
Nearly half of consumers shifted their spending across online verticals such as apparel and electronics, but
categories such as health, fitness, groceries, and DIY did especially well as people spent more time at home.
Online orders in most of these categories grew by two- or three-times times year-on-year, with some retailers
seeing increases of more than 20 times. (e-Marketer).
Retailers that capitalized on consumer trends such as food preparation, online fitness and home offices were
rewarded. Those able to perfect online models such as home delivery (Amazon) thrived through the pandemic
and will continue to do so after.
Platform vs Retailer/Brand
Another evolving trend that grew through the pandemic
is the customer focus on product availability in a
competitive marketplace. Amazon grew exponentially
not because it is cheaper, but because they provide a
platform for competing products, often direct from the
source which are vetted (reviewed) by other consumers.
Other marketplace such as Wayfair and eBay have also
carved out niches, but traditional retailers such as Best
Buy and Walmart are also betting heavily on their own
marketplaces to drive growth.
Re-evaluating Cost-Cutting
The biggest takeaway from the shift in consumer retail behavior, accelerated by the pandemic, is that
conventional forms of cost-cutting are less relevant. For example, historically retailers and brands placed a
heavy focus on the input cost factors we cover in this report – labor costs, material costs, currency exchange,
logistics efficiency and speed to market. Going forward, the biggest area where retailers and brands need
to look at cost-cutting is not through the supply chain, but at the end of it - whether in store or online or a
combination. As an example, companies such as Bed-Bath and Beyond have done well with their Buy-Online-
Pick-up-in-Store (BOPIS) model which has allowed them to cut bricks and mortar locations.
© 1995-2020 Copyright by CBX Software. All rights reserved.The Customer is Always Right 14
No doubt the elements that go into getting products to market quickly and at a reasonable price are still important. But
the biggest long-term factor of success for retailers and brands is the ability to innovate and provide consumers with
the holy grail of what consumers want. This is an ever-moving target but includes the right products (on-trend), meeting
product quality and social standards, pricing/value that makes sense and Amazon level service (question-free returns).
Most importantly though, the pandemic has reinforced some marketing basics – retailers need to ensure customers can
buy WHAT they want, WHEN they want it and WHERE they can get it – which increasingly means online.
The Outlook for Global Trade in Q4 and Beyond
No doubt the pandemic threw us for a loop, but the big question is what things will look like in the next quarter and
next year. Recent reports from the International Monetary Fund (IMF) and the United Nations Conference on Trade and
Development (UNCTAD) suggest that we are on the road to recovery through Q4 and into 2021, but it could be a rocky
road.
Despite what looks like a pandemic recovery, UNCTAD data showed a 5% drop in world trade in Q3 compared to the
same quarter in 2019. This is certainly an improvement over Q2, which saw a 19% drop year-on-year, but overall global
trade is still expected to contract by around 7-9% relative to 2019. While not great news, these numbers reflect a
better than expected outcome, with manufacturing in Asia recovering quicker than expected and demand for products
continuing strong in North America and Europe, possibly as people spent more on goods versus services.
Asia is expected to fare better than the rest of the world, with the IMF forecasting a 2.2% contraction for 2020, based
mostly on the greater impact from COVID-19 through Q3 on India, Malaysia, and the Philippines. China is one exception,
with the IMF predicting growth of 1.9% for 2020 relative to 2019. Chinese exports plummeted in Q1 but picked up
strongly through Q2 and Q3 and should reach year-on-year growth of around 10% (UNCTAD). Chinese imports also grew
strongly through Q3, reaching 13% growth in September. The most dramatic decline in trade was in South and West Asia,
where imports dropped by 23% and exports declined by 29%.
Certain sectors such as energy and automotive were particularly hard hit, while other sectors such a communication
equipment, office machinery, textiles and apparel had robust growth. Exports in medical supplies from China, the
European Union, and the United States grew from an average of US $25 billion to $45 billion per month from January
to May 2020 and 50% per month in subsequent months. The concern revealed by the UNCTAD data is that wealthy
countries have more access to medical supplies, especially non-PPE products – for example, a vaccine. The report
stresses that once a COVID-19 vaccine is created, it is important for developing countries to have equal access to ensure
a faster global recovery.
Q4 2020 Retail Sourcing Report16
About
CBX Software is the world’s leading Total Sourcing TradeBeyond is an exclusive community of retailers,
Management solution provider, from concept, to suppliers, and brands coming together to streamline
delivery – combining people, process and solutions. assortment planning, sourcing, quotations, and
CBX helps retailers and brands streamline product buying. TradeBeyond is not a marketplace; it’s a
development and sourcing, all the way through order & network and an app used by retailers to discover
production. CBX empowers the supply chain network new exclusive products and by suppliers to get
by driving collaboration to over 15,000 retail & supplier discovered and win more business! Visit www.
partners and 30,000 users in more than 50 countries. tradebeyond.com
For more information, visit www.cbxsoftware.com.
Americas +1.858.264.1133
Asia +852.2378.6300
EMEA +49.89.9040.5110
Click below to learn more about
how CBX Software can help!
Request a Callback Request a Demo
© 1995-2020 Copyright by CBX Software. All rights reserved.You can also read