MONTHLY INVESTMENT INSIGHTS - JUNE 2018 - PSG

Page created by Randall Lyons
 
CONTINUE READING
MONTHLY INVESTMENT INSIGHTS - JUNE 2018 - PSG
MONTHLY INVESTMENT INSIGHTS
JUNE 2018
MONTHLY INVESTMENT INSIGHTS - JUNE 2018 - PSG
Contents

1. The monthly interview – Economist, Tim Harford                                       3

2. Tactical asset allocation preferences                                                7

3. Market commentary                                                                    8

4. Local unit trust solutions                                                           9

5. Offshore unit trust solutions                                                        15

6. PSG Wealth equity portfolios                                                         22

7. Other publications                                                                   27

2 | PAGE                                            PSG Wealth | Monthly Insights - June 2018
MONTHLY INVESTMENT INSIGHTS - JUNE 2018 - PSG
The monthly interview

This month we bring you some more insights from the economist, Tim Harford. At the PSG annual conference,
Harford highlighted the common pitfalls of forecasting and shared what sets super forecasters apart: self-
measurement, flexible thinking and the willingness to change your mind/opinion. We interviewed him after
the conference.

                               What, in your opinion, is the                            Irving Fisher was basically making heavily leveraged bets
                               mind shift that advisers would                           which, always makes you very vulnerable to a downturn. So,
                               need to make to get to become                            the first thing to ask yourself is does the forecast have to be
                               better forecasters?                                      right, because if the forecast has to be right, then we are
                                                                                        probably already in a difficult situation. The second thing is
                       I remember working for a big oil                                 how to make a better forecast. I referred in my presentation to
                       company many years ago and                                       research by Philip Tetlock, who has studied tens of thousands
                       being asked to make some GDP                                     of forecasters over many decades, measuring everything
                       forecast. And I remember saying                                  about the people who forecast well and the people who
Economist, Tim Harford
                       “Well I don’t really know, here is                               don’t.
                       what the international consensus
says,” and the guy said “Well, what do you mean you                                     How can advisers improve their forecasting skills?
don’t know? I need to know the forecasts!” He said it
                                                                                        It is important to note that you can get better at forecasting,
is like he was about to fire a missile and was asking me
                                                                                        you can improve yourself. An easy way to improve is to keep
to give him the coordinates, and he couldn’t make his
                                                                                        track of what you were forecasting before, be specific, keep
business plan work until I gave him the coordinates.
                                                                                        track and to go back and check. Most people don’t do this
                                                                                        and if they do it informally, they systematically mis-remember
I remember thinking to myself: OK, if I tell you I cannot
                                                                                        what they had forecast.
give you the coordinates you probably should not fire the
missile, or maybe you should be launching your business
                                                                                        For example, all these people who now think they forecast
plan in a different way that does not require the perfect
                                                                                        2008’s financial crisis and recession. There are a lot of people
coordinates to start with. So, I guess the first question to
                                                                                        who think they did. However, most of them didn’t, and
ask is, what is our strategy in whatever we are doing, and
                                                                                        most of them will struggle to point to something in writing
is our strategy dependent on the forecast being correct.
                                                                                        beforehand.
Because, if the strategy is dependent on the forecast being
                                                                                        So, keep score because you can get better at forecasting - that
correct then, it is probably not a very good strategy. There
                                                                                        is the first thing. The second thing is, think in a probabilistic
are certain things in this world that we can forecast very
                                                                                        way (involving chance variation) when you are trying to make
well, but the big picture economic geopolitical stuff is not
                                                                                        a forecast. Ask yourself a question, for example what is the
among them.
                                                                                        chance that the economy will go into recession, this year?
                                                                                        The first thing you can do is say well, how often does this
So, the first thing to say is “OK, I need to have an investment
                                                                                        economy go into recession? How often is that true generally.
portfolio, an investment strategy that is robust, if the
forecast is not very good.” I talked about the investment
                                                                                        I don’t know the statistics for South Africa, but in my own
strategy of John Maynard Keynes and Irving Fisher in my
                                                                                        country, the UK goes into recession roughly about every
presentation, and neither of their strategies were robust to
                                                                                        nine years. So, if you do nothing else, you could say well
forecast failure.
                                                                                        the chance of the UK going into recession this year is about
                                                                                        one in nine. And that is not an amazing forecast, but already
                                                                                        that’s better than many forecasts will be.
Tell us a bit more about the strategies of Keynes
and Fisher?
                                                                                        The same thing applies to political transitions. How often
John Maynard Keynes’s entire strategy was based on “I’m                                 do presidents’ get replaced? How often do incumbents
going to move between sectors, pro-cyclical or counter-                                 lose elections? How often are there coups? How often do
cyclical, depending on whether I can forecast the recessions                            presidents’ die in office, and so on. You could look at all this
or the booms.” If you can’t forecast recessions or booms (and                           sort of stuff, you can get data on all of this, if you want to
as it turns out he could not forecast recessions or booms)                              and that really helps.
then, that strategy is completely useless.

The opinions expressed in this interview are the opinions of the interviewee and not necessarily those of PSG and do not constitute advice. Although the utmost care has
been taken in the research and preparation of this document, no responsibility can be taken for actions taken on information in this interview.

3 | PAGE                                                                                                        PSG Wealth | Monthly Insights - June 2018
MONTHLY INVESTMENT INSIGHTS - JUNE 2018 - PSG
The monthly interview

What is the most important thing to remember                                            Because you are gaining something when the numbers and
when forecasting?                                                                       your instincts tell you something different, (you should know)
The most important thing, is open-mindedness. So, Tetlock is                            there is something there to explore. And I don’t think there’s
a psychologist and he measures what he calls, actively open-                            a hard and fast rule that says, ‘and you should always go with
minded thinking - a constant questioning of your previous                               the number’ or ‘you should always go with your gut.’
beliefs’ meaning. You are constantly asking yourself, what
am I missing? And you are happy to change your own mind.                                Jeff Bezos made a very interesting comment, that I do not
You see it as a sign of progress, ‘I’m getting smarter,’ rather                         completely agree with, but I thought it was interesting. He
than a sign of failure or weakness.                                                     said when the numbers and the anecdotes are telling you
                                                                                        something different, the anecdotes are usually right, and it
Actively open-minded thinkers like to get into arguments and                            is usually because the numbers aren’t measuring the right
disagreements with other people, because they think that’s a                            thing, that’s interesting.
source of insight. If I disagree with someone, then maybe he
is wrong, maybe I’m wrong. So, let’s have the argument and I                            So, I think that when (these views) clash you learn something
might get smarter. Most of us don’t think like that. (Fostering                         - you have to start asking yourself why do they clash? Is it
this quality makes) you a better forecaster, but it also makes                          because I, personally am getting a very (biased) view of the
you more robust to forecast failure. So, if you did get it wrong,                       situation, my instincts are leading me astray or I’m talking
a willingness to recognize that quickly, can overcome some of                           to the wrong people, or is it that the numbers are omitting
the facts that you got wrong.                                                           something really important? Are they fraudulent or do they
                                                                                        just not measure what matters? There is no straight forward
In your talk, you mentioned how there is this bias                                      answer, but the existence of tension, I think is informative.
towards numbers, like in the case of Fisher. Whereas
Keynes had the perspective on animal spirits and                                        If you have to give one piece of advice to our
the role of emotions in investing. How (do) we                                          advisers on how they guide clients into better
incorporate that into our thinking?                                                     decision making, what would you say?
Some people love emotions. They love gut feeling and they                               I think (when) talking to the client, you always have to have
hate numbers. So, I have been thinking about this recently.                             a conversation about the alternative scenarios. Where we
I sometimes call it statistics fast and slow, after Daniel                              are making decisions together, we all have to ask ourselves,
Kahneman’s book, Thinking fast and slow. Here thinking                                  ‘what if I am wrong? When you are (wrong), having
slow is rational, cognitively taxing, really thinking through                           that conversation with a client. I would have the honest
the statistical or the logical structure of a situation. Whereas                        conversation.
thinking fast is just, certain things are automatic, certain
processes are intuitive, not necessarily right, but intuitive and                       I think that is hard to do, because it suggests a certain
easy.                                                                                   pliability - that actually my own dealings with professionals,
                                                                                        the ones that explore different possibilities and raise the
I think statistics fast and statistics slow, (is) clashed between                       prospects, they might be wrong. I find that, to actually have a
this kind of logical, numerical view of the world and your                              conversation about that, personally, is very appealing. “What
anecdotal impressions or your gut feel. That is a healthy                               if I’m wrong?” So ensure you explore various scenarios that
thing and that is a source of further reflection and open-                              might impact your client’s wealth and share it with them.
mindedness.

The opinions expressed in this interview are the opinions of the interviewee and not necessarily those of PSG and do not constitute advice. Although the utmost care has
been taken in the research and preparation of this document, no responsibility can be taken for actions taken on information in this interview.

4 | PAGE                                                                                                        PSG Wealth | Monthly Insights - June 2018
MONTHLY INVESTMENT INSIGHTS - JUNE 2018 - PSG
Tactical asset allocation preferences

                                                                 EMERGING                                                                                EQUITY                                                   DEVELOPED
                                                                 South Africa                                                ITY                                                                                             Global
                                                                                                                         U                                                               PRO
                                                                                                                    EQ                                                                       PER
                                                                                                                                                    Cyclical    Defensive                          TY
                                                                                                                                        sive                                   Retail
                                                                                                                                   Defen
Challenging economic conditions persists,
                                                                                                                          al
but valuations do not seem to price in all                                                                            clic
                                                                                                                    Cy
the risks. Liquidity in the event of a market                                                                   l                                                                                  Re                                                                        Global growth sets a healthy backdrop,
                                                                                                             tia                                                                                     sid
shock remains a concern.                                                                                    n                                                                                           en                                                                   but valuations seem to be pricing in a lot

                                                                                           TY
                                                                                                     s  ide                                                                                                tia
                                                                                                   Re                                                                                                                                                                        of good news.

                                                                                           ER
                                                                                                                                                                                                              l

                                                                                      OP

                                                                                                                                                                                                                  Go

                                                                                                                                                                                                                                 BO
                                                                                PR

                                                                                                                                                                                                                  ve
                                                                                                                                                                                                                   rn

                                                                                                                                                                                                                                      ND
Disruptive technologies are causing

                                                                                                                                                                                                                       m
                                                                                                                                                                                                                        en

                                                                                                                                                                                                                                       S
headwinds in the retail property space.

                                                                                                                                                                                                                        t
                                                                                                                                                                                                                                                                             Particularly in the US, stronger growth
Here we are very selective in our approach                                                                                                                                                                                                                                   favours credit over government bonds,

                                                                                                                                                                                                                             Cre
                                                                                            l
                                                                                           tai
and cautious with our allocations.

                                                                                                                                                                                                                                dit
                                                                                           Re
                                                                                                                                                                                                                                                                             although there exists a caveat for high
                                                                                                                                                                                                                                                                             quality, investment grade exposure, and
                                                                                                                                                                                                                                                                             very selective buying.
                                                                                      it

                                                                                                                                                                                                                                      USD
Our current view on government bonds is                                        Cred
                                                                 BONDS

neutral, while we assess pockets of risk and

                                                                                                                                                                                                                                                  CURRENCY
opportunity. If the rand strengthens beyond
                                                                             t
                                                                          Governmen

our base view we expect bonds are likely to

                                                                                                                                                                                                                                        GBP
rally and yields could decline. To us it seems                                                                                                                                                                                                                               The USD seems too strong, while
as if the bond market is already pricing in                                                                                                                                                                                                                                  the GBP and EUR seems too weak in
MPC rate cuts expected on the horizon.                                                                                                                                                                                                                                       relation to the USD.
                                                                 CASH

                                                                           ZAR

                                                                                                                                                                                                                                            EUR
                                                                                                                                                  Strategic asset allocation

                                                                                                                                                  Tactical asset allocation
The market is expecting that the MPC will                                                                                                         Changes this month
cut rates, but we feel the MPC will lean
towards a cautious approach.
                                                                             Overweight:                                                       Neutral:                                             Underweight:
                                                                             Tactical recommendation to                                        Tactical recommendation to                           Tactical recommendation to
                                                                             hold more of the asset class                                      hold the asset class in line                         hold less of the asset class
                                                                             than specified in the                                             with its weight in the                               than specified in the
                                                                             strategic asset allocation                                        strategic asset allocation                           strategic asset allocation

Bottom line
•   Our assessment shows that domestic equity is now               •     Domestic listed property is undervalued by 2.50%                                          •     Similarly, domestic bonds are, in general, also overvalued                          •   Global equity is slightly overvalued by 17.50% on a
    roughly 22.70% overvalued relative to its historic                   relative to its historic earnings yield. In addition, we                                        by more than 23.60% and will struggle if domestic                                       historic earnings basis, although the shift towards
    yield. Some pockets of the market are expensive and                  remain of the opinion that the interest rate cycle will                                         interest rates normalize. There are always exceptions,                                  fiscal stimulus could support the asset class. In the US,
    investors should expect continued volatility at current              impact the strength and sentiment of the domestic                                               but generally speaking bond yields seem stretched.                                      further aims at deregulation will support corporate
    levels. Skilled stock pickers should be able to find value           economy, and the affordability of the property sector                                                                                                                                   earnings, although the timing of fiscal support policies
    in selected shares                                                   specifically. This will present headwinds for capital                                     •     Domestic cash is most likely generating a negative real                                 and potential deregulation is uncertain at this stage.
                                                                         growth in the property sector. We expect property                                               return for investors, after fees and taxes. We remain of
                                                                         yields, which are calculated as a percentage of capital,                                        the view that although cash can play a strategic role in
                                                                         to normalize on the back of downward pressure on                                                a portfolio, there is a material trade-off over the long
                                                                         capital values.                                                                                 term.

5 | PAGE                                                                                                                                                                                                                                                                       PSG Wealth | Monthly Insights - June 2018
MONTHLY INVESTMENT INSIGHTS - JUNE 2018 - PSG
Market commentary
In their monthly market review, Schroders notes that global equities gained overall in May, although regional
performance was mixed. Economic data remained broadly supportive, but politics in Europe and trade worries
weighed on some riskier assets. US equities advanced with economic data resilient enough to allow investors
to shrug off trade sanction uncertainties. Eurozone equities saw negative returns as political uncertainty in Italy
dominated market moves. Financials, especially banks, saw sharp declines. Emerging markets equities lost value,
with US dollar strength a headwind. Government bond yields fell (i.e. prices rose), reflecting increased risk aversion
over the month.

JSE All Share Index - February 2018
                                          59 500

                                          59 000
                                                                                                                                                                                                                   -3.57%
                                          58 500

                                          58 000

                                          57 500

                                          57 000

                                          56 500
Daily JSE All share index closing value

                                          56 000

                                          55 500

                                          55 000

                                          54 500

                                          54 000
                                                                      2.01%                                 1.26%                                            1.86%                                                1.00%
                                          53 500

                                          53 000       The JSE slipped in broad-             The JSE closed firmer on a        The JSE slipped in broad-based                                The JSE closed firmer in its
                                                       based losses, with rand-              sterling performance from         losses, as a series of events prompted                        best one-day performance
                                          52 500       sensitive  stocks   faring            Naspers, while platinum           investors to shy away from risk                               in two weeks, with all the
                                          52 000       worst, as a 4.45% drop                and gold stocks dropped on        assets. The rand was weaker despite                           major indices recording
                                                       by Naspers put the most               weaker metal prices and a         the release of upbeat inflation data                          gains.
                                          51 500
                                                       pressure on the local                 stronger rand.                    earlier, putting pressure on banks,
                                          51 000       bourse.                                                                 financials and retail stocks. The
                                                                                                                               resurfacing of fears over global trade
                                          50 500
                                                                                                                               also put pressure on commodity
                                          50 000                                                                               prices, ensuring local miners were
                                          49 500                                                                               lower on the day.

                                          49 000

                                            April 30         May 04                 May 08             May 12             May 16                    May 20                       May 24                   May 28

Source: Bloomberg

Domestic key moves
         The benchmark repo rate was left unchanged at                                                                                     The US unemployment rate fell to 3.80% in May
       6.50%                                                                                                                3.80% 2018 from 3.90% in the previous month, and
         6.50% by the South African Reserve Bank
(SARB) on 24 May 2018 after trimming it by 25 bps in the                                                                    below market expectations of 3.90%. It was the lowest
previous meeting and matching market expectations.                                                                          rate since April 2000, as the number of unemployed
                                                                                                                            decreased by 281 000 to 6.07 million and employment
         South Africa’s jobless rate stayed steady at                                                                       rose by 293 000 to 155.47 million.
26.70%
         26.70% in the first quarter of the year. The
number of unemployed remained unchanged from the                                                                            Unemployment rate in the US
previous period. The number of unemployed increased                                                                                                                                                                              4.6
by 100 000 to 5.98 million and the number of employed
rose by 207 0000 to 16.38 million.                                                                                                                  4.4
                                                                                                                                                                                                                                 4.4
                                                                                                                                   4.3     4.3

                                                                                                                                                          4.2

Global key moves
                                                                                                                                                                                                                                 4.2
                                                                                                                                                                  4.1      4.1     4.1     4.1      4.1   4.1

                                                                                                                                                                                                                                 4

US
                                                                                                                                                                                                                  3.9

                                                                                                                                                                                                                           3.8
                                                                                                                                                                                                                                 3.8

0.60%
       Personal spending in the US increased 0.60% in
       April 2018 after an upwardly revised 0.50% gain                                                                                   Jul 2017               Oct 2017                 Jan 2018               Apr 2018
                                                                                                                                                                                                                                 3.6

in March and beating market expectations of a smaller
0.40% gain. It is the biggest increase in personal spending                                                                 Source: Trading Economics
in five months, mainly boosted by a rebound in
consumption of nondurable goods.

6 | PAGE                                                                                                                                                   PSG Wealth | Monthly Insights - June 2018
MONTHLY INVESTMENT INSIGHTS - JUNE 2018 - PSG
Market commentary

EU                                                         Japan

1.90%
       The annual inflation rate in the Eurozone is                 Japan’s trade surplus widened 30.90% to JPY
       expected to rise to 1.90% in May 2018 from          30.90%
                                                                    626 billion in April 2018 from JPY 478 billion
1.20%. It is the highest rate since April 2017, mainly     in the same month a year earlier and beating market
boosted by rising oil prices.                              expectations of a JPY 405.6 billion surplus.

         The unemployment rate in the Eurozone                    The unemployment rate stood at 2.50% in April
3.80% decreased slightly to 8.50% in April 2018,           2.50%
                                                                  2018, the same as in the prrvious two months
following an upwardly revised 8.60% in March. Markets      and matching market estimates. The jobs-to-applicants
expected a number of 8.40%. It remains the lowest          ratio was also unchanged from the previous month at
jobless rate since December 2008, well below 9.20% a       1.59%, while markets expected 1.60%.
year earlier.
                                                           The unemployment rate in Japan
China                                                                                                                                                      3.2
                                                               3.1

12.90%
         Chinese exports grew by 12.90% to $200.49                                                                                                         3

         billion, recovering from a 2.70% decline in the             2.8     2.8      2.8   2.8     2.8
preceding month, but above forecasts of a 6.30% gain.                                                        2.7   2.7
                                                                                                                                                           2.8

Outbound shipments of unwrought aluminium and
                                                                                                                                                           2.6
aluminium products, including alloy and semi-finished                                                                               2.5   2.5     2.5

aluminium products, came in at 451 000 tonnes in April.                                                                    2.4
                                                                                                                                                           2.4

         Interest rates in China fell to 1.80% in April                                                                                                    2.2
1.80% 2018, from 2.01% in the previous month,                              Jul 2017               Oct 2017               Jan 2018               Apr 2018

missing market consensus of 1.90%. It was the lowest       Source: Trading Economics
rate since January, mainly due to a sharp slowdown in
food inflation.

7 | PAGE                                                                               PSG Wealth | Monthly Insights - June 2018
MONTHLY INVESTMENT INSIGHTS - JUNE 2018 - PSG
PSG Wealth Fund of Funds Solutions

Local funds
Performance table

 Fund                                                            6 Month           1 Year                2 Year           3 Year              4 Year               5 Year
 PSG Wealth Enhanced Interest D                                  3.91%             8.02%                 8.13%            7.87%               7.44%                7.11%
 PSG Wealth Income FoF D                                         4.18%             7.88%                 8.36%            8.28%               8.17%                7.70%
 PSG Wealth Preserver FoF D                                      0.68%             5.54%                 4.84%            6.29%               7.41%                7.76%
 PSG Wealth Moderate FoF D                                       -1.96%            4.76%                 3.73%            5.22%               6.94%                8.57%
 PSG Wealth Creator FoF D                                        -4.82%            4.99%                 4.43%            3.27%               5.13%                8.71%

Source: PSG Wealth research team

Local fund performance
10.00%

8.00%

6.00%

4.00%

2.00%

0.00%

-2.00%
                     6 Month                            1 Year                           2 Year                           3 Year                          5 Year
-4.00%

-6.00%

-8.00%

          PSG Wealth Enhanced Interest D   PSG Wealth Income FoF D          PSG Wealth Preserver FoF D            PSG Wealth Moderate FoF D       PSG Wealth Creator FoF D

Source: PSG Wealth research team data as at 31 May 2018                                                                   *Dots represent the relevant benchmark

Disclaimer: All performance is reported in ZAR unless specified otherwise

8 | PAGE                                                                                                             PSG Wealth | Monthly Insights - June 2018
MONTHLY INVESTMENT INSIGHTS - JUNE 2018 - PSG
PSG Wealth Domestic Solutions

PSG Wealth Local Fund of Funds bubble chart

Source: PSG Wealth research team

HOW TO READ THE BUBBLE CHARTS
                                                                                                  shows TER which is an indication of cost. The
Vertical axis       shows the return of each fund                           Size of the bubble    TERs for the fund benchmarks are assumed to
                                                                                                  be 1.14% including VAT.
Horizontal axis shows the downside deviation which is a measure of          Grey bubbles          indicate relevant fund benchmarks
                downside risk that focuses on returns that fall below a
                minimum threshold or minimum acceptable return (MAR)        Gold bubbles          represent PSG Wealth EB solutions

Disclaimer: All performance is reported in ZAR unless specified otherwise

9 | PAGE                                                                                         PSG Wealth | Monthly Insights - June 2018
MONTHLY INVESTMENT INSIGHTS - JUNE 2018 - PSG
PSG Wealth Domestic Solutions

PSG Wealth Enhanced Interest Fund                                    PSG Wealth Income FoF

•    The PSG Wealth Enhanced Interest Fund delivered                 •    This fund delivered a return of 0.29% for May 2018,
     a return of 0.69% for May 2018, compared to the                      compared to the 0.64% of its benchmark, the Stefi
     0.60% of its benchmark, the South Africa IB Money                    12 Months NCD.
     Market Sector Average.                                          •    The PSG Wealth Income FoF has an investment
•    This fund has an investment horizon of one year,                     horizon of two years, and it has outperformed its
     and the fund has outperformed its benchmark                          benchmark comfortably with 8.36% against 8.20%
     comfortably with 8.02% against 7.56% over the                        over the two-year period, and is ranked 25th out of
     one-year period.                                                     65 funds over this period.
•    The fund has also outperformed its benchmark over               •    This fund also delivered first or second quartile
     all measurement periods of one month and longer.                     performances for all measurement periods over six
                                                                          months.
Asset allocation
                                                                     Asset allocation

                                                                                                       Domestic bonds, 43.07
                                                                                                       Domestic cash and money market, 41.6
                                                                                                       Domestic property, 4.67
                               Domestic cash and money market, 100                                     Foreign other, 2.54
                                                                                                       Foreign bonds, 1.99
                                                                                                       Domestic equity, 1.78
                                                                                                       Domestic other, 1.34
                                                                                                       Foreign property, 1.11
                                                                                                       Foreign equity, 1.05
                                                                                                       Foreign cash and money market, 0.84
Source: PSG Wealth research team
                                                                     Source: PSG Wealth research team
    Risk and expectations: We are confident the fund
    will continue to deliver returns in access of money
    market rates to reduce the negative effects of high
    inflation on cash.                                                   Risk and expectations: We expected that higher
    Radar: No funds on the radar screen.                                 inflation and rising interest rates could be a drag
    Changes: There are no changes to the underlying                      on performance over the short-term, but current
    funds.                                                               indications are that the underlying portfolio managers
                                                                         are able to take advantage of the higher yields on
                                                                         short-term instruments to deliver attractive returns
                                                                         close to the top of the inflation cycle. We are confident
                                                                         that the underlying portfolio managers will continue
                                                                         to deliver attractive above average returns until well
                                                                         after the interest rate cycle has peaked.
                                                                         Radar: No funds on the radar screen.
                                                                         Changes: No changes to underlying funds.

10 | PAGE                                                                               PSG Wealth | Monthly Insights - June 2018
PSG Wealth Domestic Solutions

PSG Wealth Preserver FoF                                                PSG Wealth Moderate FoF

•    The PSG Wealth Preserver FoF delivered a negative                  •    The PSG Wealth Moderate FoF delivered a negative
     return of 0.68% for May 2018, compared to the                           return of 1.75% for May 2018, compared to the
     1.00% of its performance target of CPI plus three                       negative return of 1.97% of its benchmark, the
     percent.                                                                South African MA High Equity Sector Average.
•    This FoF has an investment horizon of three years,                 •    This FoF has an investment horizon of five years, and
     and it has underperformed CPI plus three percent                        has outperformed its benchmark comfortably with
     with 6.29% against 8.53% over this period.                              8.57% against 6.82% over the five-year period. It
•    The fund also outperformed the 5.09% of the South                       is also ranked 12th out of 87 funds over this period.
     African MA Low Equity Sector Average comfortably                   •    It also delivered a second quartile performance for
     over the three-year period, and is ranked 16th out of                   1-month and 3-month periods and first quartile
     107 funds over this period.                                             performance over all other measurement periods.
•    This fund also delivered first or second quartile
     performances over all measurement periods over                     Asset allocation
     one month.

                                                                                                       Domestic equity, 40.65
Asset allocation                                                                                       Foreign equity, 22.5
                                                                                                       Domestic bonds, 16.97
                                Domestic bonds, 32.91                                                  Domestic cash and money market, 10.91
                                Domestic cash and money market, 20.69                                  Domestic property, 6.35
                                Domestic equity, 19.27                                                 Foreign property, 1.72
                                Foreign equity, 17.29                                                  Foreign cash and money market, 0.84
                                Domestic property, 5.25                                                Foreign bonds, 0.05
                                Foreign property, 2.18                                                 Domestic other, 0.01
                                Foreign cash and money market, 1.8
                                Foreign bonds, 0.44
                                Domestic other, 0.19
                                                                        Source: PSG Wealth research team
                                Foreign other, -0.02

Source: PSG Wealth research team                                            Risk and expectations: The PSG Wealth Moderate
    Risk and expectations: The PSG Wealth Preserver                         FoF may hold up to a total of 75% in domestic
    FoF can hold up to a total of 40% in domestic equities                  equities and offshore equities, and could deliver
    and offshore equities, and may deliver negative                         negative short-term performances in sharp equity
    short-term performances in sharp equity corrections                     corrections or equity bear markets. We are, however,
    or equity bear markets. We are, however, confident                      confident that the fund will always deliver positive
    that the fund will always deliver positive returns                      returns over the preferred investment period of
    over the preferred investment period of three years                     five years and longer, and that it will continue to
    and longer, and that it will protect the capital of                     deliver above average long-term returns with below
    clients during severe negative market corrections.                      average risk overall market cycles.
    Radar: The Sim Inflation Plus Fund, The Investec                        Radar: The Sim Balanced Fund has been added to
    Cautious Managed Fund, The Coronation Balanced                          the radar screen.
    Defensive Fund and The Prudential Inflation Plus                        Changes: No changes to underlying funds.
    Funds have been added to the radar screen.
    Changes: No changes to underlying funds.

11 | PAGE                                                                                 PSG Wealth | Monthly Insights - June 2018
PSG Wealth Domestic Solutions

PSG Wealth Creator FoF

•   The PSG Wealth Creator FoF delivered a negative
    return of 2.70% for May 2018, compared to the                    Risk and expectations: Although the outlook for
    negative return of 3.72% of its benchmark, the                   equities are still uncertain, we are confident that the
    South African EQ General Sector Average +                        relative performance of the underlying managers in
•   The FoF has an investment horizon of five years and              the fund will continue to improve in the near future.
    longer, and has outperformed its benchmark with                  The managers are all active managers that have
    8.71% against the 6.65% over the five-year period.               demonstrated the ability to add alpha through careful
    It is also ranked 22nd out of 98 funds over this                 stock selection, particularly during turbulent equity
    period.                                                          markets. This fund will always maintain an equity
•   It also delivered first or second quartile performances          exposure of close to 100% in domestic and offshore
    for all measurement periods.                                     equities. It will deliver negative performances in
                                                                     sharp equity corrections or equity bear markets. We
                                                                     are, however, confident that the fund will always
Asset allocation                                                     deliver positive returns over the preferred investment
                                                                     period of five years and longer. It will continue to
                                                                     deliver above average long-term returns with below
                              Domestic equity, 79.35
                                                                     average risk overall market cycles.
                              Foreign equity, 15.78
                                                                     Radar: No funds on the radar screen.
                              Domestic property, 2.48                Changes: No changes to underlying funds.
                              Domestic cash and money market, 1.91
                              Foreign property, 0.27
                              Foreign cash and money market, 0.21

Source: PSG Wealth research team

12 | PAGE                                                                           PSG Wealth | Monthly Insights - June 2018
PSG Wealth Offshore Solutions

Offshore funds
Performance table

Reported in USD
 Fund                                                                6 Month               1 Year      2 Year                3 Year               4 Year            5 Year
 PSG Wealth Global Preserver FoF D USD                                    -0.22%               1.61%          5.05%                 3.30%            3.02%                   3.48%
 PSG Wealth Global Moderate FoF D USD                                     -0.22%               5.01%          6.61%                 1.89%            1.90%                   3.64%
 PSG Wealth Global Flexible FoF D USD                                      1.49%               7.96%        12.03%                  7.36%            6.12%                   7.49%
 PSG Wealth Global Creator FoF D                                           3.05%             11.47%         13.71%                  7.61%            7.19%                   8.69%

Reported in GBP
 Fund                                                                6 Month               1 Year      2 Year                3 Year               4 Year            5 Year
 PSG Wealth Global Preserver FoF D GBP                                     1.19%              -0.16%          8.48%                 6.74%          6.91%               6.11%
 PSG Wealth Global Flexible FoF D GBP                                      1.84%               3.26%        15.42%               10.47%            11.36%              9.67%

Source: PSG Wealth research team

Offshore funds performance
16.00%

14.00%

12.00%

10.00%

 8.00%

 6.00%

 4.00%

 2.00%

 0.00%

-2.00%

-4.00%

                   3 Month                         6 Month                        1 Year                  2 Year                         3 Year                     5 Year

           PSG Wealth Global Preserver FoF D USD             PSG Wealth Global Moderate FoF D USD      PSG Wealth Global Flexible FoF D USD         PSG Wealth Global Creator FoF D USD

Source: PSG Wealth research team data as at 31 May 2018                                                                         *Dots represent the relevant benchmark

All performance is reported in USD unless specified otherwise.

13 | PAGE                                                                                                                 PSG Wealth | Monthly Insights - June 2018
PSG Wealth Offshore Solutions

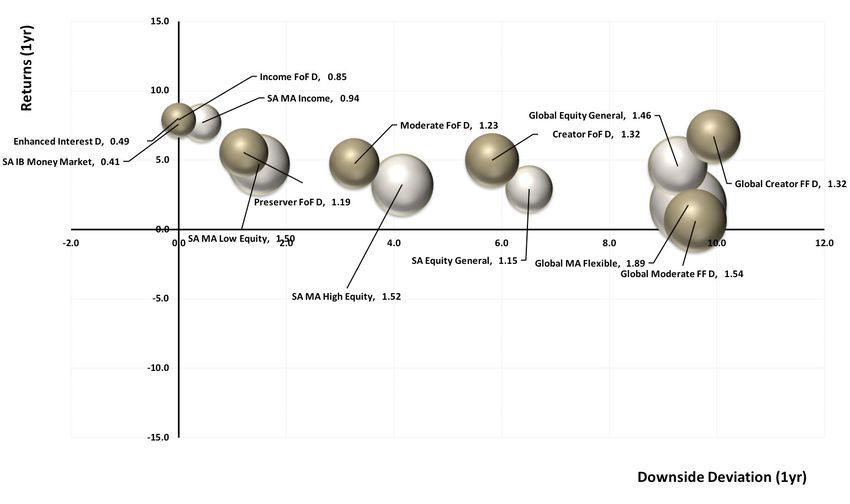
PSG Wealth Offshore Fund of Funds (USD)

Source: PSG Wealth research team

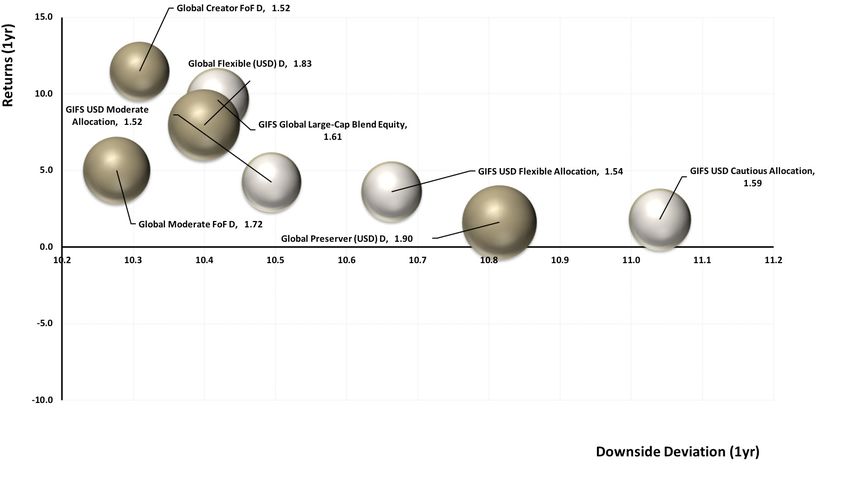
PSG Wealth Offshore Fund of Funds (GBP)

Source: PSG Wealth research team

HOW TO READ THE BUBBLE CHARTS
Vertical axis   shows the return of each fund                             Size of the bubble    shows TER which is an indication of cost
Horizontal axis shows the downside deviation which is a measure of        Grey bubbles          indicate fund peers
                downside risk that focuses on returns that fall below a
                minimum threshold or minimum acceptable return (MAR)      Gold bubbles          represent PSG Wealth solutions

14 | PAGE                                                                                      PSG Wealth | Monthly Insights - June 2018
PSG Wealth Offshore Solutions

PSG Wealth Global Preserver Fund of
Funds (USD)

•     The PSG Wealth Global Preserver FoF USD made a
      negative return of 0.07% for May, outperforming                                 The basis for this decision was the potential
      the benchmark GIFS USD Cautious allocation sector                               drawdown risk the fund brings into the FoF. Given
      average, which delivered a negative 0.25%.                                      its focus on real returns achieved through a high
•     The PSG Wealth Global Preserver FoF USD ranked in                               allocation to a concentrated portfolio of equities,
      the top quartile of its global sector over all periods                          our view is that the fund’s potential drawdowns
      longer than 12 months and is ranked fourth out of                               could be too high for the conservative role the PSG
      58 funds over the last five years. The FoF has delivered                        Wealth Global Preserver FoF plays in our global fund
      1.82% per annum above the benchmark sector                                      range. Ensuring the underlying fund’s mandate fits
      average over 5 years.                                                           our FoF mandate is a key part of our investment
                                                                                      philosophy, and given that the Veritas fund is not a
Asset allocation                                                                      good match for the Global Preserver FoFs mandate
                                                                                      we decided to disinvest from the fund.

                                               Foreign bonds, 48.59
                                               Foreign equity, 25.17
                                               Foreign cash and money market, 19.97
                                               Foreign other, 3.73
                                               Foreign property, 2.6
                                               Domestic bonds, 0.81
                                               Domestic cash and money market, -0.8

Source: PSG Wealth research team

    Risk and expectation: The portfolio has a high
    equity allocation relative to peers and could
    underperform during periods of strong equity
    market declines, conversely the portfolio will
    perform well when equity markets outperform
    other asset classes. Rising global interest rates could
    also result in capital losses on the fixed interest and
    property portions of the portfolio, however this
    impact is limited due to the FoF’s low bond duration,
    1.25. Additionally, sufficient diversification through
    its overweight allocation to equities to provide
    some protection to the portfolio in the event of any
    unexpected interest rate increases.
    Radar: No funds are on the radar screens.
    Changes: : The Veritas Global Real Return fund was
    removed from the PSG Wealth Global Preserver FoF
    during May, the proceeds were allocated equally to
    the remaining five managers in the portfolio with
    5% remaining in cash.

All performance is reported in USD unless specified otherwise.

15 | PAGE                                                                                           PSG Wealth | Monthly Insights - June 2018
PSG Wealth Offshore Solutions

PSG Wealth Global Preserver Fund of                                                    PSG Wealth Global Moderate Fund of
Funds (GBP)                                                                            Funds (USD)

•     The PSG Wealth Global Preserver FoF GBP returned                                 •    The PSG Wealth Global Moderate FoF made a
      2.38% for May in GBP, outperforming the benchmark                                     negative return 0.58% for May, underperforming
      GIFS GBP Cautious allocation sector average, which                                    the GIFS USD Moderate Allocation sector average,
      delivered 0.74%.                                                                      which delivered negative 0.22%, but on par with the
•     The PSG Wealth Global Preserver FoF GBP ranked                                        the ASISA Global MA Flexible sector which returned
      in the top quartile of its global sector over all                                     a negative 0.06%.
      measurement periods excluding the one-year period                                •    The PSG Wealth Global Moderate FoF D has
      and is ranked second from 28 funds over the last                                      consistently outperformed the ASISA Global MA
      five years. The FoF has delivered 3.15% per annum                                     sector average for 3-month and 6-month periods,
      above the benchmark sector average over five years.                                   delivering 1.25% in excess returns per annum.
                                                                                            The FoF is ranked in the second quartile of Global
Asset allocation                                                                            Moderate Allocation funds.

                                                                                       Asset allocation
                                               Foreign bonds, 46.06
                                               Foreign equity, 23.86                                                    Domestic equity, 40.65
                                               Foreign cash and money market, 24.29                                     Foreign equity, 22.5
                                               Foreign other, 3.41
                                                                                                                        Domestic bonds, 16.97
                                               Foreign property, 2.43
                                                                                                                        Domestic cash and money market, 10.91
                                               Domestic bonds, 0.8
                                                                                                                        Domestic property, 6.35
                                               Domestic cash and money market, -0.78
                                                                                                                        Foreign property, 1.72
                                                                                                                        Foreign cash and money market, 0.84
                                                                                                                        Foreign bonds, 0.05
                                                                                                                        Foreign other, 0.01
Source: PSG Wealth research team

                                                                                       Source: PSG Wealth research team

    Risk and expectation: The portfolio has a high                                         Risk: The portfolio is defensively positioned with a
    equity allocation relative to peers and could                                          developed market overweight and performance will
    underperform during periods of strong equity                                           likely be muted during periods of positive market
    market declines, conversely the portfolio will                                         sentiment when risky assets such as emerging markets
    perform well when equity markets outperform                                            outperform. The portfolio currently has 27.09% in
    other asset classes. Rising global interest rates could                                bonds which could be negatively impacted by any
    also result in capital losses on the fixed interest and                                unexpected interest rate increases. However, this risk
    property portions of the portfolio, however this                                       is mitigated to an extent by relatively large equity
    impact is limited due to the FoF’s low bond duration,                                  allocation, 60.02%
    1.25. Additionally, sufficient diversification through                                 Expectation: We expect volatility to remain high in
    its overweight allocation to equities to provide                                       the short term with fluctuating market sentiment in
    some protection to the portfolio in the event of any                                   global equity markets, the cash position provides a
    unexpected interest rate increases.                                                    buffer against market downturns. Our underlying
    Radar: The Schroder ISF Glbl MA Inc Acc GBP H has                                      managers are also able to deploy this cash when
    been added to the radar screen.                                                        they find more attractive opportunities in the
    Changes: The Veritas Global Real Return fund was                                       market. Interest rate risk is actively managed by our
    removed from the PSG Wealth Global Preserver FoF                                       underlying managers, with most positioned on the
    during May, the proceeds were allocated equally to                                     shorter end of the yield curve.
    the remaining five managers in the portfolio with                                      Radar: The MFS Meridian Global Total Ret l1 USD
    5% remaining in cash.                                                                  and the BGF Global Allocation A2 has been added to
                                                                                           the radar screen.
                                                                                           Changes: No changes made to underlying funds.
All performance is reported in USD unless specified otherwise.

16 | PAGE                                                                                                 PSG Wealth | Monthly Insights - June 2018
PSG Wealth Offshore Solutions
PSG Wealth Global Moderate Feeder Fund                                                 PSG Wealth Global Flexible Fund of
(ZAR)                                                                                  Funds (USD)

•     The PSG Wealth Global Moderate FF D delivered a                                  •    The PSG Wealth Global Flexible FoF USD delivered
      negative return of 0.47% in rand terms for May,                                       0.62% for May, outperforming the GIFS USD Flexible
      underperforming the GIFS USD Moderate allocation                                      allocation sector which returned a negative 0.11%.
      sector average which delivered a negative 1.21%.                                 •    The PSG Wealth Global Flexible FoF USD ranked in
•     The rand weakened by approximately 1.88% against                                      the top quartile of its global sector over all periods
      the US dollar over May, thus slightly increasing global                               from 3-months to since inception, and is ranked
      portfolio returns reported in ZAR.                                                    eighth out of 66 funds over the last five years.
•     The PSG Wealth Global Moderate FF D delivered                                    •    The FoF has delivered excess returns of 5.09% per
      third quartile returns for all measurement periods                                    annum above the sector average over the last five
      below three years.                                                                    years.

Asset allocation                                                                       Asset allocation

                                                Foreign bonds, 55.06
                                                Foreign bonds, 28.11
                                                                                                                        Foreign equity, 82.69
                                                Foreign cash and money market, 9.7
                                                                                                                        Foreign cash and money market, 11.92
                                                Foreign other, 4.43
                                                                                                                        Foreign bonds, 3.96
                                                Domestic cash and money market, 1.79
                                                                                                                        Foreign other, 0.78
                                                Foreign property, 0.73
                                                                                                                        Foreign property, 0.66
                                                Domestic equity, 0.1
                                                Domestic bonds, 0.08

Source: PSG Wealth research team                                                       Source: PSG Wealth research team

    Risk and expectation: We expect increased                                              Risk and expectation: The portfolio currently has
    volatility in the Rand over the short term, which                                      an equity allocation of 81.08% which is above
    could have a significant impact on ZAR returns for                                     the average in the global flexible sector, thus the
    our global funds. However, over longer periods                                         portfolio will likely underperform should there be
    (seven years +) we expect the currency effect will                                     a significant correction in global equity markets.
    be relatively flat and given the relative valuation of                                 We expect volatility to remain high in the short
    global assets, especially equities, we still believe the                               term with fluctuating market sentiment in global
    fund offers good opportunities.                                                        equity markets, however we are confident that our
                                                                                           underlying managers will adjust the positioning of
                                                                                           their portfolios as they find opportunities that offer
                                                                                           good returns relative to the risk taken.
                                                                                           Radar: No funds on the quantitative or qualitative
                                                                                           radar.
                                                                                           Changes: Disinvested from the Sarasin Global
                                                                                           Real Estate Equity fund and invested the proceed
                                                                                           in the Veritas Global Real return fund. The basis
                                                                                           for this is due to qualitative concerns due to
                                                                                           significant changes in the management team
                                                                                           of the portfolio, combined with the focus on
                                                                                           implementing split funding in the portfolio. The
                                                                                           Sarasin Global Real Estate Equity fund’s portfolio
                                                                                           manager (Guy Mountain) and the deputy portfolio
                                                                                           manager (Geoffrey Armstrong) both resigned from
                                                                                           Sarasin. The real estate fund is not suited for the
                                                                                           unconstrained multi asset flexible nature of the PSG
                                                                                           Wealth Global Flexible FoF.
All performance is reported in USD unless specified otherwise.

17 | PAGE                                                                                                 PSG Wealth | Monthly Insights - June 2018
PSG Wealth Offshore Solutions

PSG Wealth Global Flexible Fund of Funds                                              PSG Wealth Global Creator Feeder Fund
(GBP)                                                                                 (ZAR)

                                                                                      •    The PSG Wealth Global Creator FF D delivered a return
•     The PSG Wealth Global Flexible FoF GBP returned
                                                                                           of 1.79% for May in rand terms, outperforming the
      3.62% in GBP for May, outperforming the benchmark
                                                                                           global sector average which returned 1.26%, as well
      GIFS GBP Flexible allocation sector average which
                                                                                           as the ASISA Global Equity General sector, which
      delivered 0.70%.
                                                                                           returned 0.96%.
•     The PSG Wealth Global Flexible FoF GBP ranked in
                                                                                      •    The rand weakened by approximately 1.88% against
      the top quartile of its global sector overall periods
                                                                                           the US dollar over May, thus slightly increasing global
      from 12 months to since inception, and is ranked
                                                                                           portfolio returns reported in ZAR.
      fifth out of 60 funds over the last five years. The FoF
                                                                                      •    The PSG Wealth Global Creator FF D delivered top
      has delivered excess returns of 5.95% per annum
                                                                                           quartile returns since inception. Over the last four
      above the sector average over this period.
                                                                                           years the FF outperformed the ASISA Global Equity
                                                                                           General sector average by 2.78% per annum.
Asset allocation
                                                                                      Asset allocation
                                               Foreign equity, 83.06
                                               Foreign cash and money market, 10.11
                                               Foreign bonds, 3.69
                                               Foreign property, 1.1                                                     Foreign equity, 94.29
                                               Domestic cash and money market, 1.01                                      Foreign cash and money market, 3.94
                                               Foreign other, 0.73                                                       Foreign property, 1.49
                                               Domestic equity, 0.31                                                     Domestic cash and money market, 0.28

Source: PSG Wealth research team

                                                                                      Source: PSG Wealth research team
    Risk and expectation: The portfolio currently has
    an equity allocation of 83.07% which is above
    the average in the global flexible sector, thus the                                   Risk and expectation: We expect increased
    portfolio will likely underperform should there be                                    volatility in the rand over the short term, which
    a significant correction in global equity markets.                                    could have a significant impact on ZAR returns for
    We expect volatility to remain high in the short                                      our global funds. However, over longer periods
    term with fluctuating market sentiment in global                                      (seven years +) we expect the currency effect will
    equity markets, however we are confident that our                                     be relatively flat and given the relative valuation of
    underlying managers will adjust the positioning of                                    global equities we still believe the fund offers good
    their portfolios as they find opportunities that offer                                opportunities.
    good returns relative to the risk taken.
    Radar: The Schroder ISF Glbl MA Inc C Acc GBP H
    has been added to the radar screen.
    Changes: Disinvested from the Sarasin Global Real
    Estate Equity fund and invested the proceed in the
    Veritas Global Real return fund.

All performance is reported in USD unless specified otherwise.

18 | PAGE                                                                                                PSG Wealth | Monthly Insights - June 2018
PSG Wealth Offshore Solutions

PSG Wealth Global Creator Fund of Funds
(USD)

•     The PSG Wealth Global Creator FoF returned
      1.01% for May, outperforming the benchmark                                      Risk: Most of our underlying managers remain
      GIFS Global Large-Cap Blend equity sector which                                 relatively defensively positioned, with a preference
      delivered a negative 0.02% and the MSCI World                                   for high quality stocks with very strong balance
      Index which returned 0.06%.                                                     sheets, strong moats and steady earnings outlooks.
•     The PSG Wealth Global Creator FoF is ranked in                                  Given the high allocation to quality large caps, mostly
      the second quartile of global equity funds since                                in developed markets, we expect to underperform
      inception in December 2012.                                                     global markets when sentiment is very positive and
                                                                                      relatively risky assets, such as emerging market
                                                                                      equities, perform strongly (risk-on trade).
Asset allocation
                                                                                      Expectation: We are confident that our underlying
                                                                                      managers will adjust the positioning of their
                                                                                      portfolios (including exposure to emerging markets)
                                                                                      as they find opportunities that offer good returns
                                                                                      relative to the risk taken. We expect volatility to
                                                Foreign equity, 94.55                 remain high in the short term with fluctuating
                                                Foreign cash and money market, 3.95   market sentiment in global equity markets, thus
                                                Foreign property, 1.5                 we are comfortable with the overall defensive
                                                                                      positioning of our fund.
                                                                                      Radar: Nedgroup Global Equity funds were added
                                                                                      to the quantitative radar screen.

Source: PSG Wealth research team

All performance is reported in USD unless specified otherwise.

19 | PAGE                                                                                            PSG Wealth | Monthly Insights - June 2018
PSG Wealth Equity Portfolios

Performance table

 PSG Wealth Equity portfolios
 Fund                                                 1 Month     3 Months     6 Months        12 Months Since
                                                                                                         inception
 PSG Wealth SA Equity Portfolio                          -3.73%       -3.46%        0.79%         8.19%          9.01%
 PSG Wealth SA Property Portfolio                        -4.09%        2.26%       -1.60%         0.49%         -1.87%
 PSG Wealth Offshore Equity Portfolio (USD)              -1.56%       -2.98%        0.43%        12.08%        13.11%
 PSG Wealth SA Dividend Income Equity Portfolio          -7.05%       -6.24%        3.60%        13.80%          6.55%
 PSG Wealth Managed Volatility Equity Portfolio          -3.92%       -4.02%        2.27%         3.56%          2.66%
Source: PSG Wealth research team

                                           PSG Wealth SA Equity Portfolio
                                           Appropriate for investors seeking real returns
                                           in capital that exceed the local equity market
                                           returns, but who are comfortable with the capital
                             fluctuations that characterizes an investment of this type.

              PSG Wealth
              SA Managed
              Volatility Equity
                                                                                                     PSG Wealth
  Tailored for investors who
                                                                                                     Offshore Equity
  require a smoother path
                                                                                                     Portfolio
  to long-term returns by
                                                                                                     Appropriate for
  reducing downside risk while                       Overview                           investors seeking real returns
  maintaining full exposure                          of equity                          in capital that exceed the
  to the equity risk premium
  in the long run. Benefits of                       portfolios                         international benchmark
                                                                                        returns.
  this strategy should be more
  pronounced during periods of
  heightened volatility.

              PSG Wealth SA Dividend                                             PSG Wealth SA Property
              Income Equity Portfolio                                            Equity Portfolio
              Suitable to the investor that                                      For the more risk adverse investor
  requires a regular and growing stream of                                       who requires a regular income.
  income derived from dividends with the
  potential of a real growth in capital value.

20 | PAGE                                                                       PSG Wealth | Monthly Insights - June 2018
PSG Wealth Equity Portfolios

PSG Wealth SA Equity Portfolio

•    The PSG Wealth SA Equity Portfolio made a negative
                                                                                 Expectations:
     return of 3.73%, while the FTSE/JSE Capped All Share
                                                                                 • Equity market returns are slightly behind their long-
     TR made returned negative 5.68% for May.
                                                                                    term averages.
•    Thirteen (59%) of the 22 stocks in this portfolio ended
                                                                                 • With multiples ahead of their long-term averages,
     above its benchmark last month.
                                                                                    we expect returns to materialise primarily through
                                                                                    growth in earnings and not through a material
Performance since inception                                                         change in valuation multiples.
                                                                                 • We expect value to outperform growth and have
10.00%                                                                              tilted the portfolio’s exposure accordingly.
 8.00%                                                                           • Our largest underweight position is towards the
 6.00%
                                                                                    consumer stable sector primarily due to concerns
                                                                                    regarding the valuation of food and drug retailers.
 4.00%
                                                                                 • Our foreign exposure is through domestic
 2.00%                                                                              investments with international exposure rather than
 0.00%                                                                              through pure rand hedges which we feel offer less
                                                                                    value.
-2.00%
                                                                                 • Selected large rand-hedges, however, continue to
-4.00%                                                                              hold value on a relative basis.
-6.00%                                                                           • Exchange rate movements will remain a dominant
         1 Month   3 Month        6 Month           12 Month   Since Inception      driver of short-term equity market returns.
                                                                                 • Sensible policy changes by a new administration
                    PSG Wealth SA Equity Portfolio                                  could become a tailwind.
Source: PSG Wealth research team data as on 31 May 2018                          • A weaker exchange rate is likely to be a headwind
*Inception date: 30 August 2015                                                     to relative returns but given the diversification of
                                                                                    the portfolio and the quality of its investments, we
                                                                                    believe its performance should not be fundamentally
Asset allocation
                                                                                    dependent on exchange rate movements.
                                                                                 • Global investment markets are expected to remain
                                                                                    volatile given the difficulty to forecast macro
                                      Materials                                     variables.
                                      Telecommunication services                 • Our focus will remain on the underlying fundamentals
                                      Consumer discretionary                        of the individual companies rather than on broad
                                      Consumer staples                              macro-issues.
                                      Financials
                                      Healthcare                                 Risk:
                                      Industrials                                • Changes in the perception of sovereign risk (positive
                                      Cash                                          and negative) and its flow through to exchange- and
                                                                                    interest rates, can have an impact on portfolio values.
                                                                                 • Accommodative monetary policy continues to
Source: PSG Wealth research team                                                    provide support to developed economies and creates
                                                                                    artificial demand for high yielding emerging market
                                                                                    securities. Should foreign capital inflows from these
                                                                                    markets end abruptly, it will have an adverse impact
                                                                                    on market valuations.
                                                                                 • The portfolio is likely to underperform should
                                                                                    international monetary easing prove sustainable. An
                                                                                    environment of sustained monetary easing should
                                                                                    support ‘bond-proxy stocks’ to which the portfolio is
                                                                                    under exposed to due to our valuation concerns. This
                                                                                    could lead to portfolio underperformance.
                                                                                 • Overestimating         growth      and     operational
                                                                                    improvements in highly-rated and large benchmark
                                                                                    constituents.

21 | PAGE                                                                                        PSG Wealth | Monthly Insights - June 2018
PSG Wealth Equity Portfolios

PSG Wealth SA Property Portfolio

•     The PSG Wealth SA Property Equity Portfolio made a
      negative return of 4.09% during May, outperforming                                Expectations:
      the FTSE/JSE SA Listed Property Capped TR which                                   • The sluggish economic environment will continue
      returned a negative 5.30%                                                             to place pressure on the real estate sector.
•     Thirteen (72%) of the 18 stocks in the portfolio                                  • There is generally an oversupply of office space.
      performed above its benchmark.                                                        New local developments could lead to a higher
                                                                                            supply while demand is weak.
Performance since inception                                                             • Demand for vacant space will remain muted,
                                                                                            placing further pressure on rentals. Weak
3.00%                                                                                       economic growth might result in higher vacancy
                                                                                            profiles and rental reversions.
2.00%
                                                                                        • Due to the highly competitive and weak market
1.00%                                                                                       dynamics, attracting and retaining tenants has
0.00%                                                                                       become costlier with retail companies increasing
-1.00%                                                                                      incentives for tenants.
                                                                                        • Improving tenant retention rates have come at
-2.00%
                                                                                            the expense of lower escalations.
-3.00%                                                                                  • Capital market changes generally dominate
-4.00%                                                                                      short-term returns.
-5.00%
                                                                                        •
           1 Month         3 Month         6 Month         12 Month   Since Inception   Risk:
                                                                                        • Weaker-than-expected growth could erode
                            PSG Wealth SA Property Portfolio
                                                                                            dividends underpinning the current valuations.
Disclaimer: Annualised for periods greater than one year
                                                                                        • Cannibalization is a risk in the retail segment.
                                                                                        • Low global bond yields have aided valuations –
Source: PSG Wealth research team data as on 31 May 2018
                                                                                            a reversal of this trend and tighter US monetary
*Inception date: 1 December 2015
                                                                                            policy could impact valuations.
                                                                                        • Changes in sovereign risk (positive and negative)
Asset allocation                                                                            and its flow through to capital markets can
                                                                                            have a significant impact on valuations.
                                                                                        • Value-destructive acquisitions, especially in
                                                                                            offshore territories where management has less
                                                                                            experience, could impact the portfolio.
                                               Diversified REITs                         • Liquidity risk which could lead to the inability to
                                               Real estate operating companies              sell underperforming assets quickly.
                                               Retail REITs
                                               Cash

Source: PSG Wealth research team

22 | PAGE                                                                                             PSG Wealth | Monthly Insights - June 2018
PSG Wealth Equity Portfolios

PSG Wealth Offshore Equity Portfolio                        Performance since inception

•    The PSG Wealth Offshore Equity Portfolio made
                                                            14.00%
     a negative return of 1.56% (USD) in May,
                                                            12.00%
     underperforming the Dow Jones Global Titans 50 TR
     that delivered a positive return of 1.49%              10.00%

•    Four (27%) of the 15 stocks in this portfolio ended     8.00%
     above its benchmark.                                    6.00%

                                                             4.00%
                                                             2.00%
    Expectations:
                                                             0.00%
    • Investment markets are expected to remain
       volatile given the high amount of uncertainty in     -2.00%

       forecasting macro variables.                         -4.00%
                                                                        1 Month          3 Month         6 Month          12 Month    Since Inception
    • Given the diversification of the portfolio and
       the quality of its chosen investments, we believe                           PSG Wealth Offshore Equity Portfolio (USD)
       that the impact of macro variables should be
                                                            Disclaimer: Annualised for periods greater than one year
       reduced.
    • Our focus will remain on the underlying               Source: PSG Wealth research team data as at 31 May 2018
                                                            *Inception date: 30 August 2015
       fundamentals of the individual companies rather
       than on broad macro issues.
                                                            Asset allocation
    Risk:
    • Sustained international monetary easing
        creates demand for quality, stable, high yielding                                                    Telecommunication services
        equities. This provides a valuation underpin to                                                      Consumer discretionary
        investments in the portfolio. The portfolio is                                                       Consumer staples
        likely to underperform should this deteriorate.                                                      Financials
                                                                                                             Healthcare
                                                                                                             Information technology
                                                                                                             Cash

                                                            Source: PSG Wealth research team

23 | PAGE                                                                              PSG Wealth | Monthly Insights - June 2018
PSG Wealth Equity Portfolios

PSG Wealth SA Dividend Income Equity                          Performance since inception
Portfolio
                                                              15.00%
•    The PSG Wealth SA Dividend Income Equity Portfolio
     made a negative return of 7.05% during the month.
                                                              10.00%
     Underperforming the benchmark, the FTSE/JSE
     Dividend Plus TR, which made a return of negative
                                                               5.00%
     5.66% over the same period.
•    Eight (40%) of the 20 stocks in this portfolio came in
                                                               0.00%
     above the benchmark.

                                                               -5.00%

                                                              -10.00%
    Expectations:                                                          1 Month        3 Month         6 Month           12 Month   Since Inception
    • Investment markets are expected to remain
       volatile given the difficultly to forecast macro                            PSG Wealth SA Dividend Income Equity Portfolio

       variables.                                             Disclaimer: Annualised for periods greater than one year (since inception)
    • A shift from highly-valued, high-quality defensive      Source: PSG Wealth research team data as at 31 May 2018
       stocks towards more reasonable priced consumer         *Inception date: 29 April 2016
       cyclicals and financial stocks in the medium term.
                                                              Asset allocation
    Risk:
    • Changes in the perception of sovereign risk
        (positive and negative) and its flow through to                                                       Materials
        exchange rates and interest rates can have an                                                         Telecommunication services
        impact on portfolio values.                                                                           Consumer discretionary
    • The portfolio is likely to underperform should                                                          Consumer staples
                                                                                                              Energy
        international monetary easing prove sustainable.
                                                                                                              Financials
        An environment of sustained monetary easing                                                           Healthcare
        should support ‘bond-proxy stocks’ to which the                                                       Industrials
        portfolio is under exposed to due to valuation                                                        Cash
        concerns.

                                                              Source: PSG Wealth research team

24 | PAGE                                                                               PSG Wealth | Monthly Insights - June 2018
PSG Wealth Equity Portfolios

PSG Wealth SA Managed Volatility Equity                     Performance since inception
Portfolio
                                                            4.00%
•    The PSG Wealth SA Managed Volatility Equity
                                                            3.00%
     Portfolio made a negative return of 3.92% for May,
                                                            2.00%
     outperforming the benchmark, the PSG Wealth
     Custom Low Volatility Index TR, which ended the        1.00%

     month at negative 6.07%.                               0.00%
•    Twelve (57%) of the 21 stocks in this portfolio came   -1.00%
     in above the benchmark.                                -2.00%
                                                            -3.00%
                                                            -4.00%
    Expectations:
                                                            -5.00%
    • The valuation of most benchmark constituents
                                                                       1 Month         3 Month         6 Month             12 Month   Since Inception
       currently seems elevated.
    • Relative outperformance against the benchmark                            PSG Wealth SA Managed Volatility Equity Portfolio
       through not owning the most expensive pockets        Disclaimer: Returns annualised since inception
       of shares.
                                                            Source: PSG Wealth research team data as at 31 May 2018
    • Lower portfolio drawdown, while still                 *Inception date: 28 July 2016
       participating in equity market returns.
    • Low volatility investing in a defensive way to
       take risks.                                          Asset allocation
    • Portfolio outperformance relative to local equity
       markets during periods of stress.
    • Positive relative performance over the longer
                                                                                                             Materials
       term.                                                                                                 Consumer discretionary
                                                                                                             Consumer staples
    Risk:                                                                                                    Financials
    • A negative performance relative to the local                                                           Healthcare
        equity market during strong bull markets.                                                            Industrials
                                                                                                             Cash

                                                            Source: PSG Wealth research team

25 | PAGE                                                                             PSG Wealth | Monthly Insights - June 2018
Other publications

Previous publications

  Daily                                                        Weekly
                   27 June                                                  20   Jun   08 Nov    10   May      09   Nov    15   Jun
                                                                            13   Jun   18 Oct    03   May      02   Nov    08   Jun
                                                                            06   Jun   11 Oct    19   April    26   Oct    01   Jun
                                                                            23   May   04 Oct    12   April    12   Oct    25   May
                                                                            16   May   20 Sept   05   April    05   Oct    18   May
                                                                            09   May   13 Sept   22   Mar      28   Sept   11   May
                                                                            18   Apr   06 Sept   15   Mar      14   Sept   04   May
                                                                            11   Apr   23 Aug    08   Mar      07   Sept   26   Apr
                                                                            04   Apr   16 Aug    01   Mar      31   Aug    20   Apr
                                                                            22   Mar   03 Aug    15   Feb      17   Aug    12   Apr
                                                                            14   Mar   19 July   06   Feb      10   Aug
                                                                            07   Mar   12 July   18   Jan      02   Aug
                                                                            07   Feb   21 Jun    11   Jan      27   Jul
                                                                            17   Jan   14 Jun    14   Dec      13   Jul
                                                                            06   Dec   07 Jun    07   Dec      06   Jul
                                                                            22   Nov   31 May    30   Nov      29   Jun
                                                                            15   Nov   17 May    16   Nov      22   Jun

  Monthly                                                      Research and Strategy Report
                   May    2018   Jun   2017     Jul   2016                          Autumn		2018              Summer 		2017
                   Apr    2018   May   2017     Jun   2016                          Summer		2018              Spring 2016
                   Mar    2018   Apr   2017     May   2016                          Spring		2017              Winter 2016
                   Feb    2018   Mar   2017     Apr   2016                          Winter		2017              Autumn 2016
                   Jan    2018   Feb   2017     Mar   2016                          Autumn		2017              Summer 2016
                   Nov    2017   Jan   2017     Feb   2016
                   Oct    2017   Nov   2016     Dec   2015
                   Sep    2017   Oct   2016     Nov   2015
                   Aug    2017   Sep   2016     Oct   2015
                   July   2017   Aug   2016

  Special report                                               Wealth Perspective
                   New offshore brochure                                    Mar    2018
                   Volatility is uncomfortable, but expected                Dec    2017
                   Stocks that could outperform in stronger                 Sept   2017
                   economy                                                  Jun    2017
                   New ANC leader, too close to call                        Mar    2017
                   Our exposure to Steinhoff                                Dec    2016
                   Local currency downgraded to junk                        Sep    2016
                   Blockchains and Bitcoins                                 Jul    2016
                   UK snap election                                         Apr    2016
                   Berkshire 2017 AGM                                       Jan    2016
                   Distributions explained                                  Oct    2015
                   S&P junk status
                   Research provided
                   Fed hike inevitable?
                   S&P 2 Dec review
                   US election
                   Market PE’s
                   Local government elections
                   Brexit vote

26 | PAGE                                                                        PSG Wealth | Monthly Insights - June 2018
Disclaimer

PSG Wealth is a brand underneath PSG Konsult Ltd, which consists of the following legal entities: PSG Multi-Management (Pty) Ltd, PSG Securities Ltd, PSG Fixed Income and Commodities
(Pty) Ltd, PSG Scriptfin (Pty) Ltd, PSG Invest (Pty) Ltd, PSG Life Ltd, PSG Employee Benefits Ltd, PSG Trust (Pty) Ltd, and PSG Wealth Financial Planning (Pty) Ltd.

Affiliates of the PSG Konsult Group are authorised financial services providers. The opinions expressed in this document are the opinions of the writer and not necessarily those of PSG Konsult Group.
The information is provided as general information. It does not constitute financial, tax, legal or investment advice and the PSG Konsult Group of Companies does not guarantee its suitability or potential
value. Although the utmost care has been taken in the research and preparation of this document, no responsibility can be taken for actions taken on information in this document. Should you require
further information, and since individual needs and risk profiles differ, we suggest you consult a qualified financial adviser, if needed.

Collective Investment Schemes in Securities (CIS) are generally medium- to long-term investments. The value of participatory interests (units) may go down as well as up and past performance is not a
guide to future performance. CIS are traded at ruling prices and can engage in borrowing and scrip lending. A fund of funds is a portfolio that invests in portfolios of collective investment schemes, which
levy their own charges, which could result in a higher fee structure for these portfolios. Fluctuations or movements in the exchange rates may cause the value of underlying international investments
to go up or down. A schedule of fees and charges and maximum commissions is available on request from PSG Collective Investments Limited. Commission and incentives may be paid and if so, are
included in the overall costs. Forward pricing is used.

The portfolios may be capped at any time in order for them to be managed in accordance with their mandate. Different classes of participatory interest can apply to these portfolios and are subject to
different fees and charges. Figures quoted are from I-Net, Stats SA, SARB, © 2015 Morningstar, Inc. All Rights Reserved for a lump sum using NAV-NAV prices net of fees, includes income and assumes
reinvestment of income. PSG Collective Investments Limited is a member of the Association for Savings and Investment South Africa (ASISA) through its holdings company PSG Konsult Limited.

Conflict of Interest Disclosure: The fund may from time to time invest in a portfolio managed by a related party. PSG Collective Investments Limited or the Fund Manager may negotiate a discount on
the fees charged by the underlying portfolio. All discounts negotiated are reinvested in the fund for the benefit of the investor. Neither PSG Collective Investments Limited nor the Fund Manager retain
any portion of such discount for their own accounts. PSG Multi-Management (Pty) Ltd (FSP No. 44306), PSG Asset Management (Pty) Ltd (FSP No. 29524) and PSG Collective Investments Limited are
subsidiaries of PSG Group Limited. The Fund Manager may use the brokerage services of a related party, PSG Securities Ltd.
You can also read