Debt Investor Presentation - March 2018 - Ares Capital ...
←
→
Page content transcription
If your browser does not render page correctly, please read the page content below
Contact:
       Debt Investor Presentation                                John Stilmar, Investor Relations
                                                                 jstilmar@aresmgmt.com
       March 2018                                                (678) 539 - 1983

Ares Capital Corporation - Not for Publication or Distribution
Disclaimer
IMPORTANT NOTICE:
Statements included herein may constitute “forward-looking statements,” which may relate to future events or the future performance or financial condition of Ares Capital Corporation
(“ARCC”), its investment adviser Ares Capital Management LLC (“ACM”), a subsidiary of Ares Management, L.P. (“Ares Management”), or of Ares Management. These statements are not
guarantees of future results or financial condition and involve a number of risks and uncertainties. Actual results and cond itions may differ materially from those in the forward-looking
statements as a result of a number of factors, including those described from time to time in the filings of ARCC and Ares Ma nagement with the Securities and Exchange Commission (“SEC”).
The information contained in this presentation is summary information that is intended to be considered in the context of the SEC filings of ARCC and Ares Management and other public
announcements that ARCC or Ares Management may make, by press release or otherwise, from time to time. Neither ARCC nor Ares Management undertakes any duty or obligation to publicly
update or revise the forward-looking statements or other information contained in this presentation. These materials contain information about ARCC, ACM and Ares Management, and certain
of their respective personnel and affiliates, information about their respective historical performance and general information about the market. You should not view information related to the
past performance of ARCC, ACM or Ares Management or information about the market, as indicative of future results, the achiev ement of which cannot be assured.
Nothing in these materials should be construed as a recommendation to invest in any securities that may be issued by ARCC or Ares Management or as legal, accounting or tax advice. None of
ARCC, ACM, Ares Management or any affiliate of ARCC, ACM or Ares Management makes any representation or warranty, express or implied, as to the accuracy or completeness of the
information contained herein and nothing contained herein shall be relied upon as a promise or representation whether as to the past or future performance. Certain information set forth
herein includes estimates and projections and involves significant elements of subjective judgment and analysis. Further, su ch information, unless otherwise stated, is before giving effect to
management and incentive fees and deductions for taxes. No representations are made as to the accuracy of such estimates or projections or that all assumptions relating to such estimates or
projections have been considered or stated or that such estimates or projections will be realized.
These materials may contain confidential and proprietary information, and their distribution or the divulgence of any of thei r contents to any person, other than the person to whom they were
originally delivered and such person’s advisers, without the prior consent of ARCC, ACM or Ares Management, as applicable, is prohibited. You are advised that United States securities laws
restrict any person who has material, non-public information about a company from purchasing or selling securities of such company (and options, warrants and rights relating thereto) and
from communicating such information to any other person under circumstances in which it is reasonably foreseeable that such p erson is likely to purchase or sell such securities. You agree not
to purchase or sell such securities in violation of any such laws.
These materials are not intended as an offer to sell, or the solicitation of an offer to purchase, any security, the offer an d/or sale of which can only be made by definitive offering
documentation. Any offer or solicitation with respect to any securities that may be issued by ARCC, Ares Management or any of their affiliates will be made only by means of definitive offering
memoranda or prospectus, which will be provided to prospective investors and will contain material information that is not se t forth herein, including risk factors relating to any such
investment.
S&P Disclaimer Notice
This may contain information obtained from third parties, including ratings from credit ratings agencies such as Standard & Poor’s. Reproduction and distribution of third party content in any
form is prohibited except with the prior written permission of the related third party. Third party content providers do not guarantee the accuracy, completeness, timeliness or availability of
any information, including ratings, and are not responsible for any errors or omissions (negligent or otherwise), regardless of the cause, or for the results obtained from the use of such content.
THIRD PARTY CONTENT PROVIDERS GIVE NO EXPRESS OR IMPLIED WARRANTIES, INCLUDING, BUT NOT LIMITED TO, ANY WARRANTIES OF MERCHANTABILITY OR FITNESS FOR A PARTICULAR
PURPOSE OR USE. THIRD PARTY CONTENT PROVIDERS SHALL NOT BE LIABLE FOR ANY DIRECT, INDIRECT, INCIDENTAL, EXEMPLARY, COMPENSATO RY, PUNITIVE, SPECIAL OR CONSEQUENTIAL
DAMAGES, COSTS, EXPENSES, LEGAL FEES, OR LOSSES (INCLUDING LOST INCOME OR PROFITS AND OPPORTUNITY COSTS OR LOSSES CAUSED BY NEGLIGENCE) IN CONNECTION WITH ANY USE OF
THEIR CONTENT, INCLUDING RATINGS. Credit ratings are statements of opinions and are not statements of fact or recommendations to purchase, hold or sell securities. They do not address the
suitability of securities or the suitability of securities for investment purposes, and should not be relied on as investment advice.
REF: DLUS-00067
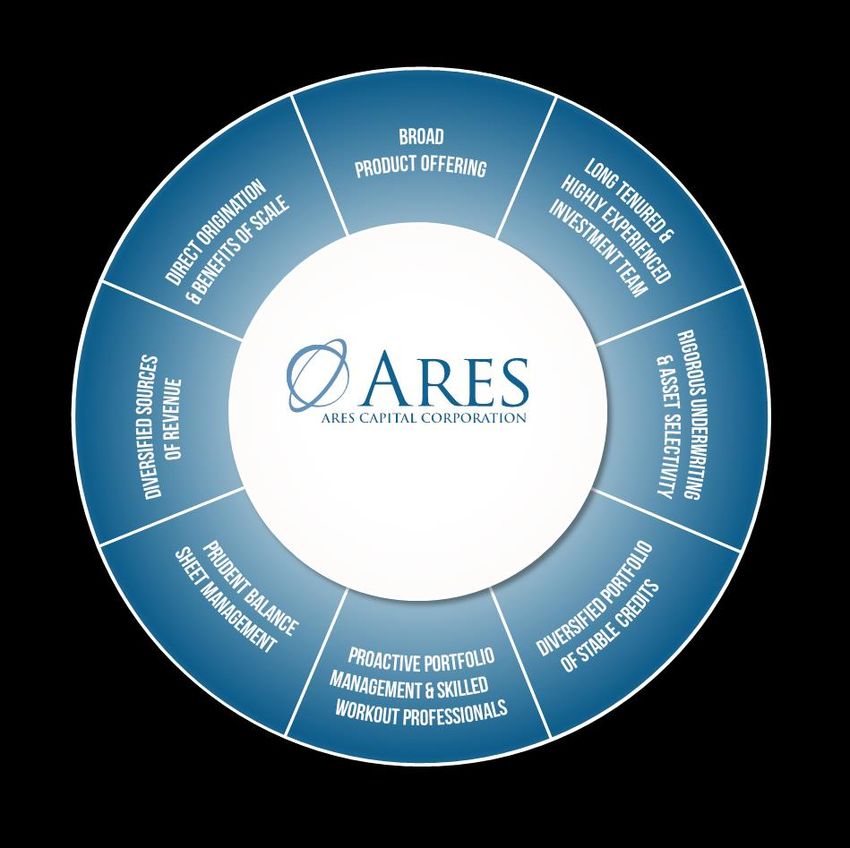
Ares Capital Corporation - Not for Publication or Distribution 2Market Leading Lender to the Middle Market
Ares Capital is a leading specialty finance company that is focused on providing debt and equity financing solutions to
U.S. middle market companies
Well Positioned with
Attractive Industry & Significant Competitive Active, BBB Rated Index
Strong Investment
Corporate Structure Advantages Eligible Issuer
Performance
• Middle market has exhibited • Largest BDC with significant • Highly diversified portfolio • BBB Rating with stable
strong growth, creating direct origination platform outlook by S&P and Fitch (2)
demand for financing • Strong long term credit
• Consistent and experienced • Completed 16 debt capital
performance
• Bank consolidation and team markets transactions / $5.7
regulations have created the • Strong asset coverage as billion of financings (3)
non-bank lending opportunity • Disciplined underwriting
process supports highly well as low leverage ratio • Lowered spreads on all
• The BDC structure has selective approach • Deep sources of liquidity issuances for similar tenor
compelling advantages from the portfolio and and structure since inception
• Incumbency with existing
• All industry BDC debt that has borrowers provides attractive alternative financing options • Demonstrated access to
matured has been repaid at future investing opportunities liquidity - 34 debt and equity
par (1) transactions/~$10 billion
• Deep asset management
since inception (3)
capabilities seeks to enhance
investment performance
Past performance is not a guarantee of future results.
1) Information based on Ares’ knowledge.
2) Fitch rating established in November 2009. S&P rating established in July 2007. All of ARCC’s unsecured and convertible notes are rated by S&P and Fitch with the
exception of our 2047 retail notes, which are rated by Moody’s. Our 2047 retail notes were assumed as part of the Allied Capital Acquisition on April 1, 2010.
Moody’s rated these notes Ba1 with a positive outlook as of June 21, 2017.
3) Since inception in October of 2004 through February 1, 2018.
Ares Capital Corporation - Not for Publication or Distribution 3Industry Drivers & BDC Structure Ares Capital Corporation - Not for Publication or Distribution
ARCC Serves Strong and Vibrant Middle Market Companies
                                                                          Defining the U.S. Middle Market
                                                 Nearly
     Annual Revenue                                                               3rd Largest                         Nearly 33%                      1/3
     $10M–$1B                                200,000                             Global Economy                   of Private Sector GDP          of All U.S. Jobs
                                              Businesses

                $
                                                                           Strong Industry Fundamentals
                                                                                                           7%
    10%
     8%                                                                                                    6%
     6%                                                                                                    5%
     4%                                                                                                    4%
     2%
                                                                                                           3%
     0%
    -2%                                                                                                    2%
    -4%                                                                                                    1%
    -6%                                                                                                    0%
                2012          2013          2014          2015          2016           2017                     2012    2013      2014      2015        2016        2017
                                                                                                                               Growth in Workforce Size
                             Middle Market Indicator                  S&P 500

              Middle Market Revenue Growth vs. S&P 500                                                            Middle Market Hiring Remains Strong

For illustrative purposes only. Source: National Center for the Middle Market as of December 31, 2017.
Ares Capital Corporation - Not for Publication or Distribution                                         5
Supply Constraints Create an Attractive Market Opportunity
We believe supply constraints in the middle market have resulted in attractive risk adjusted returns
for direct lenders
Banks' Share of the U.S. Leveraged Loan Market
Total Number of U.S. Banks Continues to Decline (1)
Continues to Shrink (2)
11,000 100%
90%
10,000 29%
80%
70% 55%
9,000
60% 82%
88% 91%
8,000 50%
40%
7,000 71%
30%
20% 45%
6,000
10% 18%
12% 9%
5,000 0%
2005
2006
2007
2008
2009
1998
1999
2000
2001
2002
2003
2004
2010
2011
2012
2013
2014
2015
2016
2017
1994 2000 2006 2012 2017
Foreign/Domestic Banks Non-Bank Companies/Funds
(1) Source: Federal Deposit Insurance Corp Quarterly Banking Profile Q4-17.
(2) Source: S&P LCD Leveraged Lending Review Q4-17. Amounts are based on administrative, syndication and documentation agent as well as arranger roles.
Ares Capital Corporation - Not for Publication or Distribution 6BDC Structure Offers Benefits to Creditors
We believe creditors benefit from the leverage restrictions and diversification requirements of the
BDC/RIC structure
BDCs are closed-end investment companies The BDC/RIC structure provides limitation on
regulated by the SEC leverage and requires portfolio diversification
• Created to encourage investment in small and middle • Portfolio must be well diversified
market companies
• No single investment can account for more than 25%
of total assets
• As of December 31, 2017 there were 53 public active
BDCs with a total market cap of $33.5 billion (1) • At least 50% of total assets must be comprised of
individual holdings of less than 5% of total assets
• Make debt and equity investments with ability to invest each
across a company’s capital structure
• Required to maintain low leverage with asset coverage ratio
• Must generally invest at least 70% of assets in U.S. private of at least 200% (maximum debt to equity of approximately
companies or U.S. public companies with market 1:1) in order to borrow or pay dividends
capitalization under $250 million • Proposed legislation could raise allowable leverage
to 2:1 D:E, which is still significantly less than bank
and finance co. peers
• Required to pay 90% of taxable income as dividends to
shareholders or pay taxes on that income
• Portfolio must generate sufficient cash flows to pay
interest as well as dividends to equity investors
junior to debt holders
Ares Capital Corporation is the Largest BDC
1) Source: SNL Financial
Ares Capital Corporation - Not for Publication or Distribution 7ARCC’s Competitive Advantages Ares Capital Corporation - Not for Publication or Distribution
ARCC’s Proven Business Model and Processes
   ARCC’s time-tested strategy and business model have driven strong performance and returns for
   shareholders

                                                                 Active, Index Eligible Issuer
                                                                      with BBB Rating

Ares Capital Corporation - Not for Publication or Distribution                      9
Direct Origination & Scale Provide Distinct Competitive Advantages
Broad and Deep U.S. Origination Coverage with Experienced Team
77 portfolio Direct Origination and Scale Improve Asset Selectivity, Credit
Quality and Control
companies
• Over 100 investment professionals in six U.S. offices
• Drives asset selectivity and enhances returns
• Improves due diligence, access and influence over terms
• Focus on lead investing and controlling the tranche
• Active investor post-closing with board seats or observation
rights on 47%of the portfolio (2)
Larger/Broader Product Capability Enhances Returns
• Commit and hold up to $500 million in a single transaction(1)
• Incumbency creates organic growth opportunities within
existing portfolio
• Ability to underwrite and syndicate to drive fee income
Deep PE Sponsor Network
• Relationships with over 450 sponsors
62 portfolio • Closed at least one investment with approximately 350
financial sponsors and multiple investments with over 175
companies financial sponsors in the U.S.
150 portfolio
companies Scale Creates Cost of Capital Advantages
• Enhances access to capital
• Leads to diversified funding sources and more efficient
Ares office locations access to capital
Note: portfolio company locations excludes 36 portfolio companies outside of the United States.
All data is as of December 31, 2017 unless otherwise noted.
(1) Includes Ares Capital and certain of its financial services portfolio companies.
(2) Based on fair value.
Ares Capital Corporation - Not for Publication or Distribution 10Why is Direct Origination Important?
1
Widens the Funnel to Provide For a Larger Deal Universe Selectivity
2
Primary Diligence on Thousands of Deals Reviewed Since Inception Better Investing
3
Differentiated and
Control Over Structures and Better Economics
Diversified Portfolios
4
Incumbency and Relationships Long-Term Annuity
Origination is the core foundation of our disciplined investment strategy
Diversification does not assure profit or protect against market loss.
Ares Capital Corporation - Not for Publication or Distribution 11Flexibility of Capital: Diversified Product Offerings
Going to market as a total solution provider to our prospective and existing borrowers
allows us to see a broad view of market opportunity
Corporate: $30 - $250 million
TARGETED
Project Finance: $10 - $200 million
INVESTMENT HOLD SIZES EBITDA Range: Generally under $100 million
Leveraged Buyouts Restructurings
General Refinancing Power Generation
TRANSACTION TYPES Acquisitions
Rescue Financing Oil & Gas
Recapitalizations
Growth Capital
Revolvers Unitranche Loans
Junior Capital
PRODUCTS First Lien Loans Second Lien Loans
PRODUCTS Stretch Senior Mezzanine Debt
Minority Equity
Private Equity Sponsors
Project Developers Entrepreneurs
PARTNERS Management Teams
Family Offices Other Lenders
Intermediaries
Ares Capital Corporation - Not for Publication or Distribution 12Long Tenured & Highly Experienced Investment Team
ARCC benefits from a long tenured and highly experienced team with significant
expertise in direct lending and extensive middle market knowledge
• ARCC’s investment team has invested over $45 billion across more than 950 transactions since 2004(1)
• 75% of senior investment professionals in our direct lending team have been with Ares for at least 5 years(2)
• The members of the investment committee possess an average of 22 years of investing experience and every member has been
with Ares more than 10 years
• ARCC receives referrals from other teams across the Ares Platform
U.S. Direct Lending Investment Committee
Mark Michael Kipp Mitch Kort Dave Michael
Partners Jim Miller Average
Affolter Arougheti deVeer Goldstein Schnabel Schwartz Smith
Industry
28 Years 25 Years 22 Years 23 Years 18 Years 20 Years 17 Years 22 Years 22 Years
Experience
Years with
10 Years 14 Years 14 Years 13 Years 11 Years 16 Years 13 Years 14 Years 13 Years
Ares
Extensive Direct Lending Team
Direct Lending Commercial Finance
No. Investment Professionals 100+ 50+
No. Senior Investment
40 13
Professionals (2)
Average Industry Experience of
18 years 20 years
Sr. Professionals
No. of Offices 6 6
As of December 31, 2017.
(1) Includes invested capital from inception on October 8, 2014 through December 31, 2017. Excludes syndications within one year of origination, $1.8 billion of
investments acquired from Allied Capital on April 1, 2010 and $2.5 billion of investments acquired from American Capital on January 3, 2017.
(2) Includes principals, managing directors and partners.
Ares Capital Corporation - Not for Publication or Distribution 13Ares’ Extensive Credit Group Provides Many Benefits to ARCC
Integrated scaled global platform combines direct origination, deep fundamental credit research
and broad perspective of relative value
$71.7 billion AUM(1) Advantages
25+ Partners averaging 24 years of experience
Access to Differentiated
Deep Investment Ability to Express
~235 dedicated investment professionals Information to Inform
Opportunity Set Relative Value
Credit Decisions
Origination, Research & Investment Management Leading Platform of Liquid and Direct Lending Strategies
14 portfolio managers Syndicated Structured
Middle Private Mezz/
Loans Credit / CMBS Market Cash Opportunistic
~55 industry research and structured credit professionals Flow Loans
~120 direct origination professionals
11 distressed and restructuring specialists (2)
Asset Based Project
High Yield Lending Finance
Syndication, Trading & Servicing
6 traders in the U.S. and Europe Liquid Credit Illiquid Credit
6 dedicated capital markets professionals
~30 direct lending professionals focused solely on asset management
Accolades (2)
Investor Relations & Business Operations
Established investor relations and client service across the Americas, ARCC Received Most Honored
Designation & Highest
Europe, Asia, Australia and the Middle East Rankings for Best CEO, CFO, IR Top Quartile Lender of the Year Global Sponsored
Professional and Investor Rankings for North America Deal of the Year -
Relations Program Several Funds 2014, 2015 & 2016 2016
We have experienced teams across the platform that are positioned for excellence in investing and client service
Note: As of December 31, 2017, unless otherwise noted.
1. As of December 31, 2017 AUM amounts include funds managed by Ivy Hill Asset Management, L.P., a wholly owned portfolio compan y of Ares Capital
Corporation and a registered investment adviser.
2. The performance, awards/ratings noted herein relate only to selected funds/strategies and may not be representative of any given client’s experience and
should not be viewed as indicative of Ares’ past performance or its funds’ future performance. All investments involve risk, including possible loss of principal.
Please refer to the Endnotes on slides 39 - 44 for additional information on accolades.
Ares Capital Corporation - Not for Publication or Distribution 14Rigorous Underwriting and Credit Management
Our in-depth process often spans several months, allowing for thoughtful decision making
Key Attributes of ARCC Borrowers (1)
Franchise businesses
High free cash flow
Above market growth prospects
Diverse sources of profitability
Premier financial sponsors with
meaningful “skin in the game”
Leading management teams
Appropriate capital structure
ARCC has lead role
Ares’ Approach:
• Seek to invest in leading, non-cyclical businesses with attractive growth prospects and high free cash flows
• Use direct origination and scale to provide greater influence on loan structures to maintain high selectivity
• Seek to be the lead lender with voting control to have the ability to impact outcomes
• Use incumbent positions to support growth of leading portfolio companies and to help enhance credit quality
• Be proactive managing investments and use our robust process to preserve capital and create value
(1) Not every investment meets each of the criteria.
Ares Capital Corporation - Not for Publication or Distribution 15Incumbency Provides Source for Differentiated Sourcing
Current portfolio includes 170+ private equity sponsors and 310+ middle market companies
Incumbent Position Helps Us Preserve The High Quality of Our Portfolio
Enables us to finance and grow Allows us to remain active with
with leading portfolio Helps reduce portfolio risk deployment while being
companies, in our view defensive
Ability to maintain better than
Ability to leverage history with
market terms, documentation
the borrower
and pricing
63% of commitments during 2017 were to existing portfolio companies
Since inception, follow-on capital provided to incumbent borrowers was approximately double our initial investment
As of December 31, 2017, unless otherwise noted.
Ares Capital Corporation - Not for Publication or Distribution 16Differentiated Asset Management Capabilities and Focus
Longstanding Process with Clear Differentiation
• 23 person dedicated asset management • For the past 7 years, Ares has spent a
team is enhanced by Ares firm resources significant amount of time and effort
such as legal, industry experts, etc. creating a cloud based platform which
• 6 have restructuring experience enhances access, speed and quality of
information
• Team has deep capabilities:
• Restructuring Large Asset Proprietary • System architecture provides
• Valuation Management Technology extensive reporting capabilities and
data to support investment and
• Due diligence Team
portfolio management decisions
• Valuation
• Investment teams work • Be early, be smart, be flexible
alongside asset management Active Extensive workout
team once loan is originated – Management Restructuring • Deep ability to protect capital
life of loan approach Approach Experience while avoiding unnecessary
• Ongoing dialogue with company damage to sponsor relationships
and sponsors/owners • Generated net positive realized gains
• Ares Management provides vs losses since inception
operational and informational
advantages to maximize value
As of December 31, 2017, unless otherwise noted.
Ares Capital Corporation - Not for Publication or Distribution 17ARCC’s Strong Financial Results
Lead to an Attractive Credit Profile
Ares Capital Corporation - Not for Publication or DistributionPortfolio Diversification and Industry Selection
Attractively positioned portfolio, diversified by asset class and industry
Focus on defensively Well diversified Strong investment
Focus on high free cash
positioned, attractive portfolio – discipline and focus on
flow businesses
industries 314 companies downside production
Portfolio by Asset Class (1) Portfolio by Industry (1)
7% 7%
4% 2%
2%
1% 3% 23%
8% 3%
3%
4% 44% 3%
4%
4%
4% 19%
4%
32%
6%
6% 7%
Healthcare-Services Business Services
Senior oriented portfolio: 80% senior secured loans(2) Consumer Products Services-Other
Manufacturing Financial Services
First Lien Senior Secured Loans Second Lien Senior Secured Loans Food and Beverage SDLP
Senior Direct Lending Program Senior Subordinated Debt Power Generation Restaurants and Food Services
Automotive Services Education
Collateralized Loan Obligations Preferred Equity
Wholesale Distribution Oil and Gas
Other Equity and Other Containers-Packaging Remaining
(1) At fair value as of December 31, 2017.
(2) Including First Lien Senior Secured Loans, Second Lien Senior Secured Loans and investments in the subordinated certificates of the Senior Direct Lending Program.
Ares Capital Corporation - Not for Publication or Distribution 19Portfolio Company EBITDA and Credit Statistics
On average, our portfolio companies use moderate leverage and have strong interest coverage
Moderate portfolio Strong portfolio company Annual portfolio company Portfolio company EBITDA
company leverage interest coverage EBITDA growth ~6% (1) of $62 million
8.0x $80.00
$72.9
$69.4 $70.1
7.0x $65.9 $70.00
$62.2
6.0x 5.5x 5.5x $60.00
5.3x 5.4x 5.4x
5.0x $50.00 Portfolio Weighted Average EBITDA (2)
4.0x $40.00 Portfolio Weighted Average Total Net
Leverage Multiple (3)
3.0x $30.00 Portfolio Weighted Average Interest Coverage
2.4x 2.4x 2.3x 2.4x 2.3x Ratio (4)
2.0x $20.00
1.0x $10.00
0.0x $0.00
Q4-16 Q1-17 Q2-17 Q3-17 Q4-17
Note: Past performance is not indicative of future results. Refer to Endnotes on slides 39 - 44 for additional important information.
Ares Capital Corporation - Not for Publication or Distribution 20Sustained Market Premium for ARCC Yields with Lower Losses
ARCC’s portfolio has historically generated premium performance to middle market and syndicated
bank loans and high yield bonds
ARCC’s Portfolio Yield vs. Leveraged Loans & High Yield Bonds
11%
Premium to
9% Middle Market
Leveraged Loans
7%
5%
2013 2014 2015 2016 2017
ARCC Yield on Debt and Income Producing Securities (1) S&P LSTA Leveraged Loan Yields (2)
S&P LSTA Middle Market Leveraged Loan Yields (3) ICE BofAML US HY Master II (4)
Premium yields... ...with lower loss rates
Yield ARCC Non-Accrual Rate/
12/31/17 Premium Default Rate
ARCC Yield on Debt and Income Producing Average ARCC Non-Accrual Rate
9.8% 2.8%
Securities (1) at Amortized Cost (5)
ICE BofAML U.S. High Yield Master II 6.2% 3.6% High Yield Bond Default Rate (6) 5.1%
S&P LSTA Leveraged Loan Yields 5.2% 4.6% Average Annual
Gain/(Loss) Rate
S&P LSTA Middle Market Leveraged Loan
7.3% 2.5% ARCC (7) 1.1%
Yields
3-month LIBOR 1.7% 8.1% High Yield Bonds (8) (2.7)%
Note: Past performance is not indicative of future results. Refer to Endnotes on slides 39 - 44 for additional important information.
Ares Capital Corporation - Not for Publication or Distribution 21Strong Investment Performance
ARCC’s net realized gain/(loss) rates have consistently outperformed BDC peers and banks
Since IPO in October 2004 through December 31, 2017: ARCC generated 230 bps of average annual
incremental gain differential
Cumulative internal rate of return to ARCC on vs. peers since 2004
14% IRR to ARCC (1)(2)
~$21 billion of exited investments 1.20%
Net realized gain/(loss) rate (5)
0.80%
~$610 million
ARCC
Net Realized Cumulative net realized gains generated 0.40%
Gains(3)(4)
0.00%
Average annualized net realized gain rate on the
-0.40% Banks
1.1% Net Realized principal amount of its investments. ARCC had a BDC
Gain Rate%(3) net realized loss in only one fiscal year since Peers
-0.80%
inception(3)
-1.20%
ARCC Banks BDC Peers
Net Realized Gain/(Loss) and Net Charge Off Rates of ARCC, BDC Peers, and Banks
CY2007 CY2008 CY2009 CY2010 CY2011 CY2012 CY2013 CY2014 CY2015 CY2016 LTM* Avg(7)
ARCC(3) 0.4% 0.3% (2.0)% 1.3% 2.1% 0.9% 1.0% 1.2% 1.5% 1.2% 0.2% 1.1%
BDC Peer Group Average(5) 0.3% 0.3% (7.6)% (4.3)% (1.4)% (0.5)% (0.9)% 0.7% (0.1)% (1.4)% (2.5)% (1.2)%
Outperformance vs. BDCs (%) 0.1% —% 5.6% 5.6% 3.5% 1.4% 1.9% 0.5% 1.6% 2.6% 2.7% 2.3%
Bank C&I Net Charge Off Rate(6) (0.5)% (1.0)% (2.3)% (1.7)% (1.0)% (0.5)% (0.3)% (0.2)% (0.2)% (0.4)% (0.4)% (0.8)%
Outperformance vs. Banks (%) 0.9% 1.3% 0.3% 3.0% 3.1% 1.4% 1.3% 1.4% 1.7% 1.6% 0.6% 1.9%
Note: Past performance is not indicative of future results. Refer to Endnotes on slides 39 - 44 for additional important information.
* As of 12/31/17 for ARCC. As of 9/30/17 for BDC Peer Group and Banks.
Ares Capital Corporation - Not for Publication or Distribution 22Compelling Core Earnings and Return on Equity
ARCC has generated strong core earnings(1) and stable core ROE(2) since our IPO
Long standing track record of stable core ROE ranging We’ve out-earned our dividend with cumulative core earnings
from ~9% to ~12% annually over the past 10 years plus net realized gains since our IPO
Consistent Core Cumulative Core Earnings Plus Net Realized Gains vs.
Return on Equity (2) Cumulative Dividends (1)
14%
12% $5,000
$4,500
10% $4,000
$3,500
$ Millions
8% $3,000
$2,500
6% $2,000
4% $1,500
$1,000
2% $500
$0
0%
2011
2013
2004
2005
2006
2007
2008
2009
2010
2012
2014
2015
2016
Q1-17
Q2-17
Q3-17
Q4-17
Cumulative Core Earnings Plus Net Realized Gains
Cumulative Dividends Paid
Annualized
Core Earnings ROE 10 Yr US T-Note
Note: All data as of December 31, 2017. There can be no assurance that dividends will continue to be paid at historic levels or at all. Past performance is not
indicative of future results. See Endnotes on slides 39 - 44 for additional important information.
Ares Capital Corporation - Not for Publication or Distribution 23Low Leverage with Significant Unencumbered Assets
Creditors of ARCC benefit from conservative liability structure and low leverage
Low Leverage: Strong Asset Coverage for Significant Fixed Charge Coverage
Debt/Equity (1) Unsecured Notes (2) from Earnings (3)
1.50x 4.0x 4.0x
BDC
Regulatory 3.5x 3.5x
1.25x Limit: 1.0x
3.0x 3.0x
1.00x
2.5x 2.5x
0.75x 2.0x 2.0x
1.5x 1.5x
0.50x
1.0x 1.0x
0.25x
0.5x 0.5x
0.00x 0.0x 0.0x
2013 2014 2015 2016 2017 2013 2014 2015 2016 2017 2013 2014 2015 2016 2017
Note: Past performance is not indicative of future results. Refer to Endnotes on slides 39 - 44 for additional important information.
Ares Capital Corporation - Not for Publication or Distribution 24Deep Sources of Liquidity and Well Laddered Maturities
Investment portfolio provides ample cash flows to support upcoming debt maturities
Sales & Repayments Cumulative Assets Maturing Well In Excess
as % of Portfolio at Amortized Cost of Cumulative Debt Maturing ($ in millions)
60% $4,500 $12,000
$4,000
Maturities at Fair Value
Cumulative Maturities
50% $10,000
$3,500
40% $3,000 $8,000
30% $2,500
$6,000
$2,000
20% $1,500 $4,000
10% $1,000
$2,000
$500
0%
$0 $0
Exists as % of Portfolio at Amortized Cost Average
Investment Maturities (at fair value) (1)
Debt Maturities (at par)
Cumulative Investment Maturities (at fair value) (1)
Cumulative Debt Maturities (at par)
Assuming the long term average of 35% sales and repayments on our current portfolio of $11.9 billion at amortized cost
implies $4.1 billion of annual liquidity, our portfolio liquidity is significantly in excess of debt maturities in any one ye ar
Note: As of December, 31, 2017, unless otherwise stated. Past performance is not indicative of future results.
Refer to Endnotes on slides 39 - 44 for additional important information.
Ares Capital Corporation - Not for Publication or Distribution 25Additional Sources of Repayment
In addition to the liquidity from our portfolio we have ~$2.5B of availability on lines of credit as
well as a history of issuing debt to refinance maturities
Sources of Borrowings & Capacity Contractual Maturities (5)
~$2.5 billion of
$8,000 available borrowing $7,446 2,500
capacity
$50
$7,000
2,000
$6,000
$4,943 $3,508
$5,000
1,500
$ Millions
$ Millions
$1,055
$4,000
$958 $958
$3,000 1,000
$2,000 $750 $600
$2,930 $2,930 500 $980
$1,000
$600
$270 $300 $388
$0 0
Outstanding (1) Committed Capacity (2) 2018 2019 2020 2021 2022 Thereafter
Unsecured Debt (3) Secured Revolving Credit Facilities (10)(11)
Convertible debt
Revolver (4) Other Unsecured Notes (7)(8)(9)
Convertible Unsecured Notes (6)
Market access supplements existing liquidity - completed 16 debt capital markets transactions / $5.7 billion of financings to date12
Note: As of December, 31, 2017, unless otherwise stated. Past performance is not indicative of future results.
Refer to Endnotes on slides 39 - 44 for additional important information.
Ares Capital Corporation - Not for Publication or Distribution 26Active & Index Eligible BBB Issuer Ares Capital Corporation - Not for Publication or Distribution
Long Standing Investment Grade Ratings
       ARCC is the only BDC with a BBB rating from both Fitch and S&P, and has never had a rating
       downgrade (1)

        Current Rating                                      BBB                                                                                         BBB
      Current Outlook                                     Stable                                                                                      Stable
          Date Rating
          Established                           November 2009                                                                                      July 2007

               “The ratings of Ares Capital Corporation reflect its                                            “Our rating on ARCC reflects the company's low
               strong franchise, low leverage, demonstrated access                                             financial leverage, successful track record, and good
               to the debt and equity markets, consistent                                                      diversity of funding. The rating also reflects the
               operating performance, moderate portfolio                                                       firm's good market position relative to peers we rate
               concentrations, superior funding flexibility, solid                                             similarly.
               dividend coverage, experienced management team                                                  – November 22, 2016 (4)
               and strong access to deal flow.” – January 3, 2017 (2)

               “Fitch continues to believe that Ares has the                                                   “In our opinion, ARCC has the best market position in
               strongest capital structure in the BDC space.”                                                  the BDC space…” – November 22, 2016 (4)
               – March 7, 2017 (3)

1) All of ARCC’s unsecured and convertible notes are rated by S&P and Fitch with the exception of our 2047 retail notes, which are rated by Moody’s. Our 2047 retail
notes were assumed as part of the Allied Capital Acquisition on April 1, 2010. Moody’s rated these notes Ba1 with a positive outlook as of June 21, 2017.
2) FitchRatings, “Ares Capital Corporation Full Rating Report,” January 3, 2017.
3) FitchRatings, “Fitch Affirms Ares Capital at ‘BBB'; Outlook stable,” March 7, 2017.
4) Source: S&P Global Ratings, “RatingsDirect Report,” November 22, 2016.
Ares Capital Corporation - Not for Publication or Distribution                                        28
Expanded Market Access and Growing Liquidity
Our growth has supported improved pricing, expanded access and more actively traded bonds
Improved funding cost and increased liquidity over time
$750mm $750mm
4.875% 3.500%
5Y notes 5Y notes
3.0 T+366 T+170
2.5
2.0
$ Billions
1.5
1.0
0.5
0.0
2013 2014 2015 2016 2017
5 Yr Term Unsecured Notes Outstanding
Expanded Liquidity: New Tenors:
• 2017 quarterly average trading volume in • In 2018, we closed on our inaugural $600
ARCC unsecured debt was ~ $450mm or ~18% million 7 year note with a 4.25% coupon
of total unsecured debt outstanding (1) (T+190 bps)
1) Twelve months ended 12/31/2017; trading volumes based on estimated TRACE data and includes all trades >=100k per JP Morgan
Ares Capital Corporation - Not for Publication or Distribution 29Strong Execution on Unsecured Notes Offerings
Continued to improve interest rate since our first issuance, which has also led to new markets, such
as our 7-year issuance in 2018
5 Year Unsecured Notes 5 Year Convertible Notes
6.0% 6.0% 5.750%
5.125%
4.875% 4.875% 4.750%
5.0% 5.0%
4.375%
3.875% 3.750%
4.0% 3.625% 3.500% 4.0%
Coupon
Coupon
3.0% 3.0%
2.0% 2.0%
1.0% 1.0%
0.0% 0.0%
Nov-13 Nov-14 Sep-16 Aug-17 Jan-11 Mar-11 Mar-12 Oct-12 Jul-13 Jan-17
Spread: Issuance Date Spread: Spread: Issuance Date Spread:
3.66% 1.70% 3.70% 1.80%
Spreads have declined by 180 bps since November 2013(1) Spreads have declined by 190 bps since January 2011 (2)
In January 2018, we completed our inaugural 7-year
notes offering at 4.25%, representing a 190 bps spread
(1) Measured as the spread to 5 Year U.S. Treasuries on day of pricing of our 2018 Notes issued at a stated interest rate of 4.875% on November 19, 2013 as compared to
the spread to 5 Year U.S. Treasuries of our 2023 Notes issued at a stated rate of 3.5% on August 10, 2017.
(2) Measured as the spread to 5 Year U.S. Treasuries on day of pricing of our 2016 Convertible Notes issued at a stated interest rate of 5.750% on January 25, 2011 as
compared to the spread to 5 Year U.S. Treasuries of our 2022 Convertible Notes issued at a stated rate of 3.750% on January 27, 2017.
Ares Capital Corporation - Not for Publication or Distribution 30Conclusion
We believe these factors lead to a well positioned company to continue to generate attractive future
financial performance that benefits bondholders
1
Attractive Industry & Corporate Structure
2
Significant Competitive Advantages
3
Well Positioned with Strong Investment
Performance
4
Active, BBB Rated Index Eligible Issuer
Ares Capital Corporation - Not for Publication or Distribution 31Appendix:
Additional Investment and Financial Considerations
Ares Capital Corporation - Not for Publication or DistributionARCC’s Earnings Will Likely Benefit from Higher LIBOR Rates
ARCC has an asset sensitive balance sheet that we believe will benefit from an expected rise in base
interest rates
3 Month LIBOR Forward Rates (1) Enhanced Ability to Benefit from Rising Rates (2)
3.20% • Heavily weighted to floating-rate loans (3)
o 90% floating rate loan portfolio
3.00%
o 8% fixed rate loan portfolio
2.80% • Heavily weighted to fixed-rate borrowings
o 87% fixed rate (4)
2.60% o 13% floating rate
• Conservative Leverage
2.40%
o 0.66x net debt to equity
2.20%
Increase in LIBOR Annual Per Share Impact (2)(5)
2.00%
100 bps $0.17 per share
1.80%
Feb. 2018 Feb. 2019 Feb. 2020 Feb. 2021 Feb. 2022
200 bps $0.34 per share
300 bps $0.51 per share
(1) Source: Chatham Financial. Reflects the current and forward 3 month LIBOR rates for February 26, 2018 through 2022, all as of February 26, 2018.
(2) As of December 31, 2017.
(3) Remaining 2% consists of non-accruals and non-coupon bearing loans.
(4) Includes the $395 million term loan tranche of Ares Capital's Revolving Credit Facility which Ares Capital effectively fixed the inter est rate at 3.8% through an interest rate swap agreement.
(5) Marginal EPS contributions include the impact of income-based fees.
33Deep and Diverse Access to Debt Financing
Efficient and seasoned issuer of liabilities
Total Aggregate
Weighted
Principal Amount of Principal Amount
($ in millions) Average Stated
Commitments Outstanding (2)
Interest Rate (3)
Outstanding (1)
Secured Revolving Facilities (4)
Revolving Credit Facility $2,108 $395 3.814%
Revolving Funding Facility 1,000 600 3.714% • Significant access to long-dated, lower cost revolving
SMBC Funding Facility 400 60 3.569% debt facilities
Subtotal $3,508 $1,055 3.743% • No “mark to market” financing
• Reduced pricing over time and continue to periodically
SBA Debentures $50 $— —% extend maturities (5-7 year terms)
Unsecured Notes Payable (5)
2018 Convertible Notes $270 $270 4.750%
2018 Notes 750 750 4.875%
• Seasoned issuer in the institutional unsecured debt
2019 Convertible Notes 300 300 4.375%
market
2020 Notes 600 600 3.875%
• More than 100 investors have invested in ARCC’s
January 2022 Notes 600 600 3.625%
Convertible and Investment Grade Notes
2022 Convertible Notes 388 388 3.750% (5)
• Raised over $5.7 billion in unsecured notes since 2011
2023 Notes 750 750 3.500%
(including January 2018 issuance)
2047 Notes 230 230 6.875%
Subtotal $3,888 $3,888 4.221%
Total $7,446 $4,943 4.119%
Weighted Average Stated Interest
3.87%(6) 4.12%
Rate
All data as of December 31, 2017, unless otherwise noted. Refer to Endnotes on slides 39 - 44 for additional important information.
34Significant Unencumbered Assets and Strong Interest Coverage
Creditors of ARCC benefit from BDC leverage limitation and conservative liability structure
(dollar amounts in millions) 12/31/13 12/31/14 12/31/15 12/31/16 12/31/17
Investments at fair value pledged to secured facilities and SBA
Debentures $ 5,342 $ 6,559 $ 6,882 $ 6,245 $ 10,473
Debt outstanding in secured facilities and SBA Debentures 185 556 897 856 1,055
Excess collateral from secured facilities and SBA Debentures $ 5,157 $ 6,003 $ 5,985 $ 5,389 $ 9,418
Cash and cash equivalents $ 150 $ 195 $ 257 $ 223 $ 316
Unencumbered investments at fair value(1) 2,291 2,469 2,392 2,575 1,368
Total assets available for unsecured notes $ 7,598 $ 8,667 $ 8,634 $ 8,187 $ 11,102
Unsecured notes outstanding $ 2,894 $ 3,443 $ 3,300 $ 3,095 $ 3,888
Asset coverage for unsecured notes 2.6x 2.5x 2.6x 2.6x 2.9x
Ratio of Earnings to Fixed Charges(2) 3.7x 3.2x 3.2x 3.7x 3.8x
The use of leverage magnifies the potential for gain or loss on the amount invested and may increase the risk of investment.
1) Certain assets are not pledged to the Revolving Credit Facility and the facility restricts in certain respects ARCC’s ability to pledge these assets.
2) For the years ended December 31, 2013, 2014, 2015, 2016 and 2017. Earnings represent net investment income excluding interest and facility fees, income taxes and capital gains
incentive fees accrued in accordance with GAAP. Fixed charges represent interest and facility fees.
Ares Capital Corporation - Not for Publication or Distribution 35ARCC Has Experienced Consistently Low Non-Accruals
ARCC’s non-accruals have been consistently below comparable larger credit market indices
Focus on Capital Preservation Long Term Average Non-Accrual and Default Rates
6%
• Our investment strategy highlights capital
5.1%
preservation 5%
• Non-accruals have generally remained below 4%
the industry averages
3.1%
3% 2.8%
• In 2009, ARCC non-accruals of 2.5% compared
to 10.3% for leveraged loan market (4) 2%
• At December 31, 2017, 3.1% of the total 1%
portfolio at amortized cost and 1.4% at fair
value were on non-accrual 0%
ARCC Non-Accrual Rate S&P LSTA LLI Default Moody's HY Default
at Amortized Cost (1) Rate (2) Rate (3)
Measured from 2000 or IPO (Oct. 04) to 2017
Note: Data as of December 31, 2017, unless otherwise noted. Past performance is not indicative of future results.
Refer to Endnotes on slides 39 - 44 for additional important information.
36Reconciliation of Core Earnings
Reconciliations of Core Earnings to GAAP Earnings
For the years ended
(in millions) 2012 2013 2014 2015 2016 2017
Core Earnings (1) $ 381 $ 442 $ 473 $ 486 $ 504 $ 592
Professional fees and other costs related to the American — — — — (12) (40)
Capital Acquisition (2)
Net realized and unrealized gains (losses) 159 58 153 (129) (20) 156
Incentive fees attributable to net realized and unrealized gains
and losses (32) (11) (29) 27 5 (41)
Income tax and other expenses related to net realized and
unrealized gains and losses — — (6) (5) (3) —
GAAP Earnings $ 508 $ 489 $ 591 $ 379 $ 474 $ 667
(1) Core Earnings is a non-GAAP financial measure. Core Earnings is the net increase (decrease) in stockholders’ equity resulting from operations less professional fees and other costs related to the
acquisition of American Capital, Ltd. (the "American Capital Acquisition"), net realized and unrealized gains and losses, any capital gains incentive fees attributable to such net realized and unrealized gains
and losses and any income taxes related to such net realized gains and losses. Net increase (decrease) in stockholders’ equity is the most directly comparable GAAP financial measure. Ares Capital believes
that Core Earnings provides useful information to investors regarding financial performance because it is one method Ares Cap ital uses to measure its financial condition and results of operations. The
presentation of this additional information is not meant to be considered in isolation or as a substitute for financial resul ts prepared in accordance with GAAP.
(2) See Note 14 to Ares Capital's consolidated financial statements included in the annual report on Form 10-K for the year ended December 31, 2017 for information regarding the American Capital
Acquisition.
Ares Capital Corporation - Not for Publication or Distribution 37Endnotes Ares Capital Corporation - Not for Publication or Distribution
Endnotes
 Slide 14: Ares’ Extensive Credit Group Provides Many Benefits to ARCC
 Performance Notes:
 • ARCC received the 2018 All- America Executive Team award alongside 43 other companies. Various Ares personnel received first place awards in the following categories: CEO, CFO, IR
     Professional and IR program. 248 other institutions also received a first-, second-, or third-place ranking in one or more of those four categories. Institutional Investor based these awards on
     the opinions of 1,940 portfolio managers and buy-side analysts, and 826 sell-side analysts who participated in this survey.
 •    Institutional Investor logo from Institutional Investor, November 7, 2017 ©2017 Institutional Investor, LLC. All rights reserved. Used by permission and protected by the Copyright Laws of the
      United States. The printing, copying, redistribution, or retransmission of this Content without express written permission is prohibited.
 •    Lipper Rankings reported in Lipper Marketplace Best Money Managers, September 30, 2017. Lipper Marketplace is the source of the long-only and multi-strategy credit rankings. Lipper’s Best
      Money Managers rankings consider only those funds that meet the following qualification: performance must be calculated “net” of all fees and commissions; must include cash; performance
      must be calculated in U.S. dollars; asset base must be at least $10 million in size for “traditional” U.S. asset classes (equity, fixed income, and balanced accounts); and, the classification of the
      product must fall into one of the categories which they rank. Lipper defines Short Duration as 1-5 years. Lipper’s Active Duration definition does not specify a time period but rather refers to
      an Active rather than Passive strategy. Ares Institutional Loan Fund was ranked 11 out of 58 for the 20 quarters ended September 30, 2017. Composites for Ares U.S. Bank Loan Aggregate and
      Ares U.S. High Yield additionally received rankings of 9 of 58 and 3 of 40, respectively, for the 20 quarters ended September 30, 2017.
 •    Private Equity International selected Ares Management as Mid-Cap Lender of the Year – North America for 2014 and Ares Capital Corporation as Lender of the Year – North America for 2015
      and 2016– Awards based on an industry wide global survey across 60 categories conducted by Private Equity International. In the Mid-Cap Lender of the Year in North America category
      (renamed to Lender of the Year in 2015), Ares was listed as one of three shortlisted firms as suggested by the editorial board of PEI Media. Survey participants voted independently. In addition,
      survey participants could nominate another firm not listed in the category.
 •    Private Debt Investor selected Ares Capital Corporation as Global Sponsored Deal of the Year (Qlik Technologies) for 2016. Awards based on an industry wide global survey across 43 categories
      conducted by Private Debt Investor. In the Global Sponsored Deal of the Year category Ares was listed as one of four shortlisted firms as suggested by the editorial board of PEI Media. Survey
      participants voted independently. In addition, survey participants could nominate another firm not listed in the category.

Ares Capital Corporation - Not for Publication or Distribution                                           39
Endnotes
Slide 20: Portfolio Company EBITDA and Credit Statistics
1. For the portfolio companies included in the portfolio weighted average EBITDA data above (subject to additional exclusions de scribed in the following sentence), the weighted average EBITDA
growth rate as of Q4-17 was approximately 6% on a comparable basis for the most recently reported LTM period versus prior year LTM period. In addition to those portfolio companies excluded as
noted, this calculation excludes five companies where prior year comparable data was not available. The EBITDA growth rate fo r each included portfolio company is calculated as the percentage
change for the most recently reported fiscal year to date comparable periods and is weighted based on the fair value of the p ortfolio company investments to calculate the portfolio weighted
average EBITDA growth rate. For a particular portfolio company, EBITDA is generally defined as net income before net interest expense, income tax expense, depreciation and amortization. EBITDA
amounts used in the calculation are estimated from the most recent portfolio company financial statements, have not been inde pendently verified by Ares Capital and may reflect a normalized or
adjusted amount. Accordingly, Ares Capital makes no representation or warranty in respect of this information.
2. Weighted average EBITDA amounts are weighted based on the fair value of the portfolio company investments except for the weighted aver age EBITDA for the Senior Secured Loan Program
(“SSLP”), which was weighted based on the principal amount of the loan made by the SSLP to such portfolio company. EBITDA amounts are estimated from the most recent portfolio company
financial statements, have not been independently verified by Ares Capital and may reflect a normalized or adjusted amount. A ccordingly, Ares Capital makes no representation or warranty in
respect of this information. Please refer to Notes A and B below for additional important information.
3. Portfolio weighted average total net leverage multiples represent Ares Capital’s last dollar of invested debt capital (net of cash) as a multiple of EBITDA. Portfolio weighted average total net
leverage multiples for borrowers in the SSLP and Senior Direct Lending Program (“SDLP”)represent the SSLP's and SDLP's last dollar of invested debt capital (net of cash) as a multiple of EBITDA. The
weighted average total net leverage multiple for the underlying borrowers in the SSLP was 5.1x , 4.9x and 4.9x as of 12/31/16, 3/31/17 and 6/30/17, respectively. The weighted average total net
leverage multiple for the underlying borrowers in the SDLP was 5.3x, 5.2x, 5.6x ,5.4x and 5.5x as of 12/31/16, 3/31/17, 6/30/ 17, 9/30/17 and 12/31/17, respectively. Portfolio company credit
statistics for Ares Capital, the SSLP and the SDLP are derived from the most recently available portfolio company financial statements, have not been independently verified by Ares Capital and may
reflect a normalized or adjusted amount. Accordingly, Ares Capital makes no representation or warranty in respect of this information. Please refer to Notes A and B below for additional important
information.
4. Portfolio weighted average interest coverage ratio represents the portfolio company’s EBITDA as a multiple of interest and facility fees expense. The weighted average interest coverage ratio for
the underlying borrowers in the SSLP was 2.4x, 2.5x and 2.3x as of 12/31/16, 3/31/17 and 6/30/17, respectively. The weighted average interest coverage ratio for the underlying borrowers in the
SDLP was 2.5x, 2.6x, 2.3x, 2.4x and 2.3x as of 12/31/16, 3/31/17, 6/30/17, 9/30/17 and 12/31/17, respectively. Portfolio company credit statistics for Ares Capital, the SSLP and the SDLP are derived
from the most recently available portfolio company financial statements, have not been independently verified by Ares Capital and may reflect a normalized or adjusted amount. Accordingly, Ares
Capital makes no representation or warranty in respect of this information. Please refer to Notes A and B below for additiona l important information.
Note A: This portfolio weighted average EBITDA data includes information solely in respect of corporate investments in Ares Capital's portfolio and the weighted average total net leverage multiple and
interest coverage ratio data includes information solely in respect of corporate portfolio companies in which Ares Capital ha s a debt investment (in each case, subject to the exclusions described in the
following sentence). Excluded from the data above is information in respect of the following: (i) the SSLP (and the underlying borrowers in the SSLP), (ii) the SDLP (and the underlying borrowers in the
SDLP), (iii) portfolio companies that do not report EBITDA, including IHAM, (iv) investment funds/vehicles, (v) discrete projects in the project finance/power generation sector, (vi) certain oil and gas
companies, (vii) venture capital backed companies and (viii) commercial real estate finance companies. The weighted average E BITDA for the underlying borrowers in the SSLP was $54.3 million, $58.0
million and $43.7 million as of 12/31/16, 3/31/17 and 6/30/17, respectively. The weighted average EBITDA for the underlying b orrowers in the SDLP was $31.2 million, $31.8 million, $38.3 million, $40.4
million and $41.5 million as of 12/31/16, 3/31/17, 6/30/17, 9/30/17 and 12/31/17, respectively.
Note B: EBITDA is a non-GAAP financial measure. For a particular portfolio company, EBITDA is generally defined as net income before net interest expense, income tax expense, depreciation and
amortization. EBITDA amounts are estimated from the most recent portfolio company financial statements, have not been indepen dently verified by Ares Capital and may reflect a normalized or
adjusted amount. Accordingly, Ares Capital makes no representation or warranty in respect of this information.
40Endnotes
Slide 21: Sustained Market Premium for ARCC Yields with Lower Losses
1. The weighted average yield on debt and other income producing securities is computed as (a) annual stated interest rate or yield earned plus the net annual amortization of original issue discount
and market discount or premium earned on accruing debt and other income producing securities, divided by (b) total accruing d ebt and other income producing securities at fair value.
2. The S&P/LSTA Leveraged Loan Index is a market value-weighted index designed to measure the performance of the U.S. leveraged loan market based upon market weightings, spreads and interest
payments. Term loans from syndicated credits must meet the following criteria at issuance in order to be eligible for inclusion in the index: senior secured, minimum initial term of one year, US
dollar denominated, minimum initial spread of LIBOR + 125 basis points, $50M initially funded loans. Inception date: January 1, 1997.
3. The Middle Market Index consists of middle market facilities drawn from the larger S&P/LSTA (Loan Syndications and Trading Association) Leveraged Loan Index. It is designed to measure the
performance of the U.S. leveraged loan market. S&P/LSTA defines the middle market as deals with an EBITDA of less than $50 million.
4. The ICE BofAML US High Yield Index ("H0A0") tracks the performance of US dollar denominated below investment grade corporate debt publicly issued in the US domestic market. Qualifying
securities must have a below investment grade rating (based on an average of Moody’s, S&P and Fitch), at least 18 months to f inal maturity at the time of issuance, at least one year remaining term
to final maturity as of the rebalancing date, a fixed coupon schedule and a minimum amount outstanding of $100 million. Index constituents are capitalization‐weighted based on their current
amount outstanding times the market price plus accrued interest. Inception date: August 31, 1986.
5. Represents ARCC’s average non-accrual rate at amortized cost from inception in October 8, 2004 to December 31, 2017.
6. Source: Moody's U.S. Trailing 12-month issuer-weighted spec-grade default rate. Actual speculative grade default data taken from January 2000 to December 31, 2017.
7. Calculated as an average of the historical annual net realized gain/loss rates (where annual net realized gain/loss rate is calculated a s the amount of net realized gains/losses for a particular period
from Ares Capital IPO in October 2004 to December 31, 2017 divided by the average quarterly investments at amortized cost in such period). For purposes of this calculation, SSLP and SDLP
subordinated certificates are considered debt investments. Excludes $196 million one‐time gain on the acquisition of Allied C apital Corporation in Q2‐10 and gains/losses from extinguishment of
debt and sale of other assets.
8. Source: Moody’s 2017 Annual Default Study. Reflects average annual loss rate for speculative grade bonds from 2000-2017.
Slide 22: Strong Investment Performance
1. Based on original cash invested, net of syndications, of approximately $19.3 billion and total proceeds from such exited inve stments of approximately $24.9 billion.
2. Internal rate of return ("IRR") is the discount rate that makes the net present value of all cash flows related to a particular investment equal to zero. Internal rate of return is gross of management
fees and expenses related to investments as these fees and expenses are not allocable to specific investments. The effect of such management and other expenses may reduce, maybe materially,
the IRR’s shown herein. Investments are considered to be exited when the original investment objective has been achieved thro ugh the receipt of cash and/or non-cash consideration upon the
repayment of Ares Capital’s debt investment or sale of an investment, or through the determination that no further consideration was collectible and, thus, a loss may have been realized. These
IRR results are historical results relating to Ares Capital’s past performance and are not necessarily indicative of future r esults, the achievement of which cannot be assured.
3. Calculated as an average of the historical annual net realized gain/loss rates (where annual net realized gain/loss rate is calculated as the amount of net realized gains/losses for a particular period
from Ares Capital IPO in October 2004 to December 31, 2017 divided by the average quarterly investments at amortized cost in such period). For purposes of this calculation, SDLP and SSLP
subordinated certificates are considered debt investments.
4. As of December 31, 2017. Excludes $196 million one‐time gain on the acquisition of Allied Capital Corporation in Q2‐10 and ga ins/losses from extinguishment of debt and sale of other assets.
5. BDC peer group consists of BDCs with a market capitalization of $500 million or greater as of September 30, 2017 or who are u nder common management with a BDC that meets these criteria.
Peers include AINV, BKCC, CGBD, OCSL, OCSI, FSIC, GBDC, GSBD, HTGC, MAIN, NMFC, PFLT, PNNT, PSEC, SLRC, SUNS, TCAP, TCPC, and TSLX.
6. Source: KBW and FDIC Commercial Banking Data. Calculated as net charge-offs for commercial and industrial loans divided by net commercial and industrial loans and leases for the respective
periods.
7. Annual average from October 8, 2004 through December 31, 2016, and the last twelve month period ending September 30, 2017. Fo r ARCC, the last twelve month period is as of December 31,
2017.
41You can also read