S&P Capital IQ's Mutual Fund Ranking Methodology
←
→
Page content transcription
If your browser does not render page correctly, please read the page content below
S&P Capital IQ’s Mutual Fund Ranking
Methodology
October 2013

Background
In September 2009, S&P Capital IQ changed its Mutual Fund Ranking methodology, moving
away from an approach based solely on risk-adjusted past performance towards a more holistic
approach that incorporates a holdings-based analysis focused on performance analytics, risk
considerations and cost factors. In doing so, S&P Capital IQ introduced the concept that under-
standing the fundamentals and risks of a fund’s holdings is as important as, if not more important
than, the relative past performance of the fund. S&P Capital IQ utilizes its well-established intel-
lectual property, including S&P Capital IQ STARS and S&P Capital IQ Quality Ranks for stocks, along
with Standard & Poor’s Credit Ratings for bonds, to determine the quality of the holdings, rather
than presuming a fund with a strong track record can repeat its success. The S&P Capital IQ Mutual
Fund Ranking, which has been updated weekly since September 2009 to provide the freshest
perspective, combines analysis of past performance with the above factors for security valuation,
credit quality analysis and expense ratio benchmarking. Using a scale of one to five-star, the rank-
ings allow advisors to compare and contrast mutual funds across seven broad asset categories to
find mutual funds with positive attributes that fit with each client’s investment approach.
S&P CAPITAL IQ’S MUTUAL FUND RANKING METHODOLOGY

Philosophy
It cannot be assumed that a well-managed mutual fund will remain a winner indefinitely. While the
U.S. is in the midst of a multi-year bull market, the adage “past performance is no guarantee of
future results” remains true. Some of the best-performing stocks in the beginning of 2013, includ-
ing those in the Telecom Services and Utilities sectors have lagged the S&P 500 Index amid rising
interest rates. Meanwhile, the average taxable bond fund had declined in value during the first eight
months of 2012, after rising over 8% in 2012.

Evaluating a fund’s track record is important, but S&P Capital IQ believes that after uncovering a
fund with a strong track record, three additional dimensions should be assessed before making an
investment decision:

• Independently assessing the type of securities the fund owns to decide if the investments have
  relatively strong fundamentals and are undervalued.

• Evaluating the level of risk the fund is taking on in order to achieve its performance, and how that
  risk compares to that of its peers.

• Appraising the cost implications for purchasing and owning the mutual fund.

As a result of this philosophy, the S&P Capital IQ Mutual Fund ranking methodology favors funds
with positive characteristics in all of the areas highlighted above.

Finally, S&P Capital IQ believes that objectivity and consistency are important, and therefore em-
ploys a quantitative approach that leverages extensive S&P Capital IQ intellectual property such as
STARS, Fair Value and Quality Ranks (also known as S&P Earnings and Dividend Rankings), along
with a robust peer classification system to seek to ensure an unbiased ranking process.

Holdings-Based Analysis
In assessing the overall quality of an equity fund, in addition to judging a fund’s track record and
cost factors, S&P takes a detailed look at each of its holdings to evaluate if they are undervalued,
have strong fundamentals and/or present a lower amount of risk relative to the securities owned by
other mutual funds:

OCTOBER 2013                                                                                          2
WWW.SPCAPITALIQ.COM
S&P CAPITAL IQ’S MUTUAL FUND RANKING METHODOLOGY
Figure 1: CHART IS FOR AN EQUITY FUND
MUTUAL FUND
HOLDING 1 HOLDING 2 HOLDING 3 HOLDING 4
Step 1: Identify each holding within
STOCK BOND STOCK BOND the fund
CREDIT CREDIT Step 2: Analyze the characteristics
S&P STARS S&P STARS
RATING RATING and quality of each holding, incor-
porating proprietary S&P qualitative
S&P FAIR S&P FAIR
VALUE
DURATION
VALUE
DURATION analyses and quantitative models
S&P QUALITY S&P QUALITY
Step 3: Compare the quality of the
RANK RANK
fund’s holdings to that of other funds
S&P CREDIT S&P CREDIT in its category
RATING RATING
MUTUAL FUND MUTUAL FUND MUTUAL FUND
Step 4: Integrate holdings based
HOLDING 1
STOCK
HOLDING 2
BOND
HOLDING 3
STOCK
HOLDING 4
BOND
HOLDING 1
STOCK
HOLDING 2
BOND
HOLDING 3
STOCK
HOLDING 4
BOND
HOLDING 1
STOCK
HOLDING 2
BOND
HOLDING 3
STOCK
HOLDING 4
BOND
inputs into the ranking model, which
S&P STARS
CREDIT
RATING
S&P STARS
CREDIT
RATING
S&P STARS
CREDIT
RATING
S&P STARS
CREDIT
RATING
S&P STARS
CREDIT
RATING
S&P STARS
CREDIT
RATING also evaluates critical fund level
characteristics, like track record,
S&P FAIR DURATION S&P FAIR DURATION S&P FAIR DURATION S&P FAIR DURATION S&P FAIR DURATION S&P FAIR DURATION
VALUE VALUE VALUE VALUE VALUE VALUE
S&P QUALITY S&P QUALITY S&P QUALITY S&P QUALITY S&P QUALITY S&P QUALITY
RANK RANK RANK RANK RANK RANK
S&P CREDIT
RATING
S&P CREDIT
RATING
S&P CREDIT
RATING
S&P CREDIT
RATING
S&P CREDIT
RATING
S&P CREDIT
RATING expense ratio and manager tenure
before determining a ranking
Using the latest available full holdings supplied by the fund, S&P Capital IQ believes that this step-
by-step process makes the S&P Capital IQ Mutual Fund Ranking more helpful and valuable than an
approach that relies on past performance, by providing important data and information to use as a
tool in determining of a mutual fund’s relative appeal. In addition, the quantitative approach seeks
to ensure a consistent and objective assessment of a fund.
Detailed Classifications
By utilizing detailed and narrow classifications, the S&P methodology gives the ability to distinguish
the performance and fundamentals among portfolios that use similar investment approaches.
Each of the approximately 23,000 mutual funds that S&P Capital IQ has research on is initially
placed into an S&P Category that is determined by the type of assets the fund invests in. There are
a total of nine broad categories that a fund can fit into, and a fund will be compared to other funds
within its category. As of August 2013, S&P Capital IQ had rankings on 20,000 mutual funds.
Mutual Fund categories that S&P ranks:
• Domestic Equity • Tax-Exempt Fixed Income
• Global Equity • Blended -Fund of Funds
• Taxable Fixed Income • International Equity
• Blended
Mutual Fund categories that S&P does not rank
• Money Market
• Specialty/Other (includes funds that invest in convertible bonds and those that primarily take
long and short positions.
OCTOBER 2013 3
WWW.SPCAPITALIQ.COMS&P CAPITAL IQ’S MUTUAL FUND RANKING METHODOLOGY
Within each S&P Capital IQ Category, a fund is further classified into one of 23 Styles based on the
fund’s fiscal-year and semiannual portfolio holdings. Styles are determined based on a variety of
factors, such as the market capitalizations of its holdings, the region in which the holdings are do-
miciled, or the types of bonds held. Styles are designed as a tool to help identify funds that utilize a
particular investment approach. S&P tracks changes in a fund’s style over time.
S&P Capital IQ also analyzes the mutual fund universe using peer group classifications. A fund’s
peer group consists of all the funds within the same Lipper classification. Lipper uses a combina-
tion of holdings-based models and language taken from the fund’s prospectus.
Peer Groups for Categories that S&P ranks
S&P CATEGORY S&P STYLE PEER GROUP
DOMESTIC EQUITY
Multi Cap Core Multi Cap Core Funds
Multi Cap Growth Multi Cap Growth Funds
Multi Cap Value Multi Cap Value Funds
Large Cap Core Large Cap Core Funds
Large Cap Growth Large Cap Growth Funds
Large Cap Value Large Cap Value Funds
Mid Cap Core Mid Cap Core Funds
Mid Cap Growth Mid Cap Growth Funds
Mid Cap Value Mid Cap Value Funds
Small Cap Core Small Cap Core Funds
Small Cap Growth Small Cap Growth Funds
Small Cap Value Small Cap Value Funds
Other Basic Materials Funds
Commodities Funds
Consumer Goods Funds
Consumer Services Funds
Diversified Leverage Funds
Equity Income Funds
Financial Services Funds
Health/Biotechnology Funds
Industrials Funds
Natural Resources Funds
S&P 500 Index Objective Funds
Science & Technology Funds
Speciality/Miscellaneous Funds
Telecommunication Funds
Utility Funds
OCTOBER 2013 4
WWW.SPCAPITALIQ.COMS&P CAPITAL IQ’S MUTUAL FUND RANKING METHODOLOGY
S&P CATEGORY S&P STYLE PEER GROUP
GLOBAL EQUITY
Multi Cap Core Global Multi Cap Core Funds
Multi Cap Growth Global Multi Cap Growth Funds
Multi Cap Value Global Multi Cap Value Funds
Large Cap Core Global Large Cap Core Funds
Large Cap Growth Global Large Cap Growth Funds
Large Cap Value Global Large Cap Value Funds
Other Global Financial Services Funds
Global Flexible Port Funds
Global Health/BiotechnologyvFunds
Global Natural Resources Funds
Global Real Estate Funds
Global Science/Technology Funds
Global Small-/Mid-Cap Funds
Gold Oriented Funds
Real Estate Funds
INTERNATIONAL EQUITY
Multi Cap Core International Multi Cap Core
International Small/Mid-Cap Core
Multi Cap Growth International Multi Cap Growth
International Small/Mid-Cap Growth
Multi Cap Value International Multi Cap Value
International Small/Mid-Cap Value
Large Cap Core International Large-Cap Core
Large Cap Growth International Large-Cap Growth
Large Cap Value International Large-Cap Value
International Real Estate Funds
Other China Region Funds
Emerging Markets Funds
European Region Funds
Japanese Funds
Latin American Funds
Pacific Ex Japen Funds
Pacific Region Funds
OCTOBER 2013 5
WWW.SPCAPITALIQ.COMS&P CAPITAL IQ’S MUTUAL FUND RANKING METHODOLOGY
S&P CATEGORY S&P STYLE PEER GROUP
TAXABLE FIXED INCOME
Global Fixed Income Global Income Funds
High Yield Debt High Current Yield Funds
International Fixed Income Emerging Markets Debt Funds
International Income Funds
Long-Term Funds Corporate Debt Funds A-Rated
Corporate Debt Funds BBB-Rated
General Bond Funds
Multi-Sector Income Funds
Medium-Term Funds Intermediate Investment Grade Debt Funds
Mortgage-Backed Securities GNMA Funds
U.S. Mortgage Funds
Short-Term Funds Short Investment Grade Debt Funds
Short-Intmdt Investment Grade Debt Funds
Ultra-Short Obligations Funds
U.S. Government Securities General US Government
General U.S. Treasury Funds
Intermediate U.S. Government Funds
Short U.S. Goverment Funds
Short U.S. Treasury Funds
Short-Intermediate U.S. Government Funds
TAX-FREE FIXED INCOME
Multi-State Muni Funds General Municipal Debt Funds
High Yield Municipal Debt Funds
Insured Municipal Debt Funds
Intermediate Municipal Debt Funds
Short Municipal Debt Funds
Short-Intmdt Municipal Debt Funds
Single-State Muni Funds Arizona Municipal Debt Funds
California Intermediate Municipal Debt Funds
California Municipal Debt Funds
California Sh-Intmdt Municipal Debt Funds
Colorado Municipal Debt Funds
Connecticut Municipal Debt Funds
Florida Municipal Debt Funds
Georgia Municipal Debt Funds
Maryland Municipal Debt Funds
Massachusetts Intermediate Muni Debt Funds
Massachusetts Municipal Debt Funds
Michigan Municipal Debt Funds
Minnesota Municipal Debt Funds
Missouri Municipal Debt Funds
New Jersey Municipal Debt Funds
New York Intermdt Municipal Debt Funds
New York Municipal Debt Funds
North Carolina Municipal Debt Funds
Ohio Municipal Debt Funds
Other States Intermediate Municipal Debt Funds
Other States Municipal Debt Funds
Other States Short-Intmdt Municipal Debt Funds
Pennsylvania Municipal Debt Funds
Single-State Insured Municipal Debt Funds
Virginia Municipal Debt Funds
OCTOBER 2013 6
WWW.SPCAPITALIQ.COMS&P CAPITAL IQ’S MUTUAL FUND RANKING METHODOLOGY
S&P CATEGORY S&P STYLE PEER GROUP
BLENDED
Other Flexible Portfolio Funds
Mixed-Asset Target 2010 Funds
Mixed-Asset Target 2015 Funds
Mixed-Asset Target 2020 Funds
Mixed-Asset Target 2025 Funds
Mixed-Asset Target 2030 Funds
Mixed-Asset Target 2035 Funds
Mixed-Asset Target 2040 Funds
Mixed-Asset Target 2045 Funds
Mixed-Asset Target 2050+ Funds
Mixed-Asset Target Allocation Conservative Funds
Mixed-Asset Target Allocation Growth Funds
Mixed-Asset Target Moderate Funds
Peer Groups for Categories that S&P does not rank
S&P CATEGORY S&P STYLE PEER GROUP
MONEY MARKET
California Tax-Exempt Money Market California Tax-Exempt Money Market Funds
Connecticut Tax-Exempt Money Market Connecticut Tax-Exempt Money Market Funds
Institutional Money Market Institutional Money Market Funds
Institutional Tax-Exempt Money Market Institutional Tax-Exempt Money Market Funds
Institutional U.S. Government Money Market Institutional U.S. Government Money Market Funds
Institutional U.S. Treasury Money Market Institutional U.S. Treasury Money Market Funds
Massachusetts Tex-Exempt Money Market Massachusetts Tex-Exempt Money Market Funds
Michigan Tax-Exempt Money Market Michigan Tax-Exempt Money Market Funds
Money Market Money Market Funds
New Jersey Tax-Exempt Money Market New Jersey Tax-Exempt Money Market Funds
New York Tax-Exempt Money Market New York Tax-Exempt Money Market Funds
Ohio Tax-Exempt Money Market Ohio Tax-Exempt Money Market Funds
Other States Tax-Exempt Money Market Other States Tax-Exempt Money Market Funds
Pennsylvania Tax-Exempt Money Market Pennsylvania Tax-Exempt Money Market Funds
Tax-Exempt Money Market Tax-Exempt Money Market Funds
U.S. Government Money Market U.S. Government Money Market Funds
U.S. Treasury U.S. Treasury Money MarketFunds
SPECIALTY/OTHER
Convertible Securities Convertible Securities Funds
Dedicated Short Bias Dedicated Short Bias Funds
Equity Market Neutral Equity Market Neutral Funds
Extended U.S. Large-Cap Core Extended U.S. Large-Cap Core Funds
Flexible Income Flexible Income Funds
Loan Participation Loan Participation Funds
Long/Short Equity Long/Short Equity Funds
Specialty Diversified Equity Specialty Diversified Equity Funds
Treasury Inflation Protected Securities Treasury Inflation Protected Securities Funds
OCTOBER 2013 7
WWW.SPCAPITALIQ.COMS&P CAPITAL IQ’S MUTUAL FUND RANKING METHODOLOGY These narrow classifications allow for detailed peer comparisons of a fund’s performance track record and key characteristics such as its standard deviation, expense ratio and turnover rate, all of which are incorporated into the S&P Capital IQ’s Mutual Fund Ranking and shown in detail on S&P Capital IQ Mutual Fund reports. S&P Capital IQ Mutual Fund Ranking Inputs S&P Capital IQ Mutual Fund Rankings provide quantitative and holistic assessment of the perfor- mance, risk profile and relative costs of a given fund compared to other mutual funds in its cate- gory, following a normalized distribution curve. This overall Mutual Fund Ranking is based on a weighted-average computation of three compo- nents- performance analytics, risk considerations and cost factors that evaluate, relative to its peers, a fund’s underlying holdings, its historical performance and key fund-level characteristics. Holdings-based inputs are important components of the overall Performance and Risk analyses, and as a result, S&P Capital IQ has tailored its mutual fund ranking methodology for each of the covered asset categories to incorporate the holdings-based inputs (shown boxed in red) that we believe are most appropriate for each fund type. Figure 2: OCTOBER 2013 8 WWW.SPCAPITALIQ.COM
S&P CAPITAL IQ’S MUTUAL FUND RANKING METHODOLOGY

Performance Analytics
The first component of the S&P Capital IQ’s Mutual Fund Ranking, Performance Analytics, is a
combination of a fund’s 3- and 1-year track records relative to its peer group and a holdings-anal-
ysis relevant to its Category:

• Within the Domestic Equity and Global Equity Categories, this utilizes two bottom-up approaches
  from S&P Capital IQ’s Equity Research Services, S&P Capital IQ STARS and S&P Capital IQ Fair
  Value, to rank stocks based on their qualitatively- and quantitatively-driven S&P rankings. These
  components are based on the holdings-weighted average ranking of all available holdings using
  the fund’s latest available portfolio information. This is combined with a comparison of a fund’s
  past performance relative to its peer group.

• Within the Fixed Income Categories, the ranking assesses a 30-day SEC Yield component, as
  income generation and capital preservation are top priorities for bond fund investors.
  S&P Capital IQ compares a fund’s yield across all of the funds within the Category and couple that
  with an assessment of its track record versus peers.

• For Blended Funds, which typically hold both stocks and bonds, the ranking methodology marries
  the approaches used for equity and fixed income funds. Blended funds that invest in individual
  securities are ranked using S&P Capital IQ STARS, the fund’s 12-month yield compared to funds
  within the Category, and its historical performance relative to its peer group.

• Finally, for Blended Funds that are funds of funds, S&P Capital IQ assesses the quality of the
  underlying funds in the portfolio, ranking funds based on the holdings-weighted S&P Capital IQ
  Performance Analytics assessment of the underlying mutual funds held in the portfolio, plus its
  respective yield compared to similar funds.

In sum, funds with a strong track record that invest in undervalued and/or high-quality securities
are favored by the S&P Capital IQ methodology.

Risk Considerations
Stocks and bonds are subject to a variety of credit, earnings consistency and interest-rate risks
that must be accounted for in selecting a fund. The second component, Risk Considerations, uses
a combination of inputs, based on the mutual fund’s holdings and track record, to judge the fund’s
risk. Holdings-based inputs, again, are chosen relative to the fund’s category:

• For Equity funds, S&P Capital IQ assesses risk using the S&P Capital IQ Quality Rankings and
  Standard & Poor’s issuer Credit Ratings of the underlying holdings in the portfolio. The former
  incorporates the growth and stability of a common stock’s earnings and dividends with higher
  ranked stocks deemed as having below average risk. The latter element uses opinions issued
  by Stanrdard & Poor’s Ratings Services, a nationally recognized statistical rating organization
  (separate from S&P Capital IQ) to provide a forward-looking opinion of an obligor’s overall finan-
  cial capacity (its creditworthiness) to pay its financial obligations.

• For Fixed Income funds, S&P Capital IQ uses issue ratings from Standard & Poor’s Ratings
  Services, or other nationally recognized statistical rating organizations if an issue is not rated by
  Standard & Poor’s. The ranking methodology gives preference to Standard & Poor’s credit ratings.
  Changes to the credit ratings may result in a change in the component and/or overall rankings.

OCTOBER 2013                                                                                         9
WWW.SPCAPITALIQ.COM
S&P CAPITAL IQ’S MUTUAL FUND RANKING METHODOLOGY

  This credit rating component is an offset of the 30-day SEC yield component used in the Per-
  formance Analytics ranking, as yield and credit quality generally have an inverse relationship. In
  addition, S&P Capital IQ uses the calculated weighted-average effective duration for the securi-
  ties in the portfolio, compared to similar funds, to measure the bond prices’ responsiveness to
  changes in the prevailing interest rates, which we believe is a useful tool for judging the riskiness
  of a bond fund.

• For Blended Funds that invest in individual securities, S&P Capital IQ analyzes the credit quality
  of the stocks and bonds in the portfolio using the blended Credit Rating metrics referenced above
  for the equity and fixed income methodologies.

• Meanwhile, S&P Capital IQ replaces the credit rating input factor for Blended Funds that are fund
  of funds, instead judging the fund based on the holdings-weighted average. S&P Capital IQ Risk
  Considerations assessment of the underlying mutual funds held in the portfolio. The rankings also
  include a component for debt (fund) exposure, ranking a fund with a larger percentage of assets
  in bonds or bond funds higher due to its inherently expected lower risk profile it has compared to
  a peer with large exposure to stocks. S&P believes that this tool is especially important in assess-
  ing target date funds, many of which have high stock exposure and elevated risk despite having
  near-term target dates.

In addition to these holdings-based inputs, all S&P Capital IQ Mutual Fund Rankings incorporate
two or more risk assessments of the fund’s track record: standard deviation, Sharpe Ratio and
manager tenure. Standard Deviation is a historical measure of the variability of a fund’s returns
compared to its peers; if a fund has a high standard deviation its returns have been volatile and it
could be a challenge to duplicate its track record. Meanwhile, a fund’s Sharpe Ratio is a measure of
a fund’s historical returns adjusted for risk, or volatility when compared to its peer group. The last
risk element S&P Capital IQ employs is a judgment of portfolio management’s tenure. If the lead
manager has changed within the past three calendar years, S&P Capital IQ believes that there is
an increased level of risk that the investment style, the holdings, and the track record are going to
change- perhaps for the better, perhaps for the worse; for new share classes of existing portfolios
under coverage, S&P Capital IQ uses the tenure from the older fund to calculate the ranking input.

In sum, with regard to Risk Considerations, the S&P Capital IQ methodology favor funds that invest
in what are believed to be high-quality securities, generate consistent, risk-adjusted returns and
have a stable management team.

Cost Factors
S&P Capital IQ has broken cost down into three areas that are analyzed in developing the ranking:
Expense ratio, Turnover and Sales Load.

Compared to its peers, a fund with a below-average net Expense Ratio, which factors in a fund’s
management fees and other expenses, is viewed favorably. For example, Large Cap Growth funds
are compared with each other, as are Emerging Market Debt funds. Similarly, funds with a below-
average turnover rate are ranked positively by S&P Capital IQ due to their lower trading costs. Lastly,
a fund that does not charge a front-end sales load is, in general, ranked higher compared to those
funds that charge as much as 5.75% at the time of purchase. A fund’s share classes (A, B, C and
Institutional) are evaluated independently, as their individual expense structures produce different
returns.

For a fund to rank positively for cost factors, in general it should have relatively low expenses and
turnover without charging a sales load.

OCTOBER 2013                                                                                            10
WWW.SPCAPITALIQ.COM
S&P CAPITAL IQ’S MUTUAL FUND RANKING METHODOLOGY

Component Rankings
The S&P Capital IQ component rankings are represented as Positive, Neutral or Negative indica-
tions, following a normalized distribution curve:

        Positive component rankings are assigned to funds whose weighted-average score
        is in approximately the top quartile of its asset category’s universe, applying a
        normalized distribution curve.
        Neutral component rankings are assigned to funds whose weighted-average score
        is in about the second or third quartiles of its asset category’s universe, applying a
        normalized distribution curve.
        Underweight component rankings are assigned to funds whose weighted-average
        score is in approximately the bottom quartile of its asset category’s universe,
        applying a normalized distribution curve.

In cases where sufficient analytical measures are not available on underlying assets, the compo-
nent ranking will not be displayed.

S&P Capital IQ Mutual Fund Rankings
Despite this updated ranking methodology, S&P has retained the one through five star ranking
terminology employed since 1997, as S&P believes this simplifies fund screening and research. The
S&P Rankings range from five-star (highest) to one-star (lowest) and follow a normalized distri-
bution curve, based upon the fund’s rank in its Category. For example, the top 10% of all Domestic
Equity funds or Taxable Fixed Income funds are ranked as five-star funds.

Figure 3

        10%                 20%                 40%                 20%                 10%

The methodology is peer-group agnostic, and as such there might be several dozen five-star funds
within a peer group or three, depending upon the outcome of the underlying components.

Rankings are refreshed on a weekly basis to incorporate the latest inputs from the holdings-based
analysis and the latest relative performance review.

Conclusion
S&P believes that risk-adjusted past performance should be the beginning of a search for a mutual
fund -- but not the end. By conducting holdings- based analysis and factoring in various perfor-
mance, risk and cost components, the Standard & Poor’s Mutual Fund Ranking system provides
holistic insight into how a fund is currently positioned, rather than solely looking at past perfor-
mance. And by leveraging both S&P’s well-established stock and bond research and a new and
more robust style classification in a quantitative application, S&P seeks to ensure consistency and

OCTOBER 2013                                                                                      11
WWW.SPCAPITALIQ.COM
S&P CAPITAL IQ’S MUTUAL FUND RANKING METHODOLOGY
transparency in the ranking methodology.
Rather than assuming that a fund with an above average track record can continue its track record,
the S&P Ranking provides a more robust view on the attractiveness and risk profiles of the securi-
ties in the fund along with the ability to screen on key characteristics. S&P believes that mutual
fund rankings should not be the sole basis for making investment decisions and past performance
is not indicative of future results.
Frequently Asked Questions about S&P’s Mutual Fund Rankings
Why could a fund’s Mutual Fund ranking improve from one week to the next?
Weekly changes, while not regular, are the result of changes in input factors.
The following are some examples as to why a fund’s ranking may be higher than before:
• The fund’s relative performance vs. its peer group improved.
• The S&P Capital IQ’s opinion on the stocks the fund owns improved. For example, the fund has a
large stake in a stock that S&P Capital IQ’s Equity Research Services upgraded to strong buy from
hold during the week.
• The credit ratings on the bonds held by the fund were upgraded. For example, if the fund has a
large stake in a bond that Standard & Poor’s Rating Services upgraded to AA- from A+.
• The fund’s expense ratio, when compared with its peers, improved.
• The fund hit its 3 year anniversary, allowing performance and standard deviation to be compared
with those of its peer group.
Why did fund 1 get a different S&P Mutual Fund ranking than fund 2?
• Check to see if the two funds are in the same peer group. Some of the factors used to rank a
fund, such as historical performance, standard deviation, and turnover, are dependent upon how
the fund compares to its peer group (such as all large cap growth funds). Other factors, such as
the SEC yield, Fair Value and debt exposure, are dependent upon how the fund compares to its
category. Finally, one fund might, in the view of S&P Capital IQ, own more overvalued stocks, take
on more risk or have higher cost factors based on S&P Capital IQ’s analysis.
• If the two funds under consideration are share classes of the same portfolio, the different rank-
ings are likely due to the different load structures or inception dates. A fund with a sales load or a
higher net expense ratio would likely have a less favorable cost consideration ranking.
Why did a fund not get an S&P Mutual Fund ranking?
There are only a couple of reasons a fund would not get a ranking.
• The fund does not supply holdings information to allow S&P Capital IQ to make an assessment.
• The fund falls into one of the following categories that are not ranked by S&P Capital IQ
√√ Money Market funds
√√ Specialty/Other funds
√√ The following is not a reason:
∆∆ The fund is less than three years old. An S&P Capital IQ ranking is not reliant on a fund
having three years of performance history.
What makes one equity fund a five-star fund and another one a three-star fund?
S&P Capital IQ assesses mutual funds using three main components in comparison to its peers:
Performance Analytics, Risk Considerations, and Cost Factors. The following are characteristics of a
typical five-star equity fund:
• Performance Analytics is positive due to a combination of an above-average 1- and 3-year track
OCTOBER 2013 12
WWW.SPCAPITALIQ.COMS&P CAPITAL IQ’S MUTUAL FUND RANKING METHODOLOGY record and investment in stocks that S&P Capital IQ views as undervalued, using a qualitative and/or quantitative approach. • Risk Factors is positive due to a combination of investments in stocks that S&P Capital IQ deems to have low risk based on their credit metrics and/or their earnings and dividend stability; to hav- ing a manager with at least a three year record at the fund; to generating risk-adjusted returns above those of its peers; to having low variability of returns compared to its peers. • Cost factors are positive if a fund has no sales load and has below-average turnover and/or net expenses compared to its peers. A five-star fund is a fund whose composite score for the above falls in the top 10% of the Domestic Equity, Global Equity or International Equity Categories. Most peer groups will be represented by at least one five-star fund, but S&P Capital IQ does not require a certain minimum. How does S&P pick peer groups for the fund? How is the peer group utilized? A fund’s peer group consists of all the funds within the same Lipper classification, which uses a combination of holdings-based and prospectus language-based models. Lipper will review a fund’s classification twice per year based on the fund’s annual and semiannual portfolio holdings. Alterna- tively, the fund can also place an ad-hoc request for a classification re-evaluation. The equity peer groups include distinctions for market cap size (large-, mid-, small-, or multi-cap), types of invest- ments (growth, core, value), and domicile (domestic, international, region- or country-specific). A fund is compared to its peer group to judge its performance track record and to gauge fund- specific characteristics such as debt exposure, Sharpe ratio and turnover. How often are the rankings updated? What about holdings info? A fund’s ranking and pricing data will be refreshed every week, reflecting updated performance and any changes to S&P Capital IQ’s assessments of the individual holdings as of the close of trading on the prior Friday. Certain factors, such as SEC yield and turnover, will be refreshed monthly if new data is available. Most fund rankings will not change week-toweek, but this updated information will capitalize on changing fundamentals of the mutual fund and its individual holdings. Note that S&P Capital IQ rankings are not recommendations to buy or sell a particular fund. Mutual fund reports will use the latest available holdings information provided by the fund family. Many funds update those holdings monthly, while others deliver holdings only quarterly and occa- sionally there can be a lag as the data is analyzed. What characteristics does S&P Capital IQ favor for a Fixed Income fund? S&P Capital IQ believes that a top-quality bond fund has the following characteristics: • A strong track record compared to similar peers (such as taxable high yield or short-term gov- ernment) and a stable management team. • An above-average SEC yield that is balanced by investment in securities with moderate debt rat- ings and moderate duration. Low expenses and turnover when compared to its peer group. OCTOBER 2013 13 WWW.SPCAPITALIQ.COM
S&P CAPITAL IQ’S MUTUAL FUND RANKING METHODOLOGY
Appendix
S&P STARS Performance
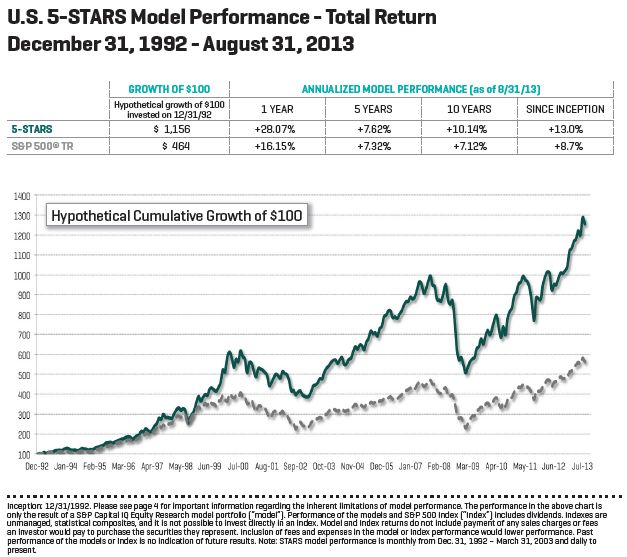
The hypothetical growth of $100 based on S&P 5 STARS model performance for the period shown
would have been worth $1,556 (please update) at the end of August 2010 compared to $433 based
on the return of the S&P 500 Index for the same time period
Figure 4
Please see the below disclosure for important information regarding the inherent limi-
tations of model performance. Past performance of STARS and the S&P 500 index are
not necessarily indicative of future results. STARS performance excludes the reinvest-
ment of dividends and fees and expenses. Indexes are unmanaged, statistical com-
posites and their returns do not include payment of any sales charges or fees an in-
vestor would pay to purchase the securities they represent. It is not possible to invest
directly in an index. Inclusion of fees and expenses in the model portfolio and S&P 500 in-
dex would lower performance. The S&P 500 Index excludes the reinvestment of dividends.
The U.S. STARS model performance graph is only an illustration of Standard & Poor’s (S&P)
research; it shows how stocks that received particular STARS rankings performed. STARS catego-
ries are models only; they are not collective investment funds. The STARS performance does not
show how any actual portfolio has performed. STARS model performance does not represent the
OCTOBER 2013 14
WWW.SPCAPITALIQ.COMS&P CAPITAL IQ’S MUTUAL FUND RANKING METHODOLOGY results of actual trading of investor assets. Thus, the model performance shown does not reflect the impact that material economic and market factors might have had on decision-making if actual investor money had been managed. While model performance for some or all STARS categories performed better than the S&P 500 for the period shown, the performance during any shorter period may not have, and there is no assurance that they will perform better than the S&P 500 in the future. STARS does not take into account any particular investment objective, financial situation or need and is not intended as an investment recommendation or strategy. Investments based on the STARS methodology may lose money. High returns are not necessarily the norm and there is no assurance that they can be sustained. Past model performance of STARS is no guarantee of future performance. For model performance calculation purposes, the stocks within each STARS category at December 31, 1986 were equally weighted. Thereafter, additions to the composition of the stocks in each STARS category are made at the average value of the STARS category at the preceding month end with no rebalancing. Deletions are made at the closing price of the day that the deletion is made. Performance was calculated from inception through March 31, 2003 on a monthly basis. Thereafter, performance is calculated daily. Stocks in each STARS category will change over time, and some or all of the stocks that received STARS rankings during the time period shown may not have main- tained their STARS ranking during the entire period. The model performance does not consider taxes, reinvestment of dividends and brokerage commis- sions, nor does it reflect the deduction of any advisory or other fees charged by S&P Investment Advisory Services (SPIAS), advisors, or other parties that investors will incur when their accounts are managed in accordance with the model. The imposition of these fees and charges would cause actual performance to be lower than the performance shown. For example, if the model returned 10 percent on a $100,000 investment for a 12-month period (or $10,000) and an annual asset- based fee of 1.5 percent were imposed at the end of the period (or $1,650), the net return would be 8.35 percent (or $8,350) for the year. Over 3 years, an annual 1.5% fee taken at year end with an assumed 10% return per year would result in a cumulative gross return of 33.1%, a total fee of $5,375 and a cumulative net return of 27.2% (or $27,200). Fees deducted on a frequency other than annual would result in a different cumulative net return in the preceding example. The Standard & Poor’s 500 index is the benchmark for U.S. STARS. The S&P 500 index is calcu- lated in U.S. dollars and does not take into account the reinvestment of dividends. Indexes are unmanaged, statistical composites and their returns do not include payment of any sales charges or fees an investor would pay to purchase the securities they represent. Such costs would lower performance. It is not possible to invest directly in an index. The S&P 500 index includes a different number of holdings and has different risk characteristics than the STARS stocks. Some of the STARS stocks may have been included in the S&P 500 index for some (but not necessarily all) of the period covered in the chart, and some such stocks may not have been included at all. The method- ology for calculating the return of the S&P 500 index differs from the methodology of calculating the return for STARS. Past performance of the S&P 500 index is no guarantee of future perfor- mance. An investment based upon the model should only be made after consulting with a financial advisor and with an understanding of the risks associated with any investment in securities, including, but not limited to, market risk, currency risk, political and credit risks, the risk of economic recession and the risk that issuers of securities or general stock market conditions may worsen, over time. OCTOBER 2013 15 WWW.SPCAPITALIQ.COM
S&P CAPITAL IQ’S MUTUAL FUND RANKING METHODOLOGY

Foreign investing involves certain risks, including currency fluctuations and controls, restrictions on
foreign investments, less governmental supervision and regulation, less liquidity and the potential
for market volatility and political instability. As with any investment, investment returns and prin-
cipal value will fluctuate, so that when redeemed, an investor’s shares may be worth more or less
than their original cost.

The equity research reports and recommendations provided by Standard & Poor’s Equity Research
are performed separately from any other analytic activity of S&P. S&P’s Equity Research has no
access to non-public information received by other units of S&P. S&P does not trade for its own
account.

Glossary
S&P Fair Value Rank
Using S&P’s exclusive proprietary quantitative model, stocks are ranked in one of five groups,
ranging from Group 5, listing the most undervalued stocks relative to the Fair Value universe, to
Group 1, the most overvalued issues relative to the Fair Value universe. Group 5 stocks are expected
to generally outperform all others. The Fair Value rankings imply the following relative to the Fair
Value universe: 5-Stock is significantly undervalued; 4-Stock is moderately undervalued; 3-Stock is
fairly valued; 2-Stock is modestly overvalued; 1-Stock is significantly overvalued. The time horizon
of the Fair Value model is six months. As an input to the S&P ETF Ranking Methodology, S&P
evaluates the weighted average Fair Value Rank of the underlying holdings of the ETF compared
with its category.

S&P Capital IQ STARS
Since January 1, 1987, Standard and Poor’s Equity Research Services has ranked a universe of
common stocks based on a given stock’s potential for future performance. Under proprietary STARS
(STock Appreciation Ranking System), S&P equity analysts rank stocks according to their individual
forecast of a stock’s future total return potential versus the expected total return of a relevant
benchmark (e.g., a regional index (S&P Asia 50 Index, S&P Europe 350 Index or S&P 500 Index)),
based on a 12-month time horizon.

5-STARS (Strong Buy): Total return is expected to outperform the total return of a relevant bench-
mark by a wide margin over the coming 12 months, with shares rising in price on an absolute basis.

4-STARS (Buy): Total return is expected to outperform the total return of a relevant bench mark
over the coming 12 months, with shares rising in price on an absolute basis.

3-STARS (Hold): Total return is expected to closely approximate the total return of a relevant
benchmark over the coming 12 months, with shares generally rising in price on an absolute basis.

2-STARS (Sell); Total return is expected to underperform the total return of a relevant benchmark
over the coming 12 months, and the share price is not anticipated to show a gain.

1-STARS (Strong Sell): Total return is expected to underperform the total return of a relevant
benchmark by a wide margin over the coming 12 months, with shares falling in price on an absolute
basis.

As an input to the S&P ETF Ranking Methodology, S&P evaluates the weighted average STARS of the
underlying holdings of the ETF compared with its category.

OCTOBER 2013                                                                                        16
WWW.SPCAPITALIQ.COM
S&P CAPITAL IQ’S MUTUAL FUND RANKING METHODOLOGY

Standard &Poor’s Issue Credit Rating
A Standard & Poor’s issue credit rating is a forward-looking opinion about the creditworthiness of
an obligor with respect to a specific financial obligation, a specific class of financial obligations,
or a specific financial program (including ratings on medium-term note programs and commer-
cial paper programs). It takes into consideration the creditworthiness of guarantors, insurers,
or other forms of credit enhancement on the obligation and takes into account the currency in
which the obligation is denominated. The opinion reflects Standard & Poor’s view of the obligor’s
capacity and willingness to meet its financial commitments as they come due, and may assess
terms, such as collateral security and subordination, which could affect ultimate payment in the
event of default. Issue credit ratings can be either long term or short term. Short-term ratings are
generally assigned to those obligations considered short-term in the relevant market. In the U.S.,
for example, that means obligations with an original maturity of no more than 365 days including
commercial paper. Short-term ratings are also used to indicate the creditworthiness of an obligor
with respect to put features on long-term obligations. The result is a dual rating, in which the short-
term rating addresses the put feature, in addition to the usual long-term rating. Medium-term
notes are assigned long-term ratings.

The S&P issue credit rating is an input to the S&P Mutual Fund Ranking for Fixed Income funds.

Standard &Poor’s Issuer Credit Rating
A Standard & Poor’s Issuer Credit Rating (Issuer Credit Rating) is a current opinion of an obligor’s
overall financial capacity (its creditworthiness) to pay its financial obligations. This opinion focuses
on the obligor’s capacity and willingness to meet its financial commitments as they come due with
AAA as the highest and D as the lowest rating. It does not apply to any specific financial obliga-
tion, as it does not take into account the nature of and provisions of the obligation, its standing in
bankruptcy or liquidation, statutory preferences, or the legality and enforceability of the obligation.
In addition, it does not take into account the creditworthiness of the guarantors, insurers, or other
forms of credit enhancement on the obligation. Issuer Credit Ratings are based on current informa-
tion furnished by obligors or obtained by Standard & Poor’s from other sources it considers reli-
able. Standard & Poor’s does not perform an audit in connection with any Issuer Credit Rating and
may, on occasion, rely on unaudited financial information. Issuer Credit Ratings may be changed,
suspended, or withdrawn as a result of changes in, or unavailability of, such information, or based
on other circumstances.

An Issuer Credit Rating is not a recommendation to purchase, sell, or hold a financial obligation
issued by an obligor, as it does not comment on market price or suitability for a particular investor.

Credit Ratings are issued by S&P Ratings Services, a nationally recognized statistical rating organi-
zation, which is separate from S&P Equity Research, are issued based on criteria published by S&P
Ratings Services, and are subject to the terms and conditions stated in the Ratings Services publi-
cations. Visit www.sandp.com for definitions, criteria documents and additional details.

As an input to the S&P ETF Ranking Methodology, S&P evaluates the Credit Ratings of the under-
lying holdings of the ETF compared with its category.

Credit Rating
Represents the credit rating from one of three credit rating agencies: S&P, Fitch, and Moody’s,
covering bond securities of corporate, government, mortgage backed securities, asset backed
securities, and municipal bonds

OCTOBER 2013                                                                                         17
WWW.SPCAPITALIQ.COM
S&P CAPITAL IQ’S MUTUAL FUND RANKING METHODOLOGY

S&P Capital IQ Quality Rank
Historical growth and stability of earnings and dividends are deemed key elements in establishing
S&P’s Quality Rankings for common stocks, which are designed to encapsulate the nature of this
record in a single symbol. It should be noted, however, that the process also takes into consid-
eration certain adjustments and modifications deemed desirable in establishing such rankings.
The final score for each stock is measured against a scoring matrix determined by analysis of
the scores of a large and representative sample of stocks. The range of scores in the array of this
sample has been aligned with the following ladder of rankings; A+ Highest, A High, A-Above Average,
B+ Average, B Below Average, B-Lower, C Lowest, D In Reorganization, NR Not Ranked. As an input
to the S&P Mutual Fund Ranking for Equity funds, S&P evaluates the weighted average S&P Quality
Rank of the underlying holdings of the mutual fund compared with its peers.

12-Month Yield
A measure of the rate of return on the income distributions in the past 12 months. The yield is
computed by dividing the sum of the income dividends paid during the previous twelve months (or
the previous 52 weeks for periods ending at any time other than month-end) by the latest NAV or
market price/maximum offer price, adjusted for capital gains distributions. (The adjusted ending
NAV/Market Price is calculated as the ending NAV/Market Price plus 100% of cap gains within last 3
months plus 50% of the cap gains between the last 4 to 9 months.). As an input to the S&P Mutual
Fund ranking for Blended and Blended Funds of funds, S&P evaluates the fund’s yield compared
with its category.

30-Day SEC Yield
The SEC yield, reported by the fund, is based on a 30-day period ending on the last day of the
previous month. As an input to the S&P Mutual Fund Ranking for Fixed Income funds, S&P evaluates
the SEC yield compared with its category.

Manager Tenure
S&P gives a stronger ranking to funds whose manager has an established tenure with the portfolio;
a manager with at least three full calendar years at the helm would be ranked positively for this Risk
Considerations factor. For team-managed funds, individual changes in team composition are not
captured.

Holdings Average Performance
The weighted average S&P Performance Analytics ranking of the underlying mutual funds that
make up a Fund of Funds’ portfolio.

Holdings Average Risk
The weighted average S&P Risk Considerations ranking of the underlying mutual funds that make
up a Fund of Funds’ portfolio.

Debt Exposure
As an input to the S&P Mutual Fund Ranking for Blended funds, funds with higher debt exposure
versus their peers are ranked positively.

OCTOBER 2013                                                                                       18
WWW.SPCAPITALIQ.COM
S&P CAPITAL IQ’S MUTUAL FUND RANKING METHODOLOGY

Disclosures
ABOUT S&P CAPITAL IQ’S DISTRIBUTORS’ DISCLOSURES
S&P Capital IQ’s Bond Reports (“Research Reports”) have been prepared and issued by S&P Capital IQ and/or one of
its affiliates. In the United States, Research Reports are prepared by Standard & Poor’s Investment Advisory Services
LLC (“SPIAS”) and issued by Standard & Poor’s Financial Services LLC (“S&P”). SPIAS is authorized and regulated by
the U.S. Securities and Exchange Commission; in the United Kingdom, Research Reports are issued by McGraw-Hill
Financial Research Europe Limited (“MHFRE”), which is authorized and regulated by the Financial Conduct Authority
and trades as Standard & Poor’s; in Hong Kong, Research Reports are issued by Standard & Poor’s Investment Advisory
Services (HK) Limited, which is regulated by the Hong Kong Securities Futures Commission; in Singapore, Research
Reports are issued by McGraw-Hill Financial Singapore Pte. Limited (“MHFSPL”), which is regulated by the Monetary
Authority of Singapore; in Malaysia, Research Reports are issued by Standard & Poor’s Malaysia Sdn Bhd (“S&PM”),
which is regulated by the Securities Commission of Malaysia; in Australia, Research Reports are issued by Standard &
Poor’s Information Services (Australia) Pty Ltd (“SPIS”), which is regulated by the Australian Securities & Investments
Commission; and in Japan, Research Reports are issued by McGraw-Hill Financial Japan KK, which is registered by
Kanto Financial Bureau.
S&P Capital IQ or an affiliate may license certain intellectual property or provide pricing or other services to, or other-
wise have a financial interest in, certain issuers of securities, including exchange-traded investments whose invest-
ment objective is to substantially replicate the returns of a proprietary index of S&P Dow Jones Indices, such as the S&P
500. In cases where S&P Capital IQ or an affiliate is paid fees that are tied to the amount of assets that are invested in
the fund or the volume of trading activity in the fund, investment in the fund will generally result in S&P Capital IQ or an
affiliate receiving compensation in addition to the subscription fees or other compensation for services rendered by
S&P Capital IQ. A reference to a particular investment or security by S&P Capital IQ and/or one of its affiliates is not a
recommendation to buy, sell, or hold such investment or security, nor is it considered to be investment advice.
S&P Capital IQ and its affiliates provide a wide range of services to, or relating to, many organizations, including issuers
of securities, investment advisers, broker-dealers, investment banks, other financial institutions and financial interme-
diaries, and accordingly may receive fees or other economic benefits from those organizations, including organizations
whose securities or services they may recommend, rate, include in model portfolios, evaluate or otherwise address.
S&P Capital IQ, its affiliates, and any third-party providers, as well as their directors, officers, shareholders, employees
or agents (collectively, “S&P Parties”) do not guarantee the accuracy, completeness or adequacy of this material, and
S&P Parties shall have no liability for any errors, omissions, or interruptions therein, regardless of the cause, or for the
results obtained from the use of the information provided by the S&P Parties. S&P PARTIES DISCLAIM ANY AND ALL
EXPRESS OR IMPLIED WARRANTIES, INCLUDING, BUT NOT LIMITED TO, ANY WARRANTIES OF MERCHANTABILITY, SUIT-
ABILITY OR FITNESS FOR A PARTICULAR PURPOSE OR USE. In no event shall S&P Parties be liable to any party for any
direct, indirect, incidental, exemplary, compensatory, punitive, special or consequential damages, costs, expenses, legal
fees, or losses (including, without limitation, lost income or lost profits and opportunity costs) in connection with any
use of the information contained in this document even if advised of the possibility of such damages.
Ratings from Standard & Poor’s Ratings Services are statements of opinion as of the date they are expressed and not
statements of fact or recommendations to purchase, hold, or sell any securities or to make any investment decisions.
Standard & Poor’s assumes no obligation to update its opinions following publication in any form or format. Standard
& Poor’s ratings should not be relied on and are not substitutes for the skill, judgment and experience of the user, its
management, employees, advisors and/or clients when making investment and other business decisions. Standard &
Poor’s rating opinions do not address the suitability of any security. Standard & Poor’s does not act as a fiduciary. While
Standard & Poor’s has obtained information from sources it believes to be reliable, Standard & Poor’s does not perform
an audit and undertakes no duty of due diligence or independent verification of any information it receives.
S&P Capital IQ keeps certain activities of its business units separate from each other in order to preserve the inde-
pendence and objectivity of their respective activities. As a result, certain business units of S&P Capital IQ may have
information that is not available to other S&P Capital IQ business units. S&P Capital IQ has established policies and
procedures to maintain the confidentiality of certain non-public information received in connection with each analyti-
cal process.
Standard & Poor’s Ratings Services does not participate in the development of Research Reports. Standard & Poor’s
may receive compensation for its ratings and certain credit-related analyses, normally from issuers or underwriters of
securities or from obligors. Standard & Poor’s reserves the right to disseminate its opinions and analyses. Standard &
Poor’s public ratings and analyses are made available on its Web sites, www.standardandpoors.com (free of charge),
and www.ratingsdirect.com and www.globalcreditportal.com (subscription), and may be distributed through other
means, including via Standard & Poor’s publications and third-party redistributors. Additional information about our
ratings fees is available at www.standardandpoors.com/usratingsfees.
The Research Reports use evaluated pricing provided by Standard & Poor’s Securities Evaluations, Inc. (SPSE) and
credit ratings provided by Standard & Poor’s Ratings Services. SPSE is part of S&P Capital IQ. SPSE is registered as
an investment adviser with the U.S. Securities and Exchange Commission, and its advisory services include evaluated
pricing. Valuations are opinions and not statements of fact or recommendations to purchase, hold or sell any security or
instrument, or to make any investment decisions. Credit rating criteria and scales may differ among credit rating agen-
cies. Ratings assigned by other credit rating agencies may reflect more or less favorable opinions of creditworthiness
than ratings assigned by Standard & Poor’s Ratings Services.
Each Research Report is not directed to, or intended for distribution to or use by, any person or entity who is a citizen or
resident of or located in any locality, state, country or other jurisdiction where such distribution, publication, availability
or use would be contrary to law or regulation or which would subject S&P Capital IQ or its affiliates to any registration or
licensing requirements in such jurisdiction.
Copyright © 2013 Standard & Poor’s Financial Services LLC. All rights reserved. STANDARD & POOR’S, S&P and STARS
are registered trademarks of Standard & Poor’s Financial Services LLC. CAPITAL IQ is a registered trademark of Capital
IQ, Inc. S&P CAPITAL IQ is a trademark of Standard & Poor’s Financial Services LLC.

OCTOBER 2013                                                                                                               19
WWW.SPCAPITALIQ.COM
You can also read