Genome-Wide Analysis Reveals Human-Mediated Introgression from Western Pigs to Indigenous Chinese Breeds - MDPI
←
→
Page content transcription
If your browser does not render page correctly, please read the page content below
Article

Genome-Wide Analysis Reveals Human-Mediated
Introgression from Western Pigs to Indigenous
Chinese Breeds
Jue Wang 1, Chengkun Liu 2, Jie Chen 1, Ying Bai 3, Kejun Wang 4, Yubei Wang 1 and
Meiying Fang 1,*
 1 National Engineering Laboratory for Animal Breeding, MOA Laboratory of Animal Genetics and
 Breeding, Beijing key Laboratory for Animal Genetic Improvement,
 College of Animal Science and Technology, Department of Animal Genetics and Breeding, China
 Agricultural University, Beijing 100193, China; tctcttc@hotmail.com (J.W.); chenjie0710@nibs.ac.cn (J.C);
 pq007007@hotmail.com (Y.W)
 2 Berry Genomics Corporation, Beijing 102206, China; singfw@cau.edu.cn

 3 College of Life Sciences and Food Engineering, Hebei University of Engineering, Handan, Hebei 056038,

 China; baiyinghelen@gmail.com
 4 College of Animal Science and Veterinary Medicine, Henan Agricultural University, Zhengzhou 450002,

 China; wangkejun.me@163.com
 * Correspondence: meiying@cau.edu.cn; Tel.: +86-10-62734943

 Received: 17 January 2020; Accepted: 29 February 2020; Published: 4 March 2020

 Abstract: Genetic variations introduced via introgression from Western to Chinese pigs have
 contributed to the performance of Chinese breeds in traits such as growth rate and feed conversion
 efficiency. However, little is known about the underlying genomic changes that occurred during
 introgression and the types of traits affected by introgression. To address these questions, 525
 animals were characterized using an SNP array to detect genomic regions that had been
 introgressed from European to indigenous Chinese breeds. The functions of genes located in
 introgressed regions were also investigated. Our data show that five out of six indigenous Chinese
 breeds show evidence of introgression from Western pigs, and eight introgressed genome regions
 are shared by five of the Chinese breeds. A region located on chr13: 12.8–13.1 M was affected by
 both introgression and artificial selection, and this region contains the glucose absorption related
 gene, OXSM, and the sensory related gene, NGLY. The results provide a foundation for
 understanding introgression from Western to indigenous Chinese pigs.

 Keywords: pigs; genome-wide variation; introgression; artificial selection

1. Introduction
 Domesticated pigs are one of the most numerous large mammals on the planet [1,2] and have a
wide range of distinct morphological and behavioral characteristics, as compared to their wild
progenitors [3]. Based on current evidence, pigs were domesticated independently in Anatolia [4,5]
and the Mekong Valley [6] about 9000 years before the common era (BCE). Thus, two domestication
centers, located in Europe and Asia, have contributed to the modern pig germline.
 Introgression is common in animals and has been reported widely [7–12]. It can happen not only
between wild ancestors and their domesticated offspring, but also among domesticated animals.
Introgression between wild and domesticated populations usually occurs in adjacent areas, as has
been the case for pigs [8,13,14], sheep [9], dogs [11], and chickens [7,10,12]. Most introgression among

Genes 2020, 11, 275; doi:10.3390/genes11030275 www.mdpi.com/journal/genes
Genes 2020, 11, 275 2 of 12

domesticated animals has been the result of their strict management by humans [15]. For example,
human-mediated introgression has been detected in cattle breeds [16].
 Management effects, especially the crossbreeding between Asian and European pigs, have
played an important role in pig breeding. Pig admixture between Asia and Europe became common
in the mid-to-late 18th century [3]. Chinese Meishan pigs were introduced into Europe to improve
reproductive traits [17], resulting in the development of modern breeds such as Yorkshire (i.e., Large
White), Berkshire, and Hampshire [18,19]. In the late 18th century, Chinese pigs were also imported
to America [14] and crossed with local pigs for performance improvement [20]. Variations in
mitochondrial DNA have been used to confirm that indigenous Chinese pigs were imported into
Europe and contributed to the development of European commercial breeds. The average
introgression level was determined to be approximately 33% [21]. A few genome-wide studies have
shown that introgression has also occurred from European to Asian pigs [22–24]. However, the
genomic differences caused by introgression were not examined, and the functions affected by the
altered genomic regions are also unknown.
 In this study, 525 pigs from 20 breeds were characterized using an SNP array. The animals
included individuals from six areas of China in which indigenous breeds are found. The data were
used to analyze introgression from European to different Chinese breeds, and the introgressed
regions were examined to identify genes and their associated functions. Introgressed genomic regions
affected by artificial selection were also investigated to elucidate the ways in which European pigs
contributed to the improvement of traits in indigenous Chinese breeds.

2. Materials and Methods

2.1. Sample Collection and Quality Control
 All samples were collected according to the Guidelines for the Protection and Use of Laboratory
Animals established by the Chinese Ministry of Agriculture. DNA was extracted from ear tissue
samples using a QIAGEN kit, following protocols provided by the manufacturer. Purified DNA was
diluted to 20 ng/μL for genotyping [25]. A total of 278 samples from 13 breeds were genotyped using
the Porcine SNP60 BeadChip (Illumina, San Diego, CA, USA), which detects over 64,000 SNPs [25].
The 278 samples represented 234 individuals from China (196 domesticated pigs and 38 wild boars
from most parts of China; breeds and sources are shown in Table 1), 12 European wild boars, and 32
Duroc pigs (the SNP genotypes in VCF format were deposited in the figshare data repository: doi:
10.6084/m9.figshare.11911377). In addition, 208 Western pigs and 39 warthogs (the warthogs were
used as an outgroup) were obtained from an online database [26,27]. The geographical distribution
of the samples is shown in Figure 1, and the samples are described in detail in Table 1. SNP
characteristics for all samples were evaluated using PLINK v1.9 [28]. SNPs that either failed to pass
the Minor Allele Frequency (MAF) test (1%) or were missing in over 5% of the SNPs in a sample were
removed. After low-quality SNPs were excluded, 42,819 autosomal SNPs remained, representing 525
pigs and 20 breeds. Table 1 includes the number of samples collected from each breed/population,
along with the breed abbreviations used throughout this report.
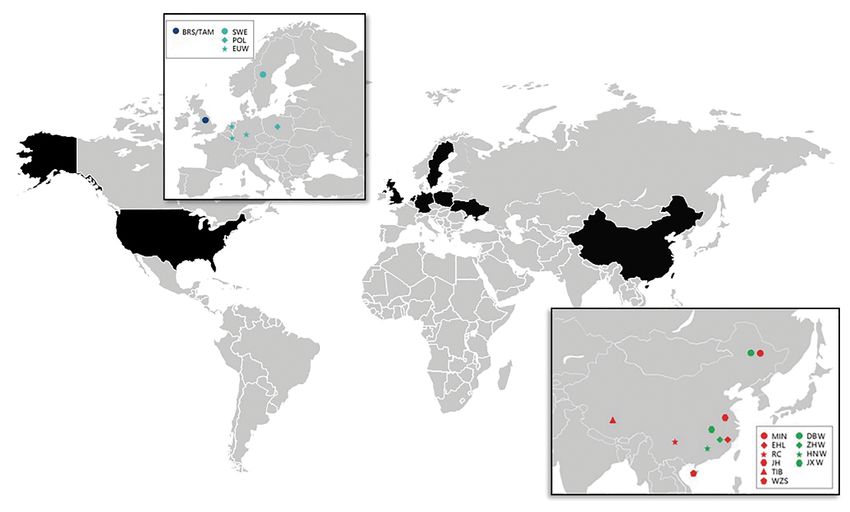
Genes 2020, 11, 275 3 of 12

 Figure 1. Origins of the samples used in this study. Red icons represent Chinese domesticated pigs,
 green icons represent Chinese wild boars, blue icons represent European domesticated pigs, and cyan
 icons represent European wild boars. Commercial breeds are not shown.

 Table 1. Pig populations and samples used in this study.

 Breed Code Origin Number *
 Dongbei boar DBW Northeast China 3
 Zhejiang boar ZJW Zhejiang province, China 15
 South China boar HNW South of China 15
 Jiangxi boar JXW Jiangxi province, China 5
 Tibetan pig TIB Tibet A.R., China 35
 Erhualian pig EHL Jiangsu province, China 36
 Jinhua pig JH Zhejiang province, China 44
 Min pig MIN Northeast China 22
 Rongchang pig RC Sichuan province, China 32
 Wuzhishan pig WZS Hainan province, China 27
 Polish boar PLW Poland 6
 Swedish boar SWE Sweden 6
 British Saddleback # BRS United Kingdom 20
 Tamworth # TAM United Kingdom 20
 Landrace # LAD Europe 20
 Large White # LW United Kingdom 20
 Pietrain # PIT Belgium 20
 Other European boar # EUW Europe 88
 Duroc # DUR United States 52
 Warthogs + OUT Africa 39
 Total 525
 * Number of samples, # data obtained from public database (http://dx.doi.org/10.5061/dryad.v6f1g),
 + data obtained from public database (http://dx.doi.org/10.5061/dryad.30tk6).

2.2. Population Structure
 Principal component analysis (PCA) was conducted using GCTA software [29]. A scatterplot
was generated to visualize the first and second principal components, based on a variance-
standardized relationship matrix from the PCA results. Population assignment analysis was
performed using ADMIXTURE [30] with the number of clusters (K) varying from 2 to 9 (10,000
Genes 2020, 11, 275 4 of 12
iterations). The results from the analysis were interpreted using methods described by Evanno et al.
[31].
Evolutionary distances were computed using the two-parameter method described by Kimura
[32] and are expressed as the number of base substitutions per site. All positions containing gaps and
missing data were eliminated. Evolutionary analyses were conducted using MEGAX [33].
2.3. Whole-Genome Analysis of Genomic Introgression
Patterson’s D-statistic [34,35] was used in our study to detect introgression from European pigs
to indigenous Asian pigs. In a typical tree topology (((P1, P2), P3), O), where “O” refers to an
outgroup, the null hypothesis is that P1 and P2 share the same ancestor with P3, and that there was
no gene flow between P3 and either P2 or P1 after their ancestors diverged. If the results deviate from
the null hypothesis, a positive D-value is expected when P2 shares more derived alleles with P3,
while a negative D-value is expected when P1 and P3 have more alleles in common. Therefore, the
D-statistic calculates the level and direction of introgression.
In our study, we calculated the D-statistic using different combinations of indigenous Asian pigs
and European pigs. The D-statistic was established using (((ASW, AD), EU), warthog), in which
warthog (Phacochoerus) served as the outgroup, ASW symbolizes Asian wild boars, AD is several
indigenous Asian breeds including TIB (Tibetan pig), EHL (Erhualian pig), RC (Rongchang pig), WZS
(Wuzhishan pig), JH (Jinhua pig), and MIN (Min pig) in 5 independent tests, and EU includes COM
(commercial breeds, including LAD (Landrace), LW (Large White), and PIT (Pietrain)), EUD
(European domesticated pigs, excluding commercial breeds), and DUR (Duroc) in different
combinations.
To quantify the size of the window affected by introgression, the statistic [36] was calculated.
Sliding windows contained 10 consecutive SNPs and were positioned at 2 SNPs intervals across every
chromosome in the genome. The statistic was calculated using Dsuite. The P-value was evaluated
from the Z-transformed value [37], and regions with P-value < 0.05 were classified as significantly
−
introgressed genomic regions [38]. The formula for the Z-transform is = , where is the
modified -statistic, is expected value of for five introgressed populations, and is the
standard deviation.
2.4. Selection Scan
We used XP-CLR [39] to scan the genome for selective signatures. XP-CLR (cross-population
composite likelihood ratio) is a multilocus sliding window test that jointly models the multilocus
allele frequency differentiation between two populations. The statistic is particularly robustly
resistant to ascertainment bias and well-suited for population demography. This method was used
to calculate whether introgressed regions were affected by artificial selection. Genetic distance was
estimated by physical position, where 1 cM = 1 Mbp [40]. The parameters used for XP-CLR were -w1
1 20 200000 ${i} -p0 0. The sliding window size was 1 cM, with a 200-kb step size. A weighted CLR
scheme was used to estimate XP-CLR. All XP-CLR scores were output to files. File format conversion
was accomplished using the Ruby script “vcf2geno.rb”. Regions were ranked by score, and regions
scoring in the top 5% in each comparison were classified as significantly selected.
Haplotypes networks were constructed in PopART version 1.7 [41] using default parameters to
produce median-joining haplotype networks [42]. The haplotype number was counted by DnaSP6
[43]; the interprocess was done with R scripts [44].
3. Results
3.1. Inference of Population Structure and Degree of Breed Admixture
To characterize the relationships between the genetic backgrounds of Western and Chinese pigs,
we first performed a population structure analysis. Warthogs were excluded from the analysis
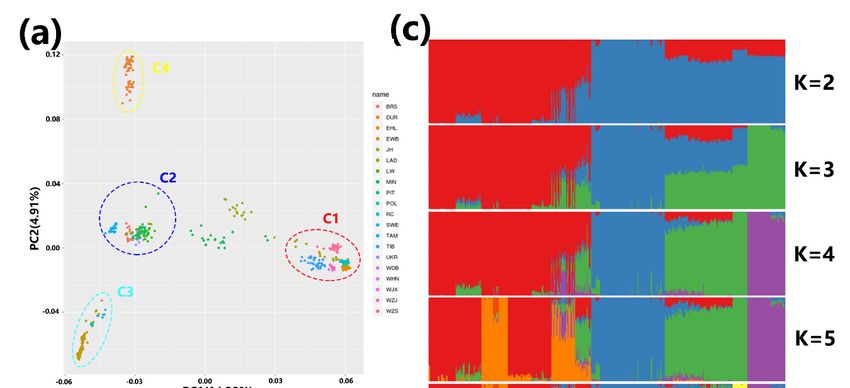
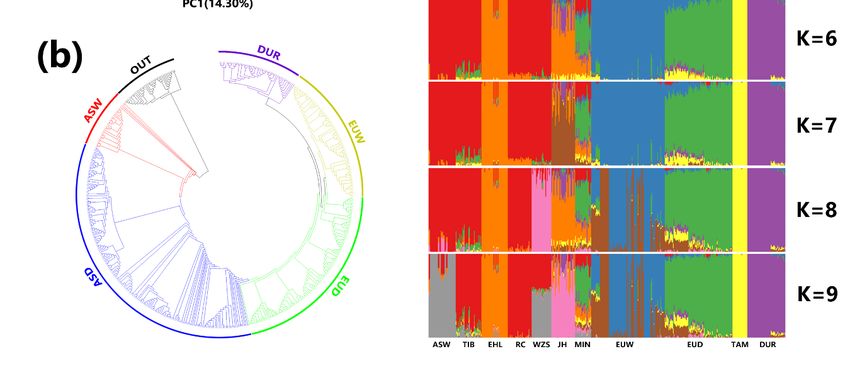
because large differences between this species and other populations might mask more subtleGenes 2020, 11, 275 5 of 12 differences between Western and Chinese pigs. An analysis that includes warthogs is provided as a supplementary figure (Figures S1 and S2), and warthogs were included as an outgroup in the construction of the phylogenetic tree (see below). PCA results are shown in Figure 2a. Principal component 1 captures 14.30% of the variance, while principal component 2 captures 4.91%. Component 2 separates Duroc (c4) from other European breeds. European wild boars (c3) and European domestic pigs (c2) also formed their own clusters on this axis. In contrast, wild boars and domestic pigs from China (c1) are not separated on the second axis, but MIN and JH are unusual because they fall in the middle of the first principal component between two clusters. If an analysis is conducted using Asian breeds alone (Figure S3), wild boars and domestic pigs form distinct clusters. A neighbor-joining phylogenetic tree shows that different subgroup form clear clusters (Figure 2b). The genetic structure of the population is shown in Figure 2c. When K (the assumed number of ancestors) is small (K = 2–4), Asian pigs, European domesticated pigs, European boars, and Duroc pigs are resolved. At K = 2, EUD and DUR are found together (in the red section), reflecting both their shared ancestry with Asian pigs and the fact that genetic resources from Asian breeds are included in commercial breeds, consistent with the PCA results. With increasing values of K (> 4), more details emerge in Asian pigs. The primary changes in clustering occur in Asian pigs. EHL and WZS cluster separately when K = 5 and K = 8, and the Asian wild boar clusters at K = 9. MIN and JH appear in a mixture with multiple ancestral sources. Figure 2. (a) Principal component analysis of 486 individuals from the 19 breeds under study. C1: Chinese breeds; C2: European domesticated pigs; C3: European wild boars; C4: Duroc. (b) Neighbor- joining tree showing relationships among the 20 populations. (c) Bar plot showing ancestry composition generated using ADMIXTURE with the assumed number of ancestries (K) varying from 2 to 9. ASW (Asian wild boar) includes DBW (Dongbei boara), HNW (South China boar), JXW (Jiangxi boar), and ZJW (Zhejiang boar). EUW (European wild boar) includes POL (Polish boar) and EUW (other European boar). EUD (European domesticated pig) includes BRS (British Saddleback), LAD (Landrace), LW (Large White), and PIT (Pietrain).
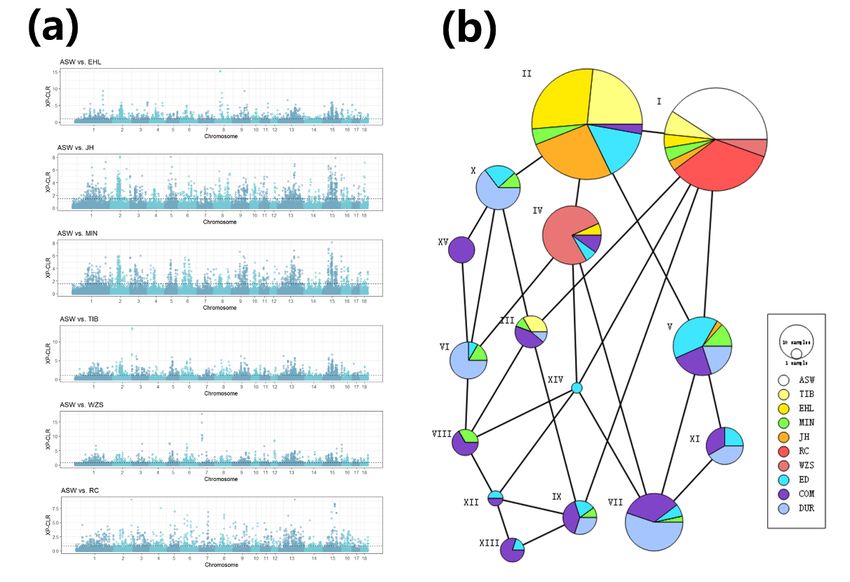
Genes 2020, 11, 275 6 of 12

3.2. Introgression from European Pigs to Chinese Indigenous Breeds
 To obtain more detailed genomic evidence for introgression from European pigs to indigenous
Chinese pigs, we calculated the D-statistics for each combination of Western and Chinese breeds.
Western pigs were grouped as COM (European commercial breeds, including LAD, LW, and PIT),
EUD (European domesticated pigs, excluding commercial breeds), DUR (Duroc), and EW (European
wild boars). The results show that all of the indigenous Chinese pigs exhibited introgression, with
the exception of RC (D = 1.9 × 10⁻³, p-value = 0.43). Because the D-statistics were positive (Table 2), the
direction of introgression is from the Western pigs into the Chinese breeds. The large range in D-
statistics indicates that different levels of introgression were detected among the Chinese pig breeds.
To exclude the effects of gene flow from Asian domesticated pigs to European pigs (as mentioned
before), we calculated the introgression from EW to AD. In the results, we found that five Chinese
indigenous breeds were introgressed (MIN, JH, TIB, WZS, and EHL), which was consistent with our
previous results. The most significant introgressions were observed from COM to MIN ((((ASW,
MIN), COM), warthog), D = 0.45, p-value < 1.0 × 10⁻²⁶) and from DUR to JH ((((ASW, JH), DUR),
warthog), D = 0.29, p-value < 1.0 × 10⁻²⁶).
 To locate the introgressed genomic regions in the genomes of the indigenous Chinese pigs, we
computed the modified f-statistic ( ) value in a sliding window analysis, using windows containing
10 SNPs, a step size of 2 SNPs, and a cutoff of P < 0.05 after application of the Z-transform. The
introgressed regions include 15.47% of the MIN genome, 7.63% of JH, 2.55% of TIB, 1.29% of WZS,
and 1.08% of EHL. We then combined regions that were significantly affected by introgression in all
five breeds, yielding eight merged regions distributed on six chromosomes (chr6: 22591224–24174352,
chr7: 24451815–27317882, chr8: 4659298–5191196, chr12: 24607160–25035796, chr13: 11949152–
13065904, chr14: 47696012–48655418, 101124119–103123266, and 109827501–111397655). Putative
genes within the merged regions were identified using the genomic locations of SNP to recover
information from the annotated pig genome. Among the 34 genes found were several that appear to
be related to muscle growth (REG3G, TNXB), bone hyperplasia (IER3, SGMS2, DKK2), sensory organs
(sight: CFB, NGLY, and hearing: DDR1, USP53), and digestive secretion (PRDM5, NKX2-3, OXSM,
TNF).

 Table 2. D-statistics for six indigenous Chinese breeds vs. four Western populations.

 COM p-value ED p-value DUR p-value EW p-value
 EHL 0.03 2.2 × 10−03 0.03 1.1 × 10−03 0.03 9.0 × 10−04 0.03 0.02
 TIB 0.12 2.2 × 10⁻¹⁶ 0.13 6.1 × 10⁻¹⁵ 0.11 2.2 × 10⁻¹⁶ 0.61 1.0 × 10⁻²⁶
 WZS 0.03 4.9 × 10−04 0.02 0.01 0.03 5.9 × 10−04 0.04 5.4 × 10−04
 RC 1.9 × 10−03 0.43 5.3 × 10−03 0.30 1.4 × 10−05 0.49 3.8 × 10−03 0.07
 JH 0.24 1.0 × 10⁻²⁶ 0.26 1.0 × 10⁻²⁶ 0.29 1.0 × 10⁻²⁶ 0.40 1.0 × 10⁻²⁶
 MIN 0.45 1.0 × 10⁻²⁶ 0.43 1.0 × 10⁻²⁶ 0.42 1.0 × 10⁻²⁶ 0.61 1.0 × 10⁻²⁶

3.3. Investigation of Introgressed Regions Affected by Artificial Selection
 To identify genes possibly under artificial selection in Chinese pigs, we calculated the XP-CLR
value between six domesticated indigenous Chinese breeds and Chinese wild boars using a 1 Mb
sliding window with 200 kb steps respectively. With these parameters, the average window included
13.68 SNPs. Selective signals were required to fall within the top 5% of XP-CLR values. A total of 1220
selective signals were considered in each comparison. All six indigenous Chinese breeds exhibited
significant levels of artificial selection in 11 genomic regions. If the analysis is constrained to the 5
introgressed breeds, the number of regions showing evidence of selection increases to 19. Manhattan
plots for XP-CLR values representing all comparisons are shown in Figure 3a. Interestingly, the
region spanning chr13: 12.5–13.1M has been subjected both to artificial selection and introgression in
five of the six indigenous Chinese breeds, but RC shows no evidence for artificial selection. We
hypothesize that this region was affected by introgression and was retained to improve performance
after artificial selection in indigenous Chinese pigs. Two putative genes were identified in the region
and have functions related to glucose absorption (OXSM) and sensory organs (NGLY).
Genes 2020, 11, 275 7 of 12

 We constructed a haplotype network [41] using the 15 haplotypes in chr13: 12.5–13.1Mb (Figure
3b). The ASW and RC haplotypes were identical in this region. Because RC has not been introgressed
from Western commercial pigs, we believe that haplotype I is the original haplotype in Chinese
breeds. The introgressed indigenous Chinese breeds are mainly represented by haplotype II, and we
also found this haplotype in COM and ED. In addition, compared with Western pigs, the indigenous
Chinese breeds have only a few haplotypes concentrated in this region (I, II, III, and IV), suggesting
that the region has been subjected to artificial selection.

 Figure 3. (a) XP-CLR (cross-population composite likelihood ratio) values calculated between each
 indigenous Chinese breed vs. Chinese wild boars. The black dashed lines represent the 5% cutoff used
 to define selective signals. (b) Haplotype network generated using 15 common haplotypes in chr13:
 12.5–13.1Mb. Circle area is proportional to the number of samples, and lines between the circles
 represent a step mutation.

 The population structure of MIN appears to be unusual in comparison with the other indigenous
Chinese breeds. In particular, MIN had higher values than other breeds, indicating that it has
been subjected to higher levels of introgression [24]. In order to investigate the unusual genomic
characteristics of MIN in more detail, we calculated XP-CLR values between MIN and ASD
(including the other indigenous Chinese local breeds EHL, JH, RC, TIB, and WZS) to identify MIN-
specific regions and also calculated XP-CLR between MIN and COM, because of the markedly high
D-statistics from COM to MIN. Examining the ratio of the mean XP-CLR in the two comparisons, the
difference between MIN and COM is smaller than the difference between MIN and ASD. This
indicates that MIN is more closely related to COM in the introgressed regions. However, some
regions are significantly different between MIN and ASD but are not different between MIN and
COM, implying that MIN had been severely introgressed.

4. Discussion
 Pigs were domesticated in Europe and Asia independently, and research has detected gene
flows between European and Asian pigs [8]. Our results confirmed that introgression has occurred
from Western pigs to indigenous Chinese breeds. Moreover, the introgression levels vary among
breeds, perhaps as a consequence of recent Chinese strategies and policies for regional introduction
Genes 2020, 11, 275 8 of 12

of germplasm. Chinese historical records show that Western pigs, most often Large Yorkshire,
Berkshire, and Duroc, began to be introduced around 1840 [45]. In 1910, “white pigs” from the
Russian Empire were introduced to the northeastern region of China for crossbreeding with local
pigs [46]. In 1919, Lingnan University introduced Berkshire pigs to learn about the characteristics of
European breeds and began to improve the performance of indigenous breeds through crossbreeding
[45]. We suggest that these and later introductions into specific areas are responsible for the varied
levels of introgression that we observe from Western to indigenous Chinese breeds.
 It is particularly interesting that the Chinese Min breed has been subjected to a high level of
introgression. This is likely to be a consequence of location, since these pigs inhabit the northeast
border areas of China, adjacent to the Russian border. According to breeding records, a large number
of commercial pigs were bred in Russia and imported into China [47], which is consistent with our
finding that MIN has received an introgression from commercial pigs. Considering the high
proportion of introgressed genes in MIN (14.57%), we speculate that MIN has been affected by more
genetic change than can be attributed to introgression alone, such as crossbreeding. The level of
introgression is higher than observed for some species. For example, Neanderthal introgression
affected all non-African populations and is estimated at 1.8–2.4% in European and 2.3–2.6% in East
Asian populations [35]; introgression from polar bears to North American brown bears is 3–8%
[48,49]. However, the introgression in MIN is lower than from dogs to the Eurasian wolf (25%) [50,51].
 Among the indigenous Chinese breeds, JH was the second-most affected by introgression. JH
pigs are also located in China’s border areas, but they may have been affected by introgression from
pigs imported via ocean routes [45]. The only indigenous Chinese breed that has not been affected by
introgression is RC, found in the Sichuan Province in the inland area of China. We infer that pigs
from border areas are more likely to be introgressed than pigs from internal regions.
 Although the SNP array was not designed to identify specific genes, our analysis of introgressed
regions revealed genes related to “skeletal development”, “muscle growth”, “digestive secretion”,
and “senses”. These are associated with several important traits. For example, REG3G, IER3, SGMS2,
and DKK2 [52–55] are involved in skeletal development, TNXB [56] in muscle growth, CH25H, DRG1
[57,58] in digestive secretion, and NGLY [59] in vision. The genes OXSM and NGLY are also located
in regions affected by both introgression and artificial selection. OXSM has been studied in the mouse
kidney, and its function is related to glucose reabsorption [60]. Biological reabsorption in the kidney
is important because it enables the full use of nutrients and also helps to regulate the pH of fluids in
the body. NGLY1 is related to cerebral visual impairment (CVI) [61] in humans. CVI is a collective
term that includes several visual disorders that result from damage to, or malfunction of, cerebral
components of the visual system, such as the optic tracts, optic radiations, and the visual cortex [59].
The functions of these two genes suggest that they may have been targets for artificial selection, that
is, introgressed genes had been retained by artificial selection.
 When D-values are used to find introgressed regions, outlier values occur as statistical noise [36],
generated mainly in regions of low diversity. Therefore, in this experiment, we used D-values only
as evidence for introgression in Chinese local breeds. More generally for introgressed regions,
values were used to correct for biases introduced by outlier values. Bias was also reduced by using
multiple populations to calculate values and by focusing on the intersection of the introgressed
regions in multiple populations. Finally, the results were analyzed using selective scanning to
minimize the effects of outliers as much as possible. Although the D-statistic had been used in many
studies, there are other methods available when calculating gene flows, such as Hidden Markov
Models [62], conditional random fields [63], S*-statistic [64], and similar implementations [65].
 Our study revealed introgression from Western commercial pigs to indigenous Chinese breeds
using genome-wide markers. Re-sequencing data offers an opportunity to explore introgression in
indigenous Chinese breeds in more detail in the future.
Supplementary Materials: The following are available online at www.mdpi.com/xxx/s1. Figure S1: PCA results
including outgroup (warthogs). Figure S2: Genetic structure including outgroup (located at the far right of the
plots) from K=2 to 9. Figure S3: PCA results for Chinese pigs.
Genes 2020, 11, 275 9 of 12

Author Contributions: Conceptualization, J.W.; data curation, J.W. and C.L.; formal analysis, Y.B.; methodology,
J.W., J.C., and Y.W.; project administration, M.F.; resources, J.C. and K.W.; supervision, M.F.; visualization, J.W.;
writing—original draft, J.W.; writing—review and editing, J.W. and M.F. All authors have read and agreed to
the published version of the manuscript.

Funding: This research was funded by the National Science and Technology Major Project of the Ministry of
Science and Technology of China (award 2018ZX08009-28B), the National Natural Science Foundation of China
(award 201703010411122), and the National Key R&D Program of China (award 2018YFD0500402).

Conflicts of Interest: The authors declare no conflict of interest.

References
1. USDA, F. PSD Online. 2006. Available online:
 https://apps.fas.usda.gov/psdonline/app/index.html#/app/home (accessed on 1st March 2020)
2. United States Department of Agriculture, F.A.S. Swine Summary Selected Countries. Available online:
 https://www.fsis.usda.gov/wps/wcm/connect/843d74f4-1549-42bf-9af5-3ec3d1c2b213/croatia-2019-far.pdf
 (accessed on 1 March 2020)
3. Darwin, C. The Variation of Animals and Plants under Domestication; Cambridge University Press: Cambridge,
 UK, 1868; Volume 2.
4. Ervynck, A.; Dobney, K.; Hongo, H.; Meadow, R. Born Free? New Evidence for the Status of" Sus scrofa" at
 Neolithic Çayönü Tepesi (Southeastern Anatolia, Turkey). Paléorient 2001, 1, 47–73.
5. Epstein, H.; Bichard, M. Pig. Evolution of Domesticated Animals 1984.
6. Cucchi, T.; Hulme-Beaman, A.; Yuan, J.; Dobney, K. Early Neolithic pig domestication at Jiahu, Henan
 Province, China: Clues from molar shape analyses using geometric morphometric approaches. J. Archaeol.
 Sci. 2011, 38, 11–22.
7. Ek, W.; Marklund, S.; Ragavendran, A.; Siegel, P.B.; Muir, W.M.; Carlborg, O. Generation of a multi-locus
 chicken introgression line to study the effects of genetic interactions on metabolic phenotypes in chickens.
 Front. Genet. 2012, 3, 29–29.
8. Frantz, L.A.; Schraiber, J.G.; Madsen, O.; Megens, H.-J.; Cagan, A.; Bosse, M.; Paudel, Y.; Crooijmans, R.P.;
 Larson, G.; Groenen, M.A. Evidence of long-term gene flow and selection during domestication from
 analyses of Eurasian wild and domestic pig genomes. Nat. Genet. 2015, 47, 1141–1148.
9. Hu, X.; Yang, J.; Xie, X.; Lv, F.; Cao, Y.; Li, W.; Liu, M.; Wang, Y.; Li, J.; Liu, Y.; et al. The genome landscape
 of tibetan sheep reveals adaptive introgression from argali and the history of early human settlements on
 the qinghai-tibetan plateau. Mol. Biol. Evol. 2019, 36, 283–303.
10. Leroy, G.; Kayang, B.B.; Youssao, I.; Yapignaore, C.V.; Oseiamponsah, R.; Loukou, N.E.; Fotsa, J.C.;
 Benabdeljelil, K.; Bedhom, B.; Tixierboichard, M.; et al. Gene diversity, agroecological structure and
 introgression patterns among village chicken populations across North, West and Central Africa. BMC
 Genet. 2012, 13, 34–34.
11. Randi, E.; Hulva, P.; Fabbri, E.; Galaverni, M.; Galov, A.; Kusak, J.; Bigi, D.; Bolfikova, B.C.; Smetanova, M.;
 Caniglia, R. Multilocus detection of wolf x dog hybridization in Italy, and guidelines for marker selection.
 PLoS ONE 2014, 9, 1.
12. Zhang, C.; Lin, D.; Wang, Y.; Peng, D.; Li, H.; Fei, J.; Chen, K.; Yang, N.; Hu, X.; Zhao, Y.; et al. Widespread
 introgression in Chinese indigenous chicken breeds from commercial broiler. Evol. Appl. 2019, 12, 610–621.
13. Frantz, A.C.; Zachos, F.E.; Kirschning, J.; Cellina, S.; Bertouille, S.; Mamuris, Z.; Koutsogiannouli, E.A.;
 Burke, T. Genetic evidence for introgression between domestic pigs and wild boars (Sus scrofa) in Belgium
 and Luxembourg: A comparative approach with multiple marker systems. Biol. J. Linn. Soc. 2013, 110, 104–
 115.
14. Burgos-Paz, W.; Souza, C.; Megens, H.; Ramayo-Caldas, Y.; Melo, M.; Lemús-Flores, C.; Caal, E.; Soto, H.;
 Martínez, R.; Alvarez, L.; et al. Porcine colonization of the Americas: A 60k SNP story. Heredity 2013, 110,
 321.
15. Hanotte, O.; Bradley, D.G.; Ochieng, J.W.; Verjee, Y.; Hill, E.W.; Rege, J.E.O. African pastoralism: Genetic
 imprints of origins and migrations. Science 2002, 296, 336–339.
16. Zhang, Q.; Calus, M.P.L.; Bosse, M.; Sahana, G.; Lund, M.S.; Guldbrandtsen, B. Human-mediated
 introgression of haplotypes in a modern dairy cattle breed. Genetics 2018, 209, 1305–1317.
17. Wang, C.; Wang, H.; Zhang, Y.; Tang, Z.; Li, K.; Liu, B. Genome-wide analysis reveals artificial selection on
 coat colour and reproductive traits in C hinese domestic pigs. Mol. Ecol. Resour. 2015, 15, 414–424.
Genes 2020, 11, 275 10 of 12

18. Haley, C.; d’Agaro, E.; Ellis, M. Genetic components of growth and ultrasonic fat depth traits in Meishan
 and Large White pigs and their reciprocal crosses. Anim. Sci. 1992, 54, 105–115.
19. Rothschild, M.; Jacobson, C.; Vaske, D.; Tuggle, C.; Wang, L.; Short, T.; Eckardt, G.; Sasaki, S.; Vincent, A.;
 McLaren, D.; et al. The estrogen receptor locus is associated with a major gene influencing litter size in pigs.
 Proc. Natl. Acad. Sci. USA 1996, 93, 201–205.
20. Bosse, M.; Megens, H.-J.; Frantz, L.A.; Madsen, O.; Larson, G.; Paudel, Y.; Duijvesteijn, N.; Harlizius, B.;
 Hagemeijer, Y.; Crooijmans, R.P.; et al. Genomic analysis reveals selection for Asian genes in European pigs
 following human-mediated introgression. Nat. Commun. 2014, 5, 4392.
21. Fang, M.; Andersson, L. Mitochondrial diversity in European and Chinese pigs is consistent with
 population expansions that occurred prior to domestication. Proc. R. Soc. Lond. B Biol. Sci. 2006, 273, 1803–
 1810.
22. Jiang, Y.; Zhu, L.; Tang, G.; Li, M.; Jiang, A.; Cen, W.; Xing, S.; Chen, J.; Wen, A.; He, T.; et al. Carcass and
 meat quality traits of four commercial pig crossbreeds in China. Genet. Mol. Res. 2012, 11, 4447–4455.
23. Yang, S.; Li, X.; Li, K.; Fan, B.; Tang, Z. A genome-wide scan for signatures of selection in Chinese
 indigenous and commercial pig breeds. BMC Genet. 2014, 15, 7.
24. Yang, S.-L.; Wang, Z.-G.; Liu, B.; Zhang, G.-X.; Zhao, S.-H.; Yu, M.; Fan, B.; Li, M.-H.; Xiong, T.-A.; Li, K.
 Genetic variation and relationships of eighteen Chinese indigenous pig breeds. Genet. Sel. Evol. 2003, 35,
 657.
25. Ramos, A.M.; Crooijmans, R.P.; Affara, N.A.; Amaral, A.J.; Archibald, A.L.; Beever, J.E.; Bendixen, C.;
 Churcher, C.; Clark, R.; Dehais, P.; et al. Design of a high density SNP genotyping assay in the pig using
 SNPs identified and characterized by next generation sequencing technology. PLoS ONE 2009, 4, e6524.
26. Goedbloed, D.; Megens, H.; Van Hooft, P.; Herrero-Medrano, J.; Lutz, W.; Alexandri, P.; Crooijmans, R.;
 Groenen, M.; Van Wieren, S.; Ydenberg, R.; et al. Genome-wide single nucleotide polymorphism analysis
 reveals recent genetic introgression from domestic pigs into Northwest European wild boar populations.
 Mol. Ecol. 2013, 22, 856–866.
27. Yang, B.; Cui, L.; Perez-Enciso, M.; Traspov, A.; Crooijmans, R.P.; Zinovieva, N.; Schook, L.B.; Archibald,
 A.; Gatphayak, K.; Knorr, C.; et al. Genome-wide SNP data unveils the globalization of domesticated pigs.
 Genet. Sel. Evol. 2017, 49, 71.
28. Purcell, S.; Neale, B.; Todd-Brown, K.; Thomas, L.; Ferreira, M.A.; Bender, D.; Maller, J.; Sklar, P.; De Bakker,
 P.I.; Daly, M.J.; et al. PLINK: A tool set for whole-genome association and population-based linkage
 analyses. Am. J. Hum. Genet. 2007, 81, 559–575.
29. Yang, J.; Lee, S.H.; Goddard, M.E.; Visscher, P.M. GCTA: A tool for genome-wide complex trait analysis.
 Am. J. Hum. Genet. 2011, 88, 76–82.
30. Alexander, D.H.; Novembre, J.; Lange, K. Fast model-based estimation of ancestry in unrelated individuals.
 Genome Res. 2009, 19, 1655–1664.
31. Evanno, G.; Regnaut, S.; Goudet, J. Detecting the number of clusters of individuals using the software
 STRUCTURE: A simulation study. Mol. Ecol. 2005, 14, 2611–2620.
32. Kimura, M. A simple method for estimating evolutionary rates of base substitutions through comparative
 studies of nucleotide sequences. J. Mol. Evol. 1980, 16, 111–120.
33. Kumar, S.; Stecher, G.; Tamura, K. MEGA7: Molecular Evolutionary Genetics Analysis version 7.0 for
 bigger datasets. Mol. Biol. Evol. 2016, 33, 1870–1874.
34. Durand, E.Y.; Patterson, N.; Reich, D.; Slatkin, M. Testing for ancient admixture between closely related
 populations. Mol. Biol. Evol. 2011, 28, 2239–2252.
35. Green, R.E.; Krause, J.; Briggs, A.W.; Maricic, T.; Stenzel, U.; Kircher, M.; Patterson, N.; Li, H.; Zhai, W.;
 Fritz, M.H.-Y.; et al. A draft sequence of the Neandertal genome. Science 2010, 328, 710–722.
36. Martin, S.H.; Davey, J.W.; Jiggins, C.D. Evaluating the use of ABBA–BABA statistics to locate introgressed
 loci. Mol. Biol. Evol. 2014, 32, 244–257.
37. Malinsky, M. Dsuite-fast D-statistics and related admixture evidence from VCF files. BioRxiv 2019, 634477.
38. Teng, H.; Zhang, Y.; Shi, C.; Mao, F.; Cai, W.; Lu, L.; Zhao, F.; Sun, Z.; Zhang, J. Population genomics reveals
 speciation and introgression between brown Norway rats and their sibling species. Mol. Biol. Evol. 2017, 34,
 2214–2228.
39. Hufford, M.B.; Xu, X.; Van Heerwaarden, J.; Pyhäjärvi, T.; Chia, J.-M.; Cartwright, R.A.; Elshire, R.J.;
 Glaubitz, J.C.; Guill, K.E.; Kaeppler, S.M.; et al. Comparative population genomics of maize domestication
 and improvement. Nat. Genet. 2012, 44, 808.
Genes 2020, 11, 275 11 of 12

40. Chen, H.; Patterson, N.; Reich, D. Population differentiation as a test for selective sweeps. Genome Res. 2010,
 20, 393–402.
41. Leigh, J.W.; Bryant, D. popart: Full-feature software for haplotype network construction. Methods Ecol. Evol.
 2015, 6, 1110–1116.
42. Bandelt, H.-J.; Forster, P.; Röhl, A. Median-joining networks for inferring intraspecific phylogenies. Mol.
 Biol. Evol. 1999, 16, 37–48.
43. Rozas, J.; Sánchez-DelBarrio, J.C.; Messeguer, X.; Rozas, R. DnaSP, DNA polymorphism analyses by the
 coalescent and other methods. Bioinformatics 2003, 19, 2496–2497.
44. Team, R.C.; others R: A Language and Environment for Statistical Computing; 2013: 409.
45. Wangsheng, X. Introduction and domestication of European breeds of pig in modern China. Anc. Mod.
 Agric. 2004, 1, 8.
46. Zhongge, Z.; Bingtan, L.; Xiaohua, C.; Others Chinese pig breeds. Shanghai Sci. Technol. Agency 1986, 48,
 14219–14227
47. Dmitriev, N.G.; Ernest, L. Animal Genetic Resources of the USSR; FAO: Roma, Italia, 1989.
48. Cahill, J.A.; Stirling, I.; Kistler, L.; Salamzade, R.; Ersmark, E.; Fulton, T.L.; Stiller, M.; Green, R.E.; Shapiro,
 B. Genomic evidence of geographically widespread effect of gene flow from polar bears into brown bears.
 Mol. Ecol. 2015, 24, 1205–1217.
49. Liu, S.; Lorenzen, E.D.; Fumagalli, M.; Li, B.; Harris, K.; Xiong, Z.; Zhou, L.; Korneliussen, T.S.; Somel, M.;
 Babbitt, C.; et al. Population genomics reveal recent speciation and rapid evolutionary adaptation in polar
 bears. Cell 2014, 157, 785–794.
50. Fan, Z.; Silva, P.; Gronau, I.; Wang, S.; Armero, A.S.; Schweizer, R.M.; Ramirez, O.; Pollinger, J.; Galaverni,
 M.; Del-Vecchyo, D.O.; et al. Worldwide patterns of genomic variation and admixture in gray wolves.
 Genome Res. 2016, 26, 163–173.
51. Skoglund, P.; Ersmark, E.; Palkopoulou, E.; Dalén, L. Ancient wolf genome reveals an early divergence of
 domestic dog ancestors and admixture into high-latitude breeds. Curr. Biol. 2015, 25, 1515–1519.
52. Klasan, G.S.; Ivanac, D.; Erzen, D.J.; Picard, A.; Takasawa, S.; Peharec, S.; Arbanas, J.; Girotto, D.; Jerkovic,
 R. Reg3G gene expression in regenerating skeletal muscle and corresponding nerve. Muscle Nerve 2014, 49,
 61–68.
53. Li, X.; Liu, P.; Liu, W.; Maye, P.; Zhang, J.; Zhang, Y.; Hurley, M.; Guo, C.; Boskey, A.; Sun, L.; et al. Dkk2
 has a role in terminal osteoblast differentiation and mineralized matrix formation. Nat. Genet. 2005, 37, 945.
54. Pekkinen, M.; Terhal, P.A.; Botto, L.D.; Henning, P.; Mäkitie, R.E.; Roschger, P.; Jain, A.; Kol, M.; Kjellberg,
 M.A.; Paschalis, E.P.; et al. Osteoporosis and skeletal dysplasia caused by pathogenic variants in SGMS2.
 JCI Insight 2019, 4, 7.
55. Steensma, D.P.; Neiger, J.D.; Porcher, J.C.; Keats, J.J.; Bergsagel, P.L.; Dennis, T.R.; Knudson, R.A.; Jenkins,
 R.B.; Santana-Davila, R.; Kumar, R.; et al. Rearrangements and amplification of IER3 (IEX-1) represent a
 novel and recurrent molecular abnormality in myelodysplastic syndromes. Cancer Res. 2009, 69, 7518–7523.
56. Zweers, M.C.; Bristow, J.; Steijlen, P.M.; Dean, W.B.; Hamel, B.C.; Otero, M.; Kucharekova, M.; Boezeman,
 J.B.; Schalkwijk, J. Haploinsufficiency of TNXB is associated with hypermobility type of Ehlers-Danlos
 syndrome. Am. J. Hum. Genet. 2003, 73, 214–217.
57. Guan, R.J.; Ford, H.L.; Fu, Y.; Li, Y.; Shaw, L.M.; Pardee, A.B. Drg-1 as a differentiation-related, putative
 metastatic suppressor gene in human colon cancer. Cancer Res. 2000, 60, 749–755.
58. Shibata, N.; Kawarai, T.; Lee, J.H.; Lee, H.-S.; Shibata, E.; Sato, C.; Liang, Y.; Duara, R.; Mayeux, R.P.; St
 George-Hyslop, P.H.; et al. Association studies of cholesterol metabolism genes (CH25H, ABCA1 and
 CH24H) in Alzheimer’s disease. Neurosci. Lett. 2006, 391, 142–146.
59. Bosch, D.G.; Boonstra, F.N.; de Leeuw, N.; Pfundt, R.; Nillesen, W.M.; de Ligt, J.; Gilissen, C.; Jhangiani, S.;
 Lupski, J.R.; Cremers, F.P.; et al. Novel genetic causes for cerebral visual impairment. Eur. J. Hum. Genet.
 2016, 24, 660.
60. Gao, T.; Qian, S.; Shen, S.; Zhang, X.; Liu, J.; Jia, W.; Chen, Z.; Ye, J. Reduction of mitochondrial 3-oxoacyl-
 ACP synthase (OXSM) by hyperglycemia is associated with deficiency of α-lipoic acid synthetic pathway
 in kidney of diabetic mice. Biochem. Biophys. Res. Commun. 2019, 512, 106–111.
61. Boonstra, N.; Limburg, H.; Tijmes, N.; van Genderen, M.; Schuil, J.; van Nispen, R. Changes in causes of
 low vision between 1988 and 2009 in a Dutch population of children. Acta Ophthalmol. 2012, 90, 277–286.
Genes 2020, 11, 275 12 of 12

62. Prüfer, K.; Racimo, F.; Patterson, N.; Jay, F.; Sankararaman, S.; Sawyer, S.; Heinze, A.; Renaud, G.; Sudmant,
 P.H.; De Filippo, C.; et al. The complete genome sequence of a Neanderthal from the Altai Mountains.
 Nature 2014, 505, 43–49.
63. Sankararaman, S.; Mallick, S.; Dannemann, M.; Prüfer, K.; Kelso, J.; Pääbo, S.; Patterson, N.; Reich, D. The
 genomic landscape of Neanderthal ancestry in present-day humans. Nature 2014, 507, 354–357.
64. Wall, J.D.; Lohmueller, K.E.; Plagnol, V. Detecting ancient admixture and estimating demographic
 parameters in multiple human populations. Mol. Biol. Evol. 2009, 26, 1823–1827.
65. Skov, L.; Hui, R.; Shchur, V.; Hobolth, A.; Scally, A.; Schierup, M.H.; Durbin, R. Detecting archaic
 introgression using an unadmixed outgroup. PLoS Genet. 2018, 14, e1007641.

 © 2020 by the authors. Licensee MDPI, Basel, Switzerland. This article is an open access
 article distributed under the terms and conditions of the Creative Commons Attribution
 (CC BY) license (http://creativecommons.org/licenses/by/4.0/).
You can also read