07/2020 EU ETS up to 2030: Adjusting the Cap in light of the IPCC1.5 C Special Report and the Paris Agreement
←
→
Page content transcription
If your browser does not render page correctly, please read the page content below
CLIMATE CHANGE

   07/2020
 EU ETS up to 2030:
 Adjusting the Cap in
 light of the IPCC1.5°C
 Special Report and the
 Paris Agreement

German Environment Agency
CLIMATE CHANGE 07/2020

Ressortforschungsplan Project No. (FKZ)

3717 42 503 0 Report No. FB000260/

ZW,ENG

EU ETS up to 2030: Adjusting the Cap in light
of the IPCC1.5°C Special Report and the Paris
Agreement
.

by
Aleksandar Zaklan
Deutsches Institut für Wirtschaftsforschung, Berlin
Jakob Wachsmuth, Vicki Duscha
Fraunhofer ISI, Karlsruhe

On behalf of the German Environment Agency
Imprint

Publisher
Umweltbundesamt
Wörlitzer Platz 1
06844 Dessau-Roßlau
Tel: +49 340-2103-0
Fax: +49 340-2103-2285
buergerservice@uba.de
Internet: www.umweltbundesamt.de

 /umweltbundesamt.de
 /umweltbundesamt

Report performed by:
Deutsches Institut für Wirtschaftsforschung (DIW Berlin)
Mohrenstr. 58
10117 Berlin
Germany

Fraunhofer Institute for Systems and Innovation Research (ISI)
Breslauer Str. 48
76139 Karlsruhe
Germany

Report completed in:
October 2019

Edited by:
Section V 3.3 Economic Aspects of Emissions Trading
Claudia Gibis and Jan Weiß

Publication as pdf:
http://www.umweltbundesamt.de/publikationen

ISSN 1862-4804

Dessau-Roßlau, January 2020

The views expressed in this paper do not necessarily comply with those of UBA and remain the authors’
responsibility.
CLIMATE CHANGE EU ETS up to 2030: Adjusting the Cap in light of the IPCC1.5 C Special Report and the Paris Agreement

Abstract: EU ETS up to 2030: Adjusting the Cap in light of the IPCC1.5 C Special Report and the Paris
Agreement

We derive an EU ETS budget compatible with the Paris Agreement based on cost-effectiveness
criteria, using a target of limiting global warming to 1.5 degrees Celsius with a 50 – 66%
probability, and translate it into a cap reduction path. We derive a budget of about 30 Gt CO2e for
the EU ETS for 2016-2050. We show that already about 25 Gt CO2e will be used until 2030 under
current ETS parameters. We also show that cumulative GHG emissions of ETS sectors in the two
most ambitious 1.5-degree-scenarios in the EU Commission’s Strategic Vision amount to 33 Gt
CO2e until 2050, about 10% higher than our optimistic cost-effective budget. Thus, meeting the
2050 EU ETS budget under current 2030 parameters would require drastic – and probably
unrealistic – additional efforts after 2030. A smoother and more credible emission pathway can
be achieved through a cost-effective scenario reducing the cap by 61% until 2030, compared to
2005, corresponding to an LRF of 4.0% for 2021-2030 (5.8% if the LRF can only be adjusted in
2026). We show that a first step towards aligning the ETS cap with the Paris Agreement would
be to use the potential for additional GHG savings due to recently increased EU targets for
renewable energy and energy efficiency. The minimum required adjustment is to increase the
reduction target for ETS sectors to at least 50% for 2030, compared to 2005, from currently
43%. This corresponds to a LRF of 2.9% for 2021-2030 or 3.5% if the LRF can only be adjusted
in 2026. National coal-phase out policies planned in a number of EU member states until 2030
provide further cap adjustment potentials. If phased-out capacities are fully substituted by
renewable electricity, emissions in ETS sectors could decline by 57% through 2030,
approximating our cost-effective scenario and translating into an LRF of 3.6% for the period
2021-2030 or 4.9% if the LRF can only be adjusted in 2026.
Kurzbeschreibung: EU ETS up to 2030: Adjusting the Cap in light of the IPCC1.5 C Special Report and
the Paris Agreement
Wir leiten ein mit dem Pariser Übereinkommen kompatibles EU-ETS-Budget auf Basis von
Kosteneffizienzkriterien her mit dem Ziel, die globale Erwärmung mit einer Wahrscheinlichkeit
von 50 bis 66% auf 1,5 Grad Celsius zu begrenzen und übersetzen es in einen Pfad der Cap-
Reduktion. Unsere Berechnungen ergeben ein Budget von ca. 30 Gt CO2e für das EU ETS für
2016-2050. Unter aktuellen ETS-Parametern werden bis 2030 bereits ca. 25 Gt CO2e verbraucht.
Wir zeigen, dass die kumulierten THG-Emissionen von ETS-Sektoren in den beiden
ehrgeizigsten 1,5-Grad-Szenarien der Strategischen Vision der EU-Kommission bis 2050 33 Gt
CO2e betragen und damit etwa 10% höher liegen als unser optimistisches kosteneffizientes
Budget. Das Einhalten des EU-ETS-Budgets bis 2050 unter den aktuellen Parametern für 2030
würde demnach drastische - und wahrscheinlich unrealistische - zusätzliche Anstrengungen
nach 2030 erfordern. Ein glaubwürdigerer Emissionspfad kann durch ein kosteneffizientes
Szenario erreicht werden, bei dem das Cap bis 2030 um 61% abgesenkt wird, im Vergleich zu
2005, was einem LRF von 4,0% für 2021-2030 entspricht (5,8%, wenn der LRF erst 2026
angepasst werden kann). Ein erster Schritt, um das ETS Cap mit dem Pariser Abkommen in
Einklang zu bringen, ist die Potenziale für zusätzliche THG-Einsparungen zu nutzen, die sich aus
kürzlich erhöhten EU-Zielen für erneuerbare Energien und Energieeffizienz ergeben. Dazu
müsste das Reduktionsziel für die ETS-Sektoren bis 2030 von derzeit 43% auf mindestens 50%
im Vergleich zu 2005 angehoben werden. Dies entspricht einem linearen Kürzungsfaktor (LKF)
von 2,9% für 2021-2030 oder 3,5%, wenn der LKF erst 2026 angepasst werden kann. Die in
einer Reihe von EU-Mitgliedstaaten bis 2030 geplanten nationalen Maßnahmen zum Ausstieg
aus der Kohleverstromung bieten weitere Anpassungspotenziale. Wenn Kapazitäten vollständig
durch Strom aus erneuerbaren Energien ersetzt werden, könnten die Emissionen in ETS-
Sektoren bis 2030 um 57% sinken, was unserem kosteneffizienten Szenario nahe kommt und
somit einem LKF von 3,6% für 2021-2030 bzw. 4,9%, wenn der LKF erst 2026 angepasst
werden kann.
                                                          5
CLIMATE CHANGE EU ETS up to 2030: Adjusting the Cap in light of the IPCC1.5 C Special Report and the Paris Agreement
Table of content
List of figures ........................................................................................................................................... 7
List of tables ............................................................................................................................................ 7
List of abbreviations ................................................................................................................................ 8
Policy Brief ............................................................................................................................................... 9
1 Background and Introduction ....................................................................................................... 11
2 Deriving a budget for EU ETS in light of the Paris Agreement and the IPCC SR1.5 ....................... 13
2.1 Cumulative emissions in the IPCC SR1.5 and the EU Commission’s vision “A clean planet for
all” ................................................................................................................................................. 13
2.2 Calculating an EU ETS emissions budget based on globally cost effective pathways ................... 14
3 Deriving emission pathways for ETS sectors while staying within our assumed cost-effective
budget ........................................................................................................................................... 17
3.1 Minimum adjustment of the EU ETS cap reflecting interacting EUs energy and national climate
policies........................................................................................................................................... 19
3.2 Potential for raising ambition in the EU ETS - Interacting EU energy policies .............................. 20
3.3 Potential for raising ambition in the EU ETS - Interacting national energy policies ..................... 22
4 Conclusions for Cap-setting in the 4th Trading Period.................................................................. 26
5 References ..................................................................................................................................... 28
A Technical annex ............................................................................................................................. 30
A.1 Detailed methodology for deriving cumulative emissions associated with the European
Commission’s Long-term Strategic Vision............................................................................. 30
A.2 Detailed methodological considerations for deriving emission budgets for the EU ETS...... 31
6CLIMATE CHANGE EU ETS up to 2030: Adjusting the Cap in light of the IPCC1.5 C Special Report and the Paris Agreement
List of figures
Figure 1: Base case and two alternative scenarios for the ETS cap 2021-
2050 staying within a budget of 30 Gt CO2e (2016-2050) .......................................18
Figure 2: Scenarios accounting for the EU Energy policy targets adopted
in 2018 .....................................................................................................................21
Figure 3: Scenarios accounting for national coal phase-outs by 2030 ...................................24
List of tables
Table 1: Annual and cumulated EU ETS GHG emissions of the EU Long-
term Strategic Vision ...............................................................................................14
Table 2: Annual and cumulated EU ETS GHG emissions in a globally
cost-effective below-1.5-degree pathway and in the EU Long-
term Strategic Vision ...............................................................................................16
Table 3: Coal power generation in 2018 in countries with planned
phase-outs of coal-fired power generation.............................................................22
Table 4: Planned national phase-outs of coal-fired power generation –
Potential emissions reductions ...............................................................................23
Table 5: Annual and cumulated GHG emissions of the EU Long-term
Strategic Vision (mean of the scenarios 1.5LIFE and 1.5TECH) ...............................31
Table 6: Global energy- and process related CO2 emissions in the
median below-1.5 degrees Celsius pathways in the IAMC 1.5
degree scenario explorer.........................................................................................32
Table 7: Annual energy- and process-related GHG emissions of the EU
in a cost-effective pathway compatible with a global below-
1.5-degrees pathway ...............................................................................................32
Table 8: Annual and cumulated GHG emissions of the EU ETS in a cost-
effective pathway compatible with a global below-1.5-degrees
pathway ...................................................................................................................33
7CLIMATE CHANGE EU ETS up to 2030: Adjusting the Cap in light of the IPCC1.5 C Special Report and the Paris Agreement
List of abbreviations
CO2 Carbon dioxide
CO2e Carbon dioxide equivalent (measuring unit for greenhouse gas)
COP Conference of the Parties
EU-ETS EU Emissions Trading Scheme
GHG Greenhouse gas
g/kWh Gram per kilowatt hour (measuring units for emission intensity)
IPCC Intergovernmental Panel on Climate Change
IPCC SR1.5 IPCC Special Report on the impacts of global warming of 1.5 degrees Celsius
above pre-industrial levels
LRF EU ETS linear reduction factor
LULUCF Land Use, Land-Use Change and Forestry
NDC Nationally Determined Contributions (in Paris-Agreement)
TWh Terawatt hours (measuring units for energy)
Vision A European Strategic Long-Term Vision for a Prosperous, Modern,
Competitive and Climate Neutral Economy
8CLIMATE CHANGE EU ETS up to 2030: Adjusting the Cap in light of the IPCC1.5 C Special Report and the Paris Agreement
Policy Brief
The main findings of this paper can be summarized as follows:
1) Deriving an adequate greenhouse gas (GHG) emissions budget for the EU ETS (or for the
EU’s overall GHG emissions) that may be regarded as compatible with the Paris Agreement’s
temperature goal is challenging from a technical and normative perspective. As the IPCC Special
Report on Global Warming of 1.5 degrees Celsius (IPCC SR1.5) has shown, the remaining global
CO2 and GHG budgets are highly uncertain. Additionally, there are various options for splitting
the global budget among countries or regions based on normative criteria. Despite these
uncertainties, some orientation is needed with respect to adjusting the GHG-reduction pathway
of the EU-ETS which is always directly linked to a corresponding GHG budget as the EU ETS is a
strictly volume-based instrument. In this regard we are deriving an EU-ETS budget that may be
regarded as compatible with the Paris Agreement and translate it into a cap reduction path.
2) As a starting point, we assess global long-term pathways to stay within the remaining
emissions budget for limiting global warming to 1.5 degrees with a 50 – 66% probability and
distribute it globally based on cost-effectiveness criteria. The selected global remaining
emissions budget reflects an optimistic perspective for the EU in light of the large uncertainties
associated with the budget. Moreover, the cost-effectiveness approach is the approach for
deriving budget shares most favourable to developed economies. In this respect we underline,
that it is not our task to make a recommendation for an EU share of the global budget which
would be a highly normative undertaking. The resulting EU ETS budget should therefore purely
be interpreted as an indicator for the very upper limit of an EU budget compatible with keeping
global warming below 1.5 degrees. Again, it does not reflect a “fair share” of the budget or “an
adequate contribution” to the Paris Agreement. Against this backdrop, our analysis shows that
an emission budget of approximately 30 Gt CO2e for the EU ETS during the period from 2016 to
2050, while achieving net-zero emissions in 2050 at the latest, is a reasonable basis for further
discussions. Taking into account current emission trends in EU ETS, up to one third of this
budget could already be used until 2020, and about 25 Gt CO2e -or more than 80 percent - will be
used by 2030 under current ETS parameters.
3) The EU Commission’s Strategic Vision “A clean planet for all”, published in November
2018, is intended to align the European emission pathway with the Paris Agreement. Estimated
cumulative GHG emissions of ETS sectors in the two most ambitious 1.5-degree-scenarios of the
Vision amounted to 33 Gt CO2e until 2050. This is about 10% higher than the optimistic cost-
effective budget we compute. In addition to that, estimated cumulative emissions reflecting the
Commission Vision are so far not ensured by current ETS parameters for the fourth trading
period (2021-2030).
4) Staying within the optimistic emissions budget of 30 Gt CO2e for the EU ETS is
theoretically possible without changing the ETS parameters up to 2030. However, it is not
practical from an economic and political perspective, as meeting the EU ETS budget until 2050
under current 2030 parameters would require drastic additional efforts from ETS sectors after
2030. Keeping the linear reduction factor (LRF), the key parameter for setting the cap reduction
path in the EU ETS, unchanged until 2030 at the current 2.2% would require a drastic – and
probably unrealistic – increase in ambition after 2030 and net-zero emissions in 2040 already.
9CLIMATE CHANGE EU ETS up to 2030: Adjusting the Cap in light of the IPCC1.5 C Special Report and the Paris Agreement
5) Our findings show that early action with respect to ETS parameters – in particular a
change in the LRF in 2021 already – provides a smoother and more credible emission pathway
for ETS sectors until 2050. In a cost-effective scenario the cap would be reduced by 61% until
2030 compared to 2005, corresponding to an LRF of 4.0% between 2021 and 2030 (5.8% if the
LRF can only be adjusted in 2026). Net-zero emissions would be achieved in 2050.
6) A first step towards aligning the ETS cap with the Paris Agreement would be to use the
potential for additional GHG savings due to recently increased EU targets for renewable energy
consumption and energy efficiency. Such an adjustment would also help to ensure scarcity on
the European carbon market and tap the full potential of the EU ETS as a climate protection
instrument. In this regard, the minimum adjustment to the cap, i.e. the LRF, in order to ensure
scarcity in EU ETS and to safeguard the consistency of the European climate and energy policy
triad, is to increase the reduction target for ETS sectors to at least 50% for 2030, compared to
2005, from currently 43%. This corresponds to a LRF of 2.9% (2021-2030) or 3.5% if the LRF
can only be adjusted in 2026. This additional potential for GHG savings from companion policies
provides a political opportunity to adjust the cap in the direction required for a Paris compatible
ETS, as underpinning measures and targets for their realization are already in place. While re-
aligning the EU ETS with renewable energy and energy efficiency targets would lead to an
almost complete decarbonisation of ETS sectors by 2050, simultaneously staying within the 30
Gt CO2e budget would still require fairly drastic reduction efforts after 2030 and net-zero
emissions around 2040 already.
7) Further potentials for accelerating the reduction of the cap up to 2030 stem from the
effects of national coal-phase out policies planned in a number of EU member states until 2030.
The effects of these national coal-phase-out policies are more uncertain than the European
energy targets, as it is not yet clear how phased-out coal capacities will be substituted and to
what extend the GHG-reduction effects will be additional to those that are linked to the
renewable energy targets. Yet it is crucial that we analyze and account for such policies in order
to maintain scarcity in the EU ETS and facilitate the political discussions on the cap adjustment
with regard to the GHG abatement in the ETS sectors.
8) If phased-out coal capacities were fully substituted by renewable (zero-emission)
electricity, emissions in ETS sectors could decline by 57% through 2030, which comes already
very close to our cost-effective scenario and translates into an LRF of 3.6% for the period 2021-
2030 or 5.0% if the LRF can only be adjusted in 2026. Our findings suggest that even if national
policies are not implemented in the manner we assume or if coal power generation is not fully
substituted by renewable energy, there is ample potential to increase the LRF to well above
2.9% (from 2021 on) or 3.5% (from 2026 on), which would be the minimum required
adjustment to the cap in order to maintain consistency with EU’s energy policy goals. By doing
so the EU could start closing the gap between current ETS parameters and the requirements to
stay within a cumulative emissions budget that can be considered compatible with the Paris
Agreement’s temperature goal, by reflecting the GHG abatement in ETS sectors occurring from
planned or already implemented energy-related measures and targets.
10CLIMATE CHANGE EU ETS up to 2030: Adjusting the Cap in light of the IPCC1.5 C Special Report and the Paris Agreement
1 Background and Introduction
Under the Paris Agreement, governments agreed to a long-term goal of keeping the global
temperature increase to well below 2 degrees Celsius above pre-industrial levels, and aim to
limit the increase to 1.5 degrees Celsius. The urgency to target the 1.5 degree goal has increased
with the publication of the IPCC 1.5 degrees Celsius special report (short IPCC SR1.5), which
clearly demonstrates that risks from temperature increases by 2 degrees are significantly more
substantial than those of a warming by 1.5 degrees. The current EU’s nationally determined
contribution (NDC) implies a reduction of domestic GHG emissions by at least 40% compared to
1990. This is insufficient with regard to the requirements under the Paris Agreement
(Wachsmuth et al., 2019).
In a recent position paper, the German Environment Agency (UBA) affirms the importance of re-
calibrating European climate policy in view of IPCC SR1.5 (UBA 2018). According to UBA (2018)
this should be achieved by defining a long-term strategy for 2050 and intermediate targets in
NDCs that are consistent with limiting global warming to 1.5 degrees. There is only a very
limited CO2 budget remaining for limiting global warming to 1.5 degrees. Decisive early action is
therefore required to minimize cumulative emissions and the risk of overshooting as well as the
lock-in of high-emission technologies through long-lived assets due to policy uncertainty. To
minimize cumulative emissions and to make achieving the long-term goals realistic, strong
action will be required during the decade up to 2030 already. UBA (2018) stresses that in
addition to its own climate action the EU should also support abatement outside the EU through
technical assistance in establishing climate policies and cooperative approaches according to
Article 6 of the Paris Agreement. Due to the requirement of achieving emission reductions both
in Europe and beyond there is little scope for offsetting.
In the European Union, approximately 40% of emissions are covered by the European Emissions
Trading Scheme (EU ETS). It is therefore important to calibrate EU ETS parameters to the
requirements set by the Paris Agreement’s temperature goals. The parameters determining
emission reductions for sectors covered by EU ETS are set by the ETS Directive (EU 2018a). The
so called “cap” defines the maximum emission level for ETS sectors. The linear reduction factor
(LRF) determining the annual reduction of the EU ETS cap was set at 2.2% for the 4th Trading
Period from 2021 to 2030 (EU 2018a). This corresponds to a 43% reduction of the cap by 2030
compared to the 2005 emission level. Together with a reduction target for non-ETS sectors of
30% by 2030, also vs. 2005, this implies a reduction of total EU’s domestic GHG emissions by at
least 40% compared to 1990, in line with the EU’s NDC.
After adopting the overall GHG reduction target and determining the LRF of 2.2%, however, the
stringency of key European energy policy targets was increased compared to the original goals
from 2014, especially with respect to the share of renewable energy (from 27% to at least 32%)
and improvements in energy efficiency (from 27% to at least 32.5%) in the “Clean energy for all
Europeans” package (EU 2018e). Additionally, several EU member states are planning national
phase-outs of coal-fired power generation. These recent policy initiatives have introduced
inconsistencies between current EU ETS parameters and the overall climate and energy
framework, which necessitate an adjustment of the EU ETS cap in order to avoid structural
imbalances between supply and demand in the European carbon market. The objective of this
paper is to contribute to the discussion on the long-term emission pathway for the EU ETS by
considering the implications of the Paris Agreement’s temperature goal and European and
national energy policies for the EU ETS. Our analysis presupposes that the EU ETS should meet
two basic requirements: first, it should be compatible with an appropriate European
contribution to limit global warming to well below 2 degrees Celsius, preferably 1.5 degrees and
second, there should be scarcity on the market in order to tap the full potential of emissions
11CLIMATE CHANGE EU ETS up to 2030: Adjusting the Cap in light of the IPCC1.5 C Special Report and the Paris Agreement
trading in an effective and efficient manner. With the cap being the crucial parameter for
determining the level of stringency and ambition of any ETS, it is the central lever in deriving an
EU-ETS budget and a cap reduction path for the period 2021-2100 that may be regarded as
compatible with the Paris Agreement while ensuring market scarcity at the same time.
In Section 2, we use two documents as the framework for deriving a Paris compatible ETS
budget: first, the IPCC SR1.5, which provides information on global remaining emission budgets
compatible with different temperature goals and second, the “Strategic Long-Term Vision for a
Prosperous, Modern, Competitive and Climate Neutral Economy (Vision)” proposed by the EU
Commission in November 2018 (EU 2018c).
In Section 3 we derive exemplary emission pathways for ETS sectors that remain within the GHG
budget for ETS sectors that we have calculated in Section 2. Moreover, we characterize how the
emission reduction potential of interacting energy and climate policies should be reflected in the
cap reduction path up to 2030 in order to safeguard the scarcity and effectiveness of the EU ETS.
For this purpose, we develop scenarios incorporating both increased renewable and energy
efficiency targets at the European level and national energy policies, in particular coal phase-out
policies.
12CLIMATE CHANGE EU ETS up to 2030: Adjusting the Cap in light of the IPCC1.5 C Special Report and the Paris Agreement
2 Deriving a budget for EU ETS in light of the Paris Agreement and the IPCC
SR1.5
2.1 Cumulative emissions in the IPCC SR1.5 and the EU Commission’s vision
“A clean planet for all”
The Paris Agreement and the IPCC SR1.5 (IPCC 2018) constitute the international framework
defining the required extent of European climate action. Under the Paris Agreement,
governments agreed to a long-term goal of keeping the global temperature increase to well
below 2 degrees Celsius above pre-industrial levels, and aim to limit the increase to 1.5 degrees.
It was also agreed that emissions should peak as soon as possible and decline rapidly thereafter,
in accordance with the best available science.1 Parties regularly submit Nationally Determined
Contributions (NDCs) declaring their emission mitigation targets.
IPCC SR1.5 indicates that risks from temperature increases by 2 degrees are significantly more
substantial than those of a warming by 1.5 degrees, which strongly suggests that global climate
action should avoid large overshoots of the 1.5 degree goal in addition to keeping the increase
well below 2 degrees. How to achieve this in terms of mitigation pathways has been addressed
by targeting global cumulative emissions of CO2 until 2100 – a so called emission budget – and
enhanced in recent studies on total GHG emissions. According to the IPCC SR 1.5, to limit
warming to 1.5 degrees with a probability of at least 66% (with no temporary overshoot), a
global budget of 420 to 570 Gt CO2 remains – before accounting for other GHG gases and
depending on which method is used (IPCC SR1.5, SPM C.1.3). However, for a variety of reasons
there are large uncertainties associated with the budget, in the order of several hundreds of Gt
CO2 (IPCC SR1.5, SPM C.1.3). Therefore, the budget could also be substantially smaller, due to,
among others, the impact and mitigation potential of non-CO2 greenhouse gas emissions.2
The large uncertainty associated with a remaining global CO2 budget makes it a challenge to
derive an adequate budget for the ETS sectors. In addition to the uncertainty in the global
budget, a fair distribution of this global budget between countries is a highly political and
contentious issue. There are multiple approaches, each with their strengths and weaknesses. In
particular, a distribution based solely on fairness approaches (including historical
responsibility) may result in a politically, economically and technically infeasible emission
pathway for the EU. Thus, deriving an emissions budget that is compatible with the Paris
Agreement for a group of countries such as the EU or for EU ETS sectors is a challenge and will
always be subject to reasonable criticism. Despite this, orientation is required to derive an EU-
ETS budget that may be regarded as compatible with the Paris Agreement and translate it into a
cap reduction path. The calculated budget should also be continuously monitored based on the
latest scientific developments and – if required – adapted accordingly.
We therefore also consider the “Strategic Long-Term Vision for a Prosperous, Modern,
Competitive and Climate Neutral Economy (Vision)” the EU Commission proposed in November
2018 (EU 2018c) to find a benchmark ETS budget. The EU Commission developed its Vision “A
Clean Planet for All” with the goal of aligning the European emission pathway with the EU’s
required contributions under the Paris Agreement. The EU Commission assumes that this means
1 Cf. https://ec.europa.eu/clima/policies/international/negotiations/paris_en for further details on the
Paris Agreement.
2 Chapter 2 of IPCC SR1.5 provides an overview of the most likely carbon budgets (i.e. excl. non-CO2
emissions) for different limits of global warming with associated probabilities.
13CLIMATE CHANGE EU ETS up to 2030: Adjusting the Cap in light of the IPCC1.5 C Special Report and the Paris Agreement
reaching net-zero GHG emissions in 2050. The In-depth Analysis underlying the Vision features
two scenarios targeting net-zero GHG emissions in 2050, the 1.5TECH and 1.5LIFE scenarios (EU
2018d). In addition to abatement action, both scenarios feature substantial negative emissions,
to be achieved through LULUCF and carbon removal technologies. The In-depth Analysis also
provides some information on the expected cumulative emissions between up to 2050 and 2100.
Other than the IPCC SR1.5, the data include non-CO2 emissions, which have large uncertainties,
especially in the agriculture and waste sector, whereas in the ETS sectors, non-CO2 emissions do
not play a major role quantitatively.
For our assessment we consider the cumulative GHG emissions of the mean of the scenarios
1.5TECH and 1.5LIFE as a proxy for an emission budget target consistent with the Vision’s goal
of achieving net-zero emissions by 2050. We derive both total and ETS emissions of the net-zero
GHG scenarios from the In-depth Analysis (EU 2018d).
For the EU ETS emissions, we assume that the reduction of EU ETS emissions by 49.8% until
2030 in the recent EUCO3232.5 scenario (EU 2019) applies to 1.5TECH and 1.5LIFE, as the
scenarios 1.5TECH and 1.5LIFE are strongly in line with the EUCO3232.5 scenario until 2030.
For 2050 emissions, we use the mean ETS emissions of 1.5TECH and 1.5LIFE as given in the In-
depth Analysis (which is close to net-zero), while we estimate the 2040 value based on sectoral
data from the In-depth Analysis. More details on the assumptions can be found in the technical
annex to this study.
For the GHG emissions in EU ETS sectors in 2016-2050, we calculate cumulative emissions of 33
Gt CO2e (see Table 1:). Note that the ETS emissions calculated in the In-depth Analysis are based
on the assumption that emissions will decrease according to the revised renewable and
efficiency targets for 2030. Without adjusting the LRF of the cap accordingly, annual and
especially cumulative ETS emissions could be higher as the current requirement is only a
reduction by 43% up to 2030 (compared to 2005).
Table 1: Annual and cumulated EU ETS GHG emissions of the EU Long-term Strategic Vision
Gt CO2e 2015 2030 2040 2050 2016-2050
EU ETS GHG emissions, EU 2.0 1.2 0.3 0.0 33
Long-Term Strategic Vision
Source: Own calculations. EU ETS emissions are calculated using the mean of the scenarios 1.5LIFE and 1.5TECH based on
EU (2018d), Figures 60, 61, 90 and Table 9.
The scenarios 1.5TECH and 1.5LIFE were mainly based on the assumption that net-zero GHG
emissions in 2050 are in line with limiting global warming to 1.5 degrees Celsius and the current
EU 2030 framework. We ask whether these scenarios are also in line with the global budget
requirements for the EU ETS implied by limiting global warming to 1.5 degrees. We tackle this
question in the next subsection.
2.2 Calculating an EU ETS emissions budget based on globally cost effective
pathways
To assess the cumulative ETS emissions of the EU long-term Vision in light of the IPCC SR1.5, we
need to derive an emission budget for the EU ETS from the global GHG budget. However,
deriving an emissions budget for the EU ETS is challenging, as it includes a normative choice
about the probability to achieve a certain temperature goal and about how to split the
corresponding global budget among countries. There are several different approaches present in
14CLIMATE CHANGE EU ETS up to 2030: Adjusting the Cap in light of the IPCC1.5 C Special Report and the Paris Agreement
the international debate, e.g. using the criterion of cost-effectiveness or a range of fairness
criteria (e.g. Van Vuuren et al. (2017) and Matthes et al. (2018)).
A budget split according to the cost-effectiveness criterion allocates shares of the global budget
in a way that the global cost of emission mitigation is minimized. Using the cost-effectiveness
criterion leads to higher shares of the global emission budget for developed economies such as
the EU. Using fairness criteria, e.g. based on population shares, considering economic capacities
or accounting for historical emissions, decreases the share of the total emission budget available
for the EU substantially. Using the cost-effectiveness criterion therefore yields an upper bound
for the EU’s share of the global emission budget. The EU’s cost-effective budget thus indicates
how much abatement should occur inside the EU, at a minimum. Targeting an EU budget based
on fairness criteria would require further abatement or additional action outside the EU, e.g. by
supporting mitigation efforts in emerging and developing economies through strengthened
multi- and bilateral cooperation, capacity building, technology transfer and financial transfers
(UBA 2018). We use the cost-effectiveness criterion here to derive the EU ETS share of the global
emission budget as it sets the maximum available budget for the EU ETS that could be regarded
as in line with the requirements of the 1.5 degree temperature goal. This allows us to assess
whether the two scenarios leading to net-zero emissions by 2050 (1.5TECH and 1.5LIFE) of the
“Vision” comply with the (domestic) emission reduction requirements in terms of cumulative
emissions of the EU ETS.
Our calculations are based on the class of pathways called “below-1.5-degree pathways” in the
IPCC SR1.5. This most ambitious class of pathways is defined as achieving a probability of 50 –
66% of staying below 1.5 degrees Celsius of warming for the entire 21st century. These pathways
are, hence, as close as possible to the requirement of limiting global warming to 1.5 degrees
Celsius with 66% probability, as stated by UBA (2018).3
We apply data from the POLES-Enerdata model (2018 version) to derive the globally cost-
effective EU share of the global emission pathways. For the below-1.5-degree pathways, we
derive the median evolution of global energy- and process-related CO2 emissions from the IAMC
1.5 degrees Celsius scenario explorer4. We translate these into energy- and process-related GHG
emissions by adding a fixed increase of 15% to the energy- and process-related CO2 emissions5
throughout the period with positive emissions. As the share of energy-related non-CO2
emissions in the EU is substantially smaller, this might overestimate EU’s emission budget
slightly. Here, we also take into account non-CO2 GHG emissions because both the data on the
ETS in the Commission’s In-depth Analysis (EU 2018d) and the data from the POLES-Enerdata
model, which we will use in the following, include non-CO2 emissions. We note that non-CO2
emissions in the EU ETS have been reduced to less than 1% of the total cap already. So for the
calculations regarding ETS sectors, non-CO2 emissions do not play a major role quantitatively.
We translate the global energy- and process-related GHG emission pathways for the period 2016
– 2050 into national emission levels by applying a globally uniform shadow carbon price
pathway that yields the globally required emission reductions in the POLES-Enerdata model.
The globally uniform shadow carbon price is applied to all sectors in the EU as well. For the
3 We note that Wachsmuth et al. (2019) assume an interim limited overshoot of 1.5 degrees Celsius as
being in line with the Paris Agreement and consequently, the emission reduction levels for the EU would
be somewhat less ambitious.
4 The IAMC 1.5 degree Celsius scenario explorer is available online at: https://data.ene.iiasa.ac.at/iamc-
1.5c-explorer/.
5 This reflects the global 2015 share of energy- and process-related CO emissions in total energy- and
2
process-related GHG emissions of 87%.
15CLIMATE CHANGE EU ETS up to 2030: Adjusting the Cap in light of the IPCC1.5 C Special Report and the Paris Agreement
years after 2030, the required emission reduction exceeds the reduction potential at the
maximum carbon price level included in the POLES data. Therefore, we assume the existence of
a backstop-technology (e.g. a negative emissions technology) and scale the minimum sectoral
emission levels in POLES to the required level uniformly across sectors. The EU ETS emissions
are derived by calibrating the emissions in the power sector and the energy-intensive industry
sectors in the 2015 data from the POLES-Enerdata model to the ETS cap in 2015. More details on
the methodology are provided in the technical annex.
The resulting annual emission levels for the EU ETS in 2030, 2040 and 2050 are given in Table 2.
Our calculations yield a GHG budget of approximately 30 Gt CO2e available for ETS sectors if the
remaining global budget is split between countries and sectors based on cost-effectiveness as
explained above.
Table 2: Annual and cumulated EU ETS GHG emissions in a globally cost-effective below-1.5-
degree pathway and in the EU Long-term Strategic Vision
Gt CO2e 2015 2030 2040 2050 2016-2050
EU ETS GHG emissions, globally 2.0 0.9 0.3 0.0 30
cost-effective below-1.5-degree
pathway
EU ETS GHG emissions, EU Long- 2.0 1.2 0.3 0.0 33
Term Strategic Vision
Source: Own calculations. EU ETS emissions in the globally cost-effective below-1.5-degrees pathway are calculated based
on data from the POLES-Enerdata model. EU ETS emissions are calculated using the mean of the scenarios 1.5LIFE and
1.5TECH based on EU (2018d), Figures 60, 61, 90 and Table 9.
We observe that even though the cost-effective budget – the effort-sharing approach most
favorable to the EU – is relatively close to the mean of the two most ambitious scenarios in the
EU’s Vision, the budget implied by the Vision exceeds the cost-effective budget by around 10%.
The estimated EU ETS budget in the EU Long-term Vision contains about 3 Gt CO2e more than
our calculated 30 Gt CO2e budget.
However, the mismatch between the EU’s current climate framework and the calculated GHG
budget for ETS sectors is far more dramatic. The current ETS parameters (LRF of 1.74% up to
2020, from 2021 onwards 2.2%) implies total GHG emissions of about 25 Gt CO2e in ETS sectors
for 2016-2030 (sum of ETS caps in this period), so that only about 5 Gt CO2e would remain for
ETS sectors for the time after 2030 in the cost-effectiveness budget. Our calculations indicate
that the EU ETS budget compatible with a temperature goal of 1.5 degrees remaining after 2030
would require drastic abatement action after 2030 if current policy parameters are not changed,
which seems unrealistic from an economical, technical and political perspective.
Therefore, defining a more stringent pathway leading to an earlier deep decarbonization than
envisioned in the current energy and climate framework up to 2030 and even earlier than in the
long-term Vision is required to increase the credibility of the EU ETS being consistent with the
Paris Agreement. As we show in Section 3, the ETS emission pathway implied by current ETS
parameters would require unrealistically drastic action after 2030 and is therefore not
compatible with the Paris Agreement. Stronger early action would increase the credibility of
European climate action.
16CLIMATE CHANGE EU ETS up to 2030: Adjusting the Cap in light of the IPCC1.5 C Special Report and the Paris Agreement
3 Deriving emission pathways for ETS sectors while staying within our
assumed cost-effective budget
In this section, we present emission pathways for ETS sectors that remain within the budget of
30 Gt CO2e for 2016-2050 we have derived from the global below-1.5-degree pathways by using
data from the POLES-Enerdata model, based on the assumption of a global cost-effective
splitting of the remaining emission budget. First, we compare the baseline scenario with
constant ETS pathways as laid down in the current legal framework. In addition we consider two
scenarios for which the 2030 target for the EU ETS is chosen based on the above introduced
(global) cost-effective scenarios. This is equivalent to a reduction of ETS emissions of 61% by
2030 compared to 2005. We exclude emissions becoming net-negative in order to avoid the
possibility of overshooting the target. Moreover, we assume that the LRF of the cap in its current
design is the single ETS parameter to be changed.6 We assume that changes in the LRF may only
be undertaken at the beginning of each of the five year long ETS allocation periods in 2021,
2026, 2031, 2036 and 2041. As we have fixed a budget for 2016-2050 and assume no changes
before 2021, the cumulative emissions in 2021-2050 are the same in all cases (about 20 Gt
CO2e).
We present the following three scenarios which are consistent with the 30 Gt CO2e cumulative
emissions between 2016 and 2050:
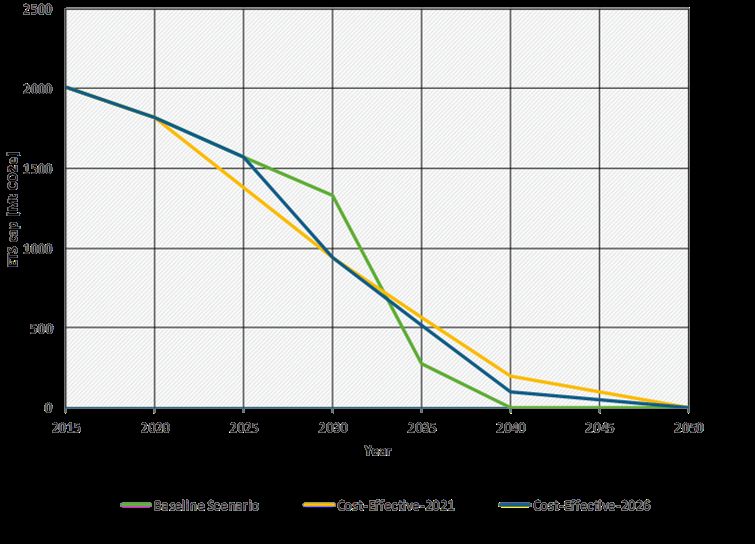
1. In the Baseline scenario (green line), the LRF stays at 2.2% until 2030, as under the
current EU policy framework. In this case, 25.3 Gt CO2e of the EU ETS budget are used
during the period 2016-2030, with about 5 Gt CO2e remaining for the time after 2030.
Remaining within the Paris-consistent budget after 2030 would correspond to an LRF of
9.6% for 2031-2035, 2.5% for 2036-2040 and net-zero emissions by 2040.7
2. In the Cost-Effective-2026 scenario (blue line), we assume that the LRF remains at 2.2%
for 2021-2025 and can be adjusted in 2026. A concave reduction path is chosen for the
time after 2026 to achieve cost-effectiveness (e.g. by avoiding technology lock-in) and
achieve a 61% reduction in ETS sectors by 2030, compared to 2005 levels. This
corresponds to LRFs of 5.8% for 2026-2030, 3.8 % for 2031-2040, 0.4% for 2041-2050
and net-zero emissions in 2050.
3. In the Cost-Effective-2021 scenario (yellow line), we assume that the LRF can be
adjusted in 2021 already. Again, we choose a concave reduction path to achieve a 61%
reduction in ETS sectors by 2030, compared to 2005 levels. The Cost-Effective path in
this scenario yields an LRF of 4.0% for 2021-2030, 3.4 % for 2031-2040, 0.9% for 2041-
2050. Net-zero emissions are achieved in 2050.
The three scenarios are presented graphically in Figure 1.
6 In EU ETS, the LRF is defined as the share of the cap in 2010, which is subtracted from the cap every year
thereafter. An LRF of 2.2% corresponds to an annual reduction in the cap by approximately 48 million
allowances.
7 We divide the budget remaining after 2030 in a way that the maximum LRF is as low as possible, under
the restriction that changes to the LRF can be made every five years only.
17CLIMATE CHANGE EU ETS up to 2030: Adjusting the Cap in light of the IPCC1.5 C Special Report and the Paris Agreement
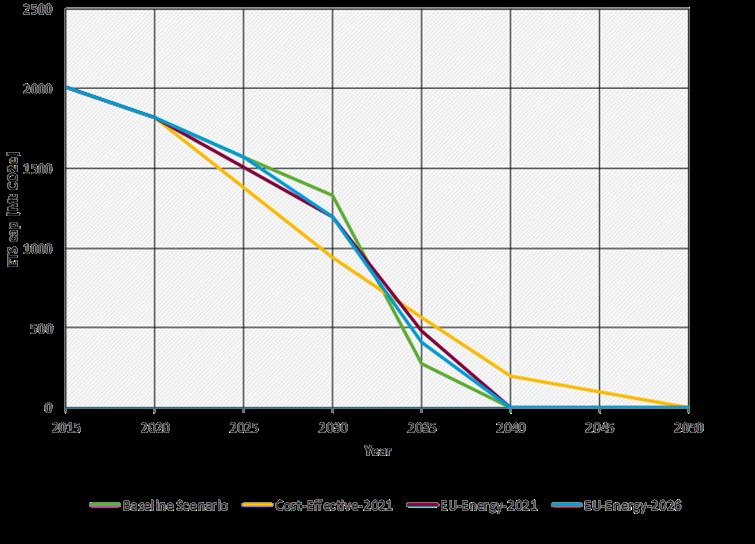
Figure 1: Base case and two alternative scenarios for the ETS cap 2021-2050 staying within a
budget of 30 Gt CO2e (2016-2050)
Source: Own calculations.
Maintaining an LRF of 2.2% until 2030 while staying within the 30 Gt CO2e emissions budget as
assumed in the Baseline scenario (green line), will lead to drastic abatement action after 2030,
implying an LRF of almost 10% - a cap reduction of more than 200 million allowances each year
- during the period 2031-2035. This would correspond to a decrease in the cap from about 1.3
billion allowances in 2030 to about 240 million allowances within five years. Staying within the
budget of 30 Gt CO2e while maintaining the current parameters up to 2030 would also require
that net-zero GHG emissions are achieved by 2040 already.
If the LRF was adjusted in 2021 already as assumed in the Cost-Effective-2021 scenario (yellow
line), an emission pathway consistent with the 30 Gt CO2e budget could be achieved in a more
balanced way. The cap would be reduced from 1.8 billion allowances to about 930 emission
allowances within 10 years (2021-2030, with an annual reduction of about 90 million
allowances or a LRF of about 4%). If such an adjustment is only possible starting in 2026 as
assumed in the Cost-Effective-2026 scenario (blue line), the post-2026 LRF must temporarily
be at almost 6% (that means the cap must be reduced by 130 million allowances each year) to
stay within the 30 Gt CO2e budget. In both Cost-Effective scenarios, net-zero emissions will be
necessary by 2050, with some scope for emissions between 2040 and 2050.
We conclude that keeping the LRF unchanged until 2030 and remaining within the 30 Gt CO2e
emissions budget (2016-2050) that we deem to be roughly in line with 1.5 degrees will require
drastic change in later years, which seems unrealistic from an economical, technical and political
18CLIMATE CHANGE EU ETS up to 2030: Adjusting the Cap in light of the IPCC1.5 C Special Report and the Paris Agreement
perspective. Adjusting the LRF in 2026 only would still require a very strong increase of
emission reductions between 2026 and 2030 in order to remain in line with this budget. Only
early action – raising the LRF to 4% in 2021 already – yields a relatively smooth emission
pathway.
3.1 Minimum adjustment of the EU ETS cap reflecting interacting EUs energy
and national climate policies
Having defined the Baseline scenario and the two Cost-Effective scenarios above, we now
introduce minimum requirements for the EU ETS to restore consistency of GHG reduction and
energy policies up to 2030. This would be necessary anyway to maintain the scarcity signal of
EU ETS in the context of interacting EU level and national energy policies. This approach also
allows us to develop an intuition of the extent of the required ambition raising in EU ETS that
can already be addressed by accounting for those interacting policies.
The EU ETS cap must be sufficiently stringent in terms of market scarcity to maintain incentives
for emission reductions by covered entities. If additional emission reductions in ETS sectors
occur due to interacting climate and energy policies while the EU ETS cap is determined without
taking these additional reductions into account, the allowance price will decline, leading to a loss
in the effectiveness of the EU ETS and the additional emission reductions might not occur due to
the “waterbed effect”. To avoid such a loss in effectiveness, the ETS cap should take additional
reductions from EU-level and national-level interacting climate and energy polies into account.
In the period up to 2030, there are two main sources of emission reductions in ETS sectors not
accounted for by the current LRF of 2.2%:
1. More stringent binding energy policy targets until 2030, as defined in the Clean energy
for all Europeans package (EU 2018e). In particular, the target for the share of renewable
energy (RE) was revised from 27% to 32%, while the target for energy efficiency (EE)
was increased from 27% to 32.5%. We consider the potentials for EU ETS cap
adjustment due to EU energy policies in Section 3.2.
2. Several EU Member States are planning phase-outs of coal-fired power generation by
2030. If implemented fully as currently planned and coal-fired capacities are being
replaced by renewable energies, these phase-outs may lead to emission reductions of up
to 300 Mt CO2 in the year 2030, compared to 2018. The potential for cap adjustment due
to these national policies is evaluated in Section 3.3.
Both EU and national policies require an adjustment of the cap to maintain scarcity and avoid
losses in the effectiveness of the EU ETS. We consider a cap adjustment reflecting the policies
outlined above as a minimum in order to ensure scarcity, i.e. a proper functioning of the ETS by
2030. Additional adjustments must occur to bring the ETS cap in line with the required
European contributions under the Paris Agreement. However, the potential for GHG savings
coming from the energy measures also provide a clear political opportunity to adjust the cap in
the direction which is required for a Paris compatible ETS as there are already underpinning
measures and targets for their realization in place.
In Sections 3.2 and 3.3 we estimate the potentials for cap adjustment due to the respective
policies. Note that reductions due to the adjusted European energy policy targets may be
considered as more certain, as these targets are part of the EU governance process. In contrast,
19CLIMATE CHANGE EU ETS up to 2030: Adjusting the Cap in light of the IPCC1.5 C Special Report and the Paris Agreement
at this stage, we consider the reduction potentials from national policies to be less certain as it is
not sure how much coal power will be replaced by renewable energy or by other fossil fuels.
Moreover, EU level and national climate and energy policies interact, so that it is uncertain how
much reduction potential will be realized from national policies in addition to the EU level
targets. For these reasons we consider the additional reduction potential from European targets
as a lower bound for the necessary cap adjustment in the EU ETS. National policies are likely to
further increase the potential for lowering the cap, however, the magnitude of the aggregate
reduction potential from the combination of EU level and national policies is not yet clear.
3.2 Potential for raising ambition in the EU ETS - Interacting EU energy
policies
This section outlines the implications for EU ETS up to 2030 from aligning ETS parameters with
the additional emission reductions from interacting EU energy policies introduced in the Clean
energy for all Europeans package (EU 2018e). In particular, the targets for the RE share (32%)
and the improvement in EE (32.5%) were increased compared to 2014, when the ETS
parameters were adopted. It is assumed – both in the Clean energy package and in the Vision –
that fully implementing all measures in the package will lead to a reduction in GHG emissions of
at least 45% by 2030, compared to 1990 levels (EU 2018c, EU 2018e). This would translate to an
emission reduction in the EU ETS by 49.8% in 2030, compared to 2005 levels (EU 2019).
This reduction would be in excess of the current 40% emission reduction target for 2030, which
implies a 43% reduction in the EU ETS by using an LRF of 2.2%. As the EU ETS cap has not yet
been updated to reflect the effect of these interacting policies, keeping the LRF unchanged at
2.2% until 2030 would lead to a diminished scarcity signal and lower allowance prices in the EU
ETS. This would threaten the effectiveness of the EU ETS and of the EU’s target triangle
consisting of emission reduction, renewable energy and energy efficiency targets. The more
stringent energy policies therefore necessitate a concurrent tightening of the cap to maintain the
balance of the European target triangle.
We now compare our Baseline and Cost-Effective-2021 scenarios with two scenarios that take
into account the potential for a tighter emission target for 2030 in ETS sectors from
implementing the more stringent EU energy policies. As before, all scenarios remain within their
Cost-Effective budget of about 30 Gt CO2e for 2016-2050 which is deemed to be in line with a
cost-effective contribution of EU to limiting global warming to 1.5 degrees.
1. Baseline scenario (green line), as in Section 3.
2. Cost-Effective-2021 scenario (yellow line), as in Section 3.
3. In the EU-Energy-2026 scenario (blue line), the LRF is chosen to achieve a reduction of
around 50% in ETS sectors by 2030, compared to 2005 levels. Simultaneously, the EU
ETS sectors remain within their Cost-Effective budget of about 30 Gt CO2e for 2016-
2050. We assume that the LRF cannot be changed before 2026. This corresponds to an
LRF of 2.2% for 2021-2025, 3.5% for 2026-2030, 7.0% for 2031-2035, 3.8% for 2036-
2040 and net-zero emissions by 2040.
4. The EU-Energy-2021 scenario (red line) satisfies the same parameters as the EU-
Energy-2026 scenario, except that we assume that the LRF can be changed in 2021
already. In this case, the LRF is 2.9% for 2021-2030, 6.3% for 2031-2035, 4.5% for 2036-
2040 and net-zero emissions are again achieved by 2040.
The four scenarios are presented in Figure 2.
20CLIMATE CHANGE EU ETS up to 2030: Adjusting the Cap in light of the IPCC1.5 C Special Report and the Paris Agreement
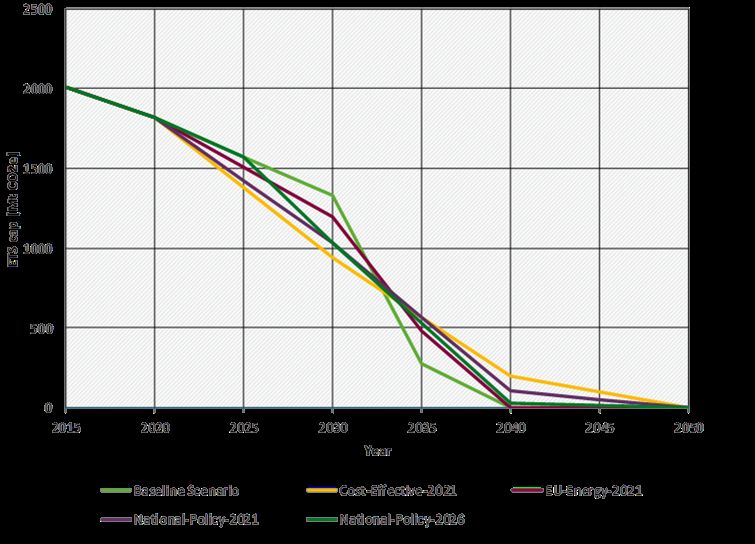
Figure 2: Scenarios accounting for the EU Energy policy targets adopted in 2018
Source: Own calculations.
We observe that accounting for the revised energy policy targets somewhat alleviates the need
for a drastic increase in ambition after 2030 of the Baseline scenario. However, the EU-Energy-
2026 scenario still requires a reduction of the cap by 780 million allowances within only 5 years
(corresponding to an LRF of about 7%) after 2030 and net zero emissions in 2040, while the
corresponding EU-Energy-2021 scenario requires a reduction of the cap by 710 million
allowances (LRF of 6.5%) between 2030 and 2035 and net zero emissions in 2040 also. Both
scenarios require much more drastic emission reductions after 2030 than the Cost-Effective-
2021 scenario, which additionally leaves some remaining budget for emissions in the decade of
2040-2050.
Overall, incorporating the revised 2030 energy policy targets helps alleviating, but not avoiding
the unrealistic drastic post-2030 effort of the Baseline scenario. To achieve a more realistic
pathway towards fulfilling the EU’s required contributions under the Paris Agreement, not only
the new EU-level energy targets should be incorporated in an adjusted LRF, but further
potentials for cap reduction should be investigated as soon as possible, ideally from 2021
already. Moreover, a reduction by 50% in ETS sectors by 2030 would no longer be in line with
the updated aim of the incoming European Commission, which is planning to decrease overall
EU emissions by minimum 50%, up to 55% in 2030, compared to 1990 levels (von der Leyen
2019). Due to their lower abatement costs ETS sectors would be required to abate more than
proportionately to achieve cost effectiveness.
21CLIMATE CHANGE EU ETS up to 2030: Adjusting the Cap in light of the IPCC1.5 C Special Report and the Paris Agreement
3.3 Potential for raising ambition in the EU ETS - Interacting national energy
policies
Apart from energy policies at the EU level, national climate and energy policies providing
additional emission reductions by 2030 must also be accounted for as a minimum requirement
when adjusting the cap of the EU ETS for the period 2021/2026 to 2030 and beyond. Several
member states are currently planning policies to phase out coal-fired power generation. Such
national policies further increase the potential for more abatement in ETS sectors than foreseen
in the current 2030 framework. As with tighter EU level energy policies, disregarding additional
national measures would weaken the scarcity signal of the EU ETS, lead to lower allowance
prices in the future, foster technology lock-in and decrease the likelihood of staying within an
emissions budget that is compatible with limiting global warming to1.5 degrees. However, in the
context of this paper, these policies are in particular also an argument that there are short term
potentials available that allow for an adjustment of the ETS cap that can close the gap between
the current ETS framework and an emissions budget that can be regarded as compatible with
limiting global warming to 1.5 degrees.
Several member states are planning to phase out coal by 2030, with Germany planning to
decommission a portion of its coal-fired capacity before 2030 and the remaining capacity until
2038 at the latest.
Table 3: Coal power generation in 2018 in countries with planned phase-outs of coal-fired
power generation
TWh in 2018 Lignite Hard Coal Total
Phase-out before 2030 108 208 316
Full phase-out by 2025
(AT, BE, FR, IE, IT, SE, SK, UK) 3 58 61
Full phase-out by 2030
(DK, EL, ES, FI, HU, NL, PT) 25 96 121
Partial phase-out by 2030
(Germany) 80 54 134
Source: own calculation based on Agora (2019). Coal phase-out in Germany is based on the proposal by the WSB (2019)
Note: The estimate for Germany assumes that power generation in phased-out plants (both lignite and hard coal) is
proportional to the capacity. This is an optimistic estimate, as phased-out plants are likely to have fewer full load hours and
moreover remaining capacities may partially compensate the phase-out.
Table 3 summarizes national plans to phase out coal-fired power generation in TWh by 2030
compared to coal power generation in 2018 according to Agora (2019). We assume that the 316
TWh of electricity generated by coal in 2018 will be fully substituted by zero-emission electricty
(i.e. renewable energy) with unchanged demand and therefore an unchanged quantity of
electricity production.8 By doing so, we show the maximum potential for adjustments of the ETS
cap coming from national energy policies that are currently under discussion. If these policies
are implemented as currently discussed, this would likely imply the need for a further increase
8In case the phased-out coal capacity is (partially) substituted by other fossil-based capacity, the emission
savings will be less, depending on the substitute.
22You can also read