Seasonal Variation in the Rhizosphere and Non-Rhizosphere Microbial Community Structures and Functions of Camellia yuhsienensis Hu - MDPI
←
→
Page content transcription
If your browser does not render page correctly, please read the page content below
microorganisms
Article
Seasonal Variation in the Rhizosphere and
Non-Rhizosphere Microbial Community Structures
and Functions of Camellia yuhsienensis Hu
Jun Li , Ziqiong Luo, Chenhui Zhang, Xinjing Qu, Ming Chen, Ting Song and Jun Yuan *
 Key Laboratory of Cultivation and Protection for Non-Wood Forest Trees, Ministry of Education,
 Central South University of Forestry and Technology, Changsha 410004, China; chuannonglj@163.com (J.L.);
 luoluoziqiong@163.com (Z.L.); kwinnerkin@163.com (C.Z.); xinjingqu@126.com (X.Q.);
 hncscm2010@163.com (M.C.); stxiaomaoji@163.com (T.S.)
 * Correspondence: yuanjun@csuft.edu.cn

 Received: 10 August 2020; Accepted: 9 September 2020; Published: 10 September 2020

 Abstract: Camellia yuhsienensis Hu, endemic to China, is a predominant oilseed crop, due to
 its high yield and pathogen resistance. Past studies have focused on the aboveground
 parts of C. yuhsienensis, whereas the microbial community of the rhizosphere has not been
 reported yet. This study is the first time to explore the influence of seasonal variation
 on the microbial community in the rhizosphere of C. yuhsienensis using high-throughput
 sequencing. The results showed that the dominant bacteria in the rhizosphere of C. yuhsienensis were
 Chloroflexi, Proteobacteria, Acidobacteria, Actinobacteria, and Planctomycetes, and the dominant
 fungi were Ascomycota, Basidiomycota, and Mucoromycota. Seasonal variation has significant effects
 on the abundance of the bacterial and fungal groups in the rhizosphere. A significant increase in
 bacterial abundance and diversity in the rhizosphere reflected the root activity of C. yuhsienensis
 in winter. Over the entire year, there were weak correlations between microorganisms and soil
 physiochemical properties in the rhizosphere. In this study, we found that the bacterial biomarkers in
 the rhizosphere were chemoorganotrophic Gram-negative bacteria that grow under aerobic conditions,
 and fungal biomarkers, such as Trichoderma, Mortierella, and Lecanicillium, exhibited protection against
 pathogens in the rhizosphere. In the rhizosphere of C. yuhsienensis, the dominant functions of the
 bacteria included nitrogen metabolism, oxidative·phosphorylation, glycine, serine and threonine
 metabolism, glutathione metabolism, and sulfur metabolism. The dominant fungal functional
 groups were endophytes and ectomycorrhizal fungi of a symbiotroph trophic type. In conclusion,
 seasonal variation had a remarkable influence on the microbial communities and functions, which were
 also significantly different in the rhizosphere and non-rhizosphere of C. yuhsienensis. The rhizosphere
 of C. yuhsienensis provides suitable conditions with good air permeability that allows beneficial
 bacteria and fungi to dominate the soil microbial community, which‘can improve the growth and
 pathogen resistance of C. yuhsienensis.

 Keywords: Camellia yuhsienensis Hu; high-throughput sequencing; seasonal variation;
 rhizosphere; microorganism

1. Introduction
      Microorganisms play a significant role in the decomposition process of soil organic matter,
litter, and wood residues [1–3]. The microbial community structures partly reflect the nutrient and
health conditions of the soil. Some bacterial phyla only proliferate in copiotrophic substances, such as
Alphaproteobacteria, Betaproteobacteria, and Bacteroidetes, while others proliferate in oligotrophic

Microorganisms 2020, 8, 1385; doi:10.3390/microorganisms8091385         www.mdpi.com/journal/microorganisms
Microorganisms 2020, 8, 1385                                                                           2 of 19

substances, such as Acidobacteria [4–6]. Some fungi are interdependent with the plant rhizosphere,
such as arbuscular mycorrhizal fungi, while others can cause plant disease, such as Venturia inaequalis [7–9].
Due to their sensitive features, microorganisms are significantly regulated by many factors, such as plant
roots and seasonal variation [10–12].
      The rhizosphere is recognized as one of the most complex environments colonized by
significant numbers of microorganisms [13]. Generally, plant roots impact microorganisms via
their physiological activity, such as the production of secondary metabolites [14]. Thus, the microbial
communities around the rhizosphere have a close association with plant roots and differ significantly
from the non-rhizosphere microbial communities. Rhizosphere microorganisms are mainly
divided into two categories according to whether they have deleterious or beneficial effects on
plants [15]. The beneficial microorganisms, for example, can promote the abiotic stress tolerance of
plants, facilitate nutrient absorption and plant growth, and protect plants from pathogens [16,17].
On the contrary, harmful microorganisms, such as deleterious rhizobacteria, are largely saprophytic
bacteria that aggressively colonize plant roots, which leads to plant disease, the inhibition of root
growth, the suppression of plant growth, and crop failure [18]. Seasonal variation has major direct and
indirect influences on the rhizosphere microbial community. Soil water content affects the rhizosphere
microbial community significantly. Zhou et al. [19] found that regardless of water availability,
microbial activities were restricted in the rhizosphere of wheat. Similarly, the research of Ilyas and
Bano [20] indicated that there were more Azospirillum strains isolated from the rhizosphere soil of
plants in well-watered conditions than in arid and semiarid conditions. Seasonal drought and rainfall
have a significant influence on rhizosphere microbial diversity and abundance [21]. Drought stress can
indirectly impact microorganisms by restricting plant root growth and regulating root exudation [22].
López-Gutiérrez et al. [23] reported that seasonality could mediate arbuscular mycorrhiza-colonized
root length, dehydrogenase activity, and bacterial plate counts in the rhizosphere. Microorganisms are
usually classified according to different functions. Due to the activity of plant roots, there are major
differences in the microbial functions between the rhizosphere and in the bulk soil. Yang et al. [24] found
that microbial catabolic diversity in the rhizosphere differed significantly from that in the bulk soil.
Mestre et al. [25] explored yeast community and function in Nothofagus pumilio forests. They found that
glucose fermentation, organic acid production, and cellobiose assimilation occurred more frequently in
the rhizosphere than in the bulk soil. Hernesmaa et al. [26] revealed that the numbers of cultivable
bacteria and phosphatase activity in the rhizosphere of Scots pine were significantly higher than in the
bulk soil. In summary, microbial communities in the rhizosphere are indispensable for plants [27].
Therefore, researching the dynamics of the rhizosphere microbial community across seasons could
inform the promotion of plant growth and yield.
      Camellia yuhsienensis Hu, a species of oil tea, was once widely cultivated in central China because
of its high yield and high resistance to disease pathogens [28]. Cook et al. [29] found that plants
tend to regulate microbial communities for their own benefit. Previous studies have reported on the
significant carbon metabolic activity in the rhizosphere and bulk soil of Camellia oleifera plantations,
another species of oil tea [10,30]. Hartmann et al. [31] revealed that specific microenvironments around
the rhizosphere lead to specific interactions among microbes with the development of plant roots,
resulting in the biological protection of plants from pathogenic microbes. However, the above studies
on microbial communities in the rhizosphere or bulk soil of C. oleifera plantations did not observe any
microorganisms with great disease resistance against pathogens. Previous studies have confirmed
that the disease resistance of C. oleifera is inferior to that of C. yuhsienensis [28,32]. No studies have
explored the rhizosphere microbial community of C. yuhsienensis. Therefore, we hypothesize that
some specific microbial communities must exist that improve the resistance of C. yuhsienensis to
pathogens, and furthermore, that these microbial communities might be regulated by seasonality.
In order to verify this, high-throughput sequencing was used to determine the microbial community
structure and functions in the rhizosphere and non-rhizosphere of C. yuhsienensis in spring, summer,
autumn, and winter.
Microorganisms 2020, 8, 1385                                                                            3 of 19

2. Materials and Methods

2.1. Site Description
     The sampling site was located at a 10-year-old C. yuhsienensis forest in Youxian, Hunan,
China (N 27◦ 020 , E 113◦ 200 ). The plant and row spacing were 2 m and 3 m, respectively. The climate
is subtropical monsoon with a mean annual total rainfall and temperature of 1410 mm and
17.8 ◦ C, respectively [33]. The soil at the experimental site is a Quaternary red clay with a pH of
4.1–4.5. The total organic matter content is 17–23 g/kg. The total nitrogen content is approximately
330–810 mg/kg. The available phosphorus content is 0.1–10 mg/kg, and the available potassium
content is 64–95 mg/kg. The chemical properties mentioned above are displayed in Table S1.

2.2. Experimental Design and Sampling
     According to the phenological phase of C. yuhsienensis, the soil samples were collected on 23 October
2018 (autumn, C), 19 January 2019 (winter, D), 5 April 2019 (spring, A), and 22 July 2019 (summer, B).
Three quadrats of 20 m × 20 m were selected in the C. yuhsienensis plantation. Five trees were
chosen according to an “S” type route in the center of each quadrat. The rhizosphere soil samples
of C. yuhsienensis were collected, as described by Reference [34] after shoveling the roots from
four ordinations approximately 0.5 m away from the trunk. The corresponding non-rhizosphere
soil samples at 0–20 cm depth were collected as a control approximately 1 m away from the
trunk. The rhizosphere and non-rhizosphere soils in each quadrate were each well blended as a
single sample. The soil samples were then transported back to the laboratory on dry ice. After removing
debris and roots, the soil samples were well mixed, ground, and sieved (
Microorganisms 2020, 8, 1385                                                                      4 of 19

2.4.2. Illumina Novaseq6000 Sequencing
     Amplicons were extracted from 2% agarose gels and purified using the AxyPrep DNA Gel Extraction
Kit (Axygen Biosciences, Union City, CA, USA.) according to the manufacturer’s instructions and
quantified using an ABI StepOnePlus Real-Time PCR System (Life Technologies, Foster City, CA, USA).
Purified amplicons were pooled in equimolar ratios and paired-end sequenced (PE250) on an Illumina
platform according to the standard protocols. The raw reads were deposited into the NCBI Sequence
Read Archive (SRA) database (BioProject: PRJNA646017).

2.4.3. Statistical and Bioinformatics Analysis
     Raw reads were further filtered using FASTP according to the rule: Remove reads containing more
than 10% unknown nucleotides (N) and reads with less than 50% of bases with quality (Q-value)>20 [45].
Paired-end clean reads were merged as raw tags using FLASH (version 1.2.11) with a minimum
overlap of 10 bp and mismatch error rates of 2% [46]. The effective tags were clustered into operational
taxonomic units (OTUs) of ≥ 97% similarity using the UPARSE (version 9.2.64) pipeline [47]. The tag
sequence with the highest abundance was selected as a representative sequence within each cluster.
     A Venn analysis was used to identify unique and common OTUs among the different groups,
was performed using the R “VennDiagram” package (version 1.6.16) [48]. The OTU rarefaction
curves and rank abundance curves were plotted using the R “ggplot2” package (version 2.2.1) [49].
Alpha diversities of bacteria and fungi (Sobs, Shannon, and Chao 1 index) were calculated in
QIIME (version 1.9.1) [50]. The abundance statistics of each taxonomy were visualized using Krona
(version 2.6) [51]. Principal co-ordinates analysis (PCoA) and permutational multivariate analysis
of variance (MANOVA) (Permanova) based on unweighted unifrac distance were used to evaluate
the influence of plant root and seasonal dynamics on bacterial and fungal community structures.
A least discriminant analysis (LDA) effect size (LEfSe) taxonomic cladogram was used to identify
bacterial biomarkers (LDA > 3.5) and fungal biomarkers (LDA > 3.5) in the different treatment
using LEfSe software [52]. Indicator analysis was used to determine the significantly different
species (biomarkers) between rhizosphere and non-rhizosphere soil during the entire year using the R
“labdsv” package (version 2.0-1) [53]. The Kyoto Encyclopedia of Genes and Genomes (KEGG) pathway
analysis of the OTUs was inferred using Tax4Fun (version 1.0) [54]. The functional group (Guild) of
the fungi (relative abundance greater than 0.01% in the rhizosphere) was inferred using FUNGuild
(version 1.0) [55]. The bacterial function differences between the rhizosphere and non-rhizosphere
samples were calculated by Welch’s t-test, and the fungal function differences between the rhizosphere
and non-rhizosphere were calculated using the Wilcoxon rank test in the R “vegan” package
(version 2.5.3) [56].
     One-way analysis of variance (ANOVA) was used to determine the significant differences among
different treatments during the whole year. Nonparametric tests with a significance level of 0.05 were
used to compare the means of bacterial and fungal alpha diversities in different treatments and seasons.
Variance partitioning analysis, generated in the R “vegan” package (version 2.5.3) [56], was used
to evaluate the contribution of environmental factors to microbial community structure. Pearson’s
correlation coefficients between environmental factors and microbial species and alpha diversities
were calculated by Omicshare tools, a free online platform for data analysis [57].

3. Results

3.1. Soil Microbial Community Structure

3.1.1. Quality Control Report of the High-Throughput Sequencing
     The tags and OTUs of the bacteria and fungi are presented in Table S2 and Table S3. In order
to ensure the reproducibility and validity of the microbial data, the data extraction flat and dilution
cures were processed before analysis [58]. According to Figure S2, the dilution cure of the Sobs index
Microorganisms 2020, 8, 1385 5 of 19
indicated that there would be more bacteria and fungi if sequencing were continued, but the plateau
of the dilution cure of Shannon’s index was reached early, showing that the number of reads was
sufficient for this research.
Microorganisms 2020, 8, x FOR PEER REVIEW 5 of 21
3.1.2. Microbial
dilutionComposition
cure of Shannon’s index was reached early, showing that the number of reads was sufficient
for this research.
According to Figure 1, the dominant bacteria were Chloroflexi, Proteobacteria, Acidobacteria,
Actinobacteria, Planctomycetes,
3.1.2. Microbial Composition Firmicutes, and Bacteroidetes at the phylum level. The dominant
fungi were Ascomycota, Basidiomycota,
According to Figure 1, the dominant and Mucoromycota
bacteria were Chloroflexi,at the phylum level.
Proteobacteria, Venn diagrams
Acidobacteria,
(Figure 2)Actinobacteria,
indicated that, with the exception
Planctomycetes, of summer,
Firmicutes, and Bacteroidetestheatnumber
the phylum of level.
specific
The bacterial
dominant OTUs in
fungi were
the rhizosphere wasAscomycota,
higher than Basidiomycota, and Mucoromycota
in the non-rhizosphere. Inatwinter,
the phylum level. Venn
the number ofdiagrams
specific bacterial
(Figure 2) indicated that, with the exception of summer, the number of specific bacterial OTUs in the
OTUs in the non-rhizosphere and the number of common bacterial OTUs between the rhizosphere and
rhizosphere was higher than in the non-rhizosphere. In winter, the number of specific bacterial OTUs
non-rhizosphere were muchand
in the non-rhizosphere lower than in
the number the other
of common seasons,
bacterial OTUswhile
betweenthethenumber of and
rhizosphere specific
non- bacterial
OTUs in the rhizosphere
rhizosphere was lower
were much muchthanhigher
in the than in the other
other seasons, seasons.
while the number In the rhizosphere,
of specific the number
bacterial OTUs
of specificinbacterial
the rhizosphere
OTUswas much higher
in spring andthan in the
winter other
was seasons.
higher In the
than in rhizosphere,
summer and the autumn,
number of while the
specific bacterial OTUs in spring and winter was higher than in summer and autumn, while the
opposite was observed in the non-rhizosphere. The number of common bacterial OTUs among each
opposite was observed in the non-rhizosphere. The number of common bacterial OTUs among each
season in the rhizosphere was 934,
season in the rhizosphere which
was 934, which was
washigher thanthethe
higher than value
value ofin456
of 456 the in the non-rhizosphere.
non-rhizosphere.
Figure 1. Figure 1. Relative
Relative abundance
abundance of bacteria
of bacteria (A)and
(A) and fungi
fungi (B)
(B)at at
thethe
phylum level. level.
phylum AR, BR,AR,
CR, and
BR,DR
CR, and DR
indicates rhizosphere soil sample in spring, summer, autumn, and winter, respectively. AN, BN, CN,
indicates rhizosphere soil sample in spring, summer, autumn, and winter, respectively. AN, BN, CN, and DN
and DN indicates non-rhizosphere soil sample in spring, summer, autumn, and winter, respectively.
indicates non-rhizosphere
n = 3.
soil sample in spring, summer, autumn, and winter, respectively. n = 3.
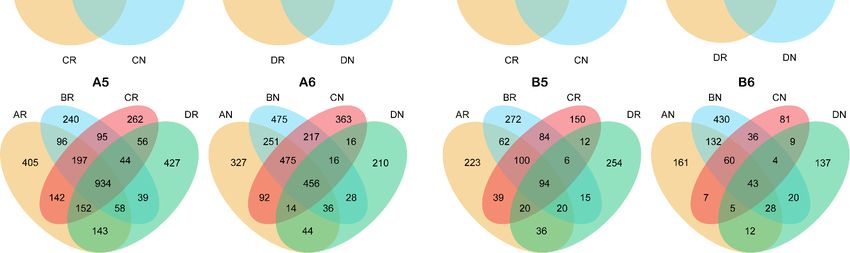
As observed with the bacterial OTUs, the number of specific fungal OTUs in the rhizosphere
was higher than in the non-rhizosphere, except for in summer. The highest number of common fungal
OTUs between the rhizosphere and non-rhizosphere was in summer. In both the rhizosphere and
non-rhizosphere, the highest number of specific fungal OTUs was detected in summer, while theMicroorganisms 2020, 8, 1385 6 of 19
Figure 2. Venn diagram of bacterial (A1–A6) and fungal (B1–B6) Operational taxonomic units (OTUs). AR, BR, CR, and DR indicates rhizosphere soil sample in
Figure 2. Venn diagram of bacterial (A1−A6) and fungal (B1−B6) Operational taxonomic units (OTUs). AR, BR, CR, and DR indicates rhizosphere soil sample in spring, summer,
spring, summer, autumn, and winter, respectively. AN, BN, CN, and DN indicates non-rhizosphere soil sample in spring, summer, autumn, and winter, respectively.
autumn, and winter, respectively. AN, BN, CN, and DN indicates non-rhizosphere soil sample in spring, summer, autumn, and winter, respectively. Overlaps and non-overlaps
Overlaps and non-overlaps indicate shared and exclusive OTUs under different samples, respectively. n = 3.
indicate shared and exclusive OTUs under different samples, respectively. n = 3.
Microorganisms 2020, 8, x; doi: FOR PEER REVIEW www.mdpi.com/journal/microorganismsMicroorganisms 2020, 8, 1385 7 of 19
As observed with the bacterial OTUs, the number of specific fungal OTUs in the rhizosphere was
higher than in the non-rhizosphere, except for in summer. The highest number of common fungal
OTUs between the rhizosphere and non-rhizosphere was in summer. In both the rhizosphere and
non-rhizosphere, the highest number of specific fungal OTUs was detected in summer, while the lowest
was found in autumn. The number of common fungal OTUs among each season in the rhizosphere
was 94, which was higher than the value of 43 in the non-rhizosphere.
3.1.3. Microbial Diversity
According to Table 1, there were no significant differences in bacterial Sobs and Shannon indexes
among different seasons in the rhizosphere. The bacterial Sobs, Chao 1, and Shannon indexes in
winter were much lower than in the other seasons in the non-rhizosphere. The highest fungal Sobs,
Chao 1, and Shannon indexes were detected in summer in both the rhizosphere and non-rhizosphere.
There was no significant difference in fungal Sobs and Shannon index between the rhizosphere and
non-rhizosphere during the entire year. In autumn, the fungal Chao 1 index in the rhizosphere was
remarkably higher than in the non-rhizosphere.
Table 1. Alpha diversity (Sobs, Shannon, and Chao 1 index) of bacteria and fungi.
Kingdom Sample Sobs Chao 1 Shannon
AR 1780 ± 390 a 2218.8 ± 434.27 a 8.12 ± 0.1 a
BR 1392 ± 395 a 1757.83 ± 330.26 abc 7.31 ± 0.74 ab
CR 1727 ± 116 a 2165.43 ± 222.65 ab 7.72 ± 0.44 ab
DR 1271 ± 398 a 1540.55 ± 410.06 c 7.97 ± 0.24 a
Bacteria
AN 1422 ± 159 a 1857.35 ± 83.64 abc 7.69 ± 0.42 ab
BN 1641 ± 314 a 1973.68 ± 340.82 abc 7.62 ± 0.82 ab
CN 1265 ± 324 a 1672.15 ± 199.73 bc 7.6 ± 1.05 ab
DN 609 ± 99 b 882.488 ± 105.93 d 6.64 ± 0.74 b
AR 497 ± 113 ab 683.65 ± 67.99 ab 4.34 ± 1.41 bc
BR 609 ± 109 a 803.52 ± 94.73 a 5.81 ± 0.45 ab
CR 423 ± 84 abc 597.05 ± 54.6 abc 3.24 ± 2.31 c
Fungus DR 417 ± 25 abc 584.27 ± 22.39 abcd 5.29 ± 0.17 abc
AN 389 ± 80 abc 538.32 ± 114.33 bcd 5.08 ± 0.1 bc
BN 620 ± 133 a 759.81 ± 154.94 ab 6.36 ± 0.05 a
CN 213 ± 32 c 315.57 ± 26.62 d 3.85 ± 1.56 bc
DN 299 ± 21 bc 451.79 ± 6.08 cd 3.16 ± 0.27 c
AR, BR, CR, and DR indicates rhizosphere soil sample in spring, summer, autumn, and winter, respectively. AN,
BN, CN, and DN indicates non-rhizosphere soil sample in spring, summer, autumn, and winter, respectively.
Numbers before and behind “±” are mean value (n = 3) and SE, respectively. Lowercases behind numbers indicate a
significant difference.
PCoA and Permanova (Figure 3) indicated that seasonality had a great influence on the soil
bacterial communities in the non-rhizosphere (p < 0.001), fungal communities in the rhizosphere
(p < 0.001), and fungal communities in the non-rhizosphere (p < 0.001). Across the whole year, the bacterial
communities in the rhizosphere differed significantly (p = 0.048) from those in the non-rhizosphere
(Figure 3A). However, there was no significant difference (p = 0.073) between fungal communities in the
rhizosphere and non-rhizosphere (Figure 3B).Microorganisms 2020, 8, 1385 8 of 19
Figure 3. Principal
Figure 3. Principal Co-ordinary Analysis (PCoA)
Co-ordinary Analysis (PCoA) of
of bacterial
bacterial (A)
(A) and
and fungal
fungal (B)
(B) community based on
community based on unweighted
unweighted unifrac
unifracdistance.
distance.AR,
AR,BR,
BR,CR,
CR,and
andDR
DR indicates
indicates
rhizosphere soil sample in spring, summer, autumn, and winter, respectively. AN, BN, CN, and DN indicates non-rhizosphere soil sample in spring, summer,
rhizosphere soil sample in spring, summer, autumn, and winter, respectively. AN, BN, CN, and DN indicates non-rhizosphere soil sample in spring, summer, autumn,
autumn, and winter, respectively. Values of R2 and P were calculated using Permutational MANOVA (Permanova).
and winter, respectively. Values of R2 and P were calculated using Permutational MANOVA (Permanova). n = 3. n = 3.
Microorganisms 2020, 8, x; doi: FOR PEER REVIEW www.mdpi.com/journal/microorganismsMicroorganisms 2020, 8, 1385 9 of 19
3.1.4.
3.1.4. Microbial
Microbial Biomarkers
Biomarkers in
in the
the Rhizosphere
Rhizosphere
In
In order
order to to identify
identify biomarkers
biomarkers in in the
the rhizosphere,
rhizosphere, LEfSe
LEfSe and
and indicator
indicator analysis
analysis were
were applied.
applied.
As
As observed
observed with
with microbial
microbial diversity
diversity and
and composition,
composition, thethe biomarkers
biomarkers in in the
the rhizosphere
rhizosphere were
were also
also
significantly affected by seasonal variation. According to Figure S3, the most bacterial
significantly affected by seasonal variation. According to Figure S3, the most bacterial biomarkers biomarkers
were
were detected
detected in in winter, while there
winter, while there were
were no
no biomarkers
biomarkers in in summer
summer in in the
the rhizosphere.
rhizosphere. As
As observed
observed
with the bacterial
with the bacterialbiomarkers,
biomarkers,the themost
mostfungal
fungal biomarkers
biomarkers were
were detected
detected in winter,
in winter, while
while the least
the least was
was detected in summer (Figure
detected in summer (Figure S4). S4).
Across
Across thetheentire
entireyear,
year,the bacterial
the bacterialandand
fungal biomarkers
fungal in the
biomarkers inrhizosphere were both
the rhizosphere weremuch
both
higher than in
much higher thanthe non-rhizosphere.
in the non-rhizosphere. In the rhizosphere,
In the rhizosphere, thethebacterial
bacterial biomarkers
biomarkers included
included
Chthoniobacter, Rhodanobacter,Reyranella,
Chthoniobacter, Rhodanobacter, Reyranella, Aquicella,
Aquicella, Subgroup_10,
Subgroup_10, Granulicella,
Granulicella, Labrys, Labrys,
Gemmata,Gemmata,
GAS113,
GAS113, Sphingomonas,
Sphingomonas, and Pajaroellobacter
and Pajaroellobacter at the genusat the
levelgenus level
(Figure 4A),(Figure
while 4A), while biomarkers
the fungal the fungal
biomarkers were Staphylotrichum,
were Trechispora, Trechispora, Staphylotrichum,
Chaetosphaeria,Chaetosphaeria,
Trichoderma, Trichoderma, Mortierella, Trichoglossum,
Mortierella, Trichoglossum, Lecanicillium,
Lecanicillium, Sarcodon, and Leptodontidium at the genus
Sarcodon, and Leptodontidium at the genus level (Figure 4B). level (Figure 4B).
Figure 4.
Figure Bacterial (A)
4. Bacterial (A) and
and fungal
fungal (B)
(B) biomarkers
biomarkers of
of the
the rhizosphere
rhizosphere (R)
(R) and
and non-rhizosphere
non-rhizosphere (N)
(N)
samples at the genus level based on indicator analysis. The size of the cycle indicates the indicator
samples at the genus level based on indicator analysis. The size of the cycle indicates the indicator
value of
value of each genus. nn ==3.3.
each genus.
3.2. Functional Analysis of Microorganisms
3.2. Functional Analysis of Microorganisms
The abundances of nitrogen metabolism, oxidative phosphorylation, glycine, serine and threonine
The abundances of nitrogen metabolism, oxidative phosphorylation, glycine, serine and
metabolism, glutathione metabolism, and sulfur metabolism in the rhizosphere were significantly
threonine metabolism, glutathione metabolism, and sulfur metabolism in the rhizosphere were
higher than in the non-rhizosphere (Figure 5). According to the FUNGuild analysis, endophytes and
significantly higher than in the non-rhizosphere (Figure 5). According to the FUNGuild analysis,
ectomycorrhizal fungi in the rhizosphere were significantly higher than in the non-rhizosphere
endophytes and ectomycorrhizal fungi in the rhizosphere were significantly higher than in the non-
(Figure 6B). Trophic analysis indicated that symbiotrophs were more abundant in the rhizosphere,
rhizosphere (Figure 6B). Trophic analysis indicated that symbiotrophs were more abundant in the
while pathotrophs were more abundant in the non-rhizosphere (Figure 6B).
rhizosphere, while pathotrophs were more abundant in the non-rhizosphere (Figure 6B).
Microorganisms 2020, 8, x; doi: FOR PEER REVIEW www.mdpi.com/journal/microorganismsMicroorganisms 2020, 8, x FOR PEER REVIEW 2 of 21
Microorganisms 2020, 8, 1385 10 of 19
Microorganisms 2020, 8, x FOR PEER REVIEW 2 of 21
Figure 5. The difference Kyoto Encyclopedia of Genes and Genomes (KEGG) map of bacteria between
Figure 5. The difference
Figure Kyotonon-rhizosphere
5. The difference
rhizosphere
Encyclopedia
(R) and Kyoto EncyclopediaofofGenes
Genes
(NR) based
and
and Genomes
Genomes
on Welch’s t-test. n = (KEGG)
3.
(KEGG)
map ofmap of between
bacteria bacteria between
rhizosphere
rhizosphere (R) and (R) and non-rhizosphere
non-rhizosphere (NR)
(NR) basedon
based on Welch’s
Welch’st-test. n = 3.
n = 3.
t-test.
Figure 6. Distributed stack diagram (A) of fungal functional group (Guild), box figure of different
fungal functional group (Guild) based on Wilcoxon rank-sum test (B), and the heatmap of fungal
functional trophic mode (C). R and NR indicated the rhizosphere and non-rhizosphere, respectively.
F1, F2, F3, F4, and F5 indicated Fungal Parasite-Undefined Saprotroph, Ectomycorrhizal-Undefined
Saprotroph, Endophyte-Litter Saprotroph-Soil Saprotroph-Undefined Saprotroph, Endophyte-Litter
Saprotroph-Wood Saprotroph, and Ectomycorrhizal-Fungal Parasite-Soil Saprotroph-Undefined
Saprotroph. * and ** over the box indicated a significant difference at 0.05 and 0.01 level,
respectively. The black line and hollow cycle in the box indicated the median and mean (n = 3)
abundance of Guild, respectively. The solid rhombus beyond the box indicated the discrete data. The top
and down line of box indicated 25% and 75% of Guild. The top and down line beyond the box indicated
10% and 90% of Guild.Microorganisms 2020, 8, 1385 11 of 19
3.3. Interactions Between Environmental Factors and Microbial Communities
According to Table S1, seasonality and rhizosphere had a remarkable influence on soil
physiochemical properties. Different soil physiochemical properties had different responses to
seasonal variation. Available nutrients, such as AP, AK, AMN, NN, and AHN, varied more frequently
than TP, TN, and TOC along with seasonal dynamics. AP was higher in spring and summer than in
winter and autumn, while TK, AMN, NN, and SWC were higher in autumn and winter than in spring
and summer. There was no significant difference in most soil physiochemical properties between
the rhizosphere and non-rhizosphere, except for AMN, AHN, TOC, and N/P. AMN was significantly
higher in the non-rhizosphere than in the rhizosphere in summer. AHN was significantly lower in the
rhizosphere than in the non-rhizosphere in spring, while the result was reversed in winter. TOC and
N/P were both significantly higher in the rhizosphere than in the non-rhizosphere in winter.
Figure S5 indicates the environmental factors with significant contributions to the microbial
communities in the rhizosphere and non-rhizosphere soil at the genus level. According to Table 2,
there were no significant correlations between environmental factors and bacterial diversity in the
rhizosphere. According to Table 3, in the rhizosphere, fungal abundance was positively correlated
with TP and Tem, but negatively correlated with TK, NN, and N/P.
Table 2. Correlations between bacterial alpha-diversity and environmental factors based on Pearson
correlation coefficients with the two-tail test.
Rhizosphere Non-Rhizosphere
Environmental Factors
Sobs Chao 1 Shannon Sobs Chao 1 Shannon
AP 0.068 0.098 −0.150 0.388 0.452 0.260
TP −0.130 −0.197 0.119 0.437 0.351 0.211
AK 0.069 0.105 0.512 0.532 0.521 0.281
TK 0.252 0.140 0.303 −0.198 −0.187 0.017
AMN 0.273 0.252 0.276 −0.436 −0.492 −0.180
NN −0.161 −0.159 −0.099 −0.788 ** −0.822 ** −0.379
AHN −0.471 −0.485 −0.296 −0.229 −0.169 −0.258
TN −0.117 −0.018 −0.171 0.540 0.617 * 0.357
TOC −0.097 −0.041 0.220 0.163 0.168 −0.054
pH 0.267 0.315 0.118 0.270 0.282 0.471
SWC 0.360 0.457 0.356 −0.556 −0.491 −0.358
Tem −0.121 −0.166 0.137 0.849 ** 0.866 ** 0.491
C/N −0.110 −0.126 0.272 −0.336 −0.402 −0.372
C/P −0.096 0.017 −0.015 −0.148 −0.073 −0.237
N/P −0.089 −0.013 −0.230 0.347 0.454 0.282
“*” and “**” indicate the significant correlations at 0.05 and 0.01 level, respectively. AP, available phosphorous;
TP, total phosphorous; AK, available potassium; TK, total potassium; AMN, ammonium nitrogen; NN,
nitrate nitrogen; AHN, alkaline hydrolyzable nitrogen; TN, total nitrogen; TOC, total organic carbon; SWC,
soil water content; Tem, soil monthly mean temperature; C/N, ratio of total carbon to total nitrogen; C/P, ratio of
total carbon to total phosphorous; N/P, ration of total nitrogen to total phosphorous. n = 12.
In order to elucidate the interactions between environmental factors and microbial species, the biomarkers
and the top 10 abundant species at the genus level were selected to conduct correlation analysis with
environmental factors (Figures S6 and S7). In both bacteria and fungi, the interactions between microorganisms
and environmental factors were strikingly different between the rhizosphere and non-rhizosphere. pH was
significantly correlated with most bacteria in the rhizosphere (Figure S6). Acidothermus, the most abundant
bacteria in the rhizosphere, was significantly positively related to Tem both in the rhizosphere and
non-rhizosphere. Compared with bacteria, there were more significant correlations between environmental
factors and fungi at the genus level (Figure S7). Most fungi were negatively correlated with Tem, but positively
correlated with NN and AHN in the rhizosphere.Microorganisms 2020, 8, 1385 12 of 19
Table 3. Correlations between environmental factors and fungal alpha-diversity based on Pearson
correlation coefficients with the two-tail test at 0.05 (*) and 0.01 (**) level.
Rhizosphere Not-Rhizosphere
Environmental Factors
Sobs Chao 1 Shannon Sobs Chao 1 Shannon
AP 0.210 0.273 −0.006 0.255 0.277 0.414
TP 0.760 ** 0.758 ** 0.145 0.660 * 0.586 * 0.582 *
AK 0.183 0.239 0.057 0.475 0.471 0.464
TK −0.551 −0.703 * −0.181 −0.514 −0.563 −0.510
AMN −0.432 −0.555 −0.391 −0.507 −0.561 −0.543
NN −0.521 −0.620 * 0.099 −0.479 −0.387 −0.696 *
AHN −0.411 −0.440 0.219 −0.411 −0.412 −0.259
TN −0.229 −0.122 −0.041 0.197 0.266 0.289
TOC −0.339 −0.253 0.163 0.389 0.434 0.226
pH 0.311 0.348 0.000 −0.071 −0.091 0.003
SWC −0.419 −0.432 −0.242 −0.683 * −0.603 * −0.776 **
Tem 0.550 0.654 * −0.012 0.541 0.448 0.738 **
C/N −0.296 −0.234 0.187 0.205 0.200 −0.056
C/P −0.550 −0.492 0.010 −0.025 0.099 −0.198
N/P −0.637 * −0.601 * −0.123 −0.108 −0.027 0.023
“*” and “**” indicate the significant correlations at 0.05 and 0.01 level, respectively. AP, available phosphorous;
TP, total phosphorous; AK, available potassium; TK, total potassium; AMN, ammonium nitrogen; NN,
nitrate nitrogen; AHN, alkaline hydrolyzable nitrogen; TN, total nitrogen; TOC, total organic carbon; SWC,
soil water content; Tem, soil monthly mean temperature; C/N, ratio of total carbon to total nitrogen; C/P, ratio of
total carbon to total phosphorous; N/P, ration of total nitrogen to total phosphorous. n = 12.
4. Discussion
Numerous studies have shown that seasonal variation strongly regulates soil physiochemical
properties and microorganisms [10,59–62]. However, no studies have assessed the seasonal variation
in soil properties and microbial communities in the rhizosphere of C. yuhsienensis. In this study,
seasonal variation was the predominant influencing factor on soil physiochemical properties. The soil
properties among seasons in this study differed greatly from those of Zhang, Cui, Guo, and Xi [30]
in C. oleifera forests. This might be because the climate and soil types are markedly different.
Many studies have reported that the soil properties in the rhizosphere differ greatly from those
in the non-rhizosphere [30,63]. Our result showed that AHN, TOC, and N/P were both significantly
higher in the rhizosphere than in the non-rhizosphere in winter. This indicates that the C. yuhsienensis
roots maintained higher activity in winter. No significant differences were found in soil pH between
rhizosphere and non-rhizosphere—which is not consistent with Zhang et al. [30], who found that the
rhizosphere pH of C. oleifera was significantly lower than non-rhizosphere. A previous study showed
that in order to acquire more phosphorous, C. oleifera exuded various organic acid, which led to the
decline of pH [64]. These results suggested that C. yuhsienensis roots might not be as active as C. oleifera
and had a weaker influence on soil physiochemical properties.
Compared with bacteria, fungi were more sensitive to soil physicochemical properties in this
study (Tables 2 and 3). The positive correlations between TP and fungal richness (Table 3) in this
study are contrary to those studies which showed that phosphorous is the key limiting factor on the
establishment of symbioses between plant and mycorrhizal fungi [65,66]. Previous studies about the
negative influences of phosphorous on mycorrhizal fungi were under the high content of phosphorous.
However, the contents of the AP and TP were low in this study (Table S1), which is not enough to
inhibit mycorrhizal fungi. AP was widely considered to be a limiting factor of yield for oil tea in
China [67,68]. Otherwise, mycorrhizal fungi were not dominant in the fungal community in this study,
which also explained why phosphorous contents were positively correlated with fungal richness.
The dominant bacteria, Chloroflexi, Proteobacteria, Acidobacteria, Actinobacteria, and Planctomycetes,
and fungi, Ascomycota and Basidiomycota, in the rhizosphere of C. yuhsienensis were similar to previous
studies in C. oleifera rhizosphere or bulk soil [10,30], but a little different from the rhizosphere soil ofMicroorganisms 2020, 8, 1385 13 of 19
Camellia sinensis [69]. These results indicated that nutrient utilization patterns of the plant might
significantly alter microbial communities. There were significantly different responses between
the rhizosphere and non-rhizosphere microbial communities to seasonal variation. During the
entire year, the shared OTUs of the four seasons in the rhizosphere were higher than those in the
non-rhizosphere for both bacteria and fungi (Figure 2). The PCoA also indicated that the effect of
seasonal variation on bacterial community structure was smaller in the rhizosphere (R2 = 0.328,
p = 0.107) than in the non-rhizosphere (R2 = 0.398, p < 0.001) (Figure 3A). On account of the root activity
of C. yuhsienensis, the bacterial community structure in the rhizosphere differed significantly from
that in the non-rhizosphere (R2 = 0.064, p = 0.048). Particularly in winter, the bacterial OTUs in the
rhizosphere did not decrease due to the low temperature, as observed in the non-rhizosphere, but rather
the number of exclusive OTUs increased (Figure 2A). The bacterial Sobs, Chao 1, and Shannon indexes
were significantly higher in the rhizosphere than in the non-rhizosphere in winter. These results
indicated that the roots of C. yuhsienensis might have higher excretions in winter, thus remarkably
increasing the activity of bacteria in winter. This result is consistent with past studies that indicated
that the roots of C. yuhsienensis are also active in winter [70,71]. The fungal community structures also
varied greatly with seasonal variation (Figure 3B). Across the entire year, fungi in the non-rhizosphere
were more sensitive to seasonal variation than those in the rhizosphere (Table 1 and Figure 2B). Notably,
there were slight differences between the rhizosphere and non-rhizosphere microbial communities,
regardless of microbial community structure, microbial diversity, or microbial OTUs (Figures 1 and 2
and Table 1), and the number of fungal and bacterial biomarkers was lowest in summer in both the
rhizosphere and non-rhizosphere (Figure S3 and Figure S4). In summary, seasonal variation was
the predominant effective factor influencing microbial diversity and structure, and the activity of
C. yuhsienensis roots could provide a more stable environment for microorganisms, especially for
bacteria in winter.
Exploring the rhizosphere microbial function is a great way to understand the interactions between
plants and microorganisms. Although there are already some researchers focusing on microbial
communities associated with oil tea [10,30], the microbial functions in the oil tea rhizosphere have
never been noticed. Indicator analysis showed that the number of biomarkers in the rhizosphere was
much higher than in the non-rhizosphere (Figure 4). All of the bacterial biomarkers in the rhizosphere in
this study were chemoorganotrophic Gram-negative bacteria that grow under aerobic conditions [72–78].
Some species of Rhodanobacter can degrade γ-hexachlorocyclohexane (lindane; γ-HCH) under aerobic
conditions, and some species have the ability to antagonize root rot fungi [79] or to denitrify nitrate [80,81].
Most Labrys species have been reported as biodegraders of some harmful organic matter for animals,
such as Labrys portucalensis [82,83]. Sphingomonas, a Gram-negative bacteria that was a biomarker in the
rhizosphere, grows under aerobic conditions. Sphingomonas species are widely distributed throughout
the soil and water and are associated with plant roots [84]. Sphingomonas species are multifunctional.
Some exhibit antagonism against the phytopathogenic fungus Verticillium dahliae [85], while some
are the pathogenic bacteria causing plant root disease [86], and some are able to degrade refractory
pollutants [87]. The biomarkers reflect that the rhizosphere environment of C. yuhsienensis had high air
permeability and abundant organic nutrients for these bacteria.
Most fungal biomarkers in the rhizosphere of C. yuhsienensis are beneficial fungi for plants.
Trichoderma has been reported several times to protect plants and contain pathogen populations [88,89]. This is
the first study to report Trichoderma in the rhizosphere of C. yuhsienensis. Mortierella is a large and diverse
genus, and most species of Mortierella are saprobic and abundant in the soil and plant debris [90].
Arachidonic acid (ARA), produced by most Mortierella species, is an important constituent of biological
cells [91]. ARA is not only beneficial for animals [92], but can also antagonize plant disease [93].
Lecanicillium species have great potential as biocontrol agents [94]. Most Lecanicillium species are able
to parasitize many insects, such as Lecanicillium longisporum against aphids, Lecanicillium muscarium
against whiteflies and thrips [95], and Lecanicillium psalliotae against the root-knot nematode
Meloidogyne incognita [96]. Meloidogyne incognita is one of the major nematodes of oil tea roots [97].Microorganisms 2020, 8, 1385 14 of 19
In general, most biomarkers in the rhizosphere of C. yuhsienensis are beneficial for plants, and thus,
we may speculate that the root activity of C. yuhsienensis markedly improved the rhizosphere conditions
and increased the beneficial microorganisms. Functional analysis also verified this (Figures 5 and 6).
5. Conclusions
The dominant bacteria in the rhizosphere of C. yuhsienensis were Chloroflexi, Proteobacteria,
Acidobacteria, Actinobacteria, and Planctomycetes, and the dominant fungi were Ascomycota,
Basidiomycota, and Mucoromycota. Seasonal variation was the predominant factor influencing
soil microbial abundance, diversity, and structure and the soil physiochemical properties in the
rhizosphere of C. yuhsienensis. There were weak correlations between microorganisms and soil
physiochemical properties in the rhizosphere. Seasonal variation had significant effects on bacterial
abundance, but not on diversity and structure, and had significant effects on fungal abundance and
structure, but not on diversity in the rhizosphere. Significantly higher bacterial abundance and
diversity were observed in the rhizosphere than in the non-rhizosphere, which reflected the high
activity of the C. yuhsienensis roots in winter. All of the bacterial biomarkers in the rhizosphere were
chemoorganotrophic Gram-negative bacteria that grow under aerobic conditions, and the fungal
biomarkers, including Trichoderma, Mortierella, and Lecanicillium, have a great ability to protect against
pathogens in the rhizosphere. In the rhizosphere of C. yuhsienensis, the dominant functions of the
bacteria were oxidative phosphorylation and metabolism of nitrogen, glycine, serine, threonine,
glutathione, and sulfur in the rhizosphere, while the dominant fungal functional groups were
endophytes and ectomycorrhizal fungi of the symbiotroph trophic type. The activity of C. yuhsienensis
created better conditions with good air permeability and formed a microbial community dominated by
beneficial bacteria and fungi. We strongly suggest that future research should pay greater attention
to the root vitality and exudation of C. yuhsienensis in different seasons, which might be the key to a
better understanding of the relationships between roots and microbial community. This is the first time
to study C. yuhsienensis rhizosphere microbial communities during seasonal variations, and the first
time to study Camellia species rhizosphere microbial function. Therefore, we strongly suggest that
researchers pay more attention to the rhizosphere microorganisms and provide more scientific data to
better study and manage Camellia plantations.
Supplementary Materials: The following are available online at http://www.mdpi.com/2076-2607/8/9/1385/s1,
Figure S1: Annual variation of soil temperature in Camellia yuhsienensis Hu. forest. Figure S2: Dilution curves of Sobs
index of bacteria (A) and fungus (C) and Shannon index of bacteria (B) and fungus (D). AR, BR, CR and DR indicates
rhizosphere soil sample in spring, summer, autumn, and winter, respectively. AN, BN, CN and DN indicates
non-rhizosphere soil sample in spring, summer, autumn, and winter, respectively. Figure S3: Least discriminant
analysis effect size (LEfSe) analysis of bacterial community in spring (A), summer (B), autumn (C) and winter (D).
Red parts of circle in each cladogram indicate the biomarkers in rhizosphere soil samples. Green parts of circle
in each cladogram indicate the biomarkers in non-rhizosphere soil samples. Yellow solid circles indicate that
the abundance of species have no significant difference in rhizosphere and non-rhizosphere. n = 3. Figure S4:
LEfSe analysis of fungal community in spring (A), summer (B), autumn (C) and winter (D). Red parts of circle
in each cladogram indicate the biomarkers in rhizosphere soil samples. Green parts of circle in each cladogram
indicate the biomarkers in non-rhizosphere soil samples. Yellow solid circles indicate that the abundance of species
have no significant difference in rhizosphere and non-rhizosphere. n = 3. Figure S5: Contribution of environmental
factors on bacterial community at genus level in rhizosphere (A) and non-rhizosphere (B) and fungal community in
rhizosphere (C) and non-rhizosphere (D) using Variance Partitioning Analysis (VPA). AP, available phosphorous; TP,
total phosphorous; AK, available potassium; TK, total potassium; AMN, ammonium nitrogen; NN, nitrate nitrogen;
AHN, alkaline hydrolyzable nitrogen; TN, total nitrogen; TOC, total organic carbon; SWC, soil water content;
Tem, soil monthly mean temperature; C/N, ratio of total carbon to total nitrogen; C/P, ratio of total carbon
to total phosphorous; N/P, ration of total nitrogen to total phosphorous. n=3. Figure S6: Heatmap of
correlations between environmental factors and bacteria at genus level in rhizosphere (A) and non-rhizosphere
(B) based on Pearson correlation coefficients with the two-tail test. Red squares indicate positive correlations.
Blue squares indicate negative correlations. “*” and “**” indicate the significant correlations at 0.05 and 0.01 level,
respectively. AP, available phosphorous; TP, total phosphorous; AK, available potassium; TK, total potassium;
AMN, ammonium nitrogen; NN, nitrate nitrogen; AHN, alkaline hydrolyzable nitrogen; TN, total nitrogen;
TOC, total organic carbon; SWC, soil water content; Tem, soil monthly mean temperature; C/N, ratio of total carbon
to total nitrogen; C/P, ratio of total carbon to total phosphorous; N/P, ration of total nitrogen to total phosphorous.
n = 3. Figure S7: Heatmap of correlations between environmental factors and fungus at genus level in rhizosphereMicroorganisms 2020, 8, 1385 15 of 19
(A) and non-rhizosphere (B) based on Pearson correlation coefficients with the two-tail test. Red squares indicate
positive correlations. Blue squares indicate negative correlations. “*” and “**” indicate the significant correlations
at 0.05 and 0.01 level, respectively. AP, available phosphorous; TP, total phosphorous; AK, available potassium;
TK, total potassium; AMN, ammonium nitrogen; NN, nitrate nitrogen; AHN, alkaline hydrolyzable nitrogen;
TN, total nitrogen; TOC, total organic carbon; SWC, soil water content; Tem, soil monthly mean temperature;
C/N, ratio of total carbon to total nitrogen; C/P, ratio of total carbon to total phosphorous; N/P, ration of total
nitrogen to total phosphorous. n = 3. Table S1: Soil physicochemical property of each sample. Table S2:
Quantitative statistics of bacterial OTUs and Tags of each sample. Table S3: Quantitative statistics of fungal OTUs
and Tags of each sample.
Author Contributions: Conceptualization, J.Y. and J.L.; methodology, J.L.; validation, J.Y. and J.L.; formal analysis,
J.L.; investigation, J.L., Z.L., C.Z., X.Q., M.C., T.S.; data curation, J.L.; writing—original draft preparation, J.L.;
writing—review and editing, J.L. and J.Y.; visualization, J.L.; supervision, J.Y.; funding acquisition, J.Y. and J.L.
All authors have read and agreed to the published version of the manuscript.
Funding: This research was funded by “Provincial Science and Technology Major Project of Hunan, China under
Grant, grant number 2018NK1030”, “the Forestry Science and Technology Innovation Project of Hunan, China under
Grant, grant number XLK201987”, “Scientific Innovation Fund for Post-graduates of Central South University
of Forestry and Technology, grant number CX20191002”, and “Hunan Provincial Innovation Foundation For
Postgraduate, grant number CX20190598”.
Conflicts of Interest: The authors declare no conflict of interest.
References
1. Wood, C.T.; Schlindwein, C.C.D.; Soares, G.L.G.; Araujo, P.B. Feeding rates of Balloniscus sellowii
(Crustacea, Isopoda, Oniscidea): The effect of leaf litter decomposition and its relation to the phenolic
and flavonoid content. Zookeys 2012, 24, 231–245. [CrossRef] [PubMed]
2. Progar, R.; Schowalter, T.; Freitag, C.; Morrell, J. Respiration from coarse woody debris as affected by moisture
and sapotroph functional diversity in Western Oregon. Oecologia 2000, 124, 426–431. [CrossRef] [PubMed]
3. Hamilton, E.; Frank, D. Can Plants Stimulate Soil Microbes and Their Own Nutrient Supply? Evidence from
a Grazing Tolerant Grass. Ecology 2001, 82, 2397–2402. [CrossRef]
4. Nemergut, D.R.; Cleveland, C.C.; Wieder, W.R.; Washenberger, C.L.; Townsend, A.R. Plot-scale manipulations
of organic matter inputs to soils correlate with shifts in microbial community composition in a lowland
tropical rain forest. Soil Biol. Biochem. 2010, 42, 2153–2160. [CrossRef]
5. Fierer, N.; Bradford, M.A.; Jackson, R.B. Toward an ecological classification of soil bacteria. Ecology 2007, 88,
1354–1364. [CrossRef] [PubMed]
6. Martin, P.; MacLeod, R.A. Observations on the Distinction between Oligotrophic and Eutrophic Marine
Bacteria. Appl. Environ. Microb. 1984, 47, 1017–1022. [CrossRef]
7. Smith, S.E.; Read, D.J. Mycorrhizal Symbioses, 2nd ed.; Academic Press: London, UK, 1997.
8. Masny, S. Occurrence of Venturia inaequalis races in Poland able to overcome specific apple scab resistance
genes. Eur. J. Plant Pathol. 2016, 147, 313–323. [CrossRef]
9. Islam, S.; Akanda, A.M.; Sultana, F.; Hossain, M.M. Chilli rhizosphere fungus Aspergillus spp. PPA1 promotes
vegetative growth of cucumber (Cucumis sativus) plants upon root colonisation. Arch. Phytopathol. Plant Protect.
2013, 47, 1231–1238. [CrossRef]
10. Li, J.; Wu, Z.; Yuan, J. Impact of agro-farming activities on microbial diversity of acidic red soils in a Camellia Oleifera
Forest. Rev. Bras. Cienc. Solo 2019, 43, e0190044. [CrossRef]
11. Dennis, P.G.; Miller, A.J.; Hirsch, P.R. Are root exudates more important than other sources of rhizodeposits
in structuring rhizosphere bacterial communities? FEMS Microbiol. Ecol. 2010, 72, 313–327. [CrossRef]
12. Marschner, P.; Marino, W.; Lieberei, R. Seasonal effects on microorganisms in the rhizosphere of two tropical
plants in a polyculture agroforestry system in Central Amazonia, Brazil. Biol. Fert. Soils 2002, 35, 68–71.
[CrossRef]
13. Lynch, J.M. The Rhizosphere; John Wiley & Sons: New York, NY, USA, 2007.
14. Jousset, A.; Scheu, S.; Bonkowski, M. Secondary metabolite production facilitates establishment of
rhizobacteria by reducing both protozoan predation and the competitive effects of indigenous bacteria.
Funct. Ecol. 2008, 22, 714–719. [CrossRef]
15. Bob, S.; Bakker, A.W.; Bakker, P.A. Interactions of Deleterious and Beneficial Rhizosphere Microorganisms
and the Effect of Cropping Practices. Annu. Rev. Phytopathol. 1987, 25, 339–358. [CrossRef]Microorganisms 2020, 8, 1385 16 of 19
16. Lugtenberg, B.; Kamilova, F. Plant-Growth-Promoting Rhizobacteria. Annu. Rev. Microbiol. 2009, 63, 541–556.
[CrossRef] [PubMed]
17. Van Loon, L.C. Plant responses to plant growth-promoting rhizobacteria. Eur. J. Plant Pathol. 2007, 119,
243–254. [CrossRef]
18. Kremer, R.J. Deleterious Rhizobacteria. In Plant-Associated Bacteria; Gnanamanickam, S.S., Ed.; Springer:
Dordrecht, the Netherlands, 2006; pp. 335–361.
19. Zhou, S.; Zhang, M.; Zhang, K.; Yang, X.; He, D.; Yin, J.; Wang, C. Effects of reduced nitrogen and suitable
soil moisture on wheat (Triticum aestivum L.) rhizosphere soil microbiological, biochemical properties and
yield in the Huanghuai Plain, China. J. Integr. Agric. 2020, 19, 234–250. [CrossRef]
20. Ilyas, N.; Bano, A. Azospirillum strains isolated from roots and rhizosphere soil of wheat (Triticum aestivum L.)
grown under different soil moisture conditions. Biol. Fert. Soils 2010, 46, 393–406. [CrossRef]
21. Taketani, R.G.; Lançoni, M.D.; Kavamura, V.N.; Durrer, A.; Andreote, F.D.; Melo, I.S. Dry Season Constrains
Bacterial Phylogenetic Diversity in a Semi-Arid Rhizosphere System. Microb. Ecol. 2016, 73, 153–161.
[CrossRef]
22. Neumann, G.; Römheld, V. The release of root exudates as affected by the plant physiological status. In The Rhizosphere;
CRC Press: New York, NY, USA, 2000; pp. 57–110.
23. López-Gutiérrez, J.C.; Toro, M.; López-Hernández, D. Arbuscular mycorrhiza and enzymatic activities in the
rhizosphere of Trachypogon plumosus Ness. in three acid savanna soils. Agric. Ecosyst. Environ. 2004, 103,
405–411. [CrossRef]
24. Yang, Q.; Wang, X.; Shen, Y. Comparison of soil microbial community catabolic diversity between rhizosphere
and bulk soil induced by tillage or residue retention. J. Soil Sci. Plant Nutr. 2013, 13, 187–199. [CrossRef]
25. Mestre, M.C.; Rosa, C.A.; Safar, S.V.B.; Libkind, D.; Fontenla, S.B. Yeast communities associated with the
bulk-soil, rhizosphere and ectomycorrhizosphere of a Nothofagus pumilio forest in northwestern Patagonia,
Argentina. FEMS Microbiol. Ecol. 2011, 78, 531–541. [CrossRef] [PubMed]
26. Hernesmaa, A.; Björklöf, K.; Kiikkilä, O.; Fritze, H.; Haahtela, K.; Romantschuk, M. Structure and function of
microbial communities in the rhizosphere of Scots pine after tree-felling. Soil Biol. Biochem. 2005, 37, 777–785.
[CrossRef]
27. Bhattacharyya, D.; Duta, S.; Yu, S.-M.; Jeong, S.C.; Lee, Y.H. Taxonomic and Functional Changes of Bacterial
Communities in the Rhizosphere of Kimchi Cabbage after Seed Bacterization with Proteus vulgaris JBLS202.
Plant Pathol. J. 2018, 34, 286–296. [CrossRef] [PubMed]
28. Yang, G.; Shu, Q.; Duan, L.; Chen, C.; Zheng, H. Resistance of Main Cultivars of Oil Tea to Colletotrichum gloeosporioides.
J. Anhui Agric. Univ. 2004, 31, 480–483. [CrossRef]
29. Cook, R.J.; Thomashow, L.S.; Weller, D.M.; Fujimoto, D.; Mazzola, M.; Bangera, G.; Kim, D.S. Molecular
Mechanisms of Defense by Rhizobacteria against Root Disease. Proc. Natl. Acad. Sci. USA 1995, 92,
4197–4201. [CrossRef]
30. Zhang, P.; Cui, Z.; Guo, M.; Xi, R. Characteristics of the soil microbial community in the forestland of
Camellia oleifera. PeerJ 2020, 8, e9117. [CrossRef]
31. Hartmann, A.; Schmid, M.; Tuinen, D.V.; Berg, G. Plant-driven selection of microbes. Plant Soil 2009, 321,
235–257. [CrossRef]
32. Zhu, J. A Study on the Peroxidase in Camellia Species and Their Resistance to Anthracnoso Causing
Fungus. J. Fujian Coll. For. 1990, 10, 368–375. Available online: http://en.cnki.com.cn/Article_en/CJFDTotal-
FJLB199004011.htm (accessed on 2 August 2020).
33. Liu, F.; Zeng, S. Short-term Effects of Prescribed Burning on Soil under Middle Aged Pinus Massoniana
Plantation. Chin. J. Soil Sci. 2017, 48, 1025–1031. [CrossRef]
34. Wang, X.; Zabowski, D. Nutrient composition of Douglas-fir rhizosphere and bulk soil solutions. Plant Soil
1998, 200, 13–20. [CrossRef]
35. Bouyoucos, G.J. Evaporating the water with burning alcohol as a rapid means of determining moisture
content of soils. Soil Sci. 1937, 44, 377–384. [CrossRef]
36. Bureau, T.S.F. Determination of pH Value in Forest Soil; Standards Press of China: Beijing, China, 1999;
Volume LY/T1239-1999.
37. Bureau, T.S.F. Determination of Organic Matter in Forest Soil and Calculation Carbon-Nitrogen Ratio; Standards Press
of China: Beijing, China, 1999; Volume LY/T1237-1999.You can also read