Localized basal area affects soil respiration temperature sensitivity in a coastal deciduous forest
←
→
Page content transcription
If your browser does not render page correctly, please read the page content below
Biogeosciences, 17, 771–780, 2020
https://doi.org/10.5194/bg-17-771-2020
© Author(s) 2020. This work is distributed under
the Creative Commons Attribution 4.0 License.

Localized basal area affects soil respiration temperature sensitivity
in a coastal deciduous forest
Stephanie C. Pennington1 , Nate G. McDowell2 , J. Patrick Megonigal3 , James C. Stegen2 , and Ben Bond-Lamberty1
1 Joint Global Change Research Institute, Pacific Northwest National Laboratory, 5825 University Research Ct. #3500,
College Park, MD 20740, USA
2 Pacific Northwest National Laboratory, Biological Sciences Division, Richland, WA 99354, USA
3 Smithsonian Environmental Research Center, Edgewater, MD 21037, USA

Correspondence: Stephanie C. Pennington (stephanie.pennington@pnnl.gov)

Received: 30 May 2019 – Discussion started: 2 July 2019
Revised: 31 December 2019 – Accepted: 10 January 2020 – Published: 14 February 2020

Abstract. Soil respiration (Rs ), the flow of CO2 from the soil     of above- and belowground coupling, is necessary to link
surface to the atmosphere, is one of the largest carbon fluxes      these processes with large-scale soil-to-atmosphere C fluxes.
in the terrestrial biosphere. The spatial variability of Rs is
both large and poorly understood, limiting our ability to ro-
bustly scale it in space. One factor in Rs spatial variability
is the autotrophic contribution from plant roots, but it is un-     1   Introduction
certain how the presence of plants affects the magnitude and
temperature sensitivity of Rs . This study used 1 year of Rs        Soil respiration (Rs ), the flow of CO2 from the soil to the at-
measurements to examine the effect of localized basal area          mosphere, is among the largest C fluxes in the terrestrial bio-
on Rs in the growing and dormant seasons, as well as during         sphere (Granier et al., 2000; Bond-Lamberty, 2018; Le Quéré
moisture-limited times, in a temperate, coastal, deciduous          et al., 2018) but remains poorly constrained both temporally
forest in eastern Maryland, USA. In a linear mixed-effects          and spatially at all scales. Unlike other large C fluxes such as
model, tree basal area within a 5 m radius (BA5 ) exerted a         net primary production, net ecosystem exchange, and gross
significant positive effect on the temperature sensitivity of       primary production, Rs cannot be measured, even indirectly,
soil respiration. Soil moisture was the dominant control on         at scales larger than a few square meters (Bond-Lamberty et
Rs during the dry portions of the year, while soil moisture,        al., 2016). Though global-scale Rs varies between vegetation
temperature, and BA5 all exerted significant effects on Rs          types and biomes (Raich et al., 2002; Raich and Schlesinger,
in wetter periods. Our results suggest that autotrophic res-        1992), and responds to disturbances such as land use and cli-
piration is more sensitive to temperature than heterotrophic        mate changes (Hursh et al., 2017; Schlesinger and Andrews,
respiration at these sites, although we did not measure these       2000), it is uncertain how these patterns arise from local-
source fluxes directly, and that soil respiration is highly mois-   scale variability, limiting our ability to robustly scale the pro-
ture sensitive, even in a record-rainfall year. The Rs flux mag-    cess.
nitudes (0.46–15.0 µmol m−2 s−1 ) and variability (coefficient         One obstacle to robust measurements of Rs is that the spa-
of variability 10 %–23 % across plots) observed in this study       tial and temporal variability is both large and poorly under-
were comparable to values observed in similar forests. Six          stood. This high variability has consequences for the sam-
Rs observations would be required in order to estimate the          pling strategy required to accurately measure Rs at the stand
mean across all study sites to within 50 %, and 518 would be        scale (Rodeghiero and Cescatti, 2008; Saiz et al., 2006)
required in order to estimate it to within 5 %, with 95 % con-      and limits our ability to upscale Rs measurements to eddy
fidence. A better understanding of the spatial interactions be-     covariance tower scales (Barba et al., 2018). Controls on
tween plants and microbes, as well as the strength and speed        the spatiotemporal variability of Rs differ among sites and
                                                                    ecosystems and include plant species, ecosystem productiv-

Published by Copernicus Publications on behalf of the European Geosciences Union.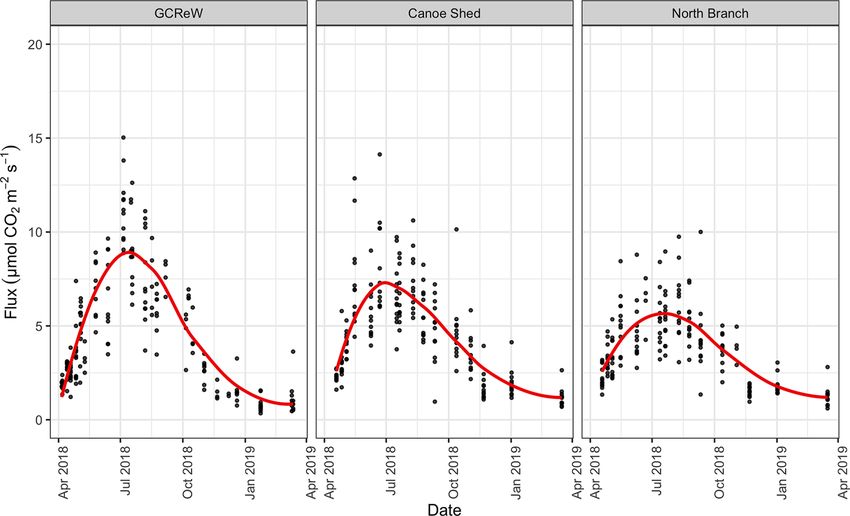
772                             S. C. Pennington et al.: Localized basal area affects soil respiration temperature sensitivity

ity (Reichstein et al., 2003), soil temperature (Fang et al.,      chosen along Muddy Creek, a stream draining into an arm
1998), moisture, spatial variability of vegetation, manage-        of the Chesapeake Bay. Each site was separated by ∼ 1 km
ment, and soil compaction (Epron et al., 2004). The collec-        (Fig. 1b). These sites were comprised of both lowland and
tive responses of plants and microbes to these factors deter-      upland forest with a mean annual precipitation of 1001 mm
mine the sensitivity of ecosystems to changes in temperature,      and mean annual temperature of 12.9 ◦ C (Pitz and Mego-
precipitation, and other global change factors.                    nigal, 2017). Dominant tree species include Liriodendron
   Plant root respiration constitutes ∼ 50 % of Rs in many         tulipifera, Fagus grandifolia, and Quercus spp.; soil types
ecosystems (Subke et al., 2006). At ecosystem scales, a num-       vary between Collington, Wist, and Annapolis soil (Table 1).
ber of studies have examined how the spatial distribution of       At each site, three 20 m × 40 m plots were installed, sepa-
Rs is affected by vegetation. Rs is typically higher closer to     rated by ∼ 25 m, and oriented perpendicular to the creek.
tree stems (Epron et al., 2004; Tang and Baldocchi, 2005)          The total elevation change between plots at each site was
and with higher nearby stem density (Schwendenmann and             ∼ 2 m. Within each plot, we installed four 20 cm diameter
Macinnis-Ng, 2016; Stegen et al., 2017). Photosynthesis is         PVC collars, randomly separated from each other by 2–15 m,
also a driver of the rhizospheric component of soil respira-       for a total of 36 measurement collars. Collars were installed
tion (Hopkins et al., 2013) and influences seasonal trends in      ∼ 1 week prior to the first sampling and left in place for the
root contribution to total soil respiration (Brændholt et al.,     duration of the study.
2018; Högberg et al., 2001). Any spatial influences of plants
on the magnitude and environmental sensitivities of Rs might       2.2   Soil respiration and ancillary measurements
thus be expected to be strong in temperate deciduous forests,
as such forests tend to be highly productive (Gillman et al.,      Soil respiration measurements were taken using an infrared
2015; Luyssaert et al., 2007).                                     gas analyzer (IRGA; LI-8100A, LI-COR Inc., Lincoln, NE)
   This study examines the effect of tree proximity on mea-        with a 20 cm diameter opaque soil chamber attached. Mea-
sured Rs in a mid-Atlantic, deciduous forest in the Chesa-         surements were taken every 10–14 d from April 2018 to
peake Bay, USA, region. We hypothesized that                       April 2019. The IRGA measures concentrations every sec-
                                                                   ond over a one-minute period and calculates the CO2 flux as
    i. the amount of basal area close to Rs measurement lo-        the exponential regression of CO2 accumulation in the closed
       cations would exert a significant and positive effect on    chamber system over unit area and time; two successive mea-
       measured Rs after taking into account the effects of abi-   surements were taken at each collar and averaged. Vegeta-
       otic drivers;                                               tion was removed from inside the collar, and new vegetation
                                                                   was reclipped as necessary, to remove any aboveground au-
    ii. this effect would occur in the growing (leaf on) season    totrophic flux, so that the IRGA was measuring only soil-to-
        but not in the dormant (leaf off) season, because root     atmosphere CO2 . Soil moisture and temperature (T5 ) were
        respiration is much higher during the growing season;      recorded at 5 cm depth, using auxiliary sensors attached to
        and                                                        the LI-8100A, at the same time as soil respiration measure-
 iii. this effect would be stronger during drier times of year,    ments. Temperature at 20 cm depth (T20 ) was also recorded
      because trees might maintain access to deep soil mois-       using a handheld thermometer at the time of measurement.
      ture (Burgess et al., 1998) and thus continue respiring
                                                                   2.3   Local basal area measurements
      even when the surface soil is dry.
To test these hypotheses, we performed a spatially explicit        We recorded distance from the soil collar, diameter at breast
analysis of 1 year of frequent Rs measurements in a temper-        height (1.37 m), and species of each tree within a 15 m ra-
ate coastal deciduous forest in eastern Maryland, USA. Our         dius of each soil respiration measurement point (Fig. 1a).
study was conducted in the Chesapeake Bay watershed, an            Dead trees were included in the dataset but only account for
area subject to rapid rates of sea level rise (Ezer and Cor-       < 1 % of total forest basal area. Cumulative basal area was
lett, 2012; Sallenger et al., 2012) that may exert significant     calculated at each 1 m radial distance from the collar, sum-
effects on the carbon cycling of coastal ecosystems (Rogers        ming the cross-sectional areas of all trees within each dis-
et al., 2019).                                                     tance. Tree root extent can be highly variable, but generally
                                                                   roots extend at least to the edge of the tree canopy (Stone and
                                                                   Kalisz, 1991). Mature tree canopies at SERC are ∼ 5 m in ra-
2     Methods                                                      dius (Stephanie C. Pennington, personal observation, 2018),
                                                                   and we adopted this distance as an a priori assumption to test
2.1    Site characteristics                                        for the effect of basal area at 5 m (BA5 ) on Rs .
This study was conducted in a mid-Atlantic, temperate, de-
ciduous forest at the Smithsonian Environmental Research
Center (SERC) in Edgewater, MD, USA. Three sites were

Biogeosciences, 17, 771–780, 2020                                                        www.biogeosciences.net/17/771/2020/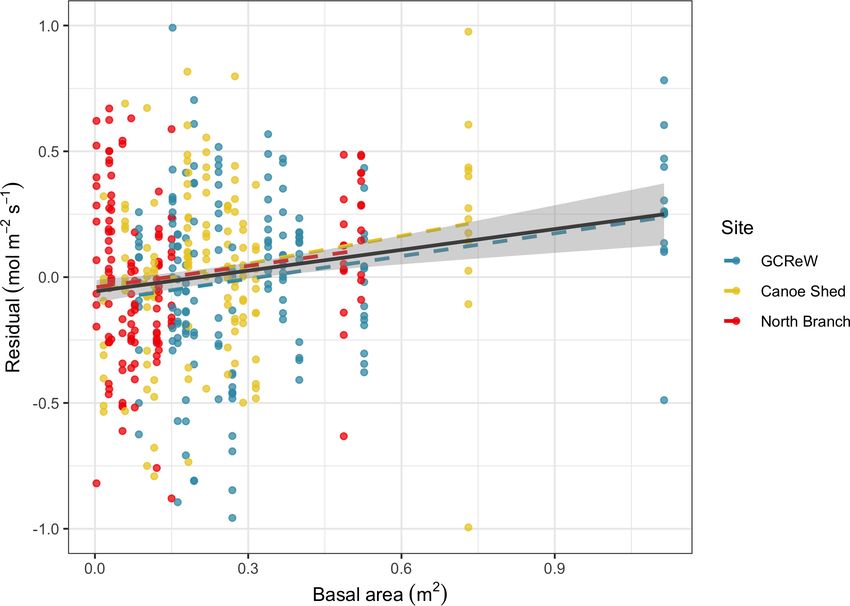
S. C. Pennington et al.: Localized basal area affects soil respiration temperature sensitivity                                          773

Figure 1. (a) Tree proximity measurement schematic. Distance to each tree was recorded within a 15 m radius of each soil respiration
measurement point, along with diameter at breast height (DBH) and species. (b) Map of the Smithsonian Environmental Research Center with
the three sites labeled in black. (Map tiles by Stamen Design, under CC BY 3.0. Data by OpenStreetMap, under ODbL. © OpenStreetMap
contributors 2019. Distributed under a Creative Commons BY-SA License.)

Table 1. Study site characteristics of each site along Muddy Creek, including trees per hectare, cumulative basal area, main soil types, and
dominant tree species by percent of basal area. Values are the mean ± standard deviation of N = 3800 m2 plots.

  Site               Trees (ha−1 )     BA (m2 ha−1 )        Dominant soil type                 Dominant tree                     Altitude
                                                                                               species (by BA %)                 (m)
  GCReW              637.5 ± 57.3      45.2 ± 7.3           Collington–Wist complex;           28 % Liriodendron tulipifera      3–10
  (38.876◦ N,                                               Collington and Annapolis soils     11 % Quercus spp.
  76.553◦ W)                                                                                   11 % Fagus grandifolia
  Canoe Shed         529.2 ± 93.8      40.4 ± 6             Annapolis fine sandy loam          26 % Quercus spp.,                7–10
  (38.884◦ N,                                                                                  23 % L. tulipifera
  76.557◦ W)                                                                                   20 % F. grandifolia
  North Branch       806.9 ± 180.7     34.5 ± 7.8           Collington and Annapolis soils;    42 % F. grandifolia               8–20
  (38.887◦ N,                                               Collington, Wist, and              26 % Quercus spp.
  76.563◦ W)                                                Westphalia soils                   12 % Liquidambar styraciflua

2.4      Statistical analysis                                           We used restricted maximum likelihood estimation using the
                                                                        lme4 package (Bates et al., 2015) in R version 3.5.3 (R De-
Respiration data were checked visually for artifacts or un-             velopment Core Team, 2019). All models were examined for
usual outliers, but we did not exclude any data a priori.               influential outliers and deviations from normality. Nonsignif-
Data were then combined with the proximity measurements                 icant terms were then eliminated using a forward-and-back
described above based on collar number. We used a linear                stepwise algorithm (using the R package MASS version 7.3-
mixed-effects model to test for the influence of BA5 on Rs ,            47) based on the Akaike information criterion (AIC). Residu-
treating temperature, soil moisture (SM), and BA5 as fixed              als from all fitted models were plotted and checked for trends
effects and site as a random effect (Eq. 1). Rs frequently fol-         or heteroscedasticity.
lows a nonlinear response in relation to SM, so a quadratic                Our secondary hypotheses, that the effect of BA5 varies
SM term (Sierra et al., 2015) was included in the model. The            with growing season and soil moisture, were tested by sub-
dependent variable Rs was transformed by taking its natural             setting the Rs data. We treated 15 April–14 October as the
logarithm to minimize heteroscedasticity, and thus the full             growing season, based on 2018 leaf-out and senescence, and
linear model was specified as                                           15 October–14 April as the dormant season. Soil moisture
                                                                        data were split up into equal thirds (low, < 0.188 m3 m−3 ;
log(Rs ) ∼ T5 · BA5 + T20 · BA5 + SM + SM2 .                   (1)      medium, 0.188–0.368 m3 m−3 ; and high, > 0.368 m3 m−3 ;

www.biogeosciences.net/17/771/2020/                                                                 Biogeosciences, 17, 771–780, 2020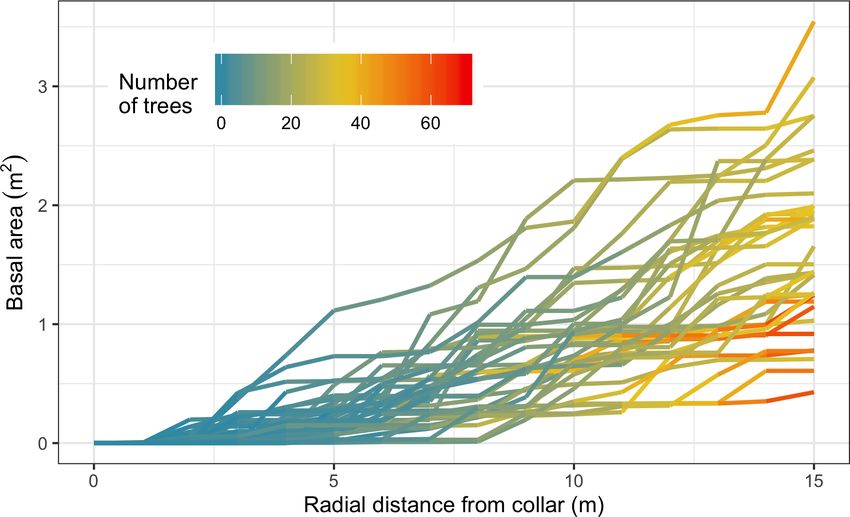
774 S. C. Pennington et al.: Localized basal area affects soil respiration temperature sensitivity
Table 2. Sample size required to estimate soil respiration with a par- 3.1 Effect of BA on Rs
ticular error (delta, left column, fraction of mean flux) for different
statistical power values. Values are the mean (standard deviation) The linear mixed-effects model using temperature, soil mois-
between plots. Power is the probability that the test rejects the null ture, and basal area within 5 m (BA5 ) predicted 37 % of
hypothesis when a specific alternative hypothesis is true and infor- the Rs variability (conditional R 2 = 0.37). BA5 was not sig-
mally connotes the degree of confidence that the measurement is nificant by itself in a Type III ANOVA using this model
within some delta value of the true mean. (χ 2 = 0.081, P = 0.776) but exhibited strong and significant
Power (1 − β)
interactions with T5 and T20 in the linear model (Table 3).
In addition, the residuals of a model fit without BA5 had a
Delta 0.5 0.6 0.7 0.8 0.9 0.95
0.05 61 (24) 95 (37) 144 (55) 220 (84) 364 (138) 518 (196) significant trend with BA5 (Fig. 4). Separating the data into
0.10 16 (6) 24 (10) 36 (14) 55 (21) 91 (35) 130 (49) growing- and dormant-season subsets provided contrasting
0.25 3 (1) 4 (2) 6 (3) 9 (4) 15 (6) 21 (8) results. In the growing season, model outputs were similar
0.50 1 (1) 1 (1) 2 (1) 3 (1) 4 (2) 6 (2)
to those of the full-year model, with BA5 having signifi-
cant interactions with T5 and T20 (data not shown). The dor-
mant season model, however, was quite different: only T20
all values volumetric). We then applied the statistical model (P ≤ 0.000) and soil moisture (P = 0.0377) were significant
described above to each subset of the data to test for BA5 terms. In addition, the dormant season model explained more
significance in the model. The relaimpo package version 2.2- of the Rs variability (AIC = 119.80, marginal R 2 = 0.48). In
3 was used to calculate relative importance metrics for all summary, collars with higher basal area within 5 m had a sig-
terms in each model, in particular its lmg metric that aver- nificantly higher temperature sensitivity of soil respiration,
ages sequential sums of squares over all orders of regressors while basal area within 5 m of sampling points was not cor-
(Lindeman et al., 1980), providing a robust decomposition of related with Rs during the dormant season.
model R 2 . There were strong differences between the driest and
We used the spatial variability between collars within in- wettest thirds of the data, but our hypothesis that any basal
dividual plots to estimate the number of samples required for area effect would be strongest in the driest time of year was
a robust estimate of the Rs population mean, i.e., a spatially not supported. In the driest third of the data, neither BA5 nor
representative mean. Specifically, we used a Student t test to its interaction with T5 was significant (P = 0.096 and 0.054
calculate this based on the standard deviation of hourly Rs , respectively); T20 was never significant; and the dominant
the desired power of the test, and the allowable delta (dif- control was instead soil moisture (χ 2 = 15.23, P < 0.001).
ference from the true mean value), following Davidson et al. In contrast, the wettest-third model resembled the full-year
(2002). model, with BA5 interacting with temperature and soil mois-
ture also significant.
3 Results
3.2 Sensitivity test
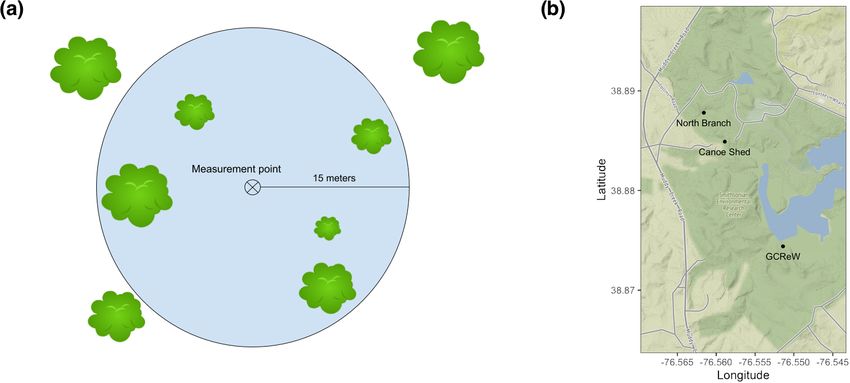
We measured Rs , soil temperature, and soil moisture on 31
Our a priori choice of 5 m for the basal area test was one of
different days across the 1-year period (Fig. 2). Soil tempera-
many possible choices and could potentially bias the results,
tures ranged from 0.1 to 27.5 ◦ C (at 5 cm) and 1.7 to 24.4 ◦ C
as the actual extent of tree roots at these sites is unknown.
(at 20 cm); volumetric soil moisture values were 0.01–0.56.
Refitting the main statistical model and calculating variable
Rs fluxes ranged from 0.35 µmol m−2 s−1 (in January 2019)
importance metrics across a wide range of distances, how-
to 15.3 µmol m−2 s−1 (in July 2018). The coefficient of vari-
ever, showed that basal area and its interactions with T5 and
ability (CV) between collars within plots, a measure of spa-
T20 were almost always statistically significant (Fig. 5). Gen-
tial variability, was 16.7 % ± 4.0. This implied that a large
erally, the BA effects were not significant at short (< 3 m)
number of samples was required to estimate soil respiration
distances; this is expected, given that few collars were that
accurately (Table 2).
close to trees. Interestingly, the BA effects remained signifi-
There was large variability in the basal area and number
cant all the way to our maximum measured distance of 15 m.
of trees close to the measurement collars (Fig. 3). The mean
In summary, our a priori analytical choice of a 5 m radius did
number of trees within 1, 5, and 10 m distance were 1, 6, and
not appear to bias our results.
21 trees (with respective nearby basal areas of 0.0002, 0.24,
and 0.88 m2 ). Within our maximum radius of measurement,
15 m, there were on average 43 trees and 1.64 m2 of cumu- 4 Discussion
lative basal area, ranging from a minimum of 0.43 m2 to a
maximum of 3.55 m2 . The forest was thus highly spatially The Rs fluxes observed in this study, 0.35–
variable in its distribution of trees relative to the Rs measure- 15.3 µmol m−2 s−1 , were comparable to values in simi-
ment collars. lar forests (Giasson et al., 2013) as well as those from
the Soil Respiration Database (SRDB; Bond-Lamberty
Biogeosciences, 17, 771–780, 2020 www.biogeosciences.net/17/771/2020/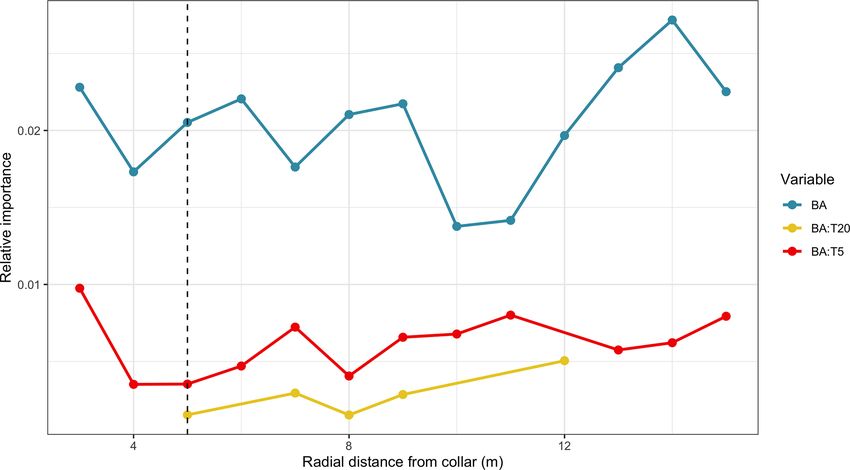
S. C. Pennington et al.: Localized basal area affects soil respiration temperature sensitivity                                          775

Figure 2. CO2 flux over time from April 2018 to April 2019 for 36 measurement points across three sites; red line shows the seasonal trend
using a loess smoother.

Figure 3. Cumulative basal area for each soil collar (N = 36) up to
15 m. Color indicates the number of trees at each distance, and each
line is an individual collar.                                          Figure 4. Residuals of a soil respiration model, incorporating tem-
                                                                       perature and soil moisture as independent variables, versus cumula-
                                                                       tive tree basal area within 5 m, by site. Each point is an individual
and Thomson, 2010), a synthesis of annual Rs studies                   observation (see Fig. 2). Regression lines are shown for each site;
(0 to 14.7 µmol m−2 s−1 , n = 1281 temperate deciduous                 the black line is the overall trend. Note that five extreme points are
                                                                       out of the plot but are accounted for in the regression lines.
studies). We observed a Rs CV of 10 %–22 % between
plots, a value also comparable to previous studies. In a
study of Rs in conifer forests and grasslands, Rodeghiero
and Cescatti (2008) reported 28.9 %–41.5 % variability,                structure (Søe and Buchmann, 2005) can be dominant con-
Davidson et al. (2000) about 30 % in forest ecosystems,                trols. Significant spatial variation in stand structure and to-
and a much broader range (0.11 %–84.5 %) for temperate,                pography across the study domain may have resulted in the
deciduous forests from the SRDB.                                       high variability seen in this study. In particular, the measure-
   Sample size requirements to estimate annual Rs were high            ment points at our study sites ranged from 3 to 15 m in eleva-
at SERC compared to previous studies. For example, to be               tion (Table 1), as at all sites the land rises quickly away from
within 10 % of the mean Rs flux at 95 % confidence required            Muddy Creek. These elevation gradients mean that some
from 41 sample points (Davidson et al., 2002) in Harvard               measurement points drain more quickly than others, creat-
Forest, to 72 (Adachi et al., 2005) in a secondary forest, to          ing strong differences in soil water content (CV 16.7 % ± 4.0
130 in this study. Within forest biomes, topography and stand          within plots) and thus Rs . This is consistent with the idea

www.biogeosciences.net/17/771/2020/                                                                Biogeosciences, 17, 771–780, 2020
776 S. C. Pennington et al.: Localized basal area affects soil respiration temperature sensitivity
Figure 5. Test of robustness of results, run at various distances from soil respiration measurement collars (x axis). Lines show the variable
importance (calculated as R 2 partitioned by averaging over orders; see Methods) of basal area (BA), as well as the interaction of BA and
temperatures at 5 and 20 cm (T5 and T20 respectively). Vertical dashed line shows the 5 m radius used in Table 3 and Fig. 4 results. Note
that the missing BA : T20 (in yellow) dots at distances < 5 and > 12 m mean that the terms were dropped from the model and are thus not
significant.
Table 3. Summary of the linear mixed-effects model testing the tivity of soil respiration. This suggests that Ra might be more
main hypothesis of the effect of nearby tree basal area on soil respi- sensitive to temperature than Rh at these sites. However, it
ration (the dependent variable). Terms tested include soil tempera- is important to note that we did not directly measure the au-
ture at 5 and 20 cm (T5 and T20 respectively), basal area (BA), and totrophic and heterotrophic source fluxes contributing to the
soil moisture (SM). Model AIC = 381.6, marginal R 2 = 0.36. overall Rs flux. Instead, we assume that collars closer to trees
have a larger fraction of Rs contributed by Ra , an assump-
Value Degrees of t value p value
tion also made in previous studies such as Tang and Baldoc-
freedom
chi (2005).
(Intercept) −0.767 ± 0.148 440 −5.199 0.000 Mechanistically, these findings could be explained by a
T5 0.010 ± 0.009 440 1.055 0.292 number of processes. When substrate supply from root ex-
BA5 0.022 ± 0.219 440 0.098 0.922 udates is higher during the growing season, Rs tends to be
T20 0.095 ± 0.011 440 8.397 0.000
more sensitive to temperature (Luo and Zhou, 2006), pre-
SM 2.505 ± 0.699 440 3.581 0.004
I(SM2 ) −3.542 ± 1.144 440 −3.095 0.002
sumably because under these conditions Rs is tightly coupled
T5 : BA5 0.079 ± 0.036 440 2.181 0.030 with photosynthesis (Ekblad and Högberg, 2001), as roots
BA5 : T20 −0.069 ± 0.041 440 −1.689 0.092 access photosynthate before microbes, and thus can respond
more strongly to temperature changes. Leaf phenology likely
also plays a role in a deciduous forest such as the one studied
here, where the growth of photosynthetically active foliage in
that topographic complexity can be an important and com- the spring can promote carbon allocation belowground and
plex factor in Rs variation across sites (Riveros-Iregui et al., hence Ra . Input of leaf material in the fall may also stimulate
2011). Rh (Curiel Yuste et al., 2004; Epron et al., 2001; Ruehr et al.,
2010) and is dependent on tree size and distribution (Bréchet
4.1 Interactions between basal area and temperature et al., 2011).
sensitivity on Rs There is also abundant evidence that soil moisture influ-
ences temperature sensitivity: Suseela et al. (2012), for ex-
Many studies have examined whether autotrophic respira- ample, found that Rs is less sensitive to temperature during
tion (Ra ) or heterotrophic respiration (Rh ) is more temper- water-limited times. If trees’ roots have access to water con-
ature sensitive and reached varying conclusions (Aguilos et sistently, their respiratory flux Ra measured at the soil surface
al., 2011; Boone et al., 1998; Wei et al., 2010). In this study, as part of Rs will be more temperature sensitive on average,
the Type III SS interaction between BA5 and temperature was because Ra will be limited by soil moisture less frequently
highly significant, meaning that collars with higher basal area
within 5 m exhibited significantly higher temperature sensi-
Biogeosciences, 17, 771–780, 2020 www.biogeosciences.net/17/771/2020/S. C. Pennington et al.: Localized basal area affects soil respiration temperature sensitivity 777
(Misson et al., 2006). It is important to note that these vari- Second, this study tested the effect of basal area on Rs ,
ous mechanisms are not mutually exclusive. based on the assumption that BA is proportional to fine root
biomass, the respiration of which is driven (with some time
4.2 Soil moisture controls on BA significance lag) by photosynthesis, and this in turn drives root respira-
tion dynamics (Vose and Ryan, 2002). Stems with a diameter
We hypothesized that any BA5 effect would be particularly below 2 cm and understory were not inventoried or, as a re-
strong during the driest third of the year but instead found sult, included in the hypothesis-testing statistical models. If
that only soil moisture controlled Rs during these periods, root respiration is instead correlated with number of stems,
while neither temperature nor tree proximity (BA5 ) was sig- which are disproportionately small due to forest demograph-
nificant. This demonstrates that Rs is highly moisture sen- ics, this would bias our results. There are not many under-
sitive at these sites but does not support our idea that trees story/saplings at these sites (Table 1), however.
might have access to deeper or different water sources than
surface soil microbes. Soil moisture is considered to be a
primary Rs control in Mediterranean and desert ecosystems 5 Conclusion
(Cable et al., 2010), but interestingly even this deciduous for-
est, in a year with record rainfall (National Weather Service, We found that measurement collars with higher tree basal
2019), experienced significant moisture restrictions on Rs . area within 5 m had a significantly higher temperature sen-
sitivity of Rs . Rs was also highly moisture sensitive at all of
4.3 Dormant season Rs controls our study sites, with large differences among Rs in low- ver-
sus high-moisture times. These findings, in conjunction with
Tree basal area within 5 m of our Rs sampling points was large sample size requirements, suggests that the highly dy-
not significant in the dormant season model, supporting our namic and variable nature of soil respiration at this site lends
hypothesis that total Ra contribution is often lower during itself to localized basal area effects on Rs . This could have
the dormant reason than the growing season (Hanson et al., implications for measurement requirements in sites with par-
2000), which suggests that Ra contributes less to Rs during ticular stand structures. A better understanding of the spa-
the dormant season. This is expected, given the physiological tial interactions between plants and microbes through Rh
link between photosynthesis and root respiration (Sprugel et and Ra partitioning, as well as the speed and coupling be-
al., 1995). Interestingly, T5 was not significant in the dormant tween above- and belowground processes, is necessary to
season model, but rather T20 was the dominant control. The link these processes with collar- and ecosystem-scale soil-
study site is in a mid-Atlantic, temperate location with cold to-atmosphere C fluxes.
air temperatures during the winter. Deeper soils are more in-
sulated from cold air temperatures, allowing more favorable
conditions for respiration and thus making T20 a dominant Code and data availability. All code and data necessary to
control on Rs during these times. reproduce our results are available in our online GitHub
repository (https://github.com/PNNL-PREMIS/PREMIS-ghg/
4.4 Limitations of this study releases/tag/v0.3-bgs-final) and permanently archived at Zen-
odo (https://doi.org/10.5281/zenodo.3613839, Pennington and
A number of limitations should be noted in our study design Bond-Lamberty, 2020).
and execution. First, this was not a fully spatially explicit
analysis; we did not map the collars relative to each other
or construct a full spatial map of the forest stands (Atkins et Supplement. The supplement related to this article is available on-
al., 2018). Such mapping can be useful to examine the Rs line at: https://doi.org/10.5194/bg-17-771-2020-supplement.
spatial structure in more detail, as for example in Stegen et
al. (2017), but our approach to mapping relative distances
to trees provides an alternative spatial study construct. In a Author contributions. This study was designed by BBL and SCP.
similar vein, Tang and Baldocchi (2005) measured Rs within All fieldwork and data analysis was performed by SCP, except for
the statistical analysis, which was written by BBL. NGM, JPM, and
a transect of two oak trees to draw inferences on the spatially
JCS provided feedback on the study design, analysis, and interpre-
variable contribution of Rh and Ra . Our study design still tation of results. SCP wrote the paper in close collaboration with all
provides useful spatial information, however: the 15 m max authors.
distance in Fig. 5 implies that the range of a semivariogram,
i.e., the distance of maximum autocorrelation, would be at
least this far. This means that BA remained significant all the Competing interests. The authors declare that they have no conflict
way to our maximum measured distance of 15 m, implying of interest.
that the spatial influence of large trees persisted at least this
far (Högberg et al., 2001).
www.biogeosciences.net/17/771/2020/ Biogeosciences, 17, 771–780, 2020778 S. C. Pennington et al.: Localized basal area affects soil respiration temperature sensitivity
Acknowledgements. This research was supported by the Smith- Bréchet, L., Ponton, S., Alméras, T., Bonal, D., and Epron, D.:
sonian Environmental Research Center. We thank Alexey Shiklo- Does spatial distribution of tree size account for spatial varia-
manov for pointing out a crucial mistake in our statistical code. tion in soil respiration in a tropical forest?, Plant Soil, 347, 293,
https://doi.org/10.1007/s11104-011-0848-1, 2011.
Burgess, S. S. O., Adams, M. A., Turner, N. C., and Ong, C. K.: The
Financial support. This research has been supported by the Pa- redistribution of soil water by tree root systems, Oecologia, 115,
cific Northwest National Laboratory (Laboratory Directed Research 306–311, 1998.
and Development, grant no. DE-AC05-76RL01830) as part of the Cable, J. M., Ogle, K., Lucas, R. W., Huxman, T. E., Loik, M. E.,
PREMIS initiative. Smith, S. D., Tissue, D. T., Ewers, B. E., Pendall, E. G., Welker,
J. M., Charlet, T. N., Cleary, M., Griffith, A., Nowak, R. S.,
Rogers, M., Steltzer, H., Sullivan, P. F., and van Gestel, N. C.:
Review statement. This paper was edited by Michael Weintraub The temperature responses of soil respiration in deserts: a seven
and reviewed by Daniel Epron and two anonymous referees. desert synthesis, Biogeochemistry, 103, 71–90, 2010.
Curiel Yuste, J., Janssens, I. A., Carrara, A., and Ceulemans, R.:
Annual Q10 of soil respiration reflects plant phenological pat-
terns as well as temperature sensitivity, Glob. Change Biol., 10,
References 161–169, 2004.
Davidson, E. A., Verchot, L. V., Cattânio, J. H., Ackerman, I. L.,
Adachi, M., Bekku, Y. S., Konuma, A., Kadir, W. R., Okuda, T., and Carvalho, J. E. M.: Effects of soil water content on soil res-
and Koizumi, H.: Required sample size for estimating soil respi- piration in forests and cattle pastures of eastern Amazonia, Bio-
ration rates in large areas of two tropical forests and of two types geochemistry, 48, 53–69, 2000.
of plantation in Malaysia, Forest Ecol. Manag., 210, 455–459, Davidson, E. A., Savage, K. E., Verchot, L. V., and Navarro, R.:
2005. Minimizing artifacts and biases in chamber-based measurements
Aguilos, M., Takagi, K., Liang, N., Watanabe, Y., Goto, S., Taka- of soil respiration, Agr. Forest Meteorol., 113, 21–37, 2002.
hashi, Y., Mukai, H., and Sasa, K.: Soil warming in a cool- Ekblad, A. and Högberg, P.: Natural abundance of 13 C in CO2
temperate mixed forest with peat soil enhanced heterotrophic respired from forest soils reveals speed of link between tree pho-
and basal respiration rates but Q10 remained unchanged, Biogeo- tosynthesis and root respiration, Oecologia, 127, 305–308, 2001.
sciences Discuss., 8, 6415–6445, https://doi.org/10.5194/bgd-8- Epron, D., Le Dantec, V., Dufrene, E., and Granier, A.: Seasonal
6415-2011, 2011. dynamics of soil carbon dioxide efflux and simulated rhizosphere
Atkins, J. W., Bohrer, G., Fahey, R. T., Hardiman, B. S., Morin, T. respiration in a beech forest, Tree Physiol., 21, 145–152, 2001.
H., Stovall, A. E. L., Zimmerman, N., and Gough, C. M.: Quan- Epron, D., Nouvellon, Y., Roupsard, O., Mouvondy, W., Mabiala,
tifying vegetation and canopy structural complexity from terres- A., Saint-André, L., Joffre, R., Jourdan, C., Bonnefond, J.-M.,
trial LiDAR data using the forestr r package, edited by S. Goslee, Berbigier, P., and Hamel, O.: Spatial and temporal variations of
Methods Ecol. Evol., 9, 2057–2066, 2018. soil respiration in a Eucalyptus plantation in Congo, Forest Ecol.
Barba, J., Cueva, A., Bahn, M., Barron-Gafford, G. A., Bond- Manag., 202, 149–160, 2004.
Lamberty, B., Hanson, P. J., Jaimes, A., Kulmala, L., Pumpa- Ezer, T. and Corlett, W. B.: Is sea level rise accelerating in the
nen, J., Scott, R. L., Wohlfahrt, G., and Vargas, R.: Comparing Chesapeake Bay? A demonstration of a novel new approach
ecosystem and soil respiration: Review and key challenges of for analyzing sea level data, Geophys. Res. Lett., 39, L19605,
tower-based and soil measurements, Agr. Forest Meteorol., 249, https://doi.org/10.1029/2012GL053435, 2012.
434–443, 2018. Fang, C., Moncrieff, J. B., Gholz, H. L., and Clark,
Bates, D., Mächler, M., Bolker, B., and Walker, S.: Fitting Lin- K. L.: Soil CO2 efflux and its spatial variation in a
ear Mixed-Effects Models Using lme4, J. Stat. Softw., 67, 1–48, Florida slash pine plantation, Plant Soil, 205, 135–146,
2015. https://doi.org/10.1023/A:1004304309827, 1998.
Bond-Lamberty, B.: New techniques and data for understanding Giasson, M.-A., Ellison, A. M., Bowden, R. D., Crill, P. M., David-
the global soil respiration flux, Earth’s Future, 6, 1176–1180, son, E. A., Drake, J. E., Frey, S. D., Hadley, J. L., Lavine, M.,
https://doi.org/10.1029/2018EF000866, 2018. Melillo, J. M., Munger, J. W., Nadelhoffer, K. J., Nicoll, L.,
Bond-Lamberty, B. and Thomson, A.: A global database Ollinger, S. V., Savage, K. E., Steudler, P. A., Tang, J., Varner,
of soil respiration data, Biogeosciences, 7, 1915–1926, R. K., Wofsy, S. C., Foster, D. R., and Finzi, A. C.: Soil respira-
https://doi.org/10.5194/bg-7-1915-2010, 2010. tion in a northeastern US temperate forest: a 22-year synthesis,
Bond-Lamberty, B., Epron, D., Harden, J. W., Harmon, M. E., Ecosphere, 4, 140, https://doi.org/10.1890/ES13.00183.1, 2013.
Hoffman, F. M., Kumar, J., McGuire, A. D., and Vargas, Gillman, L. N., Wright, S. D., Cusens, J., McBride, P. D., Malhi, Y.,
R.: Estimating heterotrophic respiration at large scales: chal- and Whittaker, R. J.: Latitude, productivity and species richness:
lenges, approaches, and next steps, Ecosphere, 7, d01380, Latitude and productivity, Global Ecol. Biogeogr., 24, 107–117,
https://doi.org/10.1002/ecs2.1380, 2016. 2015.
Boone, R. D., Nadelhoffer, K. J., Canary, J. D., and Kaye, J. P.: Granier, A., Biron, P., and Lemoine, D.: Water balance, transpira-
Roots exert a strong influence on the temperature sensitivity of tion and canopy conductance in two beech stands, Agr. Forest
soil respiration, Nature, 396, 570–572, 1998. Meteorol., 100, 291–308, 2000.
Brændholt, A., Ibrom, A., Larsen, K. S., and Pilegaard, K.: Parti- Hanson, P. J., Edwards, N. T., Garten, C. T., and Andrews, J. A.:
tioning of ecosystem respiration in a beech forest, Agr. Forest Separating root and soil microbial contributions to soil respira-
Meteorol., 252, 88–98, 2018.
Biogeosciences, 17, 771–780, 2020 www.biogeosciences.net/17/771/2020/S. C. Pennington et al.: Localized basal area affects soil respiration temperature sensitivity 779 tion: A review of methods and observations, Biogeochemistry, National Weather Service: Record Rain and Flooding of 2018, 48, 115–146, 2000. available at: https://www.weather.gov/lwx/2018floods, last ac- Högberg, P., Nordgren, A., Buchmann, N., Taylor, A. F. S., Ekblad, cess: 30 May 2019. A., Högberg, M. N., Nyberg, G., Ottosson-Löfvenius, M., and Pennington, S. C. and Bond-Lamberty, B.: Code Read, D. J.: Large-scale forest girdling shows that current photo- and Data Supporting Manuscript, Zenodo, synthesis drives soil respiration, Nature, 411, 789–792, 2001. https://doi.org/10.5281/zenodo.3613839, 2020. Hopkins, F. M., Gonzalez-Meler, M. A., Flower, C. E., Lynch, D. Pitz, S. and Megonigal, J. P.: Temperate forest methane sink dimin- J., Czimczik, C. I., Tang, J., and Subke, J.-A.: Ecosystem-level ished by tree emissions, New Phytol., 214, 1432–1439, 2017. controls on root-rhizosphere respiration, New Phytol., 199, 339– Raich, J. W. and Schlesinger, W. H.: The global carbon dioxide flux 351, 2013. in soil respiration and its relationship to vegetation and climate, Hursh, A., Ballantyne, A., Cooper, L., Maneta, M., Kimball, J., and Tellus B, 44, 81–99, 1992. Watts, J.: The sensitivity of soil respiration to soil temperature, Raich, J. W., Potter, C. S., and Bhagawati, D.: Interannual variabil- moisture, and carbon supply at the global scale, Glob. Change ity in global soil respiration, 1980–94, Glob. Change Biol., 8, Biol., 23, 2090–2103, 2017. 800–812, 2002. Le Quéré, C., Andrew, R. M., Friedlingstein, P., Sitch, S., Pongratz, R Development Core Team: R: A language and environment for J., Manning, A. C., Korsbakken, J. I., Peters, G. P., Canadell, statistical computing. Version 3.5.3, available at: http://www. J. G., Jackson, R. B., Boden, T. A., Tans, P. P., Andrews, O. R-project.org/ (last access: 10 January 2020), 2019. D., Arora, V. K., Bakker, D. C. E., Barbero, L., Becker, M., Reichstein, M., Rey, A., Freibauer, A., Tenhunen, J. D., Valen- Betts, R. A., Bopp, L., Chevallier, F., Chini, L. P., Ciais, P., tini, R., Banza, J., Casals, P., Cheng, Y., Grünzweig, J. M., Cosca, C. E., Cross, J., Currie, K., Gasser, T., Harris, I., Hauck, Irvine, J., Joffre, R., Law, B. E., Loustau, D., Miglietta, F., J., Haverd, V., Houghton, R. A., Hunt, C. W., Hurtt, G., Ily- Oechel, W. C., Ourcival, J.-M., Pereira, J., Peressotti, A., Ponti, ina, T., Jain, A. K., Kato, E., Kautz, M., Keeling, R. F., Klein F., Qi, Y., Rambal, S., Rayment, M. B., Romanya, J., Rossi, Goldewijk, K., Körtzinger, A., Landschützer, P., Lefèvre, N., F., Tedeschi, V., Tirone, G., Xu, M., and Yakir, D.: Mod- Lenton, A., Lienert, S., Lima, I., Lombardozzi, D., Metzl, N., eling temporal and large-scale spatial variability of soil res- Millero, F., Monteiro, P. M. S., Munro, D. R., Nabel, J. E. M. piration from soil water availability, temperature and vege- S., Nakaoka, S., Nojiri, Y., Padin, X. A., Peregon, A., Pfeil, B., tation productivity indices, Global Biochem. Cy., 17, 1104, Pierrot, D., Poulter, B., Rehder, G., Reimer, J., Rödenbeck, C., https://doi.org/10.1029/2003GB002035, 2003. Schwinger, J., Séférian, R., Skjelvan, I., Stocker, B. D., Tian, H., Riveros-Iregui, D. A., Mcglynn, B. L., Emanuel, R. E., and Tilbrook, B., Tubiello, F. N., van der Laan-Luijkx, I. T., van der Epstein, H. E.: Complex Terrain Leads to Bidirectional Re- Werf, G. R., van Heuven, S., Viovy, N., Vuichard, N., Walker, sponses of Soil Respiration to Inter-Annual Water Availability, A. P., Watson, A. J., Wiltshire, A. J., Zaehle, S., and Zhu, D.: Glob. Change Biol., 18, 749–756, https://doi.org/10.1111/j.1365- Global Carbon Budget 2017, Earth Syst. Sci. Data, 10, 405–448, 2486.2011.02556.x, 2011. https://doi.org/10.5194/essd-10-405-2018, 2018. Rodeghiero, M. and Cescatti, A.: Spatial variability and optimal Lindeman, R. H., Merenda, P. F., and Gold, R. Z.: Introduction to bi- sampling strategy of soil respiration, Forest Ecol. Manag., 255, variate and multivariate analysis, Foresman and company, Glen- 106–112, 2008. view, IL, Scott, 1980. Rogers, K., Kelleway, J. J., Saintilan, N., Megonigal, J. P., Adams, Luo, Y. and Zhou, X.: Soil Respiration and the Environment, Else- J. B., Holmquist, J. R., Lu, M., Schile-Beers, L., Zawadzki, A., vier/Academic Press, Amsterdam, 2006. Mazumder, D., and Woodroffe, C. D.: Wetland carbon storage Luyssaert, S., Inglima, I., Jung, M., Richardson, A. D., Reichstein, controlled by millennial-scale variation in relative sea-level rise, M., Papale, D., Piao, S., Schulze, E.-D., Wingate, L., Matteucci, Nature, 567, 91–95, 2019. G., Aragão, L. E. O. C., Aubinet, M., Beer, C., Bernhofer, C., Ruehr, N. K., Knohl, A., and Buchmann, N.: Environmental vari- Black, K. G., Bonal, D., Bonnefond, J.-M., Chambers, J. L., ables controlling soil respiration on diurnal, seasonal and annual Ciais, P., Cook, B. D., Davis, K. J., Dolman, A. J., Gielen, B., time-scales in a mixed mountain forest in Switzerland, Biogeo- Goulden, M. L., Grace, J., Granier, A., Grelle, A., Griffis, T. chemistry, 98, 153–170, 2010. J., Grünwald, T., Guidolotti, G., Hanson, P. J., Harding, R. B., Saiz, G., Green, C., Butterbach-Bahl, K., Kiese, R., Avitabile, V., Hollinger, D. Y., Hutyra, L. R., Kolari, P., Kruijt, B., Kutsch, W. and Farrell, E. P.: Seasonal and spatial variability of soil respira- L., Lagergren, F., Laurila, T., Law, B. E., Le Maire, G., Lindroth, tion in four Sitka spruce stands, Plant Soil, 287, 161–176, 2006. A., Loustau, D., Malhi, Y., Mateus, J., Migliavacca, M., Misson, Sallenger, A., Doran, K., and Howd, P.: Hotspot of accelerated sea- L., Montagnani, L., Moncrieff, J. B., Moors, E. J., Munger, J. W., level rise on the Atlantic coast of North America, Nat. Clim. Nikinmaa, E., Ollinger, S. V., Pita, G., Rebmann, C., Roupsard, Change, 2, 884–888, 2012. O., Saigusa, N., Sanz, M. J., Seufert, G., Sierra, C. A., Smith, Schlesinger, W. H. and Andrews, J. A.: Soil respiration and the M.-L., Tang, J., Valentini, R., Vesala, T., and Janssens, I. A.: CO2 global carbon cycle, Biogeochemistry, 48, 7–20, 2000. balance of boreal, temperate, and tropical forests derived from a Schwendenmann, L. and Macinnis-Ng, C.: Soil CO2 efflux global database, Glob. Change Biol., 13, 2509–2537, 2007. in an old-growth southern conifer forest (Agathis australis) Misson, L., Gershenson, A., Tang, J., McKay, M., Cheng, W., and – magnitude, components and controls, SOIL, 2, 403–419, Goldstein, A. H.: Influences of canopy photosynthesis and sum- https://doi.org/10.5194/soil-2-403-2016, 2016. mer rain pulses on root dynamics and soil respiration in a young Sierra, C. A., Trumbore, S. E., Davidson, E. A., Vicca, S., and ponderosa pine forest, Tree Physiol., 26, 833–844, 2006. Janssens, I. A.: Sensitivity of decomposition rates of soil organic www.biogeosciences.net/17/771/2020/ Biogeosciences, 17, 771–780, 2020
780                               S. C. Pennington et al.: Localized basal area affects soil respiration temperature sensitivity

   matter with respect to simultaneous changes in temperature and        Suseela, V., Conant, R. T., Wallenstein, M. D., and Dukes, J. S.:
   moisture, J. Adv. Model. Earth Sy., 7, 335–356, 2015.                   Effects of soil moisture on the temperature sensitivity of het-
Søe, A. R. B. and Buchmann, N.: Spatial and temporal variations            erotrophic respiration vary seasonally in an old-field climate
   in soil respiration in relation to stand structure and soil parame-     change experiment, Glob. Change Biol., 18, 336–348, 2012.
   ters in an unmanaged beech forest, Tree Physiol., 25, 1427–1436,      Tang, J. and Baldocchi, D. D.: Spatial-temporal variation in soil res-
   2005.                                                                   piration in an oak-grass savanna ecosystem in California and its
Sprugel, D. G., Ryan, M. G., Brooks, J. R., Vogt, K. A., and Martin,       partitioning into autotrophic and heterotrophic components, Bio-
   T. A.: Respiration from the organ level to the stand, in: Resource      geochemistry, 73, 183–207, 2005.
   Physiology of Conifers, edited by: Smith, W. K. and Hinckley, T.      Vose, J. M. and Ryan, M. G.: Seasonal respiration of foliage, fine
   M., 255–299, Academic Press, San Diego, 1995.                           roots, and woody tissues in relation to growth, tissue N, and pho-
Stegen, J. C., Anderson, C. G., Bond-Lamberty, B., Crump, A. R.,           tosynthesis, Glob. Change Biol., 8, 182–193, 2002.
   Chen, X., and Hess, N.: Soil respiration across a permafrost          Wei, W., Weile, C., and Shaopeng, W.: Forest soil respiration and its
   transition zone: spatial structure and environmental correlates,        heterotrophic and autotrophic components: Global patterns and
   Biogeosciences, 14, 4341–4354, https://doi.org/10.5194/bg-14-           responses to temperature and precipitation, Soil Biol. Biochem.,
   4341-2017, 2017.                                                        42, 1236–1244, 2010.
Stone, E. L. and Kalisz, P. J.: On the maximum extent of tree roots,
   Forest Ecol. Manag., 46, 59–102, 1991.
Subke, J.-A., Inglima, I., and Cotrufo, M. F.: Trends and method-
   ological impacts in soil CO2 efflux partitioning: A metaanalyti-
   cal review, Glob. Change Biol., 12, 921–943, 2006.

Biogeosciences, 17, 771–780, 2020                                                                www.biogeosciences.net/17/771/2020/
You can also read