Parking in the Sydney CBD - An International Comparison Update NRMA
←
→
Page content transcription
If your browser does not render page correctly, please read the page content below
Parking in the Sydney CBD
An International Comparison Update
                                       NRMA
                                     12 May 2021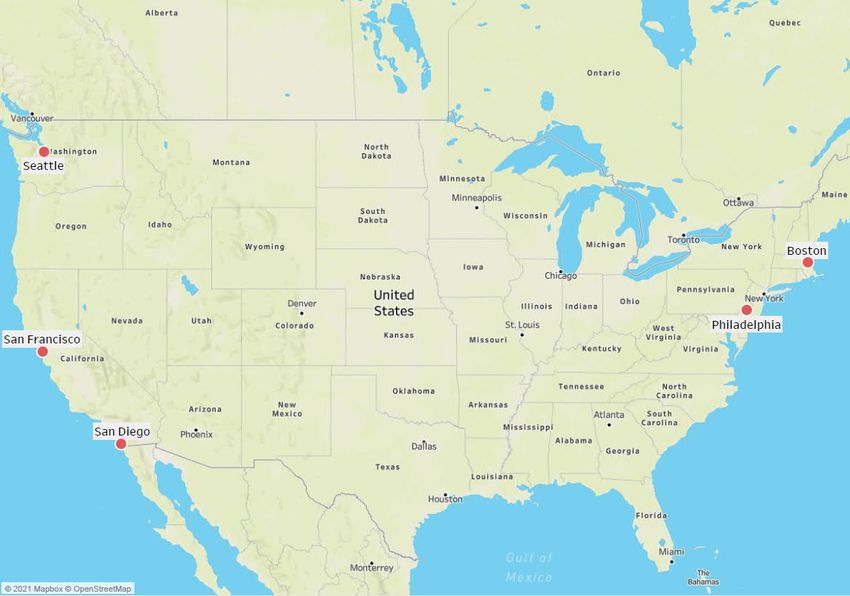
Gold Coast                                                                 Brisbane                                                      Sydney
Suite 26, 58 Riverwalk Avenue                              Level 2, 428 Upper Edward Street                     Studio 203, 3 Gladstone Street
Robina QLD 4226                                                  Spring Hill QLD 4000                                    Newtown NSW 2042
P: (07) 5562 5377                                                  P: (07) 3831 4442                                         P: (02) 9557 6202

W: www.bitziosconsulting.com.au                            E: admin@bitziosconsulting.com.au

Copyright in the information and data in this document is the property of Bitzios Consulting. This document and its information and data is for the
use of the authorised recipient and this document may not be used, copied or reproduced in whole or in part for any purpose other than for which
it was supplied by Bitzios Consulting. Bitzios Consulting makes no representation, undertakes no duty and accepts no responsibility to any third
party who may use or rely upon this document or its information and data.

Document Issue History
Report File Name                               Prepared      Reviewed         Issued        Date           Issued to
P5072.001R Parking in the Sydney CBD -         S. Daizli     D Bitzios /      D Bitzios     12/05/2021     Peter Khoury, NRMA
An International Comparison Update                           S. Brooke                                     Peter.Khoury@mynrma.com.au

                                     Parking in the Sydney CBD: An International Comparison Update
                                                      Project: P5072         Version: 001
                                                                                                                                                      ii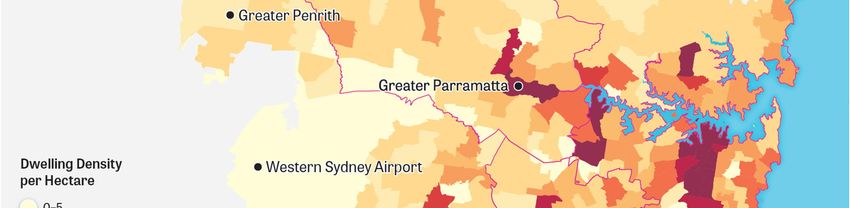
CONTENTS
                                                                                              Page
1.     INTRODUCTION                                                                             1
1.1    Background                                                                                1
1.2    Sydney’s Land Use Development and Motorisation                                            1
1.3    Cities for Comparison                                                                     3
2.     SELECTION OF CANDIDATE CITIES FOR COMPARISON                                             4
2.1    Overview                                                                                  4
2.2    Methodology                                                                               4
2.3    Candidate Cities                                                                          6
2.4    City Comparison Results                                                                   6
3.     PARKING CHARACTERISTICS                                                                 11
3.1    Sydney                                                                                   11
3.1.1 Availability                                                                              11
3.1.2 Policy                                                                                    11
3.2    Boston                                                                                   12
3.2.1 Availability                                                                              12
3.2.2 Policy                                                                                    12
3.3    Philadelphia                                                                             12
3.3.1 Availability                                                                              12
3.3.2 Policy                                                                                    13
3.4    San Diego                                                                                13
3.4.1 Availability                                                                              13
3.4.2 Policy                                                                                    13
3.5    San Francisco                                                                            14
3.5.1 Availability                                                                              14
3.5.2 Policy                                                                                    14
3.6    Seattle                                                                                  15
3.6.1 Availability                                                                              15
3.6.2 Policy                                                                                    15
3.7    Comparison                                                                               16
3.7.1 Parking Spaces                                                                            16
3.7.2 Parking, Population and Employment                                                        16
3.7.3 Parking Rates                                                                             17
3.7.4 Parking Management Strategies                                                             19
3.8    Parking Supply Discussion                                                                20
3.9    Ride Share                                                                               20
3.9.1 Boston                                                                                    20
3.9.2 Philadelphia                                                                              21
3.9.3 San Francisco                                                                             21
3.9.4 San Diego                                                                                 21
4.     PUBLIC TRANSPORT CHARACTERISTICS                                                        22
4.1    Journey to Work Mode Splits                                                              22
4.2    Sydney                                                                                   23
4.2.1 Network Description                                                                       23

                              Parking in the Sydney CBD: An International Comparison Update
                                             Project: P5072      Version: 001
                                                                                                     iii
4.1   Boston                                                                                                24
4.2   San Diego                                                                                             24
4.3   San Francisco                                                                                         24
4.4   Seattle                                                                                               25
4.5   Philadelphia                                                                                          25
4.6   Comparison                                                                                            25
5.    CONCLUSIONS                                                                                           27

Tables
Table 2.1:    Candidate Comparable Cities
Table 2.2:    Population and Land Area of Selected International Metropolitan Areas
Table 2.3:    Population of Cities, Ranked Smallest to Largest
Table 3.1:    Parking Spaces in the Sydney City Centre*
Table 3.2:    Available Parking in San Francisco
Table 3.3:    Comparison of Available Parking in Sydney CBD with International CBDs
Table 3.4:    Comparison of Parking, Population and Employment in Sydney CBD with International CBDs
Table 3.5:    Comparison of Casual Parking Rates
Table 3.6:    Comparison of Casual 2-Hour Off-Street vs On-street Parking Rates (USD)28,29
Table 3.7:    Comparison of Parking Management Strategies
Table 4.1:    Comparison of Public Transport Facilities

Figures
Figure 1.1: Trends in NSW Registered Vehicles and Driver Licences per 100,000 population
Figure 2.1: Map of Greater Sydney
Figure 2.2: Residential Density of Greater Sydney 2016
Figure 2.3: Graph of Population vs. Land Area for International Metropolitan Data
Figure 2.4: Map of Selected North American Cities
Figure 3.1:  One-Hour Parking Rate Change, Philadelphia City Centre
Figure 3.2: Number of Parking Spaces (Year of Survey Marked)
Figure 3.3: Comparison of Available Parking with Number of Employees
Figure 3.4: Comparison of Median Daily Parking Rates (USD)
Figure 5.1: Travel Mode Split of Trips to Work
Figure 5.2: Comparison of Parking Availability per Employee with Public Transport Mode Share for Journeys
            to Work
Figure 4.3: 2012 Unlinked Passenger Trips by Public Transport Mode

                              Parking in the Sydney CBD: An International Comparison Update
                                             Project: P5072      Version: 001
                                                                                                                 iv
1. INTRODUCTION
1.1           Background
In 2014, Bitzios Consulting was engaged by the NRMA to compare key parking characteristics of
Sydney with global cities (P1510 005R International Comparison- CBD Parking Study, dated 13
February). The purpose of that study was to analyse the impacts of removing large sections of public
on-street parking and loading zones in order to facilitate the CBD and South East Light Rail and
consequent changes to bus routes and through traffic routes.
The NRMA is aware that much of the contemporary comment on transport planning in large cities,
frequently mentions European cities (i.e. London, Paris, Vienna and Zurich) as good examples of
public transport providing viable alternatives to private car use. In such cities, it is argued that parking
is less important because motorists have many practical alternatives and so road space priority is
allocated to buses and service vehicles. Notwithstanding this, even these cities understand the
importance of convenient short stay on-street parking to the viability of small businesses. NRMA is
concerned, however, that Sydney is very different to European cities in that it has developed in
response to lower residential densities and higher rates of car ownership and motorisation. In this
sense, Sydney is more akin to similar sized cities in the USA.
Bitzios Consulting has been engaged by the NRMA to update the 2014 report using more recent
demographic and parking data.

1.2           Sydney’s Land Use Development and Motorisation
Prior to WWII, there was no comprehensive planning scheme for the Greater Sydney Metropolitan
Area. The County of Cumberland Planning Scheme was released in 1948 and gazetted in 1951. It
has been described as “the most definitive expression of a public policy of the form and content of an
Australian metropolitan area ever attempted”1. The scheme introduced land use zoning, suburban
employment zones, open space acquisitions and the idea of a ‘green belt’ for Greater Sydney. It
included the then Department of Main Roads plans for an expressway network and it enabled the
establishment of the Cumberland County Council in 1947, which was a tier of government between
local and state governments.
The green belt around established urban areas was intended to restrict urban sprawl and ‘satellite
towns’ beyond the green belt were intended to take care of future growth. However, a combination of
local council and state government agencies’ concerns about loss of planning control and developer
opposition meant that the Cumberland County Council was dissolved in 1963 and replaced by a State
Planning Authority. In 1965, the scheme’s grand objectives were abandoned, and thousands of
hectares of farming land were released for housing to cater for increased population resulting from
post-war immigration and the ‘baby boom’. Furthermore, there was pressure on the proposed
expressway land reservations, meaning that many of the ‘County’ roads never eventuated.

1
    The Dictionary of Sydney, https://dictionaryofsydney.org/entry/county_of_cumberland_planning_scheme

                                    Parking in the Sydney CBD: An International Comparison Update
                                                     Project: P5072      Version: 001
                                                                                                               1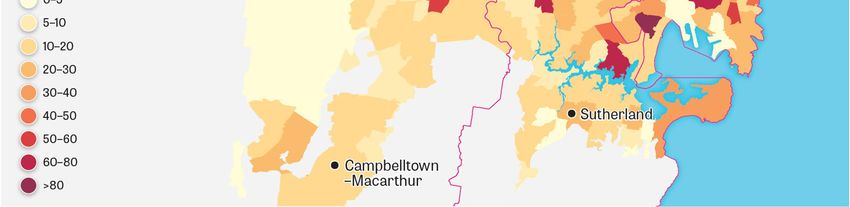
The rate of total motorisation in NSW continues to increase, but total passenger car motorisation has
decreased since 2005 as shown in Figure 1.1. No new major railway lines were built during that period
until the Epping to Chatswood Rail Link in 2009 and the Sydney Metro North West Line (between
Tallawong and Chatswood) in 2019. Since the abandonment of Sydney’s vast tramway network in
1961, the Inner West Light Rail Line (between Central and Wentworth Park) was built in 1997 and
extended to Lilyfield and Dulwich Hill in 2000 and 2014 respectively. The CBD and South East Light
Rail Line to Randwick and Kingsford was built in 2019 and 2020 respectively.
Hence, there was considerable urban sprawl in the Sydney Metropolitan Area and increasing pressure
on the arterial road network. Employment tended to be concentrated in the Sydney and North Sydney
CBDs until other major urban centres like Parramatta and Macquarie Park were developed, as well
as intermediate urban centres like Liverpool and Norwest.
There have been a number of emerging trends which have affected on-street parking, particularly in
the Sydney CBD and surrounding inner city areas. These trends are primarily aimed at reducing
congestion and promoting cheaper, more convenient and sustainable alternatives to private car use,
namely car share and ride share services. Local planning controls will increase the number of car
share parking spaces provided in new commercial and residential developments2.
Accordingly, car use across the Sydney metropolitan area is relatively high.

Sources: Transport for NSW 3, 4, 5 and ABS   6

Figure 1.1:Trends in NSW Registered Vehicles and Driver Licences per 100,000 population

2
  City of Sydney, https://www.cityofsydney.nsw.gov.au/public-health-safety-programs/car-share
3
  Transport for NSW, https://www.rms.nsw.gov.au/about/corporate-publications/statistics/registrationandlicensing/tables/table111.html
4
  Transport for NSW, https://www.rms.nsw.gov.au/about/corporate-publications/statistics/registrationandlicensing/tables/table211.html
5
  Transport for NSW, https://roadsafety.transport.nsw.gov.au/statistics/interactivecrashstats/nsw.html?tabnsw=5
6
  Australian Bureau of Statistics, ABS TABLE 4. Estimated Resident Population, States and Territories (Number)

                                   Parking in the Sydney CBD: An International Comparison Update
                                                    Project: P5072        Version: 001
                                                                                                                                        2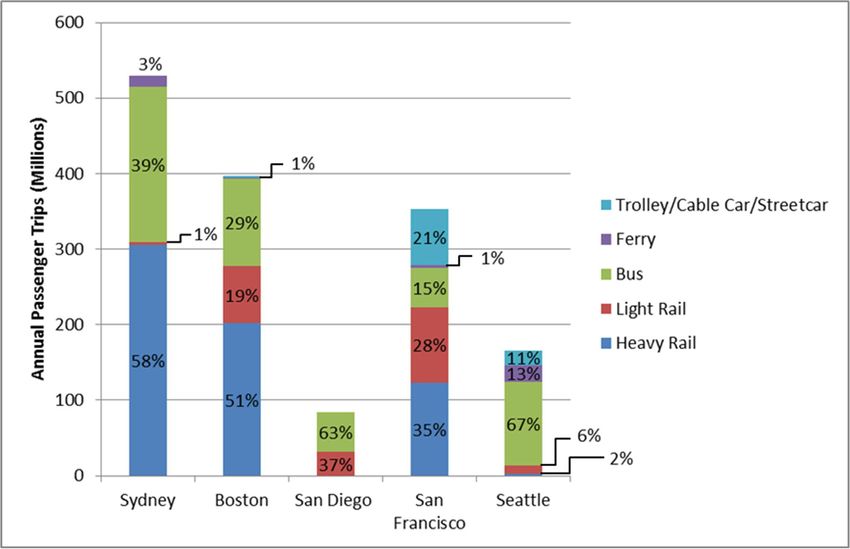
1.3     Cities for Comparison
As explained in Section 2, this report compares the availability of on-street and off-street parking in
Sydney, with the same types of parking in the following US cities:
§   Boston, Massachusetts
§   Philadelphia, Pennsylvania
§   San Diego, California
§   San Francisco, California
§   Seattle, Washington.
The report also includes information on transport, car share and ride share facilities and policies in
each of the comparison cities.

                            Parking in the Sydney CBD: An International Comparison Update
                                           Project: P5072      Version: 001
                                                                                                          3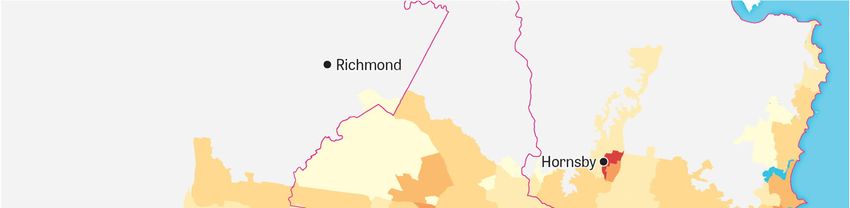
2. SELECTION OF CANDIDATE CITIES FOR
COMPARISON
2.1 Overview
A preliminary study was conducted to assess candidate cities in North America for inclusion in the
benchmarking study. The nominated cities displayed similar development characteristics (stemming
from geographical constraints), as well as comparable population size and land area of their
respective metropolitan areas.
2.2 Methodology
A survey of major North American cities identified 27 candidate cities: 24 located in the United States
mainland and three in Canada. A comparison was then carried out upon the metropolitan area
associated with each city. The metropolitan area is a representation of the labour market for the city,
often encompassing multiple, smaller cities as well as the core city. For example, in Australia, the
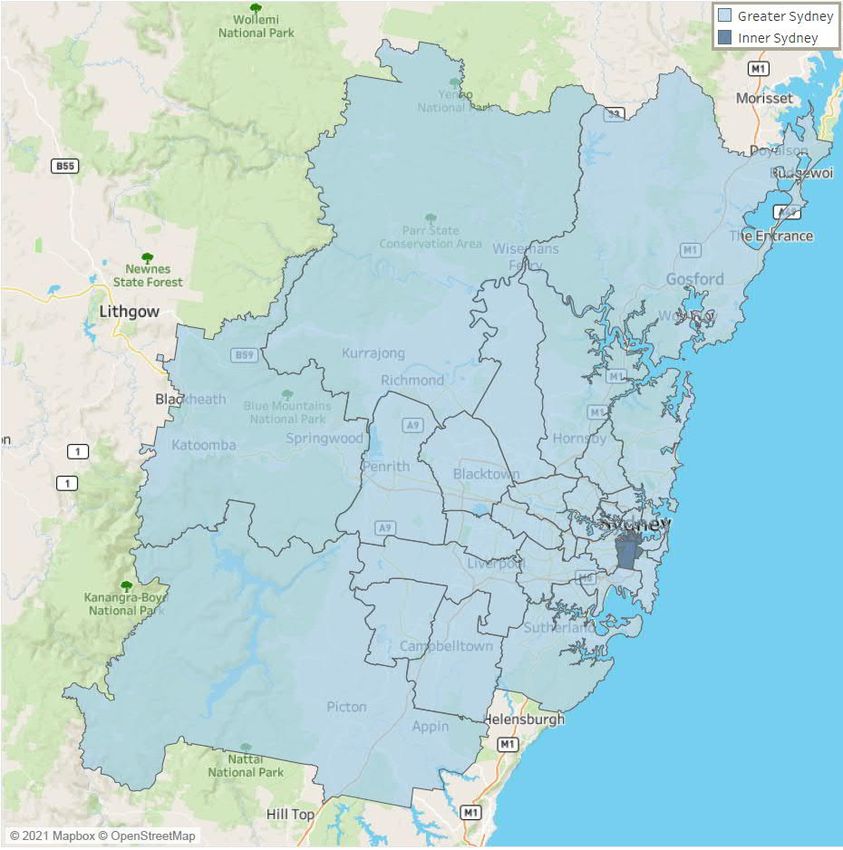
Sydney Metropolitan Area, known as ‘Greater Sydney’, extends well beyond Sydney City itself,
incorporating the Central Coast to the north and the Blue Mountains to the west as shown in Figure
2.1. Figure 2.2 shows that the greater Sydney area includes:
§ High density development within the Inner Sydney, North Sydney and Parramatta regions
§ Low to medium density in the outer suburbs
§ Large expanses of very low density (largely national parks).
In this preliminary study, metropolitan areas were selected from the following:
§ Australia: Greater Capital City Statistical Area7
§ United States: Metropolitan Area (Core Based Statistical Area)8
§ Canada: Census Metropolitan Area9.
The population and land area characteristics of each metropolitan area were compared with those of
Greater Sydney. Population counts were taken from the most recent censuses conducted in Australia
(2016), Canada (2016) and the US (2019 estimates in the absence of recent census data).
7
Australian Bureau of Statistics (2020), Australian Statistical Geography Standard
8
United States Census Bureau, https://www.census.gov/data/tables/time-series/demo/popest/2010s-total-metro-and-micro-statistical-
areas.html
9
Statistics Canada, https://www12.statcan.gc.ca/census-recensement/2016/dp-pd/prof/index.cfm?Lang=E
Parking in the Sydney CBD: An International Comparison Update
Project: P5072 Version: 001
4
Source: Australian Bureau of Statistics (2020), Australian Statistical Geography Standard

Figure 2.1:Map of Greater Sydney

                                   Parking in the Sydney CBD: An International Comparison Update
                                                     Project: P5072       Version: 001
                                                                                                   5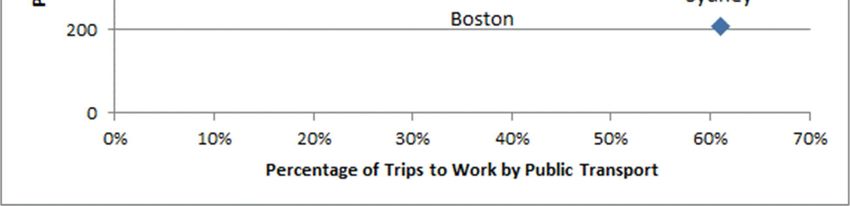
Source: https://www.greater.sydney/metropolis-of-three-cities/past-present-and-future

Figure 2.2:Residential Density of Greater Sydney 2016

2.3        Candidate Cities
The cities considered initially as being comparable to Sydney are listed in Table 2.1.
Table 2.1: Candidate Comparable Cities
United States                                                                            Canada
§   Austin, Texas                           §   Indianapolis City, Indiana               § Ottawa, Ontario
§   Baltimore, Maryland                     §   Kansas City, Missouri                    § Toronto, Ontario
§   Boston, Massachusetts                   §   Miami, Florida                           § Vancouver, British Columbia
§   Charleston, South Carolina              §   Minneapolis, Minnesota
§   Charlotte, North Carolina               §   Orlando, Florida
§   Cincinnati, Ohio                        §   Philadelphia, Pennsylvania
§   Cleveland, Ohio                         §   Phoenix, Arizona
§   Columbia, South Carolina                §   Pittsburgh, Pennsylvania
§   Dallas, Texas                           §   Raleigh, North Carolina
§   Denver, Colorado                        §   San Diego, California
§   Detroit, Michigan                       §   San Francisco, California
§   Houston, Texas                          §   Seattle, Washington

2.4        City Comparison Results
Table 2.2 shows the metropolitan population and land area associated with each candidate city.

                                   Parking in the Sydney CBD: An International Comparison Update
                                                    Project: P5072        Version: 001
                                                                                                                         6
Table 2.2: Population and Land Area of Selected International Metropolitan Areas
Population
Land Area
City Metropolitan Area Population Density
(km2)
(per km2)
Sydney, NSW Greater Sydney 4,823,991 12,367.70 390
United States
Atlanta, GA Atlanta-Sandy Springs-Alpharetta, GA 6,020,364 22,496.38 268
Austin, TX Austin-Round Rock-Georgetown, TX 2,227,083 10,929.46 204
Baltimore, MD Baltimore-Columbia-Towson, MD 2,800,053 6,737.80 416
Boston, MA Boston-Cambridge-Newton, MA-NH 4,873,019 9,032.38 540
Charleston, SC Charleston-North Charleston, SC 802,122 6,703.36 120
Charlotte, NC Charlotte-Concord-Gastonia, NC-SC 2,636,883 13,122.69 201
Cincinnati, OH Cincinnati, OH-KY-IN 2,221,208 10,796.83 206
Cleveland, OH Cleveland-Elyria, OH 2,048,449 5,172.98 396
Columbia, SC Columbia, SC 838,433 9,590.08 87
Dallas, TX Dallas-Fort Worth-Arlington, TX 7,573,136 24,029.37 315
Denver, CO Denver-Aurora-Lakewood, CO 2,967,239 21,616.22 137
Detroit, MI Detroit-Warren-Dearborn, MI 4,319,629 10,070.88 429
Houston, TX Houston-The Woodlands-Sugar Land, TX 7,066,141 21,388.80 330
Indianapolis City, IN Indianapolis-Carmel-Anderson, IN 2,074,537 11,153.50 186
Kansas City, MO Kansas City, MO-KS 2,157,990 18,791.92 115
Miami, FL Miami-Fort Lauderdale-Pompano Beach, FL 6,166,488 13,150.07 469
Minneapolis, MN Minneapolis-St. Paul-Bloomington, MN-WI 3,640,043 19,779.82 184
Orlando, FL Orlando-Kissimmee-Sanford, FL 2,608,147 9,009.22 289
Philadelphia-Camden-Wilmington, PA-NJ-
Philadelphia, PA 6,102,434 11,919.41 512
DE-MD
Phoenix, AZ Phoenix-Mesa-Chandler, AZ 4,948,203 37,725.12 131
Pittsburgh, PA Pittsburgh, PA 2,317,600 13,678.94 169
Raleigh, NC Raleigh-Cary, NC 1,390,785 5,486.11 254
San Diego, CA San Diego-Chula Vista-Carlsbad, CA 3,338,330 10,895.12 306
San Francisco, CA San Francisco-Oakland-Berkeley, CA 4,731,803 6,398.70 739
Seattle, WA Seattle-Tacoma-Bellevue, WA 3,979,845 15,209.32 262
Canada
Ottawa, ON Ottawa-Gatineau (Ontario-Quebec) 1,323,783 6,287.03 211
Toronto, ON Toronto (Ontario) 5,928,040 5,905.71 1,004
Vancouver, BC Vancouver (British Columbia) 2,463,431 2,882.55 855
Table 2.3 ranks each city by population of metropolitan area. Cities with a similar population10 to
Sydney include:
§ Minneapolis, MN § San Francisco, CA § Toronto, ON
10
±25% variance from the population of Greater Sydney.
Parking in the Sydney CBD: An International Comparison Update
Project: P5072 Version: 001
7§ Seattle, WA § Boston, MA § Atlanta, GA
§ Detroit, MI § Phoenix, AZ
Table 2.3: Population of Cities, Ranked Smallest to Largest
Rank City Population % Variation from Sydney
1 Charleston, SC 802,122 -83.4%
2 Columbia, SC 838,433 -82.6%
3 Ottawa, ON 1,323,783 -72.6%
4 Raleigh, NC 1,390,785 -71.2%
5 Cleveland, OH 2,048,449 -57.5%
6 Indianapolis City, IN 2,074,537 -57.0%
7 Kansas City, MO 2,157,990 -55.3%
8 Cincinnati, OH 2,221,208 -54.0%
9 Austin, TX 2,227,083 -53.8%
10 Pittsburgh, PA 2,317,600 -52.0%
11 Vancouver, BC 2,463,431 -48.9%
12 Orlando, FL 2,608,147 -45.9%
13 Charlotte, NC 2,636,883 -45.3%
14 Baltimore, MD 2,800,053 -42.0%
15 Denver, CO 2,967,239 -38.5%
16 San Diego, CA 3,338,330 -30.8%
17 Minneapolis, MN 3,640,043 -24.5%
18 Seattle, WA 3,979,845 -17.5%
19 Detroit, MI 4,319,629 -10.5%
20 San Francisco, CA 4,731,803 -1.9%
21 Sydney, NSW 4,823,991 -
22 Boston, MA 4,873,019 1.0%
23 Phoenix, AZ 4,948,203 2.6%
24 Toronto, ON 5,928,040 22.9%
25 Atlanta, GA 6,020,364 24.8%
26 Philadelphia, PA 6,102,434 26.5%
27 Miami, FL 6,166,488 27.8%
28 Houston, TX 7,066,141 46.5%
29 Dallas, TX 7,573,136 57.0%
Parking in the Sydney CBD: An International Comparison Update
Project: P5072 Version: 001
8Figure 2.3:Graph of Population vs. Land Area for International Metropolitan Data
Based on Figure 2.3, the following cities displayed similar characteristics to Sydney:
§ Boston
§ Detroit
§ Philadelphia
§ San Francisco
§ Seattle
§ Toronto.
Detroit and Toronto were subsequently excluded from the study due to economic factors and lack of
available data, respectively.
These remaining four cities (Boston, Philadelphia, San Francisco and Seattle) are located on a
coastline or lakeside as shown in Figure 2.4. As such, they exhibit similar constrained development
patterns to Sydney.
Parking in the Sydney CBD: An International Comparison Update
Project: P5072 Version: 001
9Figure 2.4:Map of Selected North American Cities
Parking in the Sydney CBD: An International Comparison Update
Project: P5072 Version: 001
103. PARKING CHARACTERISTICS
3.1 Sydney
3.1.1 Availability
Table 3.1 summarises the total floor area, and number of employees (both full and part-time) and
tenant parking spaces in the Sydney City Centre in 2007, 2012 and 201711.
Table 3.1: Parking Spaces in the Sydney City Centre*
Total Floor Area Tenant Parking Spaces
Survey Year Employees
(km2) Internal External (onsite) Total
2007 19.17 283,419 37,990 2,092 40,082
2012 19.73 315,144 40,896 1,911 42,807
2017 20.85 375,032 43,322 2,102 45,424
*Includes the CBD and Harbour, Chinatown and CBD South, and Harris Street Villages.
It is also worth noting that:
§ There are approximately 8.2 employees per parking spaces (excluding on-street parking) within
the City Centre
§ There are a total of 160,000 parking spaces in the Sydney Local Government Area (LGA), or
about 1.75 spaces for every vehicle registered. This is compared with the Sydney average of over
three parking spaces per vehicle12
§ Approximately half of the on-street spaces in Central Sydney are designated as loading zones for
some portion of the day. The City of Sydney has estimated that there is just one parking space
available for every six workers in the area13.
Parking in Central Sydney is both restricted and relatively expensive. This is partially due to the NSW
Government Parking Space Levy of $2,490 per annum, which equates to a cost of approximately
$9.50 per off-street space per weekday.
3.1.2 Policy
The City of Sydney has identified several key objectives for parking in Central Sydney, including:
§ Reduce the provision of new parking spaces by 50% by 2030
§ Continued prioritisation of on-street parking for service/delivery vehicles, taxis and disabled
persons and adjustment of on-street parking rates to approach off-street rates
§ Target 30% of city residents who drive are members of a car share scheme14
§ Promotion of sustainable commercial parking facilities. This may involve reduced access during
the morning peak or provision of bicycle spaces or electric vehicle recharging points.
The City has sought to limit the provision of new parking spaces. It has enforced maximum rather
than minimum rates for parking in new developments since 1995.
The City of Sydney LGA currently has over 50,000 registered car share members. Since 2008, over
850 on-street car sharing spaces have been installed, with additional spaces off street and in the
11
City of Sydney (2017), Floor Space and Employment Survey
12
City of Sydney (2012), Connecting Our City Summary Report
13
City of Sydney (2012), Connecting Our City Technical Report
14
City of Sydney (2018), Environmental Action Strategy and Action Plan
Parking in the Sydney CBD: An International Comparison Update
Project: P5072 Version: 001
11peer-to-peer network. Four operators, Car Next Door, Flexicar, GoGet and Popcar, are helping more
than a third of local households to go car free as of 2016, up from 29% a decade earlier15.
3.2 Boston
3.2.1 Availability
In this study, the Boston CBD included the Downtown neighbourhood in an inventory of off-street
parking spaces. This is detailed in Future of Parking in Boston (2016)16, a research report on existing
parking conditions in Boston. The survey found that there were 77,800 parking spaces in the Boston
CBD and approximately two employees per parking space.
3.2.2 Policy
The report also proposed strategies to reduce future parking demand in Boston, such as:
§ Expanding the annual $10 per space fee of off-street parking in South Boston to all new
development citywide, starting with the Downtown Parking Freeze Area
§ Endorsing a transit-oriented maximum parking requirement in base zoning
§ Eliminating minimum parking requirements citywide.
Metered on-street spaces allow parking for a maximum of two hours. However, they are significantly
cheaper than commercially-owned off-street car parks, charging between $1.25 and $3.75 an hour.
Many loading zones throughout the city restrict parking to 30 minutes for active loading and are only
available to vehicles registered for commercial purposes.
In 2015, the City of Boston launched DriveBoston, which offered residents an alternative to personal
vehicle ownership by providing dedicated parking spaces in municipal lots and on-street for car share
vehicles. The pilot program licenced 80 public parking spaces to operate vehicle sharing services.
During the initial 18-month pilot phase:
§ More than one million miles were travelled
§ Vehicles were used on average seven hours a day, compared to the average of one hour a day
privately-owned cars are used
§ There was an average of 23 users per vehicle.
As a result of the positive outcomes of the pilot program, in 2019, the City of Boston rebranded the
program to Car Share Boston and increased the number of parking spaces to up to 250. They also
partnered with Zipcar and Getaround to provide car sharing services, with new locations added in
202017.
3.3 Philadelphia
3.3.1 Availability
2015 parking inventory recorded 46,400 off-street public parking spaces in Philadelphia City Centre,
and an estimated 3,700 on-street parking spaces. These figures exclude off-street private parking in
buildings.
15
NIEIR (2019), City of Sydney: Number of cars per household. Based on ABS Census data.
16
A Better City (November 2016), Future of Parking in Boston
17
City of Boston, https://www.boston.gov/departments/transportation/car-share-
boston#:~:text=Car%20Share%20Boston%20is%20a,to%20participate%20in%20the%20program.
Parking in the Sydney CBD: An International Comparison Update
Project: P5072 Version: 001
123.3.2 Policy
The City introduced a new zoning code in 2012 which reduce the minimum requirements on
development parking. These included:
§ Reducing the minimum requirement for residential units from 1 per unit to 3 per 10 units
§ No minimum requirements for office, retail and commercial uses.
The City also raised the parking tax in July 2015 from 20% to 22.5%. Parking rates for public (off-
street) parking facilities have also increased as shown in Figure 3.1. Despite these increases, there
has not been a comparative decrease in occupancy, which may be due to the lack of alternative such
as on-street (long-stay) or convenient public transport connections18.
Zipcar currently operates car share services in partnership with the City. Quick search identified over
100 available car share vehicles in the city centre.
Enterprise Car share suspended its car share operations in June 2020, which is likely due to the
downturn in demand through COVID-19.
Figure 3.1: One-Hour Parking Rate Change, Philadelphia City Centre
3.4 San Diego
3.4.1 Availability
Downtown San Diego has approximately 63,00019 parking spaces, including around 7,614 on-street
parking spaces. 507 of these are short-term parking spaces. There are also approximately 1,300
loading spaces and 190 motorcycle spaces.
In 2010, there was an estimated surplus of over 16,000 parking spaces during the day on weekdays,
but conservative estimates suggested that there would be a deficit of over 4,700 spaces by 201520.
3.4.2 Policy
Most parking meters are enforced from 8am to 6pm Monday to Saturday. However, the
Comprehensive Parking Plan for Downtown San Diego recommended altering these hours to 10am
18 2015 Philadelphia City Centre Parking Inventory.
19
Downtown Community Parking District Implementation Plan (2017)
20
Wilson & Co., Wilbur Smith Associates 2008 (2009), Comprehensive Parking Plan for Downtown San Diego
Parking in the Sydney CBD: An International Comparison Update
Project: P5072 Version: 001
13to 8pm to encourage drivers to make use of plentiful off-street parking facilities. The plan also notes
that the optimal on-street parking utilisation should be set at 85%.
San Diego continues to specify minimum parking provisions for new developments, except in the case
of industrial developments21.
San Diego’s Mobility Choices Regulations provide reward points of 2 per unit for providing car share
parking spaces in new developments as part of reducing citywide vehicle miles travelled 22.
3.5 San Francisco
3.5.1 Availability
In this study, the San Francisco CBD included three districts on the city’s north-eastern edge: Civic
Center-Downtown, Russian Hill-Nob Hill and North Embarcardero, totalling approximately 10km2.
On-street parking data was sourced from an inventory undertaken between 2008 and 201423, and off-
street parking data from an inventory undertaken by the San Francisco Municipal Transportation
Agency (SFMTA) in 2010 (the latter in the absence of more recent data). There were approximately
24,635 on-street parking spaces and 59,600 off-street parking spaces in the San Francisco CBD. Of
the off-street spaces, approximately 4,200 (7%) were for employee or company vehicles only24.
Table 3.2: Available Parking in San Francisco
District On-street Spaces Off-street Spaces Total spaces
Civic Center - Downtown 7,348 34,433 41,781
Russian Hill - Nob Hill 10,517 12,203 22,720
North Embarcardero 6,008 12,948 18,956
Total 23,873 59,584 83,457
3.5.2 Policy
The SFMTA Strategic Plan (2018)25 was established in response to significant changes in travel
patterns throughout the city, a growing population and public expectations. It has four strategic goals,
aimed at operating, maintaining, and facilitating a safe, equitable, and sustainable transportation
system:
1. Create a safer transportation experience for everyone
2. Make transit and other sustainable modes of transportation the most attractive and preferred
means of travel
3. Improve the quality of life and environment in San Francisco and the region
4. Create a workplace that delivers outstanding service.
Between 2011 and 2013, the SFMTA conducted a pilot program into a demand-based pricing scheme
named SFpark in 7,000 of San Francisco’s 28,800 metered on-street parking spaces and 12,250
parking spaces in 15 of 20 city-owned garages. Their utilisation was monitored in real-time and prices
adjusted by small increments monthly to encourage drivers to park in underutilised areas26.
The SFpark demand-responsive pricing pilot program found that:
21
City of San Diego (2009), San Diego Municipal Code
22 The City of San Diego, https://www.sandiego.gov/sites/default/files/4-appendix-t-mobility-choices-implementation-guidelines.pdf
23
City and County of San Francisco (2019), https://data.sfgov.org/Transportation/Map-of-On-Street-Parking-based-on-Parking-
Census/w7jc-w57c (last updated 4 May 2021)
24
San Francisco Municipal Transportation Agency (September 2011), San Francisco Municipal Transportation Agency Parking Census
25
San Francisco Municipal Transportation Agency (April 2018), San Francisco Municipal Transportation Strategic Plan
26
San Francisco Municipal Transportation Agency, https://www.sfmta.com/projects/sfpark-pilot-program
Parking in the Sydney CBD: An International Comparison Update
Project: P5072 Version: 001
14§ Sales tax revenues rose over 35% in SFpark areas during the compared to less than 20% in the
other parts of the city
§ Average meter rates were reduced by 4% (down $0.11/hour) in SFpark on-street areas. City-
owned garage rates went down by 12% (down $0.42/hour)
§ Reported parking search time went down by 43%
§ Reduced circling for parking led to a 30% decrease in miles travelled in SFpark areas, benefiting
safety, easing congestion and reducing neighbourhood pollution.
In December 2017, the SFMTA subsequently expanded demand-responsive pricing to all 28,800
metered on-street spaces and all SFMTA-metered surface parking lots. The meter prices adjust by
25 cents an hour as needed based on demand and will occur once every three months27.
SFMTA’s On-Street Shared Vehicle Permit Program permits for kerbside parking spaces to be
dedicated to shared vehicle use; a key goal of the SFMTA’s 2013-2018 Strategic Plan. The program
was approved in July 2017 after it was tested as a pilot project starting in 2013.
There are currently five car share providers in San Francisco: Zipcar, Getaround, U-Haul (24/7 self-
service vans), Truqit (24/7 self-service pick-up trucks) and GIG.
3.6 Seattle
3.6.1 Availability
Downtown Seattle has approximately 48,960 car parking spaces, including 4,490 on-street parking
spaces28.
With approximately 348,000 jobs based in Downtown Seattle, there is one parking space for every
seven workers.
3.6.2 Policy
The Seattle Department of Transport (SDOT) has adopted a Performance-Based Parking Pricing
Program with an aim to achieve 1-2 spaces available per block (i.e. a target 70-85% occupancy).
The SDOT provided a real-time electronic parking guidance scheme for off-street car parking in the
downtown area, but these were turned-off in July 2020 due to reduced funding as a result of COVID-
19.
As part of the City’s COVID-19 response, SDOT introduced Priority Pickup Zones, including 5-minute
loading zones and 3-minute Food Priority Pick-up Zones to cater for the increased demand for food
and parcel deliveries.
Car sharing was launched in Seattle in late 2012 and at one stage had three operators providing
these services. By the end of 2019, all three operators had pulled out of the Seattle market. One
operator blamed “the volatile state of the global mobility landscape” and difficulty navigating
complicated infrastructure challenges unique to North American transportation29. In 2020, GIG Car
Share Services reintroduced the car sharing service with 250 Toyota Prius hybrid vehicles.
The City designated on-street parking for car sharing vehicles, with operators required to pay a permit
fee of:
§ $300 per year (unpaid parking space)
§ $3,000 per year (paid parking space)
27
San Francisco Municipal Transportation Agency (5 December 2017), https://www.sfmta.com/blog/san-francisco-adopts-demand-
responsive-pricing-program-make-parking-easier
28
Seattle DoT Curbside Management team 2019 Annual Report
29 https://www.geekwire.com/2019/car2gone-share-now-shuts-north-america-leaving-seattle-no-free-floating-car-sharing-services/
Parking in the Sydney CBD: An International Comparison Update
Project: P5072 Version: 001
153.7 Comparison
3.7.1 Parking Spaces
Table 3.3 and Figure 3.2 compare the volume of available parking within the Sydney CBD with
downtown districts in Boston, Philadelphia, San Diego, San Francisco and Seattle.
Table 3.3: Comparison of Available Parking in Sydney CBD with International CBDs
City On-street Spaces Off-street Spaces Total Spaces
Sydney, NSW N/A 45,424 -
Boston, MA N/A 77,800 -
Philadelphia, PA 3,700 46,400 50,100
San Diego, CA 8,104 54,896 63,000
San Francisco, CA 24,635 59,600 84,235
Seattle, WA 4,490 44,470 48,960
Figure 3.2:Number of Parking Spaces (Year of Survey Marked)
3.7.2 Parking, Population and Employment
Table 3.4 compares the total available parking availability with the metropolitan population,
metropolitan density and number of spaces available per employee within the CBD.
The number of people employed within the Sydney CBD was sourced from the 2016 ABS Census30
and the number of people employed US CBDs was estimated using 2018 ZIP Code Business Patterns
from US Census data31. It should be noted that ZIP code areas do not correspond exactly with the
30
Australian Bureau of Statistics, Census of Population and Housing, 2016, TableBuilder
31
United States Census Bureau, https://onthemap.ces.census.gov/
Parking in the Sydney CBD: An International Comparison Update
Project: P5072 Version: 001
16study area used to estimate parking availability. The Sydney CBD area examined in this study is
geographically large compared to the comparison cities. As such, there is some disparity in the
number of employees.
Table 3.4: Comparison of Parking, Population and Employment in Sydney CBD with
International CBDs
Metropolitan
Total Metropolitan Spaces per 1,000
City Population Density Employees
Spaces Population Employees
(per km2)
Sydney, NSW 45,424 4,823,991 390.05 320,829 142
Boston, MA 77,800 4,873,019 539.51 305,487 255
Philadelphia, PA 48,960 6,102,434 511.97 225,364 217
San Diego, CA 50,100 3,338,330 306.41 92,378 542
San Francisco, CA 63,000 4,731,803 739.49 350,327 180
Seattle, WA 84,235 3,979,845 261.67 221,706 380
Figure 3.3:Comparison of Available Parking with Number of Employees
3.7.3 Parking Rates
Drivers in the Sydney CBD also pay substantially more for publicly accessible off-street parking than
in North American cities, which may contribute to a higher reliance on public transport for everyday
commuting. However, employees in the Sydney CBD are likely to make use of discounted early bird
parking rates, which offer daily parking at approximately one third of the casual rate. Parking rates
Parking in the Sydney CBD: An International Comparison Update
Project: P5072 Version: 001
17also vary by location, with drivers in the northern end of the CBD around The Rocks paying higher
rates than those in the southern end around the City Centre and Darling Harbour.
Table 3.5 compares the median daily and monthly parking rates within the Sydney CBD with
downtown districts in Boston, Philadelphia, San Diego, San Francisco and Seattle.
Table 3.5: Comparison of Casual Parking Rates32
Median Monthly Unreserved
City Median Daily Parking Rate (USD)
Parking Rate (USD)
Sydney, NSW33 $46.00 N/A
Boston, MA $33.71 $337
Philadelphia, PA $24.90 $258
San Diego, CA $19.95 $138
San Francisco, CA $27.06 $297
Seattle, WA $23.16 $231
Figure 3.4:Comparison of Median Daily Parking Rates (USD)
32
Parkopedia_ North American Parking Index 2019
33
Parkopedia_Global Parking Index 2019
Parking in the Sydney CBD: An International Comparison Update
Project: P5072 Version: 001
18Casual two-hour parking in off-street facilities is significantly more expensive than on-street parking,
as presented in Table 3.6. Parkopedia Global Parking Index Report (2019) noted that this trend is
reversed in a number of European cities (i.e. Amsterdam, London, Paris) which are likely to reflect
travel demand management policies.
Table 3.6: Comparison of Casual 2-Hour Off-Street vs On-street Parking Rates (USD)28,29
Casual 2-Hour Parking
Casual 2-Hour Parking Rate % Difference
City Rate
Off-street (USD) Off vs On
On-street (USD)
Sydney, NSW $27.37 $11.86 130%
Boston, MA $20.63 $3.51 488%
Philadelphia, PA $16.55 $4.99 232%
San Diego, CA $11.81 $2.38 396%
San Francisco, CA $12.35 $5.33 132%
Seattle, WA $9.65 $6.35 52%
3.7.4 Parking Management Strategies
Table 3.7 compares different parking management strategies within the Sydney CBD with downtown
districts in Boston, Philadelphia, San Diego, San Francisco and Seattle.
Table 3.7: Comparison of Parking Management Strategies
San San
Strategy Sydney Boston Philadelphia Seattle
Diego Francisco
Reduce new parking provisions
Prioritise service vehicles
Increase on-street parking rates
Restrict access to commercial
car parks in morning peak
Promote car share services
Demand Responsive Parking
Pricing
Supply real-time parking
availability data
Light rail
Expand public Bus (priority
transport bus corridors)
capacity in CBD
Bus Rapid
Transit
Parking in the Sydney CBD: An International Comparison Update
Project: P5072 Version: 001
193.8 Parking Supply Discussion
In terms of overall parking supply, it can be seen from Table 3.4 and Figure 3.3 that Sydney compares
reasonably with Philadelphia, San Diego and San Francisco. Boston and Seattle appear to have a
much larger parking supply, but this is consistent with a much lower proportion of work trips by public
transport as explained further in Section 4.
Whilst it might be argued that on-street parking provides the greatest convenience for short term users
(i.e. shopping or business meetings), these types of drivers often engage in ‘hunting’ behaviour while
seeking a space and this leads to ‘around the block’ manoeuvres and additional congestion at
intersections. In turn, the additional congestion adversely impacts ‘essential’ vehicles such as buses,
taxis and couriers. The SFMTA has sought to address this issue through its demand-based pricing
scheme throughout San Francisco.
The City of Sydney has gradually adjusted on-street parking prices to match off-street prices (except
perhaps in premium parking precincts) and it is understood from the CBD Access Strategy that there
is spare daytime capacity of 10-30% of total off-street supply. Therefore, it could be argued that
motorists seeking short term spaces should be using the available off-street parking supply.
In the relatively narrow streets of the Sydney CBD, it will be important to allocate the limited kerbside
space to essential activities. These include bus stops, taxi zones, loading zones, car share zones and
turning lanes at intersections. Outside business hours, some loading zones may be released for short-
term (2 or 4 hour) parking.
3.9 Ride Share
Ride sharing is relatively new to Australia and Sydney compared to the US and European markets.
In 2015, the NSW Government moved to regulate ride sharing.
In 2019, the NSW Minister for Transport and Roads announced a review of the “point to point”
transport industry, which was completed in March 2020. While independent review34, which is
currently being considered by government, consider “access to road and kerbside infrastructure”. The
key differentiation being that the point-to-point transport reforms:
§ Maintained taxis’ exclusive rights to provide rank and hail services, as set out in the NSW Road
Rules, whereas
§ Ride share vehicles are not permitted to stand or park the hire vehicle for hire on any road or road
related area or use the hire vehicle to carry out a hiring other than for a booking made before the
driver stops the vehicle at the place where the passenger is picked up, or stop, stand or queue in
a taxi zone.
The review recommended that access to kerbside space needs further consideration and that all
point-to-point transport customers should have access to safe pick-up and drop-off points.
3.9.1 Boston
There are currently three ride share companies permitted to operate in Massachusetts: Lyft, Uber and
Via. Boston dominates Uber and Lyft rides in the state, with some 42.2 million trips in 2018 starting in
the city, a 21% increase from 201735. In 2019, over 45 million ride share rides each started and ended
in Boston, of which over 33 million 72%) were within Boston. This is approximately 3 million more than
2018.
Furthermore, ride share companies are required to pay 20 cents per ride that is distributed among
cities and towns, Massachusetts’ general transportation fund and MassDevelopment to assist small
34 NSW Government Point to Point Independent Review 2020
35
The Boston Globe (13 June 2019), https://www.bostonglobe.com/business/2019/06/13/uber-lyft-use-skyrocketing-
massachusetts/eoF1pkQHhVsHNzmWlIhADI/story.html
Parking in the Sydney CBD: An International Comparison Update
Project: P5072 Version: 001
20businesses operating in the taxicab, livery or hackney industries. Over $12 million was collected in
2017, over $16 million was collected in 2018 and over $18.2 million was collected in 201936.
3.9.2 Philadelphia
Xiaoxia Dong & Erick Guerra, Ph.D (2020)37 investigated ride share’s impact on transit. Key points to
note from the investigation are:
§ Ride share is mostly used to fill occasional rather than regular travel needs, with many ride-share
trips used for short recreation and errand purposes in urban area
§ Younger and lower income users tend to use ride share services more frequently than older higher
income users
§ ridership for all of City’s four main transit modes in the study area declined after ride-hailing
services’ entry. Buses suffered the biggest ridership losses
3.9.3 San Francisco
SF Bay38 provides a range of ride share options throughout San Francisco such as individual and
coordinated carpools (i.e. Merge, Casual Carpool, Waze Carpool Rider, Waze Carpool Driver and
Scoop) and Vanpools. It offers rewards including 10 points per carpool trip and a $25 reward for every
250 points earned, free or half-price tolls in express lanes, and financial and tax subsidies.
3.9.4 San Diego
iCommute provides ride share options throughout San Diego through Waze Carpool, uberPOOL, and
Lyft Shared. These provide a 50% or more reduction in commuting costs, as well as many free
amenities throughout the region including carpool lanes, the I-15 Express Lanes, Park & Ride lots,
and the Guaranteed Ride Home program39. A range of services are also provided for employees such
as developing carpool plans and schedules and ongoing benefits.
36
Commonwealth of Massachusetts, https://tnc.sites.digital.mass.gov/
37 A Philadelphia ride-share story: An Investigation of ride-share’s impact on transit
38
511 SF Bay, https://511.org/
39
iCommute San Dag, https://icommutesd.com/carpool/carpool
Parking in the Sydney CBD: An International Comparison Update
Project: P5072 Version: 001
214. PUBLIC TRANSPORT CHARACTERISTICS
4.1 Journey to Work Mode Splits
Analysis of Journey to Work data was undertaken to determine the relative number of employees
travelling to work by car as opposed to public transport or active modes40.
Employees commuting to the Sydney CBD were less likely to commute by car and more likely to use
public transport than in other cities, with 61% public transport uptake. Whilst Boston and San
Francisco also displayed a relatively high degree of public transport usage (both approximately 37%),
employees commuting to San Diego are overwhelmingly dependent upon car, with just 4% of
commuters using public transport. It is also worth noting that a greater number of trips were made to
San Diego than the other cities in this study.
Figure 4.1:Travel Mode Split of Trips to Work
It can be seen that public transport mode share is highest for Sydney, and that Boston and San
Francisco are similar. San Diego has very low public transport mode share, reflective of its limited
transit system (as explained in Section 4.4) and generous parking supply.
Sydney’s mode share can be explained by a combination of early development of radial train, tram
and bus routes, and severe traffic congestion on radial roads leading to the CBD. For many years,
there were very limited CBD bypass routes for through traffic (for example north shore to/from the
airport). Even now, despite the Eastern Distributor and Cross City Tunnel, CBD streets such as King,
Market, Bathurst and Liverpool carry substantial proportions of through traffic.
Figure 4.2 indicates that cities where employees tend to travel to work in the CBD by public transport,
such as Sydney, Boston and San Francisco, are less likely to provide extensive parking facilities in
the CBD. Conversely, the high level of parking availability in San Diego is likely a reflection of its low
public transport mode share. In this context, the effect of Sydney’s limited parking provision is
40Note: Due to differences in mode classification in Australian and U.S Census Data, trips made by car
incorporates both car drivers and passengers
Parking in the Sydney CBD: An International Comparison Update
Project: P5072 Version: 001
22somewhat mitigated by its high dependence upon public transport. As its working population grows,
the challenge for Sydney will be to moderate future demand for parking by developing those public
transport capabilities through projects such as the CBD and South East Light Rail, and the Metro rail
network.
Figure 4.2:Comparison of Parking Availability per Employee with Public Transport Mode
Share for Journeys to Work
4.2 Sydney
4.2.1 Network Description
The Sydney public transport network consists of train, bus, and to a lesser extent, light rail and ferry
services. Train services are under a joint jurisdiction - higher frequency inner-city and suburban
services are operated by Sydney Trains, whilst NSW TrainLink is responsible for intercity services to
the South Coast, Southern Highlands, Blue Mountains, Central Coast, Hunter and Newcastle. At
present, capacity of the network is restricted by the existing infrastructure and the need for a second
Harbour Crossing.
Sydney Metro is the operator of the driverless metro (single deck, high frequency) trains currently
operating between Chatswood and Tallawong (in north west Sydney). The metro network is being
extended from Chatswood to Bankstown (the CBD and South West Metro project) via North Sydney,
the CBD, Waterloo and Sydenham, expected to open in 2024. Planning is also underway for the
Sydney West Metro (CBD to Westmead) expected to be completed by 2030.
Bus services are provided by Sydney Buses, as well as several private bus operators. Current
planning strategies are aimed at using buses as ‘feeder services’ towards train stations, although
commuters in some areas, particularly the Warringah area, are heavily reliant upon express bus
Parking in the Sydney CBD: An International Comparison Update
Project: P5072 Version: 001
23services to the CBD. In addition, a form of Bus Rapid Transit (BRT) is in place on the Liverpool-
Parramatta Transitway and from the Northern Beaches (the B-Line).
Light rail services operate from Central rail station to Pyrmont, Lilyfield and Dulwich Hill (L1 Line), and
from Circular Quay to Randwick (L2 line) and to Kingsford (L3 Line). The L2 and L3 lines, opened in
2020, resulted in a pedestrian zone on George Street (between Hunter and Bathurst Streets), and a
major impact on the operation of streets in the Sydney CBD. Some bus routes were terminated at
light rail interchanges, remaining bus routes were diverted to parallel north-south streets, and
consequently general traffic displaced to other streets. On the new Bus Priority routes such as
Castlereagh Street, the relatively narrow road reservation means that most on-street parking and
loading zones were lost as part of the creation of Bus Lanes, general traffic lanes, and turning lanes.
All of the on-street parking spaces previously available to motorists were eliminated along the light
rail route in the CBD precinct.
Ferry services are now operated by a private entity, Harbour Ferries, and primarily run services to
northern harbour locations, as well as Parramatta. Ferries account for just 3% of all public transport
trips to the CBD.
4.1 Boston
The Massachusetts Bay Transportation Authority is responsible for public transport within the Greater
Boston Area. The Boston CBD is serviced by a subway, consisting of three heavy rail lines and one
light rail line; bus services, and BRT (known as the Silver Line). Silver Line buses traverse a 41km
route, operating in a dedicated transit lane at street level through the CBD before entering a bus
tunnel east of South Station.
A commuter rail network, spanning 11 lines and 100 stations services regional commuters; the lines
terminate at North and South Stations at the extremities of the CBD. Lastly, frequent bus services, as
well as inner harbour and commuter ferry services are available.
4.2 San Diego
The San Diego Metropolitan Area is heavily reliant upon bus and trolley services, both operated by
the San Diego Metropolitan Transit System. The San Diego Trolley is a light rail system spanning
three lines, 53 stations and 86km from outer suburbs to Downtown San Diego. A second light rail
service named ‘Sprinter’ also operates in the region, but does not run to San Diego City.
A single commuter train, the ‘Coaster’, runs from Oceanside south to Downtown San Diego to connect
with trolley services. Its peak running frequency is two trains per hour. However, ‘Coaster’ attracts
only 1.6 million trips annually and carries only a very small proportion of commuters to and from San
Diego City.
In addition, five BRT routes operate, including three stations along Broadway in Downtown San Diego.
4.3 San Francisco
The Bay Area Rapid Transit System (BART) is San Francisco’s most popular mode of public transport,
responsible for over 120 million trips annually. It offers regional heavy rail services over five lines and
44 stations. Approximately 60km of track runs underground, with an additional 107 km at surface
level or on elevated tracks.
The Muni Metro is an extensive light rail network providing access to Downtown San Francisco from
outlying neighbourhoods. The network consists of over 115km of track and includes three tunnels,
Parking in the Sydney CBD: An International Comparison Update
Project: P5072 Version: 001
24nine subway stations, twenty-four surface stations and eighty-seven surface stops41. Within the
Financial District and surrounds, underground stations are shared with BART.
Buses and trolleybuses, as well as a limited number of historic cable cars also operate in the city. A
BRT route operates along Van Ness Avenue, a major transportation corridor. This route includes
dedicated bus lanes separated from traffic through in the CBD as well as elimination of most left turns,
transit signal priority and traffic signal optimisation.
4.4 Seattle
Buses are heavily patronised in the Seattle area, with over 380,000 bus trips taken each weekday42.
Local services are provided by the King County Department of Transportation (King County Metro),
whilst regional services to neighbouring counties are provided by Sound Transit. A number of bus
services, as well as the Central Link Line utilise the Downtown Seattle Transit Tunnel, a 2.1 km public
transit tunnel which runs the length of downtown Seattle.
Seattle’s light rail line, the Link Line operated by Sound Transit, runs from University of Washington
in the north through downtown Seattle, Sea-Tac Airport to Tacoma in the south. Light rail patronage
is approximately 89,000 trips each weekday.
Sound Transit also operates a commuter rail service, ‘Sounder’, which extends south of Seattle to
Tacoma and Lakewood, and north to Everett. The system accounts for approximately 18,000 trips
each weekday.
In its 2012 Transit Master Plan, the Seattle Department of Transportation proposed implementing
rapid transit routes on key transit corridors within downtown Seattle. These rapid transit routes are
likely to take the form of BRT or streetcar routes. As yet, Seattle does not have a true BRT network
in place, although an express bus network, King County Metro’s ‘RapidRide’, incorporates some
features of BRT.
Washington State Ferries operate regular ferry services across the Puget Sound, with two routes to
the City of Seattle. Due to a lack of alternative connections across the Sound, ferry services are quite
popular with over 60,000 trips taken each weekday.
4.5 Philadelphia
The city of Philadelphia is served by three heavy rail lines, 12 commuter rail lines and three trolley
(light rail) lines. There are also more than 150 bus routes. Average weekday ridership47 ranges from
492,000 on buses, through 329,000 on heavy rail to 106,000 on light rail/trolley. Commuter rail
services carry approximately 135,000 passengers on an average weekday.
4.6 Comparison
Table 4.1compares the public transport facilities in place or under development in each city, while
Figure 4.3 shows the number of unlinked passenger trips taken on each of these modes in 2012. For
comparison purposes, Bus Rapid Transit systems have been grouped under Bus services.
Of the cities in this study, Sydney is the most reliant upon heavy rail services, which accounted for
58% of passenger trips in 2012. Boston and San Francisco also demonstrated high heavy rail
patronage, although both of those cities had a higher ridership on light rail modes (19% and 28%
respectively, compared to just 1% in Sydney). Despite this disparity, the total ridership accounted for
by light rail and bus modes is similar across these three cities, at 30-40%. In contrast, In San Diego
41SFMTA (2021), ‘Muni Metro Light Rail’, viewed 12 May 2021,
42American Public Transport Association (2021), Transit Ridership Report- Fourth Quarter 2019, viewed
12 May 2021,
Parking in the Sydney CBD: An International Comparison Update
Project: P5072 Version: 001
25and Seattle, bus services account for the bulk of passenger trips. In both cities, this is likely a reflection
of the limited provision of alternative modes, particularly in San Diego, where public transport
patronage is relatively low (see Figure 4.1). However, while Seattle is in the process of expanding its
light rail and streetcar capacities, San Diego has instead chosen to invest in additional BRT routes.
Ferry transport also featured in each city except San Diego but this mode only features prominently
in Seattle, where ferries are able to transport passengers across the Puget Sound more effectively
than rail or bus.
Table 4.1: Comparison of Public Transport Facilities
Public Transport Sydney Boston San Diego San Seattle Philadelphia
Mode Francisco
Heavy Rail
Light Rail
Bus
Bus Rapid Transit
Ferry
Trolley/Cable
Car/Streetcar
Figure 4.3: 2012 Unlinked Passenger Trips by Public Transport Mode
Parking in the Sydney CBD: An International Comparison Update
Project: P5072 Version: 001
265. CONCLUSIONS
Sydney’s parking and public transport have been compared with those in five similar US cities, namely
Boston, San Diego, San Francisco, Philadelphia and Seattle.
In terms of parking supply per CBD employee, Sydney is broadly in line with San Francisco and
Philadelphia. Seattle has two to three times the number of spaces, while San Diego has almost four
times as many. The median daily parking rate in Sydney is almost double that of the five US cities.
Sydney’s public transport mode share for work trips to the CBD is the highest at 61%, followed by
Boston and San Francisco (around 37%), Philadelphia (24%), Seattle (21%) and San Diego (just 4%).
We note the strong inverse relationship between the number of parking spaces and the public
transport mode share.
In comparing parking management strategies, Sydney is further advanced than all five US cities,
although San Francisco and Seattle are somewhat similar.
Parking in the Sydney CBD: An International Comparison Update
Project: P5072 Version: 001
27You can also read