Landscape-scale distribution of nest predators and its rela-tionship with regent honeyeater nest success - DIFFICULT ...
←
→
Page content transcription
If your browser does not render page correctly, please read the page content below

Austral Ecology (2021) , –

Landscape-scale distribution of nest predators and its rela-
tionship with regent honeyeater nest success
DANIEL GAUTSCHI,*            ROBERT HEINSOHN, LIAM MURPHY AND
ROSS CRATES
Fenner School, Australian National University, Linnaeus Way, Canberra, Australian Capital Territory,
2601, Australia (Email: degautschi@gmail.com)

Abstract Overcoming low breeding success is a major challenge for reversing population decline in threatened
species. High nest predation rates are a common cause of low productivity in birds, but implementing evidence-
based management actions to reduce nest predation is challenging. Targeted breeding management requires a
good understanding of where threatened species breed, the identity and distribution of nest predator species and
the impact of these nest predators on breeding success. For rare and nomadic species, this information is hard
to come by. The breeding success of regent honeyeater Anthochaera phrygia has declined over recent decades,
and nest predation is the primary cause of breeding failure. We conducted point-count surveys of nine avian and
three mammalian nest predator species across 80% of the regent honeyeater’s contemporary breeding area in
south eastern Australia. We used occupancy models to determine the presence of predator species at survey sites
and spatial models to predict predator abundance and species richness across the breeding area. We incorpo-
rated predator predictions for regent honeyeater nest locations into nest fate and daily nest survival models.
Predator abundance was correlated positively with tree hollow abundance and proximity to water and negatively
with shrub cover. Regent honeyeater nest success showed no significant relationship with predator abundance or
predator species richness. Given how abundant and widespread avian and mammalian nest predators were
throughout the breeding area, improving regent honeyeater nest success is likely to require implementation of
simultaneous nest protection measures to avoid potential compensatory nest predation. Further research is
required to better understand the relationship between nest predator abundance and regent honeyeater nest suc-
cess.

Key words: avian ecology, nest predation, nest protection, predator abundance, spatial modelling.

INTRODUCTION                                              can be challenging to sustain if the predator is hyper-
                                                          abundant (Davitt et al. 2018; Beggs et al. 2019).
Developing effective management strategies to             Where multiple taxa are potential nest predators, suc-
improve breeding success is a central component of        cessful nest protection requires the implementation
threatened species recovery plans (Lawler et al.          of management actions that simultaneously reduce
2002). For threatened birds, nest predation is a key      predation risk from the entire predator community
factor in limiting breeding outcomes (Martin 1993).       (Reitsma et al. 1990). Otherwise, compensatory nest
However, management of nest predation is challeng-        predation by other taxa in the local predator commu-
ing and requires a good understanding of both the         nity may lead to equivalent, or even increased, nest
target species’ breeding biology and nest predators       predation rates (Fulton 2018; Beggs et al. 2019).
themselves (Remes et al. 2012). The identity, distri-    Life-history is also important to consider when
bution and abundance of nest predators in breeding        implementing management actions to improve breed-
areas is important to understand when implementing        ing outcomes in threatened species (Remes et al.
management to improve breeding success (Iban
                                                ~ ez-A    2012). Multiple life-history traits such as the clutch
lamo et al. 2015).                                        size, number of broods per season and length of nest-
  In cases where a single predator species is the dis-    ing cycle affect species’ susceptibility to population
proportionate cause of nest predation, successful         decline due to nest predation (Martin 1995). Simi-
predator management may be achieved by imple-             larly, management approaches will differ depending
menting one or two protection measures that are tar-      on the species’ breeding biology. For example, hol-
geted at those species (Robertson et al. 1994; Leo &      low nesting species may better accommodate physical
Manley 2018). However, single-species management          nest protection installations than open cup nesters
                                                          because they are less prone to disturbance-related
 *Corresponding author.                                   nest abandonment (Berris et al. 2018).
 Accepted for publication May 2021.

© 2021 Ecological Society of Australia                                                     doi:10.1111/aec.13075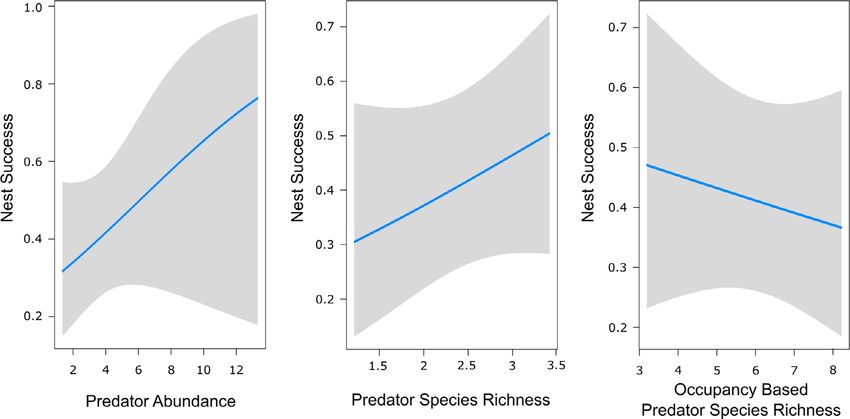
2    D . G A U T S C H I ET AL.

   One species that could benefit from management                 inform how best to protect regent honeyeater nests
of nest predation is the regent honeyeater, a critically         from predation, we conducted point-count surveys
endangered songbird endemic to the woodlands of                  of known avian and mammalian nest predators
south-eastern Australia (Commonwealth of Australia               across the species’ core remaining breeding range.
2016). In recent decades, the species has undergone              We developed a survey protocol and modelling
severe population decline due to habitat loss and                framework to achieve two aims. Firstly, we aimed to
competition from larger honeyeaters (Ford 2011).                 identify habitat features that predict a) the presence
Population decline may also be underpinned by an                 of individual predator species, b) the overall abun-
Allee effect, given the regent honeyeater’s historic             dance of predators and c) the number of predator
tendency to form large flocks and nest in aggrega-                species, in a regent honeyeater breeding area. Sec-
tions (Ford et al. 1993; Crates et al. 2017b). The               ondly, we aimed to determine if spatial variation in
remaining wild population is a single genetic man-               regent honeyeater breeding success is explained by
agement unit of approximately 200–400 birds, dis-                spatial variation in predator abundance and predator
tributed sparsely and dynamically across over                    species richness. We predicted that nest success
300 000 km2 from northern Victoria to southern                   rates over the last five years would be lower in areas
Queensland (Kvistad et al. 2015; Crates et al.                   of high predator abundance and predator species
2019b). Contemporary breeding activity is largely                richness.
restricted to the greater Blue Mountains and the
Northern Tablelands in New South Wales, but the                  METHODS
annual location of breeding activity is highly variable
(Crates et al. 2019a).
   Regent honeyeaters build small, open-cup nests,               Study area
typically in the outer forks of large trees near flower-
                                                                 The study area encompassed 80% of known wild regent
ing Eucalyptus tree species (Oliver et al. 1998). Breed-         honeyeater breeding activity between 2015 and 2019
ing success in wild birds has declined over recent               (Fig. 1, Crates et al. 2019a). The Capertee Valley study
decades, from 35–50% in the 1990s to 9–33%                       area covered 460 km2 of woodland in the western greater
between 2015 and 2017 (Crates et al. 2019a). Low                 Blue Mountains, NSW, and represents a key breeding area
breeding success among reintroduced birds (< 20%)                for the regent honeyeater (Crates et al. 2019a). Within the
is also hindering the capacity of a captive breeding             Capertee Valley, we defined five regions, based on clusters
programme to contribute to population recovery                   of nest locations identified by Crates et al. (2019a) and dif-
(Taylor et al. 2018). These estimates are towards the            ferences in daily nest survival within these clusters (Fig. 1).
lower end of nest success estimates for other hon-               The Goulburn River study area represented a single region
                                                                 and covered 7 km2 of largely cleared river flats within the
eyeater species (Crates et al. 2019a), but the reasons
                                                                 northern greater Blue Mountains, NSW (Fig. 1). Vegeta-
why nest survival is low for regent honeyeaters rela-            tion communities are similar in both valleys, dominated by
tive to many other honeyeater species remains                    box-gum-ironbark (Eucalyptus spp.) woodland on low-lying
unclear. At the regional scale, regent honeyeater nest           slopes and the river-oak (Casuarina cunninghamiana) gallery
survival is spatially variable, but the factors explaining       forest along watercourses. Regent honeyeaters are known to
this variation are poorly understood (Crates et al.              move between the Goulburn River and the Capertee Valley,
2019a). Video monitoring revealed predation by a                 evidenced by re-sightings of colour-banded birds (Crates
range of birds and marsupials as the primary cause of            et al. 2019a).
nest failure (Taylor et al. 2018; Crates et al. 2019a).
Temporal decline in nest success in regent honeyea-
ters and other threatened woodland birds may be                  Survey protocol
due to concurrent increases in the abundance of nest
predators, many of which have responded positively               We defined each survey site as a 50 m radius surrounding
                                                                 a fixed GPS location. We selected 246 sites, with 40–43
to anthropogenic habitat fragmentation (Remes et al.
                                                                 sites per region. Most sites (n = 126) were pre-selected as
2012; Fulton 2018).                                              part of a national regent honeyeater monitoring program
   Developing effective management strategies to                 (Crates et al. 2019a). We chose additional sites (n = 79)
reduce the rate of nest predation in regent honeyea-             based on suitable nesting habitat and varying proximity to
ters will be fundamental to preventing the species’              contemporary nesting sites in order to increase sampling
extinction in the wild (Crates et al. 2019a). To                 stratification across habitats and locations.

Fig. 1. (a) Location of the Capertee and Goulburn River valleys in a regional and national context; (b) Distribution of sur-
vey sites within regions of the Capertee Valley, as identified by Crates et al. (2019a), and (inset) the Goulburn River; (c)
Distribution of regent honeyeater nesting activity within the Capertee Valley and (inset) the Goulburn River between 2015
and 2019.

doi:10.1111/aec.13075                                                               © 2021 Ecological Society of Australia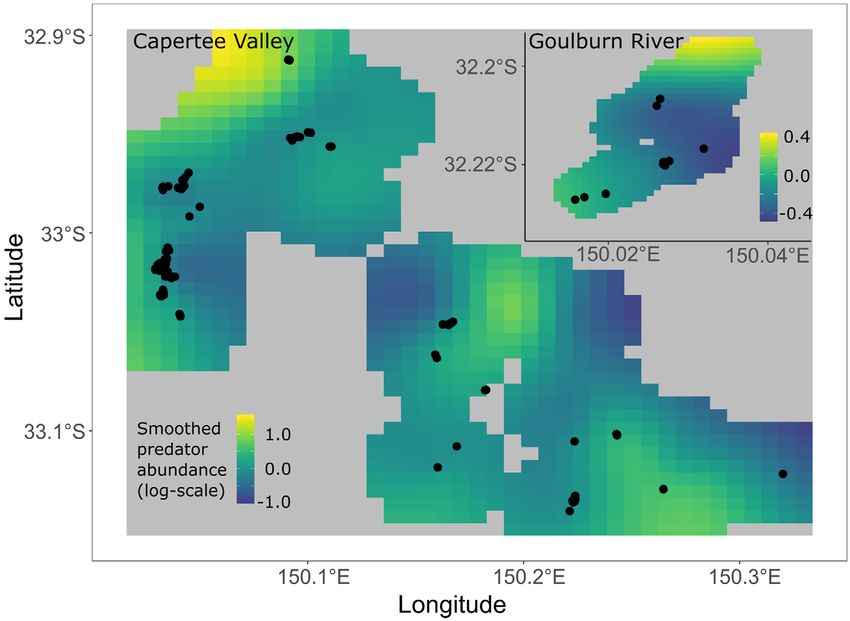
PREDATOR DISTRIBUTION AND NEST SUCCESS        3

© 2021 Ecological Society of Australia                              doi:10.1111/aec.13075
4     D . G A U T S C H I ET AL.

   We surveyed for 12 nest predator species, due to their        Occupancy models
observed nest predatory behaviour and occurrence within
the study region (Taylor et al. 2018; Beggs et al. 2019;         We used R v3.6.2 (R Core Team 2020) for all data analy-
Crates et al. 2019a; Fulton 2019a). The predator species         sis. To determine which habitat features predict the pres-
were Australian magpie Gymnorhina tibicen, Australian            ence of individual nest predator species, whilst accounting
raven Corvus coronoides, common brushtail possum Tri-            for imperfect detection (MacKenzie et al. 2005), we fitted
chosurus vulpecula (hereafter ‘possum’), grey butcherbird        single-season, single-species occupancy models using pack-
Cracticus torquatus, grey shrike-thrush Colluricincla harmon-    age unmarked v0.13.1 (Fiske & Chandler 2011). For each
ica, laughing kookaburra Dacelo novaeguineae, noisy miner        species, we first created a null model and a set of models
Manorina melanocephala, pied butcherbird Cracticus nigrogu-      including single habitat and detectability covariates, with
laris, pied currawong Strepera graculina, squirrel glider        predator species detection / non-detection as a binomial
Petaurus norfolcensis, sugar glider Petaurus breviceps and       response. We used Akaike Information Criteria (AIC) to
white-winged chough Corcorax melanorhamphos. We com-             estimate the strength of univariate models relative to each
bined sugar glider and squirrel glider as ‘glider sp.’ because   other (Burnham et al. 2011). We then built a saturated
rapid identification to species level was not always possible     model for each species, including covariates with a smaller
in the field at night.                                            univariate AIC than those in the null model. We used
   We conducted three diurnal surveys, two nocturnal sur-        MuMIn v1.43.15 (Barto    n 2019) to identify the most parsi-
veys and one scat survey at each site during a three-month       monious model from the saturated model and ranked the
regent honeyeater nesting season between August and              models by AICc (Burnham et al. 2011).
November 2019. Due to the 2019 bushfires, we were                    Because existing monitoring has shown that no single preda-
unable to undertake 48 of 1476 surveys (3.3% of total sur-       tor species is the disproportionate cause of regent honeyeater
veys including 17 diurnal, 19 nocturnal and 12 scat).            nest predation (Taylor et al. 2018; Crates et al. 2019a), we cal-
   For diurnal surveys, we followed Crates et al. (2017a)        culated predator-community measures for each survey site. We
and surveyed for five minutes, recording the maximum              used three predator-community measures:
count of each nest predator species detected visually or
aurally within 50 m of the site centroid. Nocturnal surveys        Predator abundance: sum of the maximum
involved a six-minute point-count, using three comple-               number of each predator species observed across
mentary methods: spotlighting, thermal imaging and                   repeat visits to a site, excluding possum scat
southern boobook Ninox boobook call playback to increase             detections.
sugar glider detectability (Allen et al. 2018). Each noctur-       Predator species richness: the number of
nal survey required two observers: one spotlighting using a          predator species detected across repeat visits to a
600-lumen headlamp and the other operating a thermal                 site, including possum scat detections.
imaging camera. After five minutes, we broadcast six sec-           Occupancy-based predator species richness:
onds of southern boobook call playback and listened for
                                                                     sum of occupancy probability predictions for
responses from sugar gliders for the remainder of the final
                                                                     each predator species at each site.
minute.
   We also searched for possum scat at each site as an addi-
tional indicator of possum presence (Wayne et al. 2005b).
To infer possum presence or absence through scat surveys,        Spatial models
we modified the spot assessment technique used for koala
Phascolarctos cinereus detection (Phillips & Callaghan 2011).    To account for spatial autocorrelation in predator-
We searched for possum scat within 1 m of the base of the        community measures and habitat covariates (Legendre
five most suitable trees within sites, based on largest diame-    1993), we used generalised additive models (GAMs) with a
ter at breast height, presence of visible hollows and / or       smoothed bivariate spatial term s(Lat, Long) in mgcv
food sources (McElhinny et al. 2006). We terminated the          v1.8.31 (Wood 2019). We built two saturated GAMs with
search when we found possum scat or after unsuccessfully         predator abundance and predator species richness as the
searching the five trees.                                         response variables, including habitat covariates and the spa-
                                                                 tial term (Table 1), and used MuMIn to identify the most
                                                                 parsimonious GAMs based on lowest AICc. We tested
Habitat and detectability covariates                             Poisson and negative binomial error structures for each
                                                                 model and assessed model fit using function ‘gam.check’ in
A single observer (DG) recorded site-level habitat covari-       mgcv and the degree of residual spatial autocorrelation
ates prior to the first diurnal survey and visit-level habitat    using package ncf v1.2.9 (Bjørnstad 2020). We created
covariates and detectability covariates during each site visit   smoothed surfaces of predator abundance for the Capertee
(Table 1).                                                       Valley and Goulburn River using mgcViz v0.1.6 (Fasiolo &
                                                                 Nedellec 2020).

Statistical analysis
                                                                 Nest success
Statistical analysis involved three complementary stages:
occupancy modelling, spatial modelling and nest survival         We monitored regent honeyeater nests during the 2019
modelling.                                                       breeding season and combined these data with those from

doi:10.1111/aec.13075                                                               © 2021 Ecological Society of Australia
PREDATOR DISTRIBUTION AND NEST SUCCESS 5
Table 1. Habitat and detection covariates recorded in surveys of regent honeyeater nest predators in the Capertee and
Goulburn River Valleys. All covariates are factors, unless otherwise stated. Further details are provided in Appendix S2
Level Covariate Description Justifying citations
Habitat Covariates Vegetation Community Dominant vegetation community based on Major et al. (2001)
value to nesting regent honeyeaters. Crates et al. (2019a)
River-oak Casuarina cunninghamiana (high
value); yellow box / mugga ironbark Eucalyptus
melliodora / E. sideroxylon (high value); white-
box E. albens (medium value); other E. crebra,
E. punctata (low value)
Water Proximity Linear distance from the site centroid to the Palmer and Bennett (2006)
nearest water source. Crates et al. (2017a)
On site; 50–200 metres; >200 metres
Nest Proximity Linear distance from the site centroid to Ball et al. (2005)
nearest-known regent honeyeater nest.
On site; 50–200 metres; >200 metres
Blossom Abundance Maximum blossom abundance level across McElhinny et al. (2006)
repeat surveys.
None; mild; heavy
Mistletoe Abundance Number of mistletoe clumps on site. Watson and Herring (2012)
None; 1–10 clumps; >10 clumps
Hollow Abundance Estimated number of tree hollows on site. McElhinny et al. (2006)
None; 1–3 hollows; >3 hollows
Woody Debris Abundance Abundance of woody debris on site. Mac Nally et al. (2001)
Low; medium; high
Canopy Cover Percentage of canopy cover on site. Fulton (2018)
0–15%; 15–30%; >30% Val et al. (2018)
Shrub Cover Percentage of shrub cover on site. Val et al. (2018)
0–15%; 15–30%; >30%
Ground Cover Dominant ground cover on site. Val et al. (2018)
Bare / leaf litter; short grass; long grass / low
shrub
Spatial location Wgs84 latitude / longitude, modelled as a Legendre (1993)
smoothed bivariate term.
s(Lat, Long).
Detection Covariates Visit Number Visit number. Rota et al. (2009)
Diurnal (1–3); nocturnal (1–2)
Time of day Period of the day / night in which survey took How et al. (2004)
place.
Diurnal: before 10am; 10am to 4pm; after
4pm
Nocturnal: within 2 hours of sunset; >2 hours
after sunset
Wind Speed Estimated wind speed at the time of survey. Allen et al. (2018)
None; light; moderate
Temperature Approximate temperature at the time of survey. Wayne et al. (2005a)
Diurnal: 20°C
Nocturnal: 20°C
Moon Phase Moon phase observed at the time of nocturnal Wayne et al. (2005a)
survey.
None; small crescent; large crescent; full
nests monitored between 2015 and 2018 (Crates et al. Although nest fate is the ultimate measure of nest success,
2019a), to model nest success in two ways: it does not account for nests that fail prior to detection, creat-
ing a potential bias in nest success rate estimates (Johnson
Nest fate: A binomial response of whether the nest et al. 2007). We modelled daily nest survival rate to account
fledged at least one juvenile (succeed) or not (fail). for this potential bias (Mayfield 1975). We obtained predator
Daily nest survival rate (DSR): The probability abundance and species richness predictions for 115 nest
of an egg or nestling surviving from any given locations from the respective spatial models using ‘predict’ in
day to the next. mgcv, with habitat data for nest sites that were included in
© 2021 Ecological Society of Australia doi:10.1111/aec.130756 D . G A U T S C H I ET AL.
the most parsimonious spatial models. We therefore derived detected at each site, ranged from 0–14 with a med-
predictions of predator abundance and species richness at ian of 3. The most parsimonious predator abundance
nest locations from multiple survey sites, weighted through model (DAICc relative to the second most parsimo-
the smoothed term by their distance from the nest. We nious model = 0.31, Akaike weight wi = 0.247)
assumed this approach would help account for the fact that
included hollow abundance, water proximity, extent
the home ranges of the predator species would differ in size
of shrub cover, the type of ground cover, mistletoe
(Smith & Murray 2003). We derived occupancy predictions
for each predator species at each nest site, using the habitat abundance and the smoothed spatial term. Predator
covariates included in the most parsimonious occupancy abundance was correlated positively with hollow
models. We then summed these occupancy probabilities to abundance (b = 0.40, SE = 0.16, P = 0.012) and
determine the occupancy-based predator species richness. water proximity (b = 0.31, SE = 0.11, P = 0.007)
We did not derive occupancy-based predator species richness and negatively with the extent of shrub cover
from a spatial model to avoid double-analysis of habitat (b = 0.44, SE = 0.14, P = 0.002). Predator abun-
covariates already accounted for in the occupancy modelling dance was higher at sites with short grass as the pre-
process. dominant ground cover, relative to other types of
To assess the relationship between regent honeyeater nest ground cover (b = 0.27, SE = 0.10, P = 0.008,
success and predator-community measures, we created nest
Table 3). The predicted predator abundance surface
fate and daily nest survival rate models. We included nest
covariates that were previously found to predict regent hon-
is shown in Fig. 2. The smoothed spatial term
eyeater nest success in our analysis (Crates et al. 2019a). accounted for almost all spatial autocorrelation in the
These covariates were the nest region, as defined in this study predator count data.
(Fig. 1), position of the nest relative to the edge of the tree Predator species richness, defined as the number
crown (‘position’), the extent to which the nest was con- of predator species detected at a site, including
cealed by vegetation (‘concealment’) and presence / absence detections through scat surveys, ranged from 0–7
of an active regent honeyeater nest within 100m of a focal with a median of 2. The most parsimonious predator
nest (‘conspecifics’). We fitted logistic regressions of nest fate species richness model (DAICc = 0.23, wi = 0.084)
with a binomial response of succeed or fail using lme4 included hollow abundance, extent of shrub cover
v1.1.23 (Bates & Maechler 2020). We built a series of logistic
and extent of canopy cover. Predator species richness
regression models, using combinations of nest covariates and
was correlated positively with hollow abundance
one of the predator-community measures, and used MuMIn
to rank these models by AICc. We modelled daily nest sur- (b = 0.51, SE = 0.16, P = 0.001) and negatively with
vival rate (DSR) using RMark v2.2.7 (Laake 2019), creating the extent of shrub cover (b = 0.25, SE = 0.12,
multivariate DSR models with combinations of nest variables P = 0.037). Predator species richness was higher at
and one of the predator-community measures. To avoid sites with moderate canopy cover (b = 0.52,
overfitting, given the relatively small sample of nests SE = 0.24, P = 0.034).
(n = 115), we included no more than two nest covariates and
one predator-community measure in a single DSR model.
We identified the most parsimonious models based on AICc. Nest success
An annotated R-script is provided in the Appendix S1.
When controlling for other covariates, the relation-
RESULTS ships between regent honeyeater nest fate and
predator-community measures were non-significant:
Site occupancy predator abundance (b = 0.18, SE = 0.14, P =
0.200), predator species richness (b = 0.50, SE =
Detection rates for predator species were highly vari- 0.30, P = 0.101) and occupancy-based predator
able, ranging from 8% for pied butcherbirds to 77% species richness (b = 0.42, SE = 0.34, P = 0.217,
for possums (Appendix S7). The most parsimonious Fig. 3, Appendix S3). The most parsimonious nest
occupancy models for individual predator species are fate model (DAICc = 0.64, Wi = 0.261) included only
shown in Table 2. Hollow abundance, blossom abun- the presence of conspecifics and nest position. Nest
dance and the extent of shrub cover were the covari- success was higher among nests where conspecifics
ates most frequently identified as predicting the were present (b = 1.18, SE = 0.41, P = 0.004) relative
presence of individual predator species. Wind speed, to those where conspecifics were absent and higher
visit number, time of day and temperature were the among nests that were located in the outer-crown
factors most commonly affecting detectability. (b = 1.81, SE = 0.84, P = 0.031) relative to those
located in the inner crown (Appendix S4).
The most parsimonious daily nest survival (DSR)
Spatial models model (DAICc = 0.15, Wi = 0.192, Fig. 4,
Appendix S5 and Appendix S6) included predator
Predator abundance, defined as the sum of the maxi- abundance, nest position and the presence of con-
mum number of individuals of each predator species specifics. The mean probability of regent honeyeater
doi:10.1111/aec.13075 © 2021 Ecological Society of AustraliaPREDATOR DISTRIBUTION AND NEST SUCCESS 7
Table 2. The most parsimonious occupancy model for each nest predator species surveyed. DAICc is relative to the second
most parsimonious model for each species
Species Model DAICc wi
Australian magpie Ψ(shrub). p(wind) 0.52 0.44
Australian raven Ψ(wood). p(visit) 2.40 0.62
Common brushtail possum Ψ(hollows + blossom + wood). p(1) 1.16 0.36
Glider spp. Ψ(blossom). p(wind) 0.16 0.30
Grey butcherbird Ψ(hollows). p(temperature + visit) 0.41 0.28
Grey shrike-thrush Ψ(1). p(time + visit + wind) 0.22 0.25
Laughing kookaburra Ψ(ground). p(1) 0.12 0.52
Noisy miner Ψ(blossom + shrub). p(temperature) 1.76 0.43
Pied butcherbird Ψ(shrub). p(time + wind) 0.22 0.25
Pied currawong Ψ(vegetation). p(visit) 0.39 0.48
White-winged chough Ψ(shrub + vegetation + wood). p(wind) 0.09 0.29
Table 3. Spatial model summaries showing the relationship between predator-community measures and habitat covariates.
Significant effects defined as P < 0.05 are shown in bold
Measure Covariate Relative to b SE z P
Predator Abundance Ground Cover (Long grass / low Ground (Short grass) 0.30 0.14 2.10 0.036
shrub)
Ground Cover (Bare / leaf litter) 0.27 0.10 2.66 0.008
Hollow Abundance (1–3) Hollow Abundance 0.14 0.16 0.86 0.388
(None)
Hollow Abundance (>3) 0.40 0.16 2.50 0.012
Mistletoe Abundance (1–10) Mistletoe Abundance 0.11 0.10 1.06 0.290
(None)
Mistletoe Abundance (>10) 0.12 0.11 1.08 0.281
Shrub Cover (15–30%) Shrub Cover (0–15%) 0.04 0.10 0.45 0.655
Shrub Cover (>30%) 0.44 0.14 3.08 0.002
Water Proximity (50–200 m) Water Proximity (On site) 0.27 0.12 2.22 0.026
Water Proximity (>200 m) 0.31 0.11 2.71 0.007
edf v2 P
s(Lat, Long) 35.01 100.6 30%) 0.52 0.24 1.74 0.082
Hollow Abundance (1–3) Hollow Abundance 0.27 0.16 1.72 0.086
(None)
Hollow Abundance (>3) 0.51 0.16 3.19 0.001
Shrub Cover (15–30%) Shrub Cover (0–15%) 0.01 0.10 0.08 0.938
Shrub Cover (>30%) 0.25 0.12 2.09 0.037
nest success between 2015 and 2019 within the Caper- predators and explore the relationship between
tee Valley and Goulburn River, assuming a 34-day nest- predator abundance and regent honeyeater nest suc-
ing period from the first egg date to fledging was 31%. cess. A number of habitat features were associated
with the presence of individual predator species, as
well as the abundance of the predator community
DISCUSSION as a whole. Predators were found across the study
area, with a median of three individuals and two
Understanding the processes that limit breeding species per survey site. Contrary to our expecta-
success in threatened species, and how these threats tions, regent honeyeater nest fate and daily nest
vary spatially, is critical to informing and imple- survival rates showed no negative relationship with
menting effective conservation management (Iban~ ez- predator-community measures. Instead, we found a
Alamo et al. 2015). We aimed to determine the non-significant positive relationship between nest
habitat features influencing nest predator abun- success and both predator abundance and predator
dance, understand the spatial distribution of nest species richness.
© 2021 Ecological Society of Australia doi:10.1111/aec.130758 D . G A U T S C H I ET AL.
Fig. 2. Smoothed nest predator abundance prediction surface across the Capertee Valley and Goulburn River derived from
generalised additive models. Points denote regent honeyeater nest sites located between 2015 and 2019. Note different spatial
scales for the Goulburn River (inset).
Fig. 3. Logistic regression of the relationship between regent honeyeater nest success in the Capertee Valley and Goulburn
River (n = 115) and predator-community measures.
Predictors of predator presence findings that noisy miners are associated with frag-
mented woodland areas where understory vegetation
The habitat features that best predicted occupancy of has been cleared (Val et al. 2018). The white-winged
nest predators varied between species. Noisy miner chough, Australian magpie, pied butcherbird and
presence was associated negatively with the extent of laughing kookaburra were also associated negatively
shrub cover and blossom abundance; consistent with with the extent of shrub cover and associated
doi:10.1111/aec.13075 © 2021 Ecological Society of AustraliaPREDATOR DISTRIBUTION AND NEST SUCCESS 9 Fig. 4. Modelled relationship between predator-community measures and regent honeyeater daily nest survival rate (DSR) in the Capertee Valley and Goulburn River between 2015 and 2019 (n = 115). Predictions are derived from univariate models of each predator-community measure. positively with short grass as the primary ground of nest predation and informing the implementation cover. These birds primarily forage on the ground of targeted predator management. (Higgins 2006) and are therefore more likely to avoid areas with extensive shrub cover and / or a dense Nest predator community and regent understory. The common brushtail possum and gli- honeyeater nest success der species were associated positively with local blos- som abundance; an important food source for While our study was not able to find a clear relation- arboreal marsupials (Smith & Murray 2003) as well ship between predator abundance and regent hon- as nesting regent honeyeaters (Crates et al. 2017a). eyeater nest success, this relationship is well Possums were also associated with high estimated documented among other species. Previous studies hollow abundance; a key habitat feature for arboreal have indicated a negative correlation between preda- marsupials (McElhinny et al. 2006). tor abundance and nest success (e.g. Debus 2006; For the predator community as a whole, predator Heinsohn et al. 2015), and removal of predators is abundance and species richness measures were highly often considered an effective strategy in the manage- variable across both study areas. We detected up to ment of threatened birds (Smith et al. 2010). Our 14 individual predators and up to seven predator spe- results may indicate that a larger sample of nests is cies at survey sites, emphasising the high potential required and / or that other factors are obscuring the predation threat faced by nesting regent honeyeaters. relationship between predator community measures Spatial models revealed that predator abundance and and regent honeyeater breeding success. One species, species richness were both higher at sites with more or even one individual, may be culpable for a hollows and a lower extent of shrub cover. These disproportionate amount of nest predation events habitat features may reflect woodland landscapes that (Stojanovic et al. 2014). For regent honeyeaters, have undergone modification for agricultural pur- observations of nests being predated by a wide range poses, which has been associated with the release of of species casts doubt on this possibility (Taylor et al. mesopredators (Ford 2011; Fulton 2018). Knowl- 2018; Crates et al. 2019a). Less common woodland edge of the habitat features impacting nest predator nest predators, which were not surveyed in our study, abundance and predator species richness may be could also be responsible for some nest failures helpful in identifying areas with higher potential risk (Guppy et al. 2017). While nest predation has been [Correction added on 12 July 2021, after first online publica- shown to account for 89% of contemporary regent tion: the text ‘were associated positively with local blossom honeyeater nest failures where the cause of failure is abundance’ has been removed from the preceding sentence.] discernible (Crates et al. 2019a), not all nest failures © 2021 Ecological Society of Australia doi:10.1111/aec.13075
10    D . G A U T S C H I ET AL.

in our database can be attributed to predation events.     nest predators in real time at active nest sites, the
Other documented causes of nest failure for Aus-           rarity of the regent honeyeater prevented us from
tralian woodland birds include high winds and dis-         doing so.
ease (Fulton 2019b), and any regent honeyeater nests
that failed due to these reasons could further obscure
the relationship between predator abundance and            Management and research recommendations
nest success.
   Other factors showed a stronger correlation with        Provided a sufficient sample size can be obtained,
regent honeyeater nest success than predator abun-         future studies would benefit from the collection of
dance. Nest success was significantly higher among          predator data from active regent honeyeater nest sites,
nests located in the outer crown, relative to nests        potentially at larger and more widely stratified spatial
located in the mid or inner sections of the crown.         scales. The abundance and widespread occurrence of
This relationship suggests that a nest’s position in the   nest predators in regent honeyeater breeding areas
outer crown reduces its susceptibility to nest preda-      emphasises the threat of nest predation facing the spe-
tion, possibly due to dense foliage on outer tree          cies and has management implications for future nest
limbs reducing visual detectability. A similar pattern     protection efforts. Of particular note were the high
has been recorded in other species, with nest con-         site-occupancy rates for nest predators such as the
cealment reducing predation by visual predators (e.g.      Australian magpie and glider species, for which no
Flaspohler et al. 2000; Colombelli-Negrel & Klein-        nest protection measures are currently implemented.
dorfer 2009). The presence of another active regent        To date, attempts to protect regent honeyeater nests
honeyeater nest within 100m was associated with            have involved the suppression of noisy miners and the
higher rates of nest success. Improved nest success        deployment of trunk collars to prevent possums and
rates near other active nests may reflect superior          monitor lizards from accessing nest trees (Regent hon-
resource availability at these sites or result from the    eyeater recovery team, unpublished data). Our find-
decreased individual effort expended on excluding          ings suggest that even if current nest protection
competitor species when other regent honeyeaters are       measures help reduce predation rates by these species,
present (Ford et al. 1993). Further monitoring of          there is a real risk of compensatory nest predation by
regent honeyeater breeding activity, localised breed-      other known predator species, as shown by Beggs
ing conditions and predator abundance at active            et al. (2019). Nest protection measures that account
nests may help in understanding the processes at           for threats posed by the entire predator community
play.                                                      would most effectively mitigate this risk (Smith et al.
                                                           2010). Such measures may include temporary removal
                                                           of gliders that cannot otherwise be prevented from
Study limitations                                          accessing nests (Stojanovic et al. in press) or imple-
                                                           menting deterrents to keep avian predators away from
Due to the sparsity of contemporary regent hon-            nest sites (Peterson & Colwell 2014). Large-scale
eyeater nest sites and the large number of known           habitat management that aims to reduce habitat suit-
nest predator species, some limitations to our survey      ability for predators presents another potential avenue
approach were unavoidable. In order to achieve a           for controlling elevated rates of nest predation (Laid-
sufficient sample of nests, we required data from           law et al. 2017). For regent honeyeaters, our results
five breeding seasons (2015–2019). Only 10% of the          suggest this could be achieved through restoration of
nests were active in 2019, meaning predator levels         shrubby understory vegetation and reducing grazing
may have changed between survey year and nesting           pressure from livestock. Whether such large-scale
year. In addition, the home ranges of many of the          habitat change can occur, and successfully suppress
predator species are likely to exceed the 50 m site        nest predation rates, in a time scale that can help pre-
radius used in our survey design (Cox & Bauer              vent extinction of regent honeyeaters is questionable
1997), violating the closure assumption which              (Bedward et al. 2009).
assumes that occupancy does not change between                Although regent honeyeater numbers have been
survey visits (Rota et al. 2009). However, we              declining for decades, only recently has increased
attempted to minimise closure violation by conduct-        emphasis been placed on developing standardised moni-
ing all repeat surveys in as short a time period as        toring, locating breeding sites and establishing a robust
possible (Rota et al. 2009). Furthermore, the use of       understanding of the causes of nesting failure (Crates
a 50 m site radius has been shown to be ecologi-           et al. 2019b). To inform management of threatened spe-
cally relevant for breeding regent honeyeaters, which      cies, there is a need to obtain high-quality monitoring
typically occupy small breeding territories during         data, and enigmatic threats call for ongoing investment
nesting (Crates et al. 2017a). Whilst our inferences       in monitoring and research (Robinson et al., 2018;
would be more robust if we were able to survey             Scheele et al. 2018). Our study provides a pertinent
doi:10.1111/aec.13075                                                       © 2021 Ecological Society of Australia
PREDATOR DISTRIBUTION AND NEST SUCCESS 11
warning that, if targeted monitoring and conservation predatory sugar glider in Tasmanian forests. Austral Ecol.
efforts are left too late, threatened species can decline to 43, 470–5.
Ball S. J., Ramsey D., Nugent G., Warburton B. & Efford M.
the extent that it becomes challenging to obtain robust
(2005) A method for estimating wildlife detection
evidence to help inform effective adaptive management probabilities in relation to home-range use: insights from a
to facilitate population recovery. field study on the common brushtail possum (Trichosurus
vulpecula). Wildl. Res. 32, 217–27.
Barton K. (2019) MuMIn: Multi-Model Inference. Available
ACKNOWLEDGEMENTS
from URL: https://cran.rproject.org/web/packages/MuMIn/
MuMIn.pdf.
This study was funded by the BirdLife Australia Bates D. & Maechler M. (2020) Package ‘lme4’. Linear mixed-
Twitchathon. All fieldwork was performed under effect models using ‘Eigen’ and S4. Available from URL:
Australian National University Animal Ethics Com- https://cran.r-project.org/web/packages/lme4/lme4.pdf.
mittee approval (A2019/16) and New South Wales Bedward M., Ellis M. V. & Simpson C. C. (2009) Simple
scientific licence #SL101965. We acknowledge the modelling to assess if offsets schemes can prevent
biodiversity loss, using examples from Australian
Traditional Custodians of the land on which our
woodlands. Biol. Cons. 142, 2732–42.
study took place. Beggs R., Pierson J., Tulloch A. I. T., Blanchard W., Westgate
M. J. & Lindenmayer D. (2019) An experimental test of a
AUTHOR CONTRIBUTION compensatory nest predation model following lethal
control of an overabundant native species. Biol. Cons. 231,
122–32.
Daniel Gautschi: Conceptualization (supporting); Berris K., Barth M., Mooney T. et al. (2018) From the brink of
Data curation (equal); Formal analysis (lead); Investi- extinction: successful recovery of the glossy black-cockatoo
gation (lead); Methodology (equal); Visualization on Kangaroo Island. In: Recovering threatened species: a book
(lead); Writing-original draft (lead). Robert Hein- of hope (eds S. Garnett, J. Woinarski, D. Lindenmayer & P.
sohn: Conceptualization (supporting); Supervision Latch). CSIRO publishing, Victoria, Australia.
Bjørnstad O. (2020) package ‘ncf’. Spatial Covariance
(supporting); Validation (lead); Writing-review & edit-
Functions. Available from URL: https://cran.r-project.org/
ing (supporting). Liam Murphy: Data curation (sup- web/packages/ncf/ncf.pdf.
porting); Investigation (supporting). Ross Crates: Burnham K. P., Anderson D. R. & Huyvaert K. P. (2011) AIC
Conceptualization (lead); Data curation (equal); For- model selection and multimodel inference in behavioral
mal analysis (supporting); Investigation (supporting); ecology: some background, observations, and comparisons.
Methodology (equal); Supervision (lead); Visualiza- Behav. Ecol. Sociobiol. 65, 23–35.
tion (supporting); Writing-review & editing (lead). Colombelli-Negrel D. & Kleindorfer S. (2009) Nest height,
nest concealment, and predator type predict nest predation
in superb fairy-wrens (Malurus cyaneus). Ecol. Res. 24,
FUNDING 921–8.
Commonwealth of Australia (2016) National recovery plan for
This work was funded by the BirdLife Australia the Regent Honeyeater (Anthochaera phrygia). Canberra,
Australia: Department of Agriculture Water and the
Twitchathon. This paper has been approved by ANU
Environment.
Animal Ethics Experimentation Committee and con- Cox S. & Bauer J. (1997) Species interactions between the
forms to the national guidelines for animal usage in White-winged Chough and Australian Magpie in a
research. fragmented landscape. Pac. Conserv. Biol. 3, 289–94.
Crates R., Olah G., Adamski M. et al. (2019b) Genomic
impact of severe population decline in a nomadic
CONFLICT OF INTEREST
songbird. PLoS One 14, e0223953.
Crates R., Rayner L., Stojanovic D., Webb M. & Heinsohn R.
We have no conflicts of interest to disclose. (2017b) Undetected Allee effects in Australia’s threatened
birds: implications for conservation. Emu-Aust. Ornithol.
117, 207–21.
DATA AVAILABILITY STATEMENT Crates R., Rayner L., Stojanovic D., Webb M., Terauds A. &
Heinsohn R. (2019a) Contemporary breeding biology of
Data are available upon request from the author. critically endangered regent honeyeaters: implications for
Data are sensitive because they involve regent hon- conservation. The Ibis 161, 521–32.
Crates R., Terauds A., Rayner L. et al. (2017a) An occupancy
eyeater breeding locations. R Scripts are provided in
approach to monitoring regent honeyeaters. J. Wildl.
supporting documentation. Manag. 81, 669–77.
Davitt G., Maute K., Major R. E., Mcdonald P. G. & Maron
M. (2018) Short-term response of a declining woodland
REFERENCES bird assemblage to the removal of a despotic competitor.
Ecol. Evol. 8, 4771–80.
Allen M., Webb M. H., Alves F., Heinsohn R. & Stojanovic Debus S. J. S. (2006) The role of intense nest predation in the
D. (2018) Occupancy patterns of the introduced, decline of scarlet robins and eastern yellow robins in
© 2021 Ecological Society of Australia doi:10.1111/aec.1307512 D . G A U T S C H I ET AL.
remnant woodland near Armidale, New South Wales. Pac. Mac Nally R., Parkinson A., Horrocks G., Conole L. & Tzaros
Conserv. Biol. 12, 279–87. C. (2001) Relationships between terrestrial vertebrate
Fasiolo M. & Nedellec R. (2020) Package ‘mcgViz’. diversity, abundance and availability of coarse woody
Visualisations for generalised additive models. Available debris on south-eastern Australian floodplains. Biol. Cons.
from URL: https://cran.r-project.org/web/packages/mgcViz/ 99, 191–205.
index.html. MacKenzie D. I., Nichols J. D., Sutton N., Kawanishi K. &
Fiske I. & Chandler R. (2011) Unmarked: an R package for Bailey L. L. (2005) Improving inferences in population
fitting hierarchical models of wildlife occurrence and studies of rare species that are detected imperfectly.
abundance. J. Stat. Softw. 43, 1–23. Ecology 86, 1101–13.
Flaspohler D. J., Temple S. A. & Rosenfield R. N. (2000) Major R. E., Christie F. J. & Gowing G. (2001) Influence of
Relationship between nest success and concealment in two remnant and landscape attributes on Australian woodland
ground-nesting passerines. J. Field Ornithol. 71, 736–47. bird communities. Biol. Cons. 102, 47–66.
Ford H. A. (2011) The causes of decline of birds of eucalypt Martin T. E. (1993) Nest predation and nest sites. Bioscience
woodlands: advances in our knowledge over the last 10 43, 523–32.
years. Emu 111, 1–9. Martin T. E. (1995) Avian life history evolution in relation to nest
Ford H., Davis W. E., Debus S., Ley A., Recher H. & sites, nest predation, and food. Ecol. Monogr. 65, 101–27.
Williams B. (1993) Foraging and aggressive behaviour of Mayfield H. F. J. (1975) Suggestions for calculating nest
the Regent Honeyeater Xanthomyza phrygia in northern success. Wilson Bull. 87, 456–66.
New South Wales. Emu-Aust. Ornithol. 93, 277–81. Mcelhinny C., Gibbons P., Brack C. & Bauhus J. (2006)
Fulton G. R. (2018) Avian nest predation in Australian Fauna-habitat relationships: a basis for identifying key
temperate forest and woodland: a review. Pac. Conserv. stand structural attributes in temperate Australian eucalypt
Biol. 24, 122–33. forests and woodlands. Pac. Conserv. Biol. 12, 89–110.
Fulton G. R. (2019a) Meta-analyses of nest predation in Oliver D. L., Ley A. J. & Williams B. (1998) Breeding success
temperate Australian forests and woodlands. Austral Ecol. and nest site selection of the Regent Honeyeater
44, 389–96. Xanthomyza phrygia near Armidale, New South Wales.
Fulton G. R. (2019b) Nest ecology of a threatened woodland Emu - Austral Ornithol. 98, 97–103.
avifauna. PhD thesis, University of Queensland, Brisbane. Palmer G. C. & Bennett A. F. (2006) Riparian zones provide
Guppy M., Guppy S., Marchant R., Priddel D., Carlile N. & for distinct bird assemblages in forest mosaics of south-
Fullagar P. (2017) Nest predation of woodland birds in east Australia. Biol. Cons. 130, 447–57.
south-east Australia: importance of unexpected predators. Peterson S. A. & Colwell M. A. (2014) Experimental evidence
Emu-Aust. Ornithol. 117, 92–6. that scare tactics and effigies reduce corvid occurrence.
Heinsohn R., Webb M., Lacy R., Terauds A., Alderman R. & Northwestern Nat. 95, 103–12.
Stojanovic D. (2015) A severe predator-induced Phillips S. & Callaghan J. (2011) The Spot Assessment
population decline predicted for endangered, migratory Technique: a tool for determining localised levels of
swift parrots (Lathamus discolor). Biol. Cons. 186, 75–82. habitat use by koalas (Phascolarctos cinereus). Aust. Zool. 35,
Higgins P. J. (2006) Handbook of Australian, New Zealand & 774–80.
Antarctic birds. Vol. 7, Boatbill to starlings. P. B, Dunnock R Core Team (2020) R: A language and environment for
to starlings. Oxford University Press, Oxford. statistical computing. Vienna, Austria: R Foundation for
How T., Carthew S. & Tap P. (2004) A comparison of survey Statistical Computing. https://www.R-project.org/.
techniques for detecting possums and gliders in forest Reitsma L., Holmes R. & Sherry T. (1990) Effects of removal
patches in southern Australia. of red squirrels, Tamiasciuris hudsonicus, and eastern
Iban
~ ez-Alamo J., Magrath R. D., Oteyza J. et al. (2015) Nest chipmunks, Tamas striatus, on nest predation in a northern
predation research: recent findings and future perspectives. hardwood forest: an artificial nest experiment. Oikos 57,
J. Ornithol. 156, 247–62. 375–80.
Johnson D. H., Jones S. & Geupel G. (2007) Estimating nest Remes V., Matysiokova B. & Cockburn A. (2012) Long-term
success: A guide to the methods. Stud. Avian Biol. 34, 65. and large-scale analyses of nest predation patterns in
Kvistad L., Ingwersen D., Pavlova A., Bull J. K. & Sunnucks Australian songbirds and a global comparison of nest
P. (2015) Very low population structure in a highly mobile predation rates. J. Avian Biol. 43, 435–44.
and wide-ranging endangered bird species. PLoS One 10, Robertson H., Rod Haty J., Saul E. & Mccormack G. (1994)
e0143746. Recovery of the kakerori: an endangered forest bird of the
Laake J. (2019) Package ‘RMark’. R code for Mark analysis. Cook Islands. Conserv. Biol. 8, 1078–86.
Available from URL: https://cran.r-project.org/web/package Robinson N. M., Scheele B. C., Legge S. et al. (2018) How to
s/RMark/index.html. ensure threatened species monitoring leads to threatened
Laidlaw R., Smart J., Smart M. & Gill J. (2017) Scenarios of species conservation. Ecol. Manag. Res. 19, 222–9.
habitat management options to reduce grazing pressure on Rota C. T., Fletcher R. J. Jr, Dorazio R. M. & Betts M. G.
nesting waders. J. Appl. Ecol. 54, 1219–29. (2009) Occupancy estimation and the closure assumption.
Lawler J., Campbell S., Guerry A., Kolozsvary M., O’Connor R. J. Appl. Ecol. 46, 1173–81.
& Seward L. (2002) The scope and treatment of threats in Scheele B. C., Legge S., Armstrong D. P. et al. (2018) How to
endangered species recovery plans. Ecol. Appl. 12, 663–7. improve threatened species management: an Australian
Legendre P. (1993) Spatial autocorrelation: Trouble or new perspective. J. Environ. Manage. 223, 668–75.
paradigm? Ecology 74, 1659–73. Smith A. & Murray M. (2003) Habitat requirements of the
Leo B. & Manley S. (2018) Capturing crows for the protection squirrel glider (Petaurus norfolcensis) and associated
of threatened and endangered shorebird species. Wildl. possums and gliders on the New South Wales central
Soc. Bull. 42, 643–8. coast. Wildl. Res. 30, 291–301.
doi:10.1111/aec.13075 © 2021 Ecological Society of AustraliaPREDATOR DISTRIBUTION AND NEST SUCCESS 13
Smith R. K., Pullin A. S., Stewart G. B. & Sutherland W. J. Appendix S1. R Script used for statistical analysis.
(2010) Effectiveness of predator removal for enhancing Appendix S2. Habitat and detection covariates
bird populations. Conserv. Biol. 24, 820–9.
recorded in surveys of regent honeyeater nest preda-
Stojanovic D., Owens G. & Heinsohn R. (In press). Evaluation
of lethal control of introduced sugar glider as a tool to
tors in the Capertee and Goulburn River Valleys.
relieve bird nest predation. Appendix S3. Logistic regression of the relationship
Stojanovic D., Webb M. H., Alderman R., Porfirio L. L. & between predator-community measures and regent
Heinsohn R. (2014) Discovery of a novel predator reveals honeyeater nest fate within the Capertee Valley and
extreme but highly variable mortality for an endangered Goulburn River from 2015 to 2019 (n = 115).
migratory bird. Divers. Distrib. 20, 1200–7. Appendix S4. Summary of the most parsimonious
Taylor G., Ewen J. G., Clarke R. H., Blackburn T. M.,
logistic regression model of regent honeyeater nest
Johnson G. & Ingwersen D. (2018) Video monitoring
reveals novel threat to Critically Endangered captive-bred fate within the Capertee Valley and Goulburn River
and released Regent Honeyeaters. Emu – Aust. Ornithol. from 2015 to 2019 (n = 115). Significant effects
118, 304–10. defined as P < 0.05 are shown in bold.
Val J., Eldridge D., Travers S. & Oliver I. (2018) Livestock Appendix S5. The five most parsimonious models
grazing reinforces the competitive exclusion of small-bodied of regent honeyeater daily nest survival rate (DSR)
birds by large aggressive birds. J. Appl. Ecol. 55, 1919–29. ranked by AICc. The model we considered to be
Watson D. M. & Herring M. (2012) Mistletoe as a keystone
most parsimonious, based on delta AICc and num-
resource: an experimental test. Proc. Royal Soc. B Biol. Sci.
279, 3853–60. ber of terms, is highlighted in bold. Akaike weight
Wayne A. F., Cowling A., Rooney J. F. et al. (2005a) Factors (wi) refers to the weight of each model within the (5)
affecting the detection of possums by spotlighting. Western most parsimonious models.
Aus. Wildlife Res. 32, 689–700. Appendix S6. Summary of the most parsimonious
Wayne A. F., Cowling A., Ward C. G. et al. (2005b) A model of regent honeyeater daily nest survival rate
comparison of survey methods for arboreal possums in
(DSR). Covariates / factor levels where beta 2 x
jarrah forest. Western Aus. Wildlife Res. 32, 701–14.
Wood S. (2019) Package ‘mgcv’. Mixed GAM computation
SE does not overlap 0 are show in bold. N/A indi-
vehicle with automatic smoothness esimation. Available cates that a value is not applicable as the covariate is
from URL: https://cran.r-project.org/web/packages/mgcv/ not a factor.
mgcv.pdf. Appendix S7. Detection rates of nest predator spe-
cies at survey sites in regent honeyeater breeding
areas within the Capertee Valley and Goulburn
SUPPORTING INFORMATION
River.
Additional supporting information may/can be found
online in the supporting information tab for this article.
© 2021 Ecological Society of Australia doi:10.1111/aec.13075You can also read