Multiple maternal risk management adaptations in the loggerhead sea turtle (Caretta caretta) mitigate clutch failure caused by catastrophic storms ...
←
→
Page content transcription
If your browser does not render page correctly, please read the page content below
www.nature.com/scientificreports
OPEN Multiple maternal
risk‑management adaptations
in the loggerhead sea turtle
(Caretta caretta) mitigate clutch
failure caused by catastrophic
storms and predators
Deby L. Cassill
Maternal risk-management, an extension of r/K selection, is an indispensable tool for understanding
the natural selection pressures that shape the evolution of reproduction. Central to the construct of
maternal risk-management is its definition of reproductive success as replacement fitness (w = 2), the
survival of one breeding daughter to replace the female and one outbreeding son to replace her mate.
Here, I apply maternal risk-management as a theoretical framework to explain multiple reproductive
adaptations by loggerhead sea turtles nesting on a barrier island off the southern coast of Florida,
US, from 1988 to 2004. Extrapolated over a 30-year reproductive span, nesting females averaged
4000–4500 eggs. I show that, rather than “putting all their eggs in one basket,” females divided eggs
into 40 clutches of variable size (50–165 eggs). To deposit clutches, females migrated to the barrier
island 10–12 times at unpredictable intervals of 2–8 years. Each nesting season, females deposited
1–7 clutches over diversified time intervals at diversified locations on the beach. Despite devastating
clutch losses caused by ten catastrophic hurricanes, hundreds of erratic thunderstorms and dozens of
predation events during this study, 72% of clutches produced by nesting females on this barrier island
were undisturbed—median hatching success for these clutches was an astonishing 92%. I conclude
that diversified maternal investments over time and space by nesting females are reproductive
adaptations that have successfully offset clutch losses, thus enabling populations of loggerhead
females to meet or exceed their reproductive goal of replacement fitness.
Reproduction is a fundamental process of biological systems. All organisms exist as a result of females repopulat-
ing ecosystems with the next generation of offspring. The majority of theories on the evolution of reproductive
processes are optimality models with highly constrained assumptions that limit broad application1–3. In contrast,
maternal risk-management, an empirical, bioeconomic model, reverses the top-down methodology of optimal-
ity models4. Central to the construct of maternal risk-management are three irrefutable facts: (1) in high-risk
environments, breeding females overproduce offspring (i.e., Malthusian theory); (2) males diversify the offspring
produced by females (i.e., sexual reproduction); (3) the vast majority of offspring perish before reaching sexual
maturity (i.e., natural selection theory). According, to maternal risk-management, the reproductive goal of
breeding females is replacement fitness (w = 2), the survival of at least one breeding daughter to replace her and
at least one outbreeding son to replace her mate. Because replacement fitness is a constant, it applies universally
to breeding females regardless of species, genus, family, order, class, or phylum. Depending on rates of mortality
among their offspring, some breeding females fail to meet replacement fitness (w = 0). Other females meet or
exceed replacement fitness (w ≥ 2). Across generations, populations evolve as changing environments selectively
terminate the vast majority of offspring before they mature and reproduce.
Maternal risk-management generates a “map” displaying reproductive adaptations that mitigate offspring
mortality by natural-selection processes (Fig. 1). With the maternal risk-management map as a unifying
Department of Integrative Biology, USF, St. Petersburg campus, St. Petersburg, FL 33701, USA. email: cassill@
usf.edu
Scientific Reports | (2021) 11:2491 | https://doi.org/10.1038/s41598-021-81968-0 1
Vol.:(0123456789)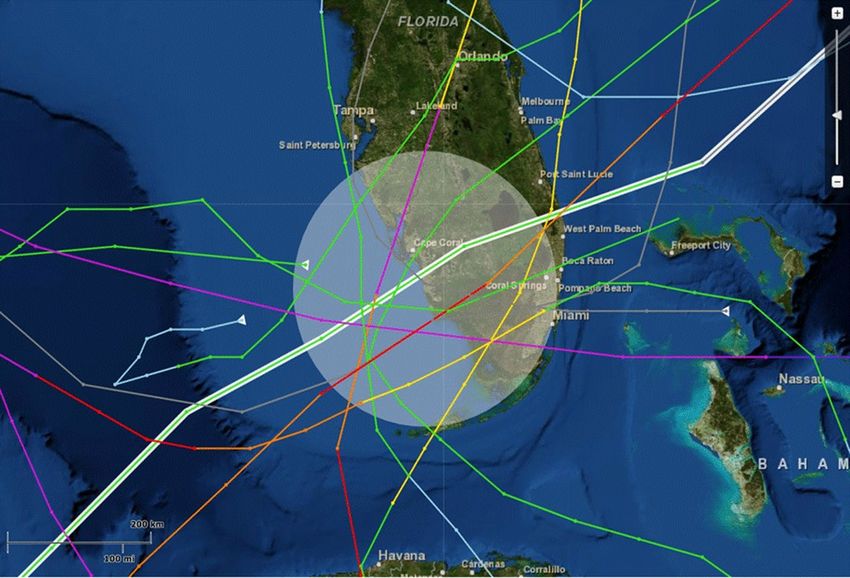
www.nature.com/scientificreports/
Figure 1. Maternal risk-management model (modified with p ermission4). The reproductive goal of breeding
females is replacement fitness (w = 2). (a) Environments with a high probability of offspring starvation during
seasonal cycles of scarcity select for females that invest in extended maternal care to a small number of offspring
in temporary family units until offspring are capable of foraging or migrating on their own. Most birds and
mammals are scarcity-selected species. (b) Environments with a high probability of offspring mortality by a
combination of predation and starvation during seasonal cycles of scarcity select for the fusion of family units
into hierarchical societies. During cycles of scarcity, those inside the margins provide resources to those at
the margins to keep them alive and close at hand. During periods of high predation or invasions, those at the
margins form a protective shield for those inside the margins. Additionally, those at the margins, the “canary
in the coal mine,” are indicators of environmental toxins or infectious disease. Mammal societies and insect
societies are convergent-selected species. (c) Environments with a high probability of offspring mortality by
predation, disease or catastrophes select for females that overproduce, investing in large numbers of offspring.
The loggerhead sea turtle is a predation–catastrophe-selected species. (d) Low-risk environments with low
probabilities of predation or starvation select for females that invest in small number of precocial offspring that
disperse at hatch or birth. The sand tiger shark is a weak-selected species.
theoretical framework, we can explore the cost–benefit of divergent, species-specific adaptations that offset
offspring mortality such as: capital breeders vs income breeders; oviparity versus viviparity; semelparity versus
iteroparity; one-at-a-time versus thousands of offspring per breeding event; altricial versus precocial behavior of
offspring at hatch or birth; equal versus skewed offspring s ize5,6; monogamy versus polygamy–polyandry–prom-
iscuity; physical versus non-physical competitions for territories and mates; abandonment versus extended
parental care; equal versus skewed sex ratio, and sexual reproduction versus parthenogenesis. Other reproductive
adaptations include age of sexual maturity and reproductive longevity.
Among vertebrates, the dominant offspring-delivery system is oviparity, whereby females produce and expel
amniotic eggs before embryonic development b egins7. Eggs represent a significant investment by females to
nourish the fertilized ovum through its growth and development from zygote to embryo to hatchling.
In oviparous birds and reptiles, the amniotic egg is a vessel containing the fertilized ovum, surrounded by
layers of membrane-bound nutrients including yolk (composed of proteins, lipids, vitamins and minerals),
albumen (composed of water and proteins), two membranes that defend against bacterial invasion, and a pro-
tective shell that is permeable to oxygen, carbon dioxide, and water vapor. After hatchlings emerge from the
protective egg shell, extended maternal care occurs in nearly all bird species8 and is present among a number
of reptile-groups9–11. However, extended maternal care of hatchlings is absent in one group of marine reptiles,
the sea turtles.
Abandonment of clutches after eggs have been deposited is a highly-conserved reproductive adaptation in
turtles, originating among the Testudines during the mid-Jurassic period, 174 million years ago12–18. Without
extended care of eggs after they are deposited, females must deposit egg clutches on coastal beaches in semitrop-
ical-to-tropical regions with temperatures capable of supporting embryo growth and development inside the
egg vessel19–22. Once hatchlings emerge from their subterranean nest and scuttle to the open sea, their survival
depends on locating a suitable foraging area in tropical waters as well as finding refuge from p redators23,24. Until
recently, the probability of adult mortality was limited to d isease25,26 and large s harks27. Today however, anthro-
pogenic bycatch and pollution amplify the mortality of sea turtles at all stages of development from hatchlings
to adults28–32.
Scientific Reports | (2021) 11:2491 | https://doi.org/10.1038/s41598-021-81968-0 2
Vol:.(1234567890)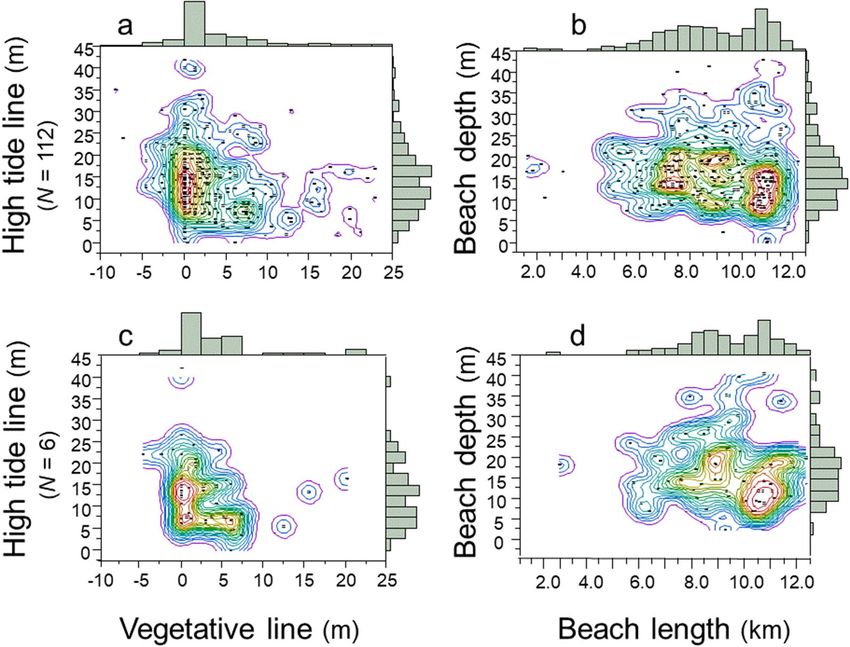
www.nature.com/scientificreports/
Nesting females of the loggerhead sea turtle, Caretta caretta, are iteroparous breeders with a reproductive
lifespan of 30 years19. At unpredictable intervals, females and males migrate to a mating area. The mating system
is promiscuous and appears to be consensual during the period of time in which a female is sexually receptive
to courtship by males33–39. After persistent interactions, males mount receptive females by clasping the edges
of a female’s carapace with a single large claw on each flipper. Once attached to the female’s carapace, the male
curves his tail under the female’s carapace and probes with his penis until he achieves penetration of the female’s
cloaca40. Ovulation occurs only after the successful transmission of sperm by one or more m ales41. After the
mating season is over, females migrate to their natal beach area; males return to foraging a reas19,42–46.
For a large animal with long, tapered limbs designed for long-distance navigation across seas and oceans,
nesting on a coastal beach is an arduous task for loggerhead f emales47. Upon emerging from the sea, each female
crawls up the beach toward the higher-sloped, line of vegetation. Once a nest-site is selected, she excavates a
large body pit using her fore-flippers. Then, using only her back flippers, she excavates a smaller pit into which
dozens of eggs are expelled. Thereafter, females refill the pit with sand, re-shape and smooth the surface, and then
camouflage the body pit by flipping layers of sand and debris until the surface is less noticeable47. In its entirety,
nesting takes 30–120 min before the female abandons the clutch and returns to the s ea19. During each nesting
season, females deposit multiple clutches at intervals of 2–3 weeks over a 2–3 month nesting period48–50. Once
their reproductive task is completed, females abandon their natal beach area and migrate back to foraging areas.
Along the coasts of Florida, US, the spring-to-fall nesting and hatching season of the loggerhead sea turtle
overlaps with the spring-to-fall thunderstorm and hurricane season51. Torrential thunderstorms and tidal surges
suffocate eggs in flooded sediment52. Strong currents and eroding beaches caused by catastrophic hurricanes
and severe storms wash clutches out to sea53. In addition, storms expose clutches to desiccation54 and predators,
including raccoons, domestic dogs, coyotes, sea birds, fish, ghost crabs and fire ants55–60. How do nesting log-
gerhead females offset the loss of clutches to severe storms and predators after clutches are abandoned?
Maternal risk-management classifies the loggerhead sea turtle as is a predation-catastrophe-selected species
that must overproduce offspring to offset high rates of mortality (see Fig. 1). Because the relative size of offspring
at dispersal is a small fraction of female size (egg size/female size), the model predicts that the probability of
starvation is not a major source of offspring mortality. In contrast, because the number of eggs per clutch or per
lifetime is relatively large, the model predicts that the probability of offspring mortality by predation is moder-
ately high (1—w/number of eggs per clutch or per lifetime). Predation and storms are the primary sources of
offspring mortality for eggs and hatchlings on the beach. Once hatchlings enter the oceanic environment, the
risk of predation is again high.
What are the reproductive adaptations that offset the loss of egg clutches to storms and predator for the log-
gerhead sea turtle? Here, I present a long-term study, 1988–2004, on the maternal investments by loggerhead
females nesting on a barrier island off the southern coast of Florida, US. The identities of the population of 112
loggerhead females and the fate of their 690 clutches were monitored and recorded every nesting season for
17 years. Hence, this study presents a rare opportunity to characterize the reproductive behaviors by individual
females and the fate of their clutches over multiple, consecutive nesting seasons.
The first objective of this study was to characterize the patterns of storms on the barrier island and the impact
of storms and predators on the hatching success of clutches deposited on the island over 17 nesting seasons. The
second objective was to characterize the maternal investments by loggerhead females over 17 nesting seasons.
The third objective was to determine which of a female’s investment strategies was most successful in mitigating
clutch failure caused by storms and predators after clutches were deposited and abandoned.
Results
In this first section, I report the frequency of hurricanes during the 17-year study and the impact of hurricanes
and predators on clutch-hatching success.
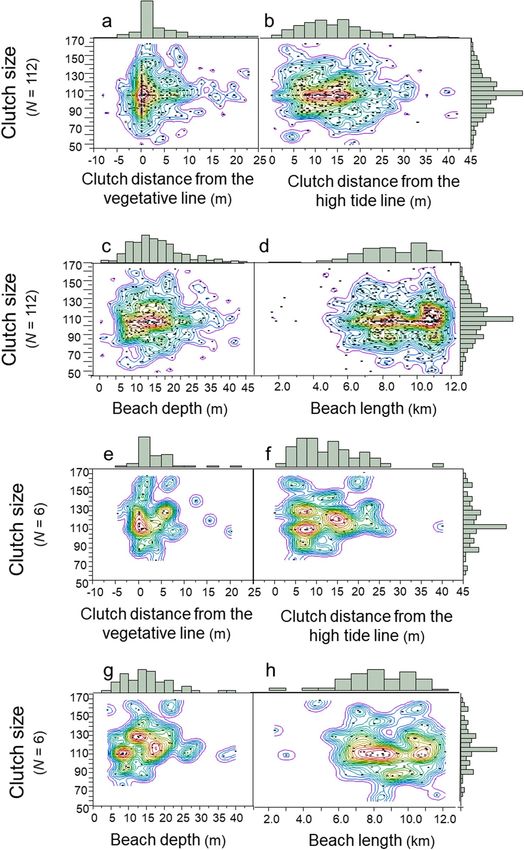
Pattern and impact of hurricanes on clutch‑hatching success, 1988–2004. Ten hurricanes swept
over the Gulf coast of south Florida, affecting the barrier island beaches during six of this 17-year study. Hurri-
cane Andrew struck southern Florida in August 199261; Hurricane Erin and Opal struck in August and October
1995; Hurricane Georges struck in September 1998; Hurricane Irene struck in October 1999; Hurricane Gabri-
elle struck in September 2001; and Hurricanes Charley, Frances, Ivan, and Jeanne struck in August and Septem-
ber, 2004 (Fig. 2).
To assess the probability that individual females would nest during a season with hurricanes, I report the
frequency of nesting seasons and the number of years between nesting seasons (i.e., remigration intervals)
by females that migrated to the barrier island at least four times during the 17-year study (N = 6). For these
individuals, remigration intervals ranged from 2 to 7 years with a median of 3 years (Fig. 3a). The number of
times a female nested on the barrier island during a season with hurricanes ranged from 1 to 3. The number of
times a female nested during a season without hurricanes ranged from 2 to 5. Remigration intervals per female
were unpredictable, ranging from 2 to 8 years with a median of 3 years. As a result, the total number of females
nesting each year on the barrier island was unpredictable, varying from 26 to 77 with a mean of 45 females per
year (Fig. 3b).
To what extent did storms and predators impact clutch-hatching success? For the population of females, pred-
ators, flooding, and washout significantly reduced clutch-hatching success (Fig. 4a–c; Multi-factor Chi-Square
Approximation: χ24,607 = 139.45; R2 = 0.45; p < 0.0001; N = 112 females). Storms accounted for 89.3% of explained
variation in low clutch-hatching success; predation accounted for 10.7%. For the individual females, the patterns
of hatching success or failure were comparable to that of the population of females (Fig. 4d–f; N = 6 females).
Scientific Reports | (2021) 11:2491 | https://doi.org/10.1038/s41598-021-81968-0 3
Vol.:(0123456789)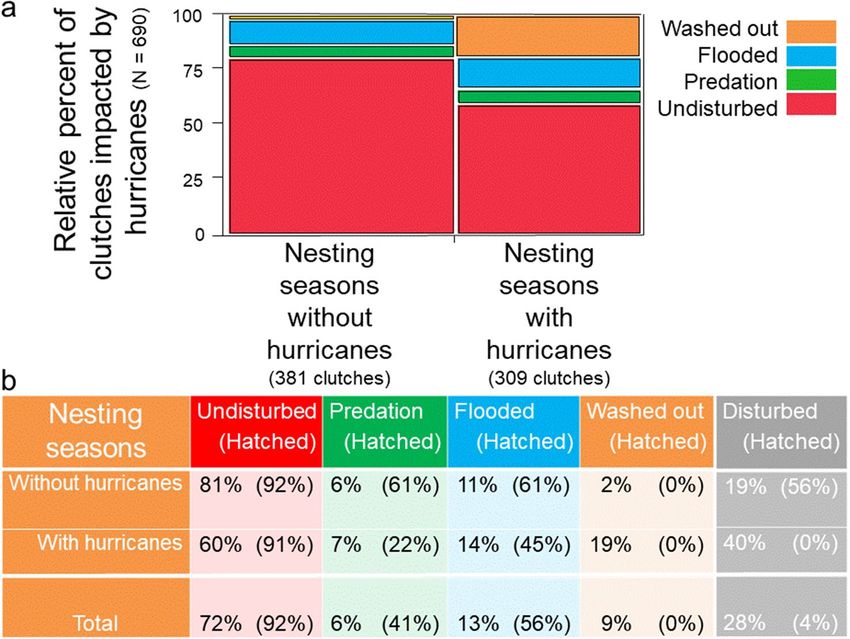
www.nature.com/scientificreports/
Figure 2. Path of hurricanes affecting the Gulf coast of south Florida, US, 1992–2004. This map was configured
using NOAA’s Historical Hurricane Tracks, a free online tool developed by the NOAA Office for Coastal
Management in partnership with NOAA’s National Hurricane Center and National centers for Environmental
Information https://oceanservice.noaa.gov/news/historical-hurricanes/.
Figure 3. Remigration intervals and nesting seasons with hurricanes, 1988–2004. (a) Patterns of nesting
seasons on the barrier island per individual (N = 6 females). (b) Number of females nesting each year on the
barrier island (N = 112 females).
Scientific Reports | (2021) 11:2491 | https://doi.org/10.1038/s41598-021-81968-0 4
Vol:.(1234567890)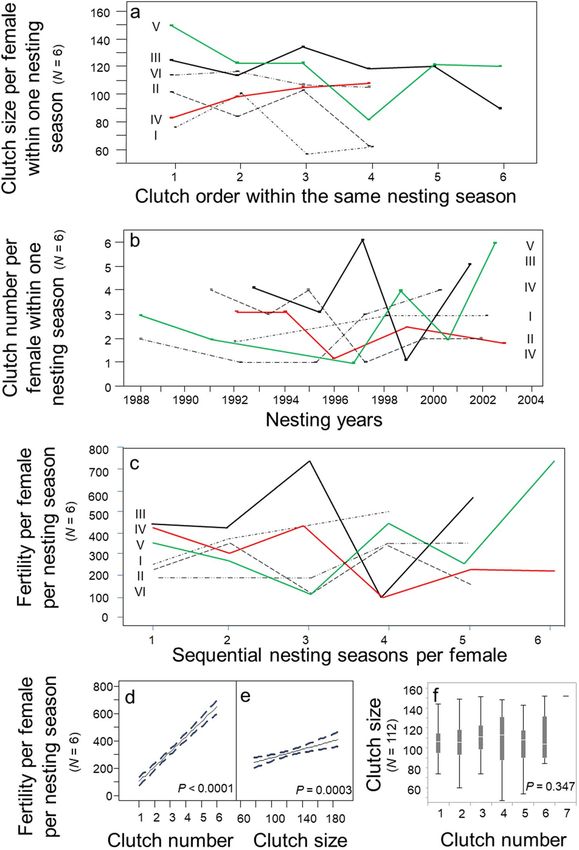
www.nature.com/scientificreports/

                                  Figure 4.  Clutch-hatching success relative to environmental risk factors, 1988–2004. (a) Clutch-hatching
                                  success by storms (N = 112 females). (b) Clutch-hatching success by predation (N = 112 females). (c) Clutch-
                                  hatching success by years with hurricanes (N = 112 females). (d) Clutch-hatching success by storms (N = 6
                                  females). (e) Clutch-hatching success by predation (N = 6 females). (f) Clutch-hatching success by years with
                                  hurricanes (N = 6 females).

                                     How do nesting females mitigate clutch failure? In the second section, I report patterns in maternal invest-
                                  ments, spatial investments and temporal investments by loggerhead females at the population and individual
                                  levels.

                                  Patterns of maternal, spatial and temporal investments by nesting females, 1988–2004.                             For
                                  ease of reference, reproductive investments by loggerhead females were grouped into three categories (Table 1):
                                  (1) Maternal investments included mate number, clutch size (number of eggs deposited per clutch), number
                                  of clutches produced per nesting season, and fertility (the sum of eggs deposited among multiple clutches per
                                  female per nesting season). (2) Spatial investments included migration routes per nesting season, clutch loca-
                                  tion on the beach (nest-site selection per clutch), clutch distance from the vegetative line, clutch distance from
                                  the high-tide line, the depth of the beach, distance along the length of the beach from a permanent marker,
                                  distance between clutches along the beach, and nest depth. (3) Temporal investments included nesting month,
                                  clutch intervals (number of days between clutch oviposition within the same nesting season), and remigration
                                  intervals.
                                      For a detailed analysis of fertility patterns, six females were selected from the population for which long-term
                                  maternal investments were available. Clutch size per female varied unpredictably within a single nesting season
                                  (Fig. 5a). The number of clutches produced per female per nesting season varied unpredictably over multiple nest-
                                  ing seasons (Fig. 5b). Female fertility within a nesting season varied unpredictably over multiple nesting seasons
                                  (Fig. 5c). The number of clutches was a stronger predictor of fertility per nesting season (Fig. 5d; Regression:
                                  R2 = 0.87; p < 0.0001; N = 112 females) than clutch size (Fig. 5e; Regression: R2 = 0.14; p = 0.042; N = 112 females).
                                  The number of clutches per nesting season accounted for 87% of explained variation in fertility per nesting sea-
                                  son; clutch size accounted for the remainder. Lastly, clutch size and the number of clutches per nesting season
                                  were independent maternal investment strategies (Fig. 5f; ANOVA: F6,268 = 1.12; p = 0.347; N = 112 females).
                                      I extrapolated information from the six aforementioned females and estimated that, over a 30-year reproduc-
                                  tive lifespan, loggerhead females would produce an average of 4223 eggs divided into an average of 40 clutches.
                                  Nesting females would migrate to the barrier island to nest a total of 12 times with an interval averaging 3 years
                                  between migrations. Each nesting season, females would produce an average of three-to-four clutches over
                                  2–3 months with an average of 105 eggs per clutch.

Scientific Reports |   (2021) 11:2491 |                https://doi.org/10.1038/s41598-021-81968-0                                                     5

                                                                                                                                                 Vol.:(0123456789)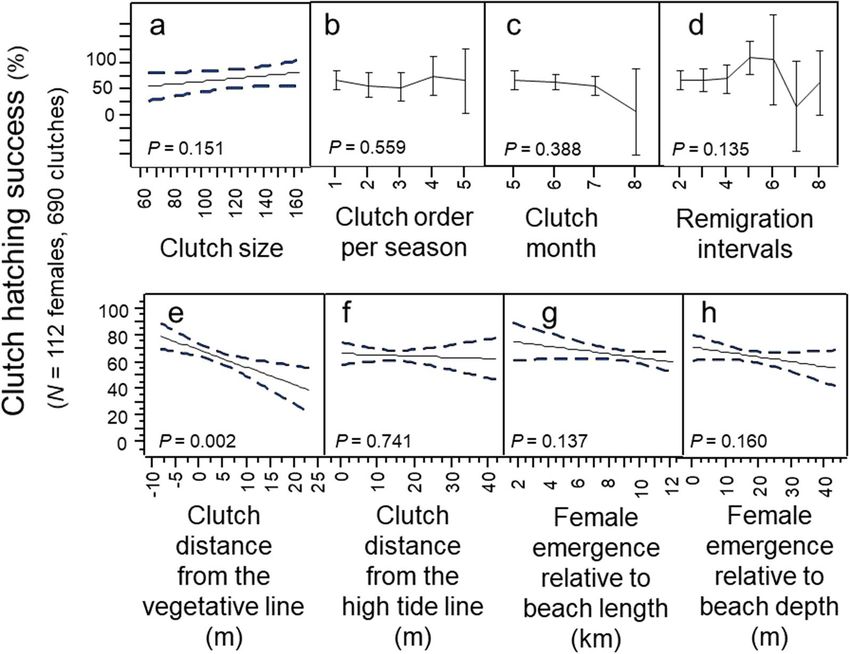
www.nature.com/scientificreports/
Range Mean
Maternal investment adaptations
1 Mate number34,39,62,63 1–7 males 2.6
2 Clutch size 47–165 105
3 Number of clutches per nesting season 1–7 3
Fertility per nesting season (total egg num-
4 193–733 289
ber per female per nesting season)
Spatial investment adaptations
5 Migration routes to mating areas35,37 Variable
6 Clutch distance from the vegetative line (m) − 8.2–22.9 1.2
7 Clutch distance from the high tide line (m) 0.0–41.8 17.0 m
8 Clutch deposition by depth of beach (m) 6.1–43.0 17.0 m
9 Clutch deposition along the beach (km) 1.5–12.2 9.0 m
Distance between clutches along the beach
10 258–1953 732 m
(m)
64–66
11 Nest depth (cm) 35–55 NA
Temporal investment adaptations
12 Nesting season (month) April–August June
Clutch intervals per nesting season (number
13 10–32 15
of days)
14 Remigration intervals (number of years) 2–8 3
Table 1. Maternal-investments, spatial investments, and temporal investments by nesting females in the
loggerhead sea turtle, C. caretta, 1988–2004. As noted, data on mate number, migration routes and nest depth
were from other studies.
When searching for nest sites on the beach, females emerge from the water and crawl up the beach toward the
vegetative line, perpendicular to the high-tide line. For a detailed analysis of clutch locations within and among
nesting seasons, I selected one female with a record of six nesting seasons from 1988 to 2003. Rather than cluster-
ing clutches on the beach, this female dispersed the location of clutches within and across nesting seasons (Fig. 6).
Density contour maps show the diversified location of clutches relative to their distance from the vegeta-
tive line, the high-tide line, beach depth, and the length of the beach. I identified four regions that I refer to as
“Goldilocks zones” within which the majority of clutches were deposited by the population of loggerhead females
on this barrier island. The high-tide Goldilocks zone was 5–20 m of the high-tide line, within which 73.5% of
clutches were deposited; the vegetative Goldilocks zone was a narrow ± 5 m of the vegetative line, within which
64.7% of clutches were deposited (Fig. 7a; N = 112 females). The beach-depth Goldilocks zone was a broad area
of 5–25 m, within which 84.3% of clutches were deposited; the beach-length Goldilocks zone was a lengthy
area from 6–13 km, within which 94.0% of clutches were deposited (Fig. 7b; N = 112 females). The Goldilocks
zones for individual females were similar in pattern to those for the population of females (Fig. 7c,d; N = 6
females). Thus, the dispersed spatial distribution of clutches by females at the population level were emergent
properties of the dispersed spatial distribution of clutches by individual females.
Do females deposit larger clutches inside the Goldilocks zones and smaller clutches outside the Goldilocks
zones? For the population of females, clutch size was independent of clutch location relative to the vegetative
line, the high-tide line, beach depth and beach length (Fig. 8a–d; Multivariate model: F3,384 = 2.44; R2 = 0.02;
p = 0.064; N = 112 females). Clutch size and clutch location by individuals were similar in pattern to that of the
population (Fig. 8e–h; N = 6 females, 88 clutches). In total, the diversified patterns of clutch size and nest-site
selection at the population level were emergent properties of the diversified patterns of clutch size and nest-site
selection at the individual level.
In the third and final section, I report whether or not females modified maternal, spatial, or temporal invest-
ments during nesting seasons with hurricanes. In addition, I report the impact of maternal, spatial, and temporal
investments on clutch-hatching success. Lastly, I compare the impact of nesting seasons with hurricanes on the
number of clutches that were disturbed by predation, flooding, or washout.
Impact of maternal, temporal, and spatial investments on clutch hatching success, 1988–
2004. Nesting females did not modify clutch size or the number of clutches during nesting seasons with
hurricanes (t-test: t-ratio = 0.07; p = 0.946; Pearson: χ2 = 2.27; p = 0.893; N = 690). Nesting females did not modify
the month of clutch production during nesting seasons with hurricanes (Pearson: χ2 = 2.30; p = 0.317). Nest-
ing females did not modify clutch location by depth of beach during nesting seasons with hurricanes (t-test:
t-ratio = 1.54; p = 0.122). Nesting females did not modify the distance of clutches from the vegetative line, or
the distance of clutches from the high-tide line during nesting seasons with hurricanes (t-test: t-ratio = 0.07;
p = 0.946; t-ratio = 1.36; p = 0.172). Lastly, the number of nesting females on the barrier island did not differ dur-
ing nesting seasons with hurricanes (Chi Square Approximation: χ2 = 0.54; p = 0.462). In total, nesting females
did not modify maternal, temporal, or spatial investments in anticipation of hurricanes.
Scientific Reports | (2021) 11:2491 | https://doi.org/10.1038/s41598-021-81968-0 6
Vol:.(1234567890)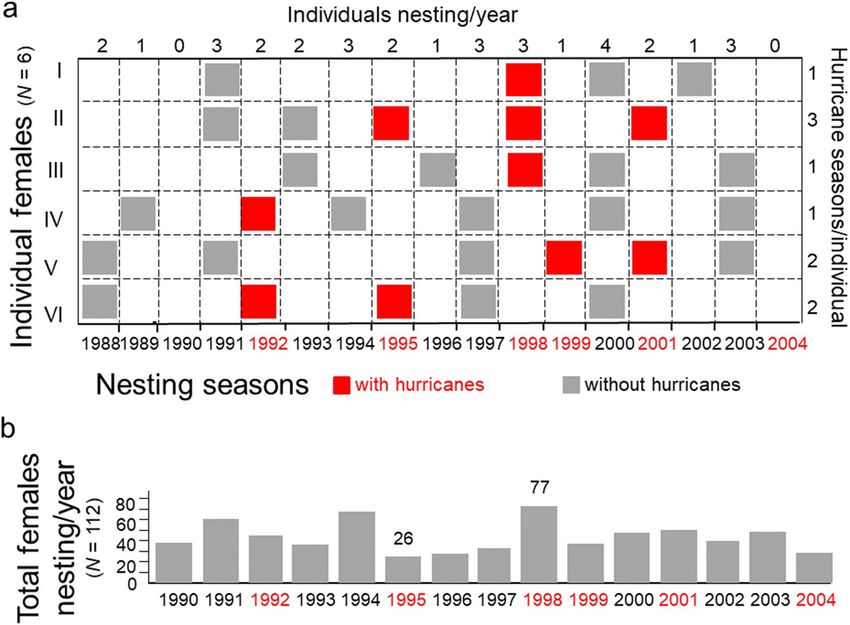
www.nature.com/scientificreports/
Figure 5. Temporal investments in fertility, 1988–2004. (a) Clutch size per female within a single nesting
season (N = 6 females). (b). The number of clutches deposited per female within a single nesting season (N = 6
females). (c) Fertility per female per nesting season (N = 6 females). (d) Fertility by the number of clutches
per female per nesting season (N = 6 females). (e) Fertility by clutch size per female per nesting season (N = 6
females). (f) Clutch size by number of clutches per nesting season (N = 112 females).
Maternal investments in fertility were not a significant predictor of clutch-hatching success (Regression:
R2 = 0.005; p = 0.715; N = 6 females). For example, a highly-fertile female (N = 5568 egg per lifetime) experienced
low clutch-hatching success (53.1%), whereas a low-fertility female (N = 2822 eggs per lifetime) experienced
high clutch-hatching success (87.1%). The number of surviving hatchlings for these two females was 2957 and
2458 respectfully.
Clutch-hatching success did not differ significantly by clutch size, clutch order, clutch month, or remigration
intervals (Fig. 9a–d; Multi-factor Chi-Square Approximation: χ213,126 = 5.24; R2 = 0.11; p = 0.256; N = 112 females).
Scientific Reports | (2021) 11:2491 | https://doi.org/10.1038/s41598-021-81968-0 7
Vol.:(0123456789)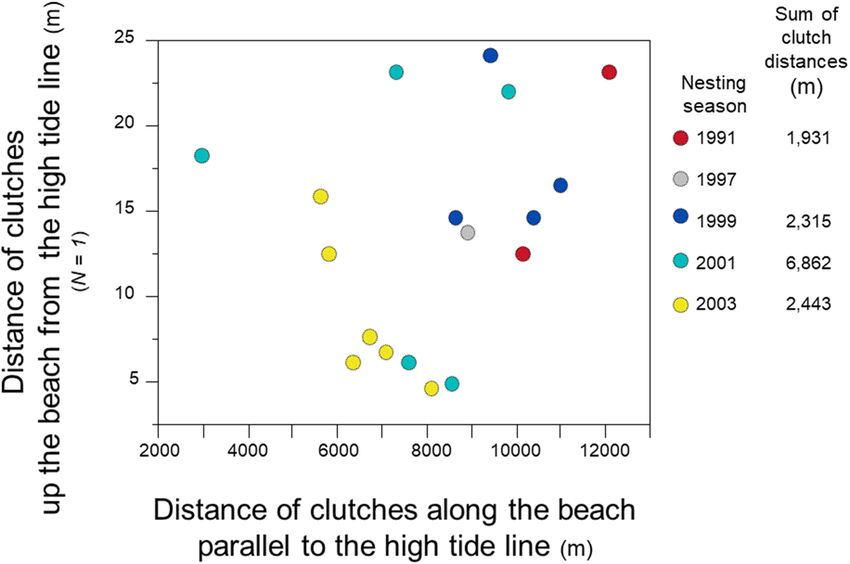
www.nature.com/scientificreports/

                                            Figure 6.  Nest-site selection, 1991–2003, N = 1 female. Distance of clutches from each other, deposited by one
                                            female within and among five nesting seasons. Data for clutch locations in 1988 were not available. In 1991, only
                                            one clutch for this female was observed and recorded.

                                            Figure 7.  Density of nest-site selection, 1988–2004. (a) Distribution of clutches inside and outside the
                                            vegetative and high-tide Goldilocks zones (N = 112 females). (b) Distribution of clutches inside and outside
                                            the beach-depth-and-length Goldilocks zones (N = 112 females). (c) Distribution of clutches inside and
                                            outside the vegetative and high-tide Goldilocks zones (N = 6 females). (d) Distribution of clutches inside and
                                            outside the beach-depth-and-length Goldilocks zones (N = 6 females). These are JMP Pro15 density contour
                                            maps; the warm-colored contour lines delineate the Goldilocks zones.

          Scientific Reports |   (2021) 11:2491 |                https://doi.org/10.1038/s41598-021-81968-0                                                  8

Vol:.(1234567890)
www.nature.com/scientificreports/
Figure 8. Clutch size by nest-site selection, 1988–2004. (a) Distribution of clutch size inside and outside the
vegetative Goldilocks zone (N = 112 females). (b) Distribution of clutch size inside and outside the high-tide
Goldilocks zone (N = 112 females). (c) Distribution of clutch size inside and outside the beach-depth Goldilocks
zone (N = 112 females). (d) Distribution of clutch size inside and outside the beach-length Goldilocks zone
(N = 112 females). (e) Distribution of clutch size inside and outside the vegetative Goldilocks zone (N = 6
females). (f) Distribution of clutch size inside and outside the high-tide Goldilocks zone (N = 6 females). (g)
Distribution of clutch size inside and outside the beach-depth Goldilocks zone (N = 6 females). (h) Distribution
of clutch size inside and outside the beach-length Goldilocks zone (N = 6 females). These are JMP Pro 15 density
contour maps.
Scientific Reports | (2021) 11:2491 | https://doi.org/10.1038/s41598-021-81968-0 9
Vol.:(0123456789)www.nature.com/scientificreports/
Figure 9. Clutch-hatching success by maternal, temporal, and spatial investment patterns, 1988–2004, N = 112
females. (a) Clutch-hatching success by clutch size. (b) Clutch-hatching success by the order in which clutches
were deposited. (c) Clutch-hatching success by the month in which clutches were deposited. (d) Clutch-hatching
success by remigration intervals. (e) Clutch-hatching success by clutch distance from the vegetative line. (f)
Clutch-hatching success by clutch distance from the high-tide line. (g) Clutch-hatching success by the location
of a female’s emergence relative to beach length. (h) Clutch-hatching success by the location of a female’s
emergence relative to beach depth.
Hatching success did not differ significantly based on clutch distance from the high-tide line, beach depth or
beach length; and although hatching success differed significantly based on clutch distance from the vegetative
line this variable accounted for only 2.6% of explained variation in hatching success (Fig. 9e–h; Multivariate
model: F3,377 = 4.05; R2 = 0.03; p = 0.007; N = 112 females).
To further investigate clutch-hatching success relative to the vegetative Goldilocks zone, I classified the
bimodal distribution of clutch-hatching success into two categories: high-hatch clutches (80–100% of eggs
hatched); and failed clutches (0–20% of eggs hatched). I found that 63% of clutches inside the vegetative Goldi-
locks zone experienced high-hatch compared to 50% of clutches outside the zone. In addition, just over 16% of
clutches inside the vegetative Goldilocks zone experienced clutch failure compared to 33% of clutches outside
the zone.
Lastly, I show that the 1995 and 2004 hurricane seasons were particularly devastating for clutches on this bar-
rier island. High numbers of clutches were washed out, flooded or disturbed by predators (Fig. 10). Nevertheless,
across five of the nesting seasons that endured ten hurricanes, 60% of clutches remained undisturbed and experi-
enced a median hatching success exceeding 90%. For non-hurricane seasons, 81% of clutches were undisturbed,
with a median hatching success exceeding 90% (Fig. 11). In the final analysis, despite hurricanes, thunderstorms
and predators, the majority of clutches, 72%, experienced a median hatching success of 92%. Altogether, 66%
of hatchlings survived and made it to the Gulf of Mexico. During this 17-year study, mean hatching-success for
females ranged from 38 to 98%; no female experienced total reproductive failure.
Discussion
Reproduction is a key function that differentiates biotic from abiotic systems. Here, I report a study of reproduc-
tive investments by 112 loggerhead females that nested from 1988 to 2004 on a barrier island off the Gulf coast
of Naples, Florida, US. Assuming a 30-year reproductive period for mature loggerhead sea turtles, I show that
nesting females remigrated to the barrier island every two-to-eight years, averaging a total of 12 nesting sea-
sons during their reproductive l ifespan49–51. Females produced approximately 4200 eggs, dividing them among 40
clutches. Contrary to a commonly held assumption, nesting females did not modify maternal, temporal or spatial
investments in anticipation of nesting seasons with hurricanes. Moreover, only one of the eight reproductive
Scientific Reports | (2021) 11:2491 | https://doi.org/10.1038/s41598-021-81968-0 10
Vol:.(1234567890)www.nature.com/scientificreports/
Figure 10. Clutch-hatching success relative to hurricane years, 1990–2004, N = 112 females. (a) the distribution
of clutch-hatching success for each nesting season was bimodal. (b) Average clutch-hatching success for each
nesting season.
Figure 11. Clutch fate, 1988–2004, N = 112 females. (a) Clutch fate relative to nesting seasons with hurricanes.
(b) Clutch fate and clutch-hatching success relative to nesting seasons with hurricanes. Percentages were
rounded.
Scientific Reports | (2021) 11:2491 | https://doi.org/10.1038/s41598-021-81968-0 11
Vol.:(0123456789)www.nature.com/scientificreports/
Conservancy of Southwest Florida variables
1 Female identification (Tag ID number)
2 Date of clutch oviposition (day, month, year)
3 Number of eggs per clutch (clutch size)
4 Number of eggs that hatched
5 Distance of clutch from the vegetative line (converted to meters)
6 Distance of clutch from the high tide line (converted to meters)
7 Distance of female emergence along the beach (converted to meters)
8 Depth of the beach at female emergence (converted to meters)
9 Clutch fate (washed out, flooded, disturbed by a predator)
Extrapolated variables
10 Clutch oviposition by month
11 Clutch oviposition by year
Clutch order (numeric sequence of clutches deposited per female per
12
nesting season)
13 Number of clutches deposited per female per nesting season
14 Number of nesting seasons per female
15 Remigration interval between nesting seasons per female
16 Clutch-hatching success (percent)
17 Presence or absence of hurricanes per nesting season (yes, no)
18 Clutch fate (disturbed, undisturbed)
19 Clutch fate by predation (yes, no)
20 Clutch fate by storms (washed out, flooded)
Table 2. Variables provided by the Conservancy of Southwest Florida and variables extrapolated for the study.
investment strategies mitigated clutch failure—fewer clutches failed when located inside the vegetative Goldilocks
zone than when located outside the zone.
Without the ability to modify clutch size, the number of clutches, the timing of clutch production or clutch
location on the beach in anticipate hurricanes, how did nesting females mitigate clutch losses. I show that nest-
ing females mitigated clutch losses by diversifying maternal, spatial and temporal investments in unpredictable
patterns. As a result of confronting unpredictable risks with an overproduction of eggs and a diversified distribu-
tion of those eggs over time and space, the total number of clutches impacted by storms and predators over this
17-year study was only 28%. In the final analysis, 72% of clutches were undisturbed and experienced a median
hatching success of 92%.
Although clutch-hatching success was bimodal, a small number of the disturbed clutches had an intermedi-
ate level of clutch-hatching success, averaging ~ 50%. Within the same nest, why did some eggs survive but not
others? I hypothesize that eggs deposited at the top of a nest are at lower risk of mortality from flooding events
than those at the bottom. Conversely, eggs deposited at the bottom of a nest are at a lower risk of mortality by
predation than those at the top. Apart from nest depth and sand characteristics of n ests64–66, little attention has
been given to the role of nest morphology and the ensuing survival of some hatchlings at the expense of others.
Further study is needed to confirm the role of nest morphology on intermediate levels of clutch-hatching success.
In total, I show that loggerhead females offset the loss of clutches to catastrophic storms and predators
with a series of innovative reproductive adaptations. First and foremost, to meet or exceed replacement fitness,
nesting females overproduced eggs. Thereafter, nesting females divided their lifetime production of eggs into
clutches of diversified size, deposited clutches in diversified numbers at widely-dispersed locations on the beach
at diversified intervals over multiple nesting seasons67,68. Although no single maternal investment strategy greatly
improved clutch-hatching success, when we take into account multiple, diversified reproductive adaptations, we
find that two-thirds of loggerhead sea turtle hatchlings made it to the Gulf of Mexico during this 17-year study.
Moreover, no female experienced total reproductive failure during this study.
In conclusion, sea turtles have persisted through several large-scale climate changes, including ocean warm-
ing similar in magnitude to the predicted levels of ocean warming over the next 50–100 years14–18,46,69–76. In a
cascade of consequences, as ocean warming increases, the number of severe storms will increase. Sea levels will
rise. With increased storms and rise of sea levels, a larger portion of clutches will be flooded or washed out as
beaches shift, erode, and d isappear77. As a larger portion of females fail to meet replacement fitness, loggerhead
sea turtle populations will decline. Without knowledge of the sea turtle’s survival and reproductive biology, we
cannot develop and implement effective conservation policies. Without the implementation of well-informed
conservation policies, sea turtles are likely to join the ichthyosaurs and plesiosaurs as a note in the annals of
extinct marine reptiles.
Scientific Reports | (2021) 11:2491 | https://doi.org/10.1038/s41598-021-81968-0 12
Vol:.(1234567890)www.nature.com/scientificreports/
Methods
The Conservancy of Southwest Florida provided the data on loggerhead females and their clutches nesting on
Keewaydin Island in the southern Gulf coast of Florida from 1988 to 2004. During the nesting and hatching
season from late April through October, staff patrolled the island every night from 21:00 to 5:00 to monitor and
record data on the entire nesting population of females and their clutches. After hatchlings emerged from the
nest, clutch size and hatching success per clutch were determined by counting the number of empty eggshells
and unhatched eggs. Hatchlings remaining in the nest were released into the Gulf. Predator type was determined
by observation of injury to the eggs, the presence of tracks on the sand or, in the case of fire ants and fly larvae,
the presence of the predator in the nest. After hatchlings had emerged, the remaining undeveloped eggs where
examined to determine cause of death, which most often was flooding. Of the 690 nests, 61 were relocated away
from the high tide line. Relocated clutches were included in the analyses of clutch size and the number of clutches,
and were blocked in hatching success analyses. Data from the Conservancy were used to produce a multitude
of other variables (Table 2). We did not account for the possibility that some females were interrupted in their
egg production, generating falsely small clutch sizes, or the possibility that a few females produced clutches on
nearby beaches, generating falsely lengthy remigration intervals or clutch intervals.
Data were analyzed using JMP Statistical Software. Density maps were composed using JMP’s quantile-den-
sity-contours function. Because the distribution for percent hatching success was bimodal, I reported “median”
hatching success rather than “mean”. For comparative analyses on skewed or bimodal data, I used non-parametric
tests. Frequency distributions were displayed as histograms. Regression, ANOVA, non-parametric Wilcoxon
tests, Pearson Chi Square tests, and mixed, multi-factor and multi-variable models were employed depending
on data type and the distribution’s normality and variance. Figures were generated using JMP Statistical Software
and PowerPoint. The hurricane map was generated from NOAA’s Historical Hurricane Tracks, a free online tool
that allows users to track historic hurricane tracks (https://oceanservice.noaa.gov/news/historical-hurricanes).
Animal welfare. Data were acquired by staff from the Conservancy of Southwest Florida program from
1988 through 2004. Staff collected data in accordance with relevant guidelines and regulations established by
NOAA and the Florida Fish and Wildlife Commission. No animals were harmed during the acquisition of these
data.
Data availability
Data from this study are available in Excel format upon request.
Received: 2 December 2019; Accepted: 11 January 2021
References
1. Cody, M. L. A general theory of clutch size. Evolution 1, 174–184 (1966).
2. MacArthur, R. H. & Wilson, E. O. The Theory of Island Biogeography (Princeton University Press, Princeton, 2001).
3. Smith, C. C. & Fretwell, S. D. The optimal balance between size and number of offspring. Am. Nat. 108, 499–506 (1974).
4. Cassill, D. L. Extending r/K selection with a maternal risk-management model that classifies animal species into divergent natural
selection categories. Sci. Rep. 9, 6111 (2019).
5. Cassill, D. L. & Watkins, A. The evolution of cooperative hierarchies through natural selection processes. J. Bioecon. 12, 29–42
(2010).
6. Cassill, D. L. Yoyo-bang: a risk-aversion investment strategy by a perennial insect society. Oecologia 132, 150–158 (2002).
7. Babin, P. J. Conservation of a vitellogenin gene cluster in oviparous vertebrates and identification of its traces in the platypus
genome. Gene 413, 76–82 (2008).
8. Cockburn, A. Prevalence of different modes of parental care in birds. Proc. R. Soc. B 273, 1375–1383 (2006).
9. Blackburn, D. G. Convergent evolution of viviparity, matrotrophy, and specializations for fetal nutrition in reptiles and other
vertebrates. Am. Zool. 32, 313–321 (1992).
10. Doody, J. S., Burghardt, G. M. & Dinets, V. Breaking the social: non-social dichotomy—a role for reptiles in vertebrate social
behavior research?. Ethology 119, 95–103 (2013).
11. Doody, J. S., Dinets, V. & Burghardt, G. M. The Secret Social Lives of Reptiles (Johns Hopkins University Press, Baltimore, 2021).
12. Joyce, W. G. A review of the fossil record of basal Mesozoic turtles. Bull. Peabody Mus. Nat. Hist. 58, 65–113 (2017).
13. Macdonald, F. A., Swanson-Hysell, N. L., Park, Y., Lisiecki, L. & Jagoutz, O. Arc-continent collisions in the tropics set Earth’s climate
state. Science 364, 181–184 (2019).
14. Zelenitsky, D. K., Therrien, F., Joyce, W. G. B. & Brinkman, D. First fossil gravid turtle provides insight into the evolution of
reproductive traits in turtles. Biol. Lett. 4, 715–718 (2008).
15. Lawver, D. R. & Jackson, F. D. A review of the fossil record of turtle reproduction: eggs, embryos, nests and copulating pairs. Bull.
Peabody Mus. Nat. Hist. 55, 215–236 (2014).
16. Lawver, D. R. & Jackson, F. D. A fossil egg clutch from the stem turtle Meiolania platyceps: implications for the evolution of turtle
reproductive biology. J. Vert. Paleon. 36, e1223685 (2016).
17. Lawver, D. R. & Jackson, F. D. An accumulation of turtle eggs with embryos from the Campanian (Upper Cretaceous) Judith River
Formation of Montana. Cretac. Res. 69, 90–99 (2017).
18. Ewert, M. A., Firth, S. J. & Nelson, C. E. Normal and multiple eggshells in batagurine turtles and their implications for dinosaurs
and other reptiles. Can. J. Zool. 62, 1834–1841 (1984).
19. Miller, J. D., Lutz, P. L. & Musick, J. A. Reproduction in sea turtles. Biol. Sea Turt. I, 51–82 (1997).
20. Ackerman, R. A. The nest environment and the embryonic development of sea turtles. Biol. Sea Turt. 1, 83–106 (1997).
21. Rees, A. F. & Margaritoulis, D. Beach temperatures, incubation durations and estimated hatchling sex ratio for loggerhead sea
turtle nests in southern Kyparissia Bay Greece. Testudo 6, 23–36 (2004).
22. Garmestani, A. S., Percival, H. F., Portier, K. M. & Rice, K. G. Nest-site selection by the loggerhead sea turtle in Florida’s Ten
Thousand Islands. J. Herpetol. 34, 504–510 (2000).
23. Mansfield, K. L., Wyneken, J., Porter, W. P. & Luo, J. First satellite tracks of neonate sea turtles redefine the ‘lost years’ oceanic niche.
Proc. R. Soc. B 281, 20133039 (2014).
24. Barton, B. T. & Roth, J. D. Implications of intraguild predation for sea turtle nest protection. Biol. Conserv. 141, 2139–2145 (2008).
Scientific Reports | (2021) 11:2491 | https://doi.org/10.1038/s41598-021-81968-0 13
Vol.:(0123456789)www.nature.com/scientificreports/
25. George, R. H. Health problems and diseases of sea turtles. Biol. Sea Turt. I, 363–385 (2017).
26. Aguirre, A. A. & Lutz, P. L. Marine turtles as sentinels of ecosystem health: is fibropapillomatosis an indicator?. EcoHealth 1,
275–283 (2004).
27. Heithaus, M. R., Wirsing, A. J., Thomson, J. A. & Burkholder, D. A. A review of lethal and non-lethal effects of predators on adult
marine turtles. J. Exp. Mar. Biol. Ecol. 356, 43–51 (2008).
28. Do Sul, J. A., Santos, I. R., Friedrich, A. C., Matthiensen, A. & Fillmann, G. Plastic pollution at a sea turtle conservation area in
NE Brazil: contrasting developed and undeveloped beaches. Estuar. Coasts 34, 814–823 (2011).
29. Wilcox, C., Puckridge, M., Schuyler, Q. A., Townsend, K. & Hardesty, B. D. A quantitative analysis linking sea turtle mortality and
plastic debris ingestion. Sci. Rep. 8, 1–1 (2018).
30. Domènech, F., Aznar, F. J., Raga, J. A. & Tomás, J. Two decades of monitoring in marine debris ingestion in loggerhead sea turtle,
Caretta caretta, from the western Mediterranean. Environ. Pollut. 244, 367–378 (2019).
31. Schuyler, Q. A. et al. Risk analysis reveals global hotspots for marine debris ingestion by sea turtles. Glob. Change Biol. 22, 567–576
(2016).
32. Lutcavage, M. E., Plotkin, P., Witherington, B., Lutz, P. L. & Musick, J. A. Human impacts on sea turtle survival. Biol. Sea Turt. I,
387–409 (1997).
33. Schroeder, B. A. Nesting patterns, reproductive migrations, and adult foraging areas of loggerhead turtles. Logger Sea Turtl. 40,
114–124 (2003).
34. Zbinden, J. A., Largiadèr, C. R., Leippert, F., Margaritoulis, D. & Arlettaz, R. High frequency of multiple paternity in the largest
rookery of Mediterranean loggerhead sea turtles. Mol. Ecol. 16, 3703–3711 (2007).
35. Hays, G. C., Fossette, S., Katselidis, K. A., Schofield, G. & Gravenor, M. B. Breeding periodicity for male sea turtles, operational
sex ratios, and implications in the face of climate change. Conserv. Biol. 24, 1636–1643 (2010).
36. Hays, G. C., Mazaris, A. D. & Schofield, G. Different male/female breeding periodicity helps mitigate offspring sex ratio skews in
sea turtles. Front. Mar. Sci. 19(1), 43 (2014).
37. Schofield, G. et al. Biodiversity research: fidelity to foraging sites, consistency of migration routes and habitat modulation of home
range by sea turtles. Divers. Distrib. 5, 840–853 (2010).
38. Wood, J. R. & Wood, F. E. Reproductive biology of captive green sea turtles Chelonia mydas. Am. Zool. 20, 499–505 (1980).
39. Soares, L. S. et al. Effects of hybridization on sea turtle fitness. Conserv. Genet. 19, 1311–1322 (2018).
40. Wood, F. G. Mating behavior of captive loggerhead turtles Caretta caretta. Copeia 1953, 184–186 (1953).
41. Manire, C. A., Byrd, L., Therrien, C. L. & Martin, K. Mating-induced ovulation in loggerhead sea turtles Caretta caretta. Zoo Biol.
27, 213–225 (2008).
42. Lohmann, K. & Lohmann, C. Acquisition of magnetic directional preference in hatchling loggerhead sea turtles. J. Exp. Biol. 190,
1–8 (1994).
43. Lohmann, K. J., Hester, J. T. & Lohmann, C. M. Long-distance navigation in sea turtles. Ethol. Ecol. Evol. 11, 1–23 (1999).
44. Light, P. H., Salmon, M. I. & Lohmann, K. J. Geomagnetic orientation of loggerhead sea turtles: evidence for an inclination compass.
J. Exp. Biol. 182, 1–10 (1993).
45. Frick, M. G., Williams, K. L., Bolten, A. B., Bjorndal, K. A. & Martins, H. R. Foraging ecology of oceanic-stage loggerhead turtles
Caretta caretta. Endanger Sp Res. 9, 91–97 (2009).
46. Pritchard, P. C. H., Lutz, P. L. & Musick, J. A. Evolution, phylogeny and current status. Biol. Sea Turt. I, 1–28 (1997).
47. Wyneken, J. Sea turtle locomotion: mechanisms behavior. Biol. Sea Turt. I, 165–198 (1997).
48. Miller, J. D., Limpus, C. J., & Godfrey, M. H. Nest-site selection, oviposition, eggs, development, hatching, and emergence of log-
gerhead turtles. Logger. Sea Turtle. 12, 51–81 (2003).
49. Tucker, A. D. Nest-site fidelity and clutch frequency of loggerhead turtles are better elucidated by satellite telemetry than by noc-
turnal tagging efforts: implications for stock estimation. J. Exp. Mar. Biol. Ecol. 383, 48–55 (2010).
50. Addison, D. S. Caretta caretta (Loggerhead sea turtle) nesting frequency. Herp. Rev. 27, 76 (1996).
51. Ross, J. P. Hurricane effects on nesting Caretta caretta. Mar. Turt. News 108, 13–14 (2005).
52. Kraemer, J. E. & Bell, R. Rain-induced mortality of eggs and hatchlings of loggerhead sea turtles (Caretta caretta) on the Georgia
coast. Herpetology 36, 72–77 (1980).
53. Van Houtan, K. S. & Bass, O. L. Stormy oceans are associated with declines in sea turtle hatching. Curr. Biol. 17, R590–R591 (2007).
54. Matsuzawa, Y., Sato, K., Sakamoto, W. & Bjorndal, K. Seasonal fluctuations in sand temperature: effects on the incubation period
and mortality of loggerhead sea turtle (Caretta caretta) pre-emergent hatchlings in Minabe Japan. Mar. Biol. 40, 639–646 (2002).
55. Stancyk, S. E., Talbert, O. R. & Dean, J. M. Nesting activity of the loggerhead turtle Caretta caretta in South Carolina, II. Protection
of nests from raccoon predation by transplantation. Biol. Conserv. 18, 289–298 (1980).
56. Moulis, R. A. Predation by the imported fire ant (Solenopsis invicta) on loggerhead sea turtle (Caretta caretta) nests on Wassaw
National Wildlife Refuge Georgia. Chelon. Conserv. Biol. 2, 433–436 (1997).
57. Drennen, D., Cooley, D. & Devore, J. E. Armadillo predation on loggerhead turtle eggs at two national wildlife refuges in Florida,
USA. Mar. Turt. News 45, 7–8 (1989).
58. Allen, C. R., Forys, E. A., Rice, K. G. & Wojcik, D. P. Effects of fire ants (Hymenoptera: Formicidae) on hatching turtles and preva-
lence of fire ants on sea turtle nesting beaches in Flor. Entomology 84, 250–253 (2001).
59. Donlan, E. M., Townsend, J. H. & Golden, E. A. Predation of Caretta caretta (Testudines: Cheloniidae) eggs by larvae of Lanelater
sallei (Coleoptera: Elateridae) on Key Biscayne Florida. Carib. J. Sci. 40, 415–420 (2004).
60. Stewart, K. R. & Wyneken, J. Predation risk to loggerhead hatchlings at a high-density nesting beach in Southeast Florida. Bull.
Mar. Sci. 74, 325–335 (2004).
61. Milton, S. L., Leone-Kabler, S., Schulman, A. A. & Lutz, P. L. Effects of Hurricane Andrew on the sea turtle nesting beaches of
South Florida. Bull. Mar. Sci. 54, 974–981 (1994).
62. Lasala, J. A., Harrison, J. S., Williams, K. L. & Rostal, D. C. Strong male-biased operational sex ratio in a breeding population of
loggerhead turtles (Caretta caretta) inferred by paternal genotype reconstruction analysis. Ecol. Evol. 3, 4736–4747 (2013).
63. Moore, M. K. & Ball, R. M. Jr. Multiple paternity in loggerhead turtle (Caretta caretta) nests on Melbourne Beach, Florida: a
microsatellite analysis. Mol. Ecol. 11, 281–288 (2002).
64. Marco, A., Abella, E., Martins, S., López, O. & Patino-Martinez, J. Female nesting behaviour affects hatchling survival and sex ratio
in the loggerhead sea turtle: implications for conservation programmes. Ethol. Ecol. Evol. 30, 141–155 (2018).
65. Foley, A. M., Peck, S. A. & Harman, G. R. Effects of sand characteristics and inundation on the hatching success per clutch of log-
gerhead sea turtle (Caretta caretta) clutches on low-relief mangrove islands in southwest Florida. Chelon. Conserv. Biol. 5, 32–41
(2006).
66. McGehee, M. A. Effects of moisture on eggs and hatchlings of loggerhead sea turtles (Caretta caretta). Herpetology 46, 251–258
(1990).
67. Hatase, H. & Tsukamoto, K. Smaller longer, larger shorter: energy budget calculations explain intrapopulation variation in remi-
gration intervals for loggerhead sea turtles (Caretta caretta). Can. J. Zool. 86, 595–600 (2008).
68. Hays, G. C. The implications of variable remigration intervals for the assessment of population size in marine turtles. J. Theor. Biol.
206, 221–227 (2000).
69. National Weather Service Forecast Office Tallahassee, Florida. Tallahassee, FL (weather.gov).
Scientific Reports | (2021) 11:2491 | https://doi.org/10.1038/s41598-021-81968-0 14
Vol:.(1234567890)www.nature.com/scientificreports/
70. Margaritoulis, D. Nesting activity and reproductive output of loggerhead sea turtles, Caretta caretta, over 19 seasons (1984–2002)
at Laganas Bay, Zakynthos, Greece: the largest rookery in the Mediterranean. Chelon. Conserv. Biol. 4, 916–929 (2005).
71. Spotila, J. R. Sea Turtles: A Complete Guide to Their Biology, Behavior, and Conservation (JHU Press, Baltimore, 2004).
72. Pike, D. A. Forecasting range expansion into ecological traps: climate-mediated shifts in sea turtle nesting beaches and human
development. Glob. Change Biol. 10, 3082–3092 (2013).
73. Hamann, M., Fuentes, M. M., Ban, N. C. & Mocellin, V. J. Climate change and marine turtles. Biol. Sea Turt. 51, 353 (2013).
74. Sydeman, W. J., Poloczanska, E., Reed, T. E. & Thompson, S. A. Climate change and marine vertebrates. Science 350, 772–777
(2015).
75. Van Houtan, K. S. & Halley, J. M. Long-term climate forcing in loggerhead sea turtle nesting. PLoS ONE 6, e19043 (2011).
76. Garcıía, A., Ceballos, G. & Adaya, R. Intensive beach management as an improved sea turtle conservation strategy in Mexico. Biol.
Conserv. 111, 253–261 (2003).
77. Dellert, L. J., O’Neil, D. & Cassill, D. L. Effects of beach renourishment and clutch relocation on the success of the loggerhead sea
turtle (Caretta caretta) eggs and hatchlings. J. Herpetol. 48, 186–187 (2014).
Acknowledgements
I thank USF undergraduates Jessica Schmidt, John Ervin, Samantha Ramdas, Nicole Cumming and Krista Abbott
for work on the pilot study. I thank Janet Capron, Audrey Ressler, Keith White, Joan Herrera, and Jan Akerberg
for comments and edits on multiple drafts of this manuscript. Lastly, for data from the Conservancy of Southwest
Florida’s long-term Keewaydin Sea Turtle Project, I thank Ron Mezich (1986–1989), David Addison (1990–2020)
and staff. Funding for the Keewaydin Sea Turtle Project was provided by the Cooperative Institute for Marine and
Atmospheric Studies, a Cooperative Institute of the University of Miami, the National Oceanic and Atmospheric
Administration cooperative agreement #NA17RJ126, and private donations from members and supporters.
Author contributions
D.L.C. authored the paper and completed all final analyses and figures.
Competing interests
The author declares no competing interests.
Additional information
Correspondence and requests for materials should be addressed to D.L.C.
Reprints and permissions information is available at www.nature.com/reprints.
Publisher’s note Springer Nature remains neutral with regard to jurisdictional claims in published maps and
institutional affiliations.
Open Access This article is licensed under a Creative Commons Attribution 4.0 International
License, which permits use, sharing, adaptation, distribution and reproduction in any medium or
format, as long as you give appropriate credit to the original author(s) and the source, provide a link to the
Creative Commons licence, and indicate if changes were made. The images or other third party material in this
article are included in the article’s Creative Commons licence, unless indicated otherwise in a credit line to the
material. If material is not included in the article’s Creative Commons licence and your intended use is not
permitted by statutory regulation or exceeds the permitted use, you will need to obtain permission directly from
the copyright holder. To view a copy of this licence, visit http://creativecommons.org/licenses/by/4.0/.
© The Author(s) 2021
Scientific Reports | (2021) 11:2491 | https://doi.org/10.1038/s41598-021-81968-0 15
Vol.:(0123456789)You can also read