Vulnerability Analysis of the Riumar Dune Field in El Garxal Coastal Wetland (Ebro Delta, Spain)
←
→
Page content transcription
If your browser does not render page correctly, please read the page content below
Journal of
               Marine Science
               and Engineering

Article
Vulnerability Analysis of the Riumar Dune Field in El Garxal
Coastal Wetland (Ebro Delta, Spain)
Inmaculada Rodríguez-Santalla * , Alejandro Díez-Martínez                            and Nuria Navarro

                                          Departamento de Biología, Geología, Física y Química Inorgánica, ESCET—Universidad Rey Juan Carlos,
                                          C/Tulipán s/n, 28933 Madrid, Spain; alexhogun@gmail.com (A.D.-M.); nuria.navarro@urjc.es (N.N.)
                                          * Correspondence: inmaculada.rodriguez@urjc.es

                                          Abstract: The aim of this work is to apply a vulnerability index in the dune field located in the Riumar
                                          urban zone at the mouth of the Ebro River. This dune field represents the natural barrier of the El
                                          Garxal coastal lagoon system. The index used integrates the dimensions of exposure, susceptibility,
                                          and resilience from the analysis of 19 variables. The results obtained show moderate susceptibility
                                          and high resilience, which are in line with the behavior of this dune field during the last sea storms
                                          (Gloria in January 2020 and Philomena in January 2021, among others) that have tested the capacity
                                          of this system to cope with the effects of these storms. Therefore, increasing the knowledge of the
                                          factors affecting the vulnerability of the dunes can be helpful in the management and conservation of
                                          these coastal environments.

                                          Keywords: dunar vulnerability index; dunar susceptibility; dunar resilience; coastal lagoon system


Citation: Rodríguez-Santalla, I.;         1. Introduction
Díez-Martínez, A.; Navarro, N.
                                               The systems formed by the coastal barriers and lagoons correspond to relatively
Vulnerability Analysis of the Riumar
                                          shallow areas that have been partially or completely isolated from the sea due to the
Dune Field in El Garxal Coastal
                                          development of spits or sand barriers caused by the wave and tide dynamics. Kjerfve [1]
Wetland (Ebro Delta, Spain). J. Mar.
                                          defines the coastal lagoon as an inland water body, usually oriented parallel to the coast,
Sci. Eng. 2021, 9, 601. https://
doi.org/10.3390/jmse9060601
                                          separated from the ocean by a barrier, connected to the ocean by one or more restricted
                                          inlets, and having depths that seldom exceed a couple of meters. Otvos [2] established
Academic Editor: Eugen Rusu               a coastal barriers classification according to the predominant processes and specifically
                                          defined the term barrier as emergent coastal-nearshore landform group represented by
Received: 24 April 2021                   shore-parallel elongated islands, often in chains, barrier spits, and mainland strandplains,
Accepted: 21 May 2021                     including chenier ridge clusters.
Published: 31 May 2021                         Furthermore, the coastal lagoons that remain protected represent areas of high eco-
                                          logical and environmental value. In these lagoons, there is a mixture between continental
Publisher’s Note: MDPI stays neutral      and marine water, representing environments with a great diversity of habitats and com-
with regard to jurisdictional claims in   munities, with an exceptional capacity as CO2 sinks [3], and they are considered sentinel
published maps and institutional affil-   ecosystems for global change by FAO [4].
iations.                                       The development and maintenance of the lagoon are associated with the persistence of
                                          the barrier that protects them. Precisely, among the main functions that Otvos [2] attributes
                                          to the barriers are that of harboring and protecting the ecological habitats against storm
                                          destruction.
Copyright: © 2021 by the authors.              Reinson [5] describes different sub-environments developed on a barrier island, in-
Licensee MDPI, Basel, Switzerland.        cluding the backshore dune deposit. The development of dune fields provides consistency,
This article is an open access article    and consequently provides greater protection to the back wetland. According to Rodríguez-
distributed under the terms and           Santalla [6], the dune systems are of great importance to the coastal areas because they
conditions of the Creative Commons        represent the best defense against strong waves produced by storms. Besides, from an eco-
Attribution (CC BY) license (https://     logical approach, the dunes are home to numerous plant species, and the habitat of several
creativecommons.org/licenses/by/          animal species. Its degradation and disappearance represent an enormous biodiversity
4.0/).

J. Mar. Sci. Eng. 2021, 9, 601. https://doi.org/10.3390/jmse9060601                                          https://www.mdpi.com/journal/jmse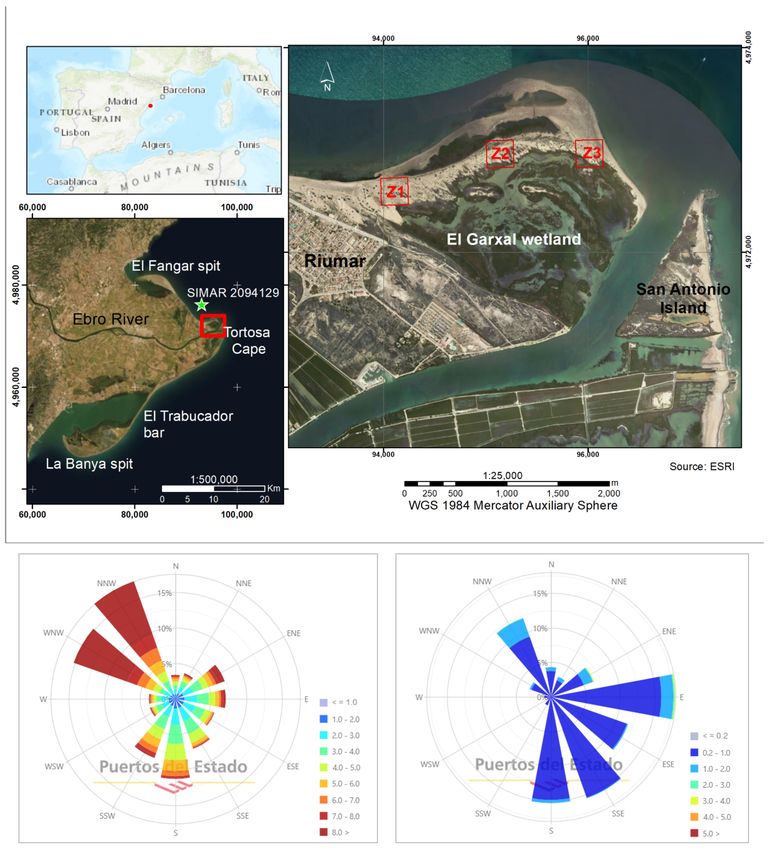
J. Mar. Sci. Eng. 2021, 9, 601                                                                                            2 of 15

                                 and ecosystem loss, whose functions and services can only be partially recovered and at a
                                 high economic cost through restoration programs [7].
                                      Given the important role of the coastal dunes in maintaining the coastline, several
                                 indexes have been developed [8–11], which analyze the vulnerability of dune fields in
                                 order to establish the factors that endanger their conservation. The vulnerability analyses
                                 of dunes integrate the interaction between aeolian and marine processes, geomorphology,
                                 vegetation, and human pressure [10]. García-Mora et al. [11] established an index (Dunar
                                 vulnerability index; DVI) that brings together a set of variables grouped into five groups:
                                 geomorphological conditions of the dune system (GCD), marine influence (MI), aeolian
                                 effect (AE), vegetation condition (VC), and human effect (HE). Finally, the DVI is computed
                                 as the unweighted average of the five partial vulnerability indexes.
                                      Although the DVI has been frequently used [7,12–16], an agreement on how many
                                 variables must be pooled into any vulnerability index and whether each variable should be
                                 weighted or not has still to be achieved [15]. García-Mora et al. [11] consider that a good
                                 index should be based on the minimum amount of necessary information. Accordingly,
                                 the index has been adapted to the environmental conditions where the dune fields are
                                 developed, such as the Atlantic coastal environments [11,17], the Mediterranean dune
                                 vulnerability index (MDVI) for sandy coasts [15], and the vulnerability index of arid beach–
                                 dune systems [16]. In this latter case, the variations introducing by Peña et al. [16] are
                                 related not only to the definition of variables but also to the way to express vulnerability
                                 from three analytical dimensions: exposure, susceptibility, and resilience. According to Smit
                                 and Wandel [18], vulnerability is a function of the exposure and sensitivity to hazardous
                                 conditions, and the ability, capacity, or resilience of the system to cope with, adapt, or
                                 recover from the effects of those conditions. Therefore, the function of the vulnerability
                                 index is to simplify several complex and interacting parameters, represented by diverse
                                 data types, to a more readily understood form and, therefore, has greater utility as a
                                 management tool [19].
                                      The purpose of this study is to apply a methodology based on the index of García-
                                 Mora et al. [11] and Peña et al. [16] that allows analyzing vulnerability in terms of exposure,
                                 susceptibility, and resilience of the dune field located in the mouth of the Ebro River,
                                 which protects the El Garxal wetland. This arrangement will determine the most sensitive
                                 variables towards its protection against increasingly frequent storm damage (e.g., storm
                                 Gloria in January 2020 or storm Philomena in January 2021) and allow the preservation of
                                 the El Garxal coastal lagoon system.

                                 2. Materials and Methods
                                 2.1. Study Area
                                       The El Garxal wetland is located in the final stretch of the mouth of the Ebro River, in
                                 the zone of the Riumar beach (Figure 1). This river has developed a delta, which constitutes
                                 one of the main areas in the Mediterranean basin. The left bank of the mouth of the river
                                 is one of the Ebro delta areas where accretion processes are most evident. In contrast, the
                                 Tortosa Cape is the most vulnerable zone of the delta to coastal erosion due to its exposition
                                 to the highest energetic and persistent waves coming from the East and NE. In fact, this
                                 area has recorded the most drastic geomorphologic changes in recent decades. Winds
                                 blowing from the NW are much stronger and generate a wind-driven littoral drift current
                                 flowing to the South, although the limited fetch generates not very energetic waves [20].
                                 The Ebro Delta has a microtidal regime, characterized by maximum astronomical and
                                 meteorological tides of 0.25 m and 1 m, respectively [21]. The coastline evolution has been
                                 studied by numerous researchers ([20–25], among others).
                                       The Ebro river delta has gone through quite different stages of development [24]. How-
                                 ever, the biggest and most abrupt changes occur contemporaneously with the construction
                                 of several dams during the 20th Century, particularly those of Mequinenza, Ribarroja, and
                                 Flix, in the lower reach of the Ebro River. Due to an intense river flooding episode in 1937, a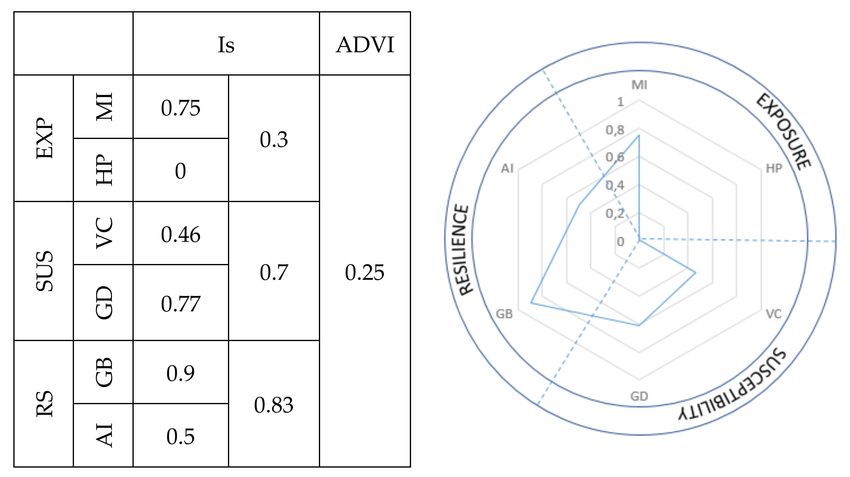
J. Mar. Sci. Eng. 2021, 9, 601                                                                                                 3 of 15

                                 new mouth was opened in 1937, which remains to this day [21]. The former mouth became
                                 almost inactive and by 1946 had been completely closed by sand deposition.

      Figure 1. Map showing the location of the El Garxal coastal wetland and the Riumar dune field. The red squares show the
      three sites selected (Z1, Z2, and Z3). The bottom left chart shows the Wind rose (average wind speed (m/s)), and the right
      chart, the Wave rose (significant wave height (m)) of SIMAR Point 2094129 (the green star in the left-hand graph). Period:
      2010–2018. Efficiency: 99.83%. Reproduced from Puertos del Estado (http://www.puertos.es/ (accessed on 2 March 2021)).
J. Mar. Sci. Eng. 2021, 9, 601 4 of 15
The contribution of sediments by the river, and the input of sediment arrived by the
main littoral drift transport, together with the protection against the waves that Cape
Tortosa offers, has favored the deposit of beach ridges that have stabilized while being
colonized by vegetation. Thus, this sector has prograded, giving rise to a more complex
barrier-lagoon system formed by the beach on the external coast, where the Riumar dune
system is installed, and the El Garxal coastal lagoon in the interior. An analysis of the
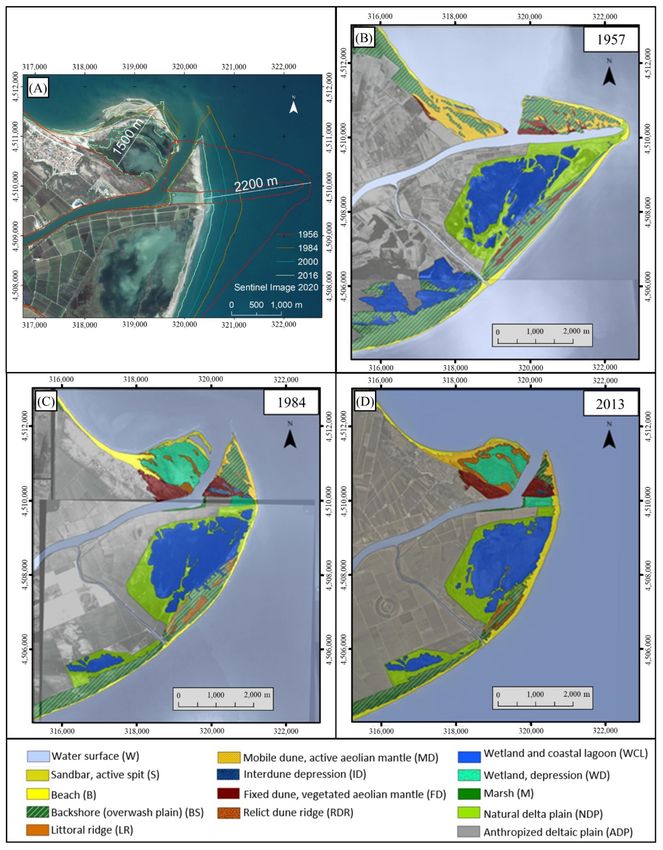
geomorphological changes identified in the Ebro River mouth was carried by Ramírez-
Cuesta et al. [20] (Figure 2). According to Otvos [2], the study zone corresponds to a Barrier
spit on which the dune field is developed.
Figure 2. (A) Coastal evolution of Ebro River mouth (coastal lines on Sentinel image T31TCF_20201101T105209_TCI).
(B–D) Geomorphological features evolution, reproduced from Ramírez-Cuesta et al. [20].J. Mar. Sci. Eng. 2021, 9, 601 5 of 15
The formation and evolution of these dune fields have been described by Sánchez-
García et al. [26], and Rodríguez-Santalla and Treviño [27]. The origin of the Riumar dune
field is related to changes in the river mouth. The sand of the dune comes from the mobile
dunes of El Fangar spit (in the north of Ebro delta), which is transported by the main wind
direction NW–SE. The orientation of the dune is consistent with the main wind direction.
Rodríguez-Santalla and Treviño [27] carried out a comparison of the amount of sediment
reached by the dune field between 2011 and 2016. The results showed an increase in
the dune field surface area and volume, as well as the maximum dune height reached.
Furthermore, an increase in deposits has been evidenced inside the El Garxal coastal lagoon
caused by the transfer of sediments from the dune towards the lagoon.
2.2. Data Set
The variables used have been derived from different sources: Digital elevation model
(DEM) from LiDAR data belonging to the Cartographic and Geologic Institute of Catalonia
(ICGC), with a density of 0.5 points/m2 ; and orthophotos from the National Geographic
Institute (IGN). The software used has been ArcGIS 10.x. The GIS constitutes a highly
valuable tool oriented to land management and planning [20,28]. In addition, sediment
samples taken from the dune have been analyzed to get the textural characteristics of
sediments.
The dune field has been extracted from LiDAR data. The base height of the dune was
established at 1 m above sea level. According to the degree of exposure of the dune, three
sites of 200 m × 200 m distributed along the dune system have been selected (Figure 1).
The tool Iso Cluster Unsupervised Classification of ArcGIS has been used to separate
the vegetation cover from the orthophoto of 2018 [29]. This method reclassifies the image
according to the number of classes defined by the user. In this study, two classes were
defined, on the one hand, the Riumar urban zone and bare sand, and on the other, the
vegetated surface.
In addition, the extension to ESRI ArcGIS DSAS has been used to analyze the coastal
evolution, which generates perpendicular transects to the reference baseline, measures
the distance between the baseline and each shoreline intersection along a transect, and
combines date information and positional uncertainty for each shoreline to calculate rate-
of-change statistics from multiple historical shoreline positions [30].
2.3. Definition of Variables
According to García Mora et al. [11], Ley et al. [7], and Peña-Alonso et al. [16], five
groups of variables have been identified, and another group was integrated (*): marine
influence (MI); human pressure (HP); characteristics of the vegetation cover (VC) geomor-
phology of the dune system (GD) and geomorphology of the beach (GB*); and aeolian
influence (AI). The choice of these variables has been conditioned by physical and geo-
morphology characteristics of the dune system, assuming as a fundamental principle to
use the minimum amount of necessary information [11]. The variables have been orga-
nized following the structure of Peña-Alonso et al. [16] to establish the exposure (EXP: MI
and HP), susceptibility (SUS: VC and GD), and resilience (RS: GB and AI) indicators. To
achieve this, it was necessary to divide the geomorphological variables into two categories:
geomorphology of the dune system and geomorphology of the beach. All variables have
been normalized between 0 to 4 values, where 0 implies the minimum and 4 the maximum
value (Table 1).
2.3.1. Marine Influence (MI)
The significant wave height (Hs) and the tidal range, both obtained from Grases
et al. [31] define the characterization of the marine influence. These factors determine the
sediment availability of the dune [7] and its seaward development, which is limited by
storm tide height that may cause undercutting of the dune face or washovers [11].J. Mar. Sci. Eng. 2021, 9, 601 6 of 15
2.3.2. Human Pressure (HP)
This factor takes into account the activities of the visitors and the managers. Accord-
ing to García Mora et al. [11] human impacts on coastal dunes can be temporary (e.g.,
pedestrian, vehicle, and animal trampling) or permanent roads, housing, parking, crops
and, forestry) depending on the activity or use developed in the dune field. The parameters
considered have been the pressure and frequency of visitors (from Ortells and Querol, [32])
and access difficulty, which is obtained from field observations of the presence of pedestrian
walkways over the dunes, information panels, and access controls.
2.3.3. Characteristics of the Vegetation Cover (VC)
The vegetation of coastal dunes plays an important role in stabilizing the surface
against wind erosion and provides a habitat for wildlife [7]. The coastal dune plants belong
to three specific functionally based types [10]:
Type I consists mainly of winter annuals, small size and are soft-leaved, with no
presumed adaptations to the dune environment, prone to wave erosion.
Type II is mostly perennials with a below-ground root network and leaves with
adaptations to coastal environmental stress.
Type III includes plants capable of being dispersed by seawater, which are able to
withstand burial. Types I and II can stand disturbance only.
The vegetation parameters considered have been the average vegetation cover and
the area with vegetation type II (the prevailing in the area). The calculation of the average
vegetation cover has been done on the three sites selected, considering formations greater
than 5 m2 , by the intersection between the vegetation cover and the shape with the sites.
The percentage of the area with vegetation was estimated from the dune system and the
vegetation cover for the three sites.
2.3.4. Geomorphology of the Dune System (GD)
The length and the width of the active dune system (both in km) were obtained from
LiDAR data.
Modal height (the average height of the dune system from the base to the top) was
previously established at 1 m AMSL. The dune height was obtained from LiDAR data
using some ArcGIS tools.
The particle size of the windward slope of the dune was obtained from the sieved in
the laboratory of sand samples collected during some field works in 2017 and 2020.
Relative surface with scarps or erosion: scarping is common on coastal dunes and
can be defined as basal erosion and undercutting of the stoss slope of a dune due to wave
attack or possibly stream and river erosion [33]. Although during fieldwork and in the
preliminary visual analysis of the orthophotos, no escarpment was observed in the entire
study area, a raster layer has been created with slope values greater than 50◦ . Additionally,
attention has been paid to the effects of the major storms that have occurred in recent
months (Gloria, in January 2020 and Filomena in January 2021).
The modal state of the beach is the most frequent morphology that a beach presents,
and there are two extreme states [7]: dissipative and reflective. The dissipative beach
presents high wave energy, a wide surf zone with one or more shore-parallel bars, and a
wide, low gradient intertidal beach composed of fine sand. The reflective beach shows low
wave energy, and a beach face with high slopes formed by coarser sediment. There is no
bar in surf zone. Intermediate states exist associates to open coasts, with moderate waves
and fine to medium sand, and present some bars.
2.3.5. Geomorphology of the Beach (GB)
The number of submerged or emerged beach ridges has been obtained from Rodríguez-
Martín and Rodríguez-Santalla [34].
The dry beach width has been calculated using the ArcGIS extension DSAS V5.0 [30].
The particle size of the dry beach sediment has been obtained from Grases et al. [31].J. Mar. Sci. Eng. 2021, 9, 601 7 of 15
In addition, the shoreline variation has been derived from the Net Shoreline Movement
(NSM) for the years 1998 and 2018 using DSAS extension for ArcGIS. The same tool was
used to obtain the dry beach surface variation.
2.3.6. Aeolian Influence (AI)
To obtain the sand supply input, an analysis of the volume variation was carried
out by comparing 2011 and 2016 MDTs using the cut and fill tool of ArcGIS, following
the methodology of Rodríguez-Santalla and Triviño-Monzón [27] and Rodríguez-Santalla
et al. [35].
Table 1. Variables considered that were reproduced from García Mora et al. [11], Ley et al. [7], and Peña-Alonso et al. [16].
All variables were normalized between 0 to 4 values, where 0 implies the minimum and 4 the maximum value. Legend: MI:
marine influence; HP: human pressure; VC: vegetation cover; GD: geomorphology of the dune system; GB: geomorphology
of the beach: AI: aeolian influence; EXP: exposure; SUS: Susceptibility; RS: Resilience.
Variables 0 1 2 3 4 Source
Waves Intensity (Hs) 1.25
MI [31]
Tidal range (m) 4
EXP Visitor pressure Low - Moderate - High
HP Visitor frecuency Low - Moderate - High Field/[32]
Access difficulty High - Moderate - Low
Average vegetation cover (m2 ) >230 1 >0.5 >0.1 2 1.5 to 2 1 to 1.5 0.5 to 1J. Mar. Sci. Eng. 2021, 9, 601 8 of 15
3. Results
Table 2 compiles the values achieved by each of the variables and for each of the three
areas considered (Z1, Z2, and Z3, Figure 1).
Table 2. Values assigned to each variable according to the results obtained in the analysis (Section 3.1)
for each of the three areas considered (Z1, Z2 and Z3). Legend: MI: marine influence; HP: human
pressure; VC: vegetation cover; GD: geomorphology of the dune system; GB: geomorphology of the
beach; AI: aeolian influence; EXP: exposure; SUS: Susceptibility; RS: resilience.
Variables Z1 Z2 Z3 Average
Waves Intensity (Hs) 4 4.00
MI
Tidal range (m) 2 2.00
EXP Visitor pressure 0 0.00
HP Visitor frecuency 0 0.00
Access difficulty 0 0.00
Average vegetation cover (m2 ) 3 1 1 1.67
VC Percentage of the area with vegetation
1 3 2 2.00
(Type II)
Active dune system length (km) 3 3.00
SUS Active dune system width (km) 3 3.00
Average height of the coastal dune (m) 1 3 1 1.67
GD
Particle size of the windward slope of
3 3.00
the dune (Φ)
Relative surface with scarps (m2 ) 4 4.00
Modal beach state 4 4.00
Number of sandy or rocky bars
4 4.00
submerged or emerged
Beach width (m) 4 4.00
GB
RS Particle size of the dry beach 2 2.00
Net Shoreline Movement (m) 4 4.00
Beach surface variation 4 4.00
AI Sediment input from the primary dune 2 2.00
3.1. Analysis of the Variables
3.1.1. Marine Influence (MI)
According to Grases et al. [31], the Riumar area is a dissipative beach featuring a
mild slope at the front part of the beach (0.07%). The Ebro Delta is a wave-dominated
micro-tidal environment with a tidal range of approximately 0.25 m [31]. The influence of
the astronomical tide and the meteorological tide (atmospheric pressure and sea elevations
caused by the wind and the waves) can produce variations of about one meter [36]. The
significant wave height (Hs) is 0.75 m, the mean wave period (Tm) is 3.9 s [23], and the
storm waves can be exceeding 2 m [37]. The eastern wave component, the higher and more
energetic waves, is the predominant cause of morphological changes [6].
3.1.2. Human Pressure (HP)
According to the Statistical Institute of Catalonia on 1 January 2020, the population of
the Riumar urban area is 270 habitants (https://www.idescat.cat/poblacio/?q=Riumar&
lang=es (accessed on 11 April 2021)). Although the little urban area of Riumar is a touristic
zone, the number of visitors is low. According to Aranda et al. [38], this area did not suffer
remarkable changes in anthropic features due to its qualification as a Natural Park in 1989.J. Mar. Sci. Eng. 2021, 9, 601 9 of 15
3.1.3. Characteristics of the Vegetation Cover (VC)
The results obtained differ slightly for each zone (Table 3). The most abundant species
is Crucianella maritima, which is classified as Type II according to García-Mora et al. [39].
Plants of Type II are mostly perennials with a below-ground spreading root network and
leaves with presumed adaptations to coastal environmental stress [39].
Table 3. Results obtained for the vegetation cover (VC) variables, and for each studied area (Z1, Z2,
and Z3).
Variables VC Z1 Z2 Z3
Average vegetation cover (m2 ) 54 192.77 179.22
Percentage of the area with vegetation (Type II) 11 39.31 27.36
3.1.4. Geomorphology of the Dune System (GD)
The length and width of the active dune system reflect a high susceptibility value in
all dunar systems. The average height of the coastal dune varies in each area. Z1 presents
an average height of 1.56 m, with high elevation in its central region, reaching a maximum
of 7.3 m ASL; Z2 shows an average height of 0.67 m and a maximum of 4.31 m; and Z3 has
higher dunes that reach 7.75 m, with an average height of 1.45 m.
All samples sieved in the laboratory have a medium grain size.
The analysis of the calculated slopes has confirmed that there is no erosive scarp on
the entire surface studied. However, once the effects of the last storm events on the eastern
part of the dune are known, a high susceptibility value has been granted.
3.1.5. Geomorphology of the Beach (GB)
Figure 1 shows sandy hooks developed in front of the dune field. These hooks slowly
connected to the land and enabled coastal development [21,38]. Moreover, these sand bars
favoring the presence of a wide beach, which has been quantified in 116 m on average.
According to Grases et al. [31], the particle size of the dry beach sediment is 200 µm. The net
shoreline movement between 1998 and 2018 showed a mean value of +160 m, equivalent
to 8 m of advance per year. The surface variation between 1998 (113 m2 ) and 2018 (300 m2 )
was 2.65.
3.1.6. Aeolian Influence (AI)
The results obtained for dune volume variation between 2011 and 2016 showed
a slightly positive trend, going from 546,577 m3 in 2011 to 574,483 m3 in 2016, which
represented an increase of 5.11% of the total volume.
3.2. Dune Vulnerability Index Assessment (DVI)
Figure 3 shows the results of the partial vulnerability indices (Is) of each group of
variables and the DVI final. In addition, a radar chart was obtained illustrating these results.
The DVI ranges between 0 and 1, and in accordance with García-Mora et al. [11], as the
index increases, the ability of a dune system to withstand further pressure decreases.J. Mar. Sci. Eng. 2021, 9, 601 10 of 15
Figure 3. (Left) Table with partial vulnerability indices (Is) and the DVI calculated. (Right) Radar
graphic. Legend: MI: marine influence; HP: human pressure; VC: vegetation cover; GD: geomorphol-
ogy of the dune system; GB: geomorphology of the beach; AI: aeolian influence; EXP: exposure; SUS:
susceptibility; RS: resilience.
4. Discussion
4.1. Exposure Assessment
The dunar system examined has characteristics that, combined with the environment
in which they develop, give a very low vulnerability. Their position with relation to the
main waves, and the coast orientation, make the main transforming forces of the coast
lose some of their capacity. Besides, the storms have a seasonal pattern. According to
Jimenez et al. (1997) [23] the energetic period covered the period from October until March,
where the eastern waves are dominant; from March to June there is a transition period, and
the mild period from June to September is characterized by the lowest wave heights and
shorter periods, being south the most frequent direction. During the transition and mild
wave action, the shoreline accretion occurs [23] and, therefore, recovers from winter storms.
According to Mendoza and Jimenez [40], the most frequent storm category in this area,
based on wave energy content, is weak, with a mean duration short (12 h) and mean Hs of
2 m. Occasionally, severe (Hs = 4 m and Tp = 9 sg) and extreme (Hs = 6 m and Tp = 11 sg)
storms have happened. One of the most extraordinary was storm Gloria (Figure 4) that
occurred on 19 and 23 January of 2020, where a Hs of 7.6 m and H max of 12 m was reached;
and the storm surge varied between 50 and 70 cm [41]. From 6 to 11 January 2021, another
stormy episode took place (storm Filomena) with wind speeds of up to 70 km per hour
and a storm surge of 4.6 m high and period of 10 sg. Figure 4 shows two situations of
these events and it can be observed as the dunar body remained despite the very adverse
conditions, although the part most exposed to waves suffered an overwashing.
The other variable considered in the exposition term is human activity, which does not
seem to exert high pressure over the dunar complex. The population of the Riumar urban
zone is relatively low and is very concerned whit erosive and environmental problems of
the Ebro Delta. Moreover, the most common visits to the Ebro Delta take place in a single
day [32], and it is included within the so-called ecotourism. In the last few years, the Ebro
Delta has been configured as a sustainable tourism destination, recognized in the European
charter of Sustainable Tourism (CETS) [42]. In addition, the access difficulty to the dune is
great and is limited between April to June, coinciding with the nesting period.J. Mar. Sci. Eng. 2021, 9, 601 11 of 15
Figure 4. Images of Ebro River mouth. (A) Sentinel image of 23 January 2020 during storm Gloria. (B) Sentinel image of
17 January 2021 after storm Filomena. Reproduced from https://scihub.copernicus.eu/dhus/#/home (accessed on 27
January 2021)).
In terms of hazard exposure, even if one considers the most severe values of waves
and tides, and consider the effects of human activity low or null, the significance is low.
4.2. Susceptibility Assessment
The evolution of the Riumar field dune can be observed in Figure 2. According to
Ramírez-Cuesta et al. [20] and Sánchez-García et al. [26], the dunar system of Riumar acts
as a sediment sink, which is transported by the northwesterly winds from the El Fangar
spit and is spreading progressively eastwards as the beach progress.
The geomorphology characteristics of the dune (length, width, height, and size of
sediments) reveal a stable dune, especially in zone 1 (Z1). In addition, the vegetation Type
II is not susceptible to being dispersed by seawater and is characteristic of semi-stabilized
dunes, and they favor the fixation of the sands, reducing the effects of wind deflation [7].
According to Mendoza and Jiménez [40], a general rule for a given storm, a dissipative
beach is potentially more vulnerable to inundation. Nevertheless, the beach ridges located
in front of the dune (Figure 4) have held back part of the wave energy. The most susceptible
area that shows dune scarp due to wave storm is the eastern part, which is faced with the
waves.
The susceptibility registers relatively high values, although it must be recognized that
the situations more extreme were considered.
4.3. Resilience Assessment
The beach ridges play a fundamental role in the generation of dune systems [35],
reducing the wave energy and increasing the beach width, giving the space to absorb
sea-level variations. These deposits constitute a natural source of sediments to build the
winter profile, diminishing the energy of the surge [6]. As seen from Figure 2, the beach has
an accretionary evolution reaching 1600 m in 60 years. According to Rodríguez-Santalla
and Triviño-Monzón [27], the sediment deposited on the mouth area has several sources.
Firstly, from the East by erosion of the Buda Island, that gives rise to the beach accretion by
beach ridges; and secondly from the northwest, by aeolian transport and longshore currents
of the sediment belonging to the dunes of the El Fangar spit and the beaches located in theJ. Mar. Sci. Eng. 2021, 9, 601 12 of 15
north of the mouth. In line with Barrio et al. [43], there exists a relationship between the
sedimentary exchange of the beach–dune systems of El Fangar spit and the evolution of
the coastline in the Riumar area. The greater the amount of sediment accumulated in the
coastal system, the greater the capacity of absorption of the impact, and the more stable the
dune complex will be [7].
Guillén and Palanques [44] detected a coarsening trend in the sediments of the Ebro
delta coast at a medium-term scale (two decades) that, according to Jimenez et al. [45],
should decrease the intensity of erosion hazard.
In respect of aeolian influence, an increase in the height and volume of dune ridges has
been observed, which is in line with the results of Ramirez-Cuesta et al. [20] y Rodriguez-
Santalla y Triviño-Monzón [27]. As mentioned above, the sediment comes from the El
Fangar spit, transported by the northwest winds, which is reflected in the orientation of
the dunes (Figure 4).
The conditions of the beach and the state of the dune encourage a high value of
resilience.
4.4. DVI Assessment
Taking all variables examined into account, the resilience values are very high and
compensate those obtained both in exposure and susceptibility, giving a very low DVI
value. Actually, the environmental context in which this dune body develops should be
broadened in the analysis. As has been stated, the El Garxal coastal lagoon system is
protected by Cape Tortosa, which is the area that currently has the largest rate of erosion
of the whole of Ebro Delta. According to Rodríguez-Santalla and Triviño-Monzón [27], as
long as Cape Tortosa remains and the system continues to receive sediment, the system
can remain. On the other hand, it appears that there is an increase in the frequency and/or
intensity of storm events as well as a potential sea-level rise which will affect the present
morphology of the delta [21]. The models made by Grases et al. [31] show a shift in the
growing importance of SLR-induced flooding from 2050 onwards, and at the same time,
longshore sediment transport processes are slowed down while they are enhanced in the
cross-shore direction. The intensity of the induced coastal hazards will be a consequence
of different parameters related with the beach profile height, beach width, and evolution
stage, which will modulate the induced morphodynamic response by storms [45]. However,
despite the low DVI obtained, it should be taken into account that the more frequent the
erosive processes are, the most fragile the coastal stretch will be. Moreover, if the frequency
of storms is high during a certain period, it could be possible that natural recovery processes
should have not enough time to be effective, and then, storms should impact on already
eroded/affected areas [45].
4.5. Coastal Management Assessment
Coastal wetlands are unique ecosystems whose sustainability depends on the re-
silience of the geomorphic and ecological environment [46]. According to Cobani [47],
sedimentation and/or coastal erosion are the main processes that must be controlled to
ensure the physical stability of coastal lagoons. Coastal dunes provide a buffer against
coastal hazards such as wind erosion, wave overtopping, and tidal inundation during
storm events [6]. Therefore, the high resilience and the low DVI values obtained for the Ri-
umar dune could ensure the continuity of the El Garxal coastal lagoon, as long as the same
conditions that have allowed its development can be preserved, that is, that Cape Tortosa
will be maintained. Since the 1990s, this area has been considered the most vulnerable of
the entire deltaic environment [48].
This wetland is of great ecological value as it is not directly affected by the irrigation
surplus of the rice crops of the Ebro Delta and is included in the 25% of natural habitats
that are still conserved in the Ebro Delta [49]. It is protected by the aforementioned legal
figure of the Ebro Delta, in addition to having a particular category of protection as a
Wildlife Refuge (since 1989), due to their importance as nesting areas for seabirds andJ. Mar. Sci. Eng. 2021, 9, 601 13 of 15
shorebirds. Likewise, the entire Ebro Delta front is included in the Spanish Inventory
of Places of Geological Interest (LIG) [50], as an international geosite (https://info.igme.
es/ielig/LIGInfo.aspx?codigo=CAT320 (accessed on 10 May 2021)), given that it presents
multiple morphologies whose dynamics make the dune systems unique within the Spanish
coast.
The results of the present study on the factors affecting the vulnerability of the dune
complex aim to reveal the current problems for the future sustainability of this important
delta, as well as which parameters require further attention. It is an effective tool for the
management of this coastal protected area. Vulnerability factor analyses have been carried
out in many dune systems around the world since the 1990s, using these indices for coastal
zone management [51–53]. However, data replicability and comparisons between different
sites is complicated, as there are no clear-cut guidelines about how to acquire/collect the
data that will be used to calculate the DVI [54]. Standardized and replicable protocols and
a multidisciplinary approach to exploit every surveying/analysis technique to match and
compare all the data acquired from different sources would be desirable [55].
5. Conclusions
The results obtained show that the Riumar dune field in El Garxal coastal wetland
presents low vulnerability, and is able to withstand the most severe conditions as long as it
has enough time for recovery. However, if the spatial scale considered is broadened, the
vulnerability of the system increases. The El Garxal coastal barrier-lagoon system is in a
highly fragile environment such as the Ebro delta, and coastal flooding and erosion events
are expected due to the influence of climate change that would increase the vulnerability of
this coastal stretch. It is essential to generate protection efforts towards the most vulnerable
areas identified on the coast of the Ebro delta.
Author Contributions: Conceptualization, I.R.-S.; methodology, I.R.-S. and A.D.-M.; software, I.R.-
S. and A.D.-M.; validation, I.R.-S. and A.D.-M. and N.N.; formal analysis, I.R.-S. and A.D.-M.;
investigation, I.R.-S. and A.D.-M.; resources, I.R.-S. and A.D.-M.; data curation, I.R.-S.; writing—
original draft preparation, I.R.-S. and A.D.-M.; writing—review and editing, I.R.-S. and A.D.-M. and
N.N.; visualization, I.R.-S. and A.D.-M. and N.N.; supervision, I.R.-S.; project administration, I.R.-S.
and N.N.; funding acquisition, I.R.-S. and N.N. All authors have read and agreed to the published
version of the manuscript.
Funding: This research was funded by the Universidad Rey Juan Carlos, Spain.
Data Availability Statement: Data available from the authors on request.
Acknowledgments: This work was carried out under the project “Estudio integral del sistema barrera
arenosa-laguna costera desarrollado en la desembocadura del Ebro como ecosistema centinela para
observaciones costeras del cambio global (ICOLADE)” funded by the Universidad Rey Juan Carlos,
Spain.
Conflicts of Interest: The authors declare no conflict of interest.
References
1. Kjerfve, B. Coastal Lagoons. In Coastal Lagoon Processes; Kjerfve, B., Ed.; Elsevier Science Publishers: Amsterdam, The Netherlands,
1994; ISBN 0444882588.
2. Otvos, E.G. Coastal barriers—Nomenclature, processes, and classification issues. Geomorphology 2012, 139, 39–52. [CrossRef]
3. Santos, R.; Silva, J.; Alexandre, A.; Navarro, N.; Barrón, C.; Duarte, C. Ecosystem metabolism and carbon budget of tidal-
dominated coastal lagoon. Estuaries 2004, 27, 977–985. [CrossRef]
4. Christian, R.R.; Baird, D.; Bowen, R.E.; Clark, D.M.; DiGiacomo, P.M.; Jiménez, J.; Kineman, J.; Mazzilli, S.; Servin, G.; Viaroli, P.;
et al. Coastal GTOS Draft Strategic Design and Phase 1 Implementation Plan; GTOS Report No. 36; FAO: Rome, Italy, 2005.
5. Reinson, G.E. Facies Models 14. Barrier Island Systems. Geoscience Canada, 6(2). 1979. Available online: https://journals.lib.unb.
ca/index.php/GC/article/view/3154 (accessed on 2 March 2021).
6. Rodríguez Santalla, I.; Sánchez, M.J.; Montoya, I.; Gómez, D.; Martín, T.; Serra, J. Internal structure of the aeolian sand dunes of El
Fangar spit, Ebro Delta (Tarragona, Spain). Geomorphology 2009, 104, 238–252. [CrossRef]
7. Ley, C.; Gallego, J.B.; Vidal, C. Manual de Restauración de Dunas Costeras; Ministerio de Medio Ambiente: Dirección General de
Costas, Spain, 2007; p. 258.J. Mar. Sci. Eng. 2021, 9, 601 14 of 15
8. Bodéré, J.C.L.; Cribb, R.; Curr, R.C.F.; Davies, P.; Hallégouet, B.; Meur, C.; Pirou, N.; Williams, A.T.; Yoni, C. La gestion des milleux
dunaires littoraux. Evaluation de leur vulnerabilité a partir d’une liste de controle. Etudes cas dans le sud de Pays de Galles et en
Bretagne Occidentale. Norois 1991, 38, 279–298. [CrossRef]
9. Williams, A.T.; Davies, P.; Curr, R.C.F.; Koh, A.; Bodéré, J.C.L.; Hallégouet, B.; Meur, C.; Yoni, C. A checklist assessment of dune
vulnerability and protection in Devon and Cornwall, UK. In Coastal Zone’93; Magoon, O.T., Ed.; ASCE: Reston, VA, USA, 1993;
pp. 3394–3408.
10. Williams, A.T.; Alveirinho-Dias, J.; García-Novo, F.; García-Mora, M.R.; Curr, R.; Pereira, A. Integrated coastal dune management:
Checklist. Cont. Shelf Res. 2001, 21, 1937–1960. [CrossRef]
11. Garcia Mora, M.R.; Gallego-Fernandez, J.B.; Williams, A.T.; García-Novo, F. A coastal dune vulnerability classification. A case
study of the SW Iberian Peninsula. J. Coast. Res. 2001, 17, 802–811.
12. Martínez-Vázquez, M.L.; Gallego, J.B.; García, J.; Moctezuma, C.; Jiménez, C.D. Assessment of coastal dune vulnerability to
natural and anthropogenic disturbances along the Gulf of Mexico. Environ. Conserv. 2006, 33, 109–117. [CrossRef]
13. Gracia Prieto, F.J.; Sanjaume, E.; Hernández, L.; Hernández, A.I.; Flor, G.; Gómez-Serrano, M.Á. Dunas marítimas y continentales.
In VV.AA., Bases Ecológicas Preliminares Para La Conservación de Los Tipos de Hábitat de Interés Comunitario En España; Ministerio de
Medio Ambiente, y Medio Rural y Marino: Madrid, Spain, 2009; p. 106.
14. Muñoz, S.; Gallego, J.B.; Dellafiore, C.M. Dune Vulnerability in Relation to Tourism Pressure in Central Gulf of Cadiz (SW Spain),
A Case study. J. Coast. Res. 2011, 27, 243–251.
15. Ciccarelli, D.; Pinna, M.S.; Alquini, F.; Cogoni, D.; Ruocco, M.; Bacchetta, G.; Sarti, G.; Fenu, G. Development of a coastal dune
vulnerability index for Mediterranean ecosystems: A useful tool for coastal managers? Estuar. Coast. Shelf Sci. 2017, 187, 84–95.
[CrossRef]
16. Peña-Alonso, C.; Gallego-Fernández, J.B.; Hernández-Calvento, L.; Hernández-Cordero, A.I.; Ariza, E. Assessing the geomorpho-
logical vulnerability of arid beach-dune systems. Sci. Total Environ. 2018, 635, 512–525. [CrossRef]
17. Sancho, F.; Oliveira, F.S.; Freire, P. Coastal dunes vulnerability indexes: A new proposal. Coast. Eng. Proc. 2012, 1, 68. [CrossRef]
18. Smit, B.; Wandel, J. Adaptation, adaptive capacity and vulnerability. Glob. Environ. Chang. 2006, 16, 282–292. [CrossRef]
19. Mclaughlin, S.; Cooper, J.A. A multi-scale coastal vulnerability index: A tool for coastal managers? Environ. Hazards 2010, 9,
233–248. [CrossRef]
20. Ramírez-Cuesta, J.M.; Rodríguez-Santalla, I.; Gracia, F.J.; Sánchez-García, M.J.; Barrio Parra, F. Analysis of recent geomorphologi-
cal changes occurred in the Ebro River mouth by using changes detection techniques (period 1957–2013). Appl. Geog. 2016, 75,
12–27. [CrossRef]
21. Rodríguez-Santalla, I.; Somoza, L. The Ebro River Delta. In The Spanish Coastal Systems—Dynamic Processes, Sediments and
Management, 1st ed.; Morales, J.A., Ed.; Springer: New York, NY, USA, 2019; Volume 1, pp. 467–488.
22. Maldonado, A. El Delta del Ebro. Estudio Sedimentológico y Estratigráfico. Ph.D. Thesis, Universidad de Barcelona, Barcelona,
Spain, 1972. Boletín de Estratigrafía Volume 1486. p. 1972.
23. Jiménez, J.A.; Sánchez-Arcilla, A.; Valdemoro, H.I.; Gracia, V.; Nieto, F. Processes reshaping the Ebro delta. Mar. Geol. 1997, 144,
59–79. [CrossRef]
24. Somoza, L.; Barnolas, A.; Arasa, A.; Maestro, A.; Rees, J.G.; Hernandez-Molina, F.J. Architectural stacking patterns of the Ebro
delta controlled by Holocene high-frequency eustatic fluctuations, delta-lobe switching and subsidence processes. Sediment. Geol.
1998, 117, 11–32.
25. Cearreta, A.; Benito, A.; Ibáñez, C.; Trobajo, R.; Giosan, L. Holocene palaeoenvironmental evolution of the Ebro Delta (Western
Mediterranean Sea): Evidence for an early construction based on the benthic foraminiferal record. Holocene 2016, 26, 1438–1456.
[CrossRef]
26. Sánchez-García, M.J.; Montoya-Montes, I.; Casamayor, M.; Alonso, I.; Rodríguez-Santalla, I. Coastal Dunes in the Ebro Delta. In
The Spanish Coastal Systems—Dynamic Processes, Sediments and Management, 1st ed.; Morales, J.A., Ed.; Springer: New York, NY,
USA, 2019; Volume 1, pp. 611–630.
27. Rodríguez-Santalla, I.; Triviño-Monozón, J. Determinación del cambio superficial y volumétrico en el periodo 2011–2016 del
campo dunar de la playa de Riumar en la desembocadura del Río Ebro, por medio de datos LiDAR. X J. Geomorfol. Litoral 2019, 1,
189–192.
28. Rodríguez-Santalla, I.; Montoya, I.; Sánchez, M.J.; Carreño, F. Geographic Information Systems applied to integrated coastal zone
management. Geomorphology 2009, 107, 100–105. [CrossRef]
29. Moulton, M.A.B.; Hesp, P.A.; Miot da Silva, G.; Bouchez, C.; Lavy, M.; Fernandez, G.B. Changes in vegetation cover on the
Younghusband Peninsula transgressive dune fields (Australia) 1949–2017. Earth Surf. Process. Landf. 2019, 44, 459–470. [CrossRef]
30. Himmelstoss, E.; Henderson, R.; Kratzmann, M.; Farris, A. Digital Shoreline Analysis System (DSAS) Version 5.0 User Guide. U.S.;
Geological Survey Open-File Report 2018–1179; USGS: Reston, VA, USA, 2018; p. 126. [CrossRef]
31. Grases, A.; Gracia, V.; García-León, M.; Lin-Ye, J.; Sierra, J.P. Coastal Flooding and Erosion under a Changing Climate: Implications
at a Low-Lying Coast (Ebro Delta). Water 2020, 12, 346. [CrossRef]
32. Ortells-Cabrera, V.; Querol-Gómez, A. El Parc Natural del Delta de l’Ebre: El Turismo Como Complemento Económico Sostenible;
Servicio de Publicaciones Universidad de Almería: Almeria, Spain, 2002.
33. Piscioneri, N.; Smyth Thomas, A.G.; Hesp Patrick, A. Flow Dynamics over a Foredune Scarp. Earth Surf. Process. Landf. 2018, 44,
1064–1076. [CrossRef]J. Mar. Sci. Eng. 2021, 9, 601 15 of 15
34. Rodríguez-Martín, R.; Rodríguez-Santalla, I. Detection of submerged sand bars in the Ebro delta using ASTER images. In New
Frontiers in Engineering Geology and the Environment; Springer: Berlín/Heidelberg, Germany, 2012; pp. 103–107.
35. Rodríguez-Santalla, I.; Gómez-Ortiz, D.; Martín-Crespo, T.; Sánchez-García, M.J.; Montoya-Montes, I.; Martín-Velázquez, S.;
Barrio, F.; Serra, J.; Ramírez-Cuesta, J.M.; Gracia, F.J. Study and Evolution of the Dune Field of La Banya Spit in Ebro Delta (Spain)
Using LiDAR Data and GPR. Remote Sens. 2021, 13, 802. [CrossRef]
36. Sierra, J.P.; González del Río, J.; Flos, J.; Sánchez-Arcilla, A.; Movellán, E.; Rodilla, M.; Mösso, C.; Martínez, R.; Falco, S.; Romero,
I.; et al. Medición de parámetros físicos, biológicos y químicos en el tramo estuarino del río Ebro. Ingeniería 2001, 8, 459–468.
37. Sanchez-Arcilla, A.; Mösso, C.; Sierra, J.P.; Mestres, M.; Harzallah, A.; Senouci, M.; El Raey, M. Climatic drivers of potential
hazards in Mediterranean coasts. Reg. Environ. Chang. 2011, 11, 617–636. [CrossRef]
38. Aranda, M.; Gracia, F.J.; Peralta, G. Estuarine Mapping and Eco-Geomorphological Characterization for Potential Application in
Conservation and Management: Three Study Cases along the Iberian Coast. Appl. Sci. 2020, 10, 4429. [CrossRef]
39. García-Mora, M.R.; Gallego-Fernández, J.B.; García-Novo, F. Plant functional types in coastal foredunes in relation to environ-
mental stress and disturbance. J. Veg. Sci. 1999, 10, 27–34. [CrossRef]
40. Mendoza, E.T.; Jiménez, J.A. Factors controlling vulnerability to storm impacts along the Catalonian coast. In Proceedings of the
29th International Conference on Coastal Engineering, Lisbon, Portugal, 19–24 September 2004; pp. 3087–3099.
41. Lorente, P.; Lin-Ye, J.; García-León, M.; Reyes, E.; Fernandes, M.; Sotillo, M.G.; Espino, M.; Ruiz, M.I.; Gracia, V.; Perez, S.; et al.
On the Performance of High Frequency Radar in the Western Mediterranean during the Record-Breaking Storm Gloria. Front.
Mar. Sci. 2021, 8, 645762. [CrossRef]
42. Bartual, M.T.; Pareja, M. Procesos participativos de gestión para la sostenibilidad del desarrollo rural. El caso CETS (Carta
Europea de Desarrollo Sostenible) en el Delta del Ebro, España. Rev. Interam. Ambient. Tur. 2015, 11, 16–30.
43. Barrio-Parra, F.; Rodríguez-Santalla, I.; Taborda, R.; Ribeiro, M. A modeling approach to assess the key factors in the evolution of
coastal systems: The Ebro North Hemidelta case. Estuar. Coasts 2017, 40, 758–772. [CrossRef]
44. Guillén, J.; Palanques, A. Short- and medium-term grain size changes in deltaic beaches (Ebro Delta, NW Mediterranean).
Sediment. Geol. 1996, 101, 55–67. [CrossRef]
45. Jiménez, J.; Valdemoro, H.; Bosom, E.; García, V. Storm-induced coastal hazards in the Ebro delta (NW Mediterranean). In The
Proceedings of the Coastal Sediments; World Scientific: Singapore, 2011; pp. 1332–1345.
46. Reed, D.J. Coastal biogeomorphology: An integrated approach to understanding the evolution, morphology, and sustainability
of temperate coastal marshes. In Estuarine Science: A Synthetic Approach to Research and Practice; Hobbie, J.E., Ed.; Island Press:
Washington, DC, USA, 2000; pp. 347–361.
47. Cobani, M. Tunisia. In Mediterranean Coastal Lagoons: Sustainable Management and Interactions among Aquaculture, Capture Fisheries
and the Environment; Stefano, C., Donatella, C., Fabio, M., Eds.; FAO Studies and Reviews: Rome, Italy, 2015; Volume 95, pp. 51–89.
48. Sánchez-Arcilla, A.; Jiménez, J.; Valdemoro, H. The Ebro Delta: Morphodynamics and Vulnerability. J. Coast. Res. 1998, 14,
754–772.
49. Cardoch, L.; Day, J.W.; Ibáñez, C. Net primary productivity as an indicator of sustainability in the Ebro and Mississippi Deltas.
Ecol. Appl. 2002, 12, 1044–1055. [CrossRef]
50. Salazar, A.; Carcavilla, L.; Díez-Herrero, A. Geomorphological Heritage and Conservation in Spain. In Landscapes and Landforms of
Spain, 1st ed.; Gutiérrez, F., Gutiérrez, M., Eds.; Springer: New York, NY, USA, 2014; Volume 1, pp. 307–318.
51. Williams, A.; Davies, P.; Dias, J.M.; Pereira, A.R.; Garcia-Mora, M.R.; Tejada, M. A re-evaluation of dune vulnerability checklist
parameters. GAIA Rev. Geocienc. 1994, 8, 179–182.
52. Oropeza-Orozco, O.; Sommer-Cervantes, I.; Carlos-Gómez, J.; Preciado-López, J.; Ortiz-Pérez, M.; López-Portillo, J. Assessment
of Vulnerability and Integrated Management of Coastal Dunes in Veracruz, Mexico. Coast. Manag. 2011, 39, 492–514. [CrossRef]
53. Williams, A.T.; Davies, P. Coastal dunes of Wales; vulnerability and protection. J. Coast. Conserv. 2001, 7, 145–154. [CrossRef]
54. Bertoni, D.; Sarti, G.; Alquini, F.; Ciccarelli, D. Implementing a coastal dune vulnerability index (CDVI) to support coastal
management in different settings (Brazil and Italy). Ocean Coast. Manag. 2019, 180, 1–12. [CrossRef]
55. Bartolini, S.; Mecocci, A.; Pozzebon, A.; Zoppetti, C.; Bertoni, D.; Sarti, G.; Caiti, A.; Costanzi, R.; Catani, F.; Ciampalini, A.; et al.
Augmented virtuality for coastal management: A holistic use of in situ and remote sensing for large scale definition of coastal
dynamics. ISPRS Int. J. Geo Inf. 2018, 7, 92. [CrossRef]You can also read