Integrated human pseudoislet system and microfluidic platform demonstrate differences in GPCR signaling in islet cells - JCI Insight
←
→
Page content transcription
If your browser does not render page correctly, please read the page content below
Integrated human pseudoislet system and microfluidic platform
demonstrate differences in GPCR signaling in islet cells
John T. Walker, … , Alvin C. Powers, Marcela Brissova
JCI Insight. 2020;5(10):e137017. https://doi.org/10.1172/jci.insight.137017.

 Technical Advance    Endocrinology     Metabolism

Pancreatic islets secrete insulin from β cells and glucagon from α cells, and dysregulated secretion of these hormones is
a central component of diabetes. Thus, an improved understanding of the pathways governing coordinated β and α cell
hormone secretion will provide insight into islet dysfunction in diabetes. However, the 3D multicellular islet architecture,
essential for coordinated islet function, presents experimental challenges for mechanistic studies of intracellular signaling
pathways in primary islet cells. Here, we developed an integrated approach to study the function of primary human islet
cells using genetically modified pseudoislets that resemble native islets across multiple parameters. Further, we
developed a microperifusion system that allowed synchronous acquisition of GCaMP6f biosensor signal and hormone
secretory profiles. We demonstrate the utility of this experimental approach by studying the effects of G i and Gq GPCR
pathways on insulin and glucagon secretion by expressing the designer receptors exclusively activated by designer drugs
(DREADDs) hM4Di or hM3Dq. Activation of Gi signaling reduced insulin and glucagon secretion, while activation of Gq
signaling stimulated glucagon secretion but had both stimulatory and inhibitory effects on insulin secretion, which occur
through changes in intracellular Ca2+. The experimental approach of combining pseudoislets with a microfluidic system
allowed the coregistration of intracellular signaling dynamics and hormone secretion and demonstrated differences in
GPCR signaling pathways between human β and α cells.

Find the latest version:
https://jci.me/137017/pdf
TECHNIC AL ADVANCE

                                       Integrated human pseudoislet system
                                       and microfluidic platform demonstrate
                                       differences in GPCR signaling in islet cells
                                       John T. Walker,1 Rachana Haliyur,1 Heather A. Nelson,2 Matthew Ishahak,3 Gregory Poffenberger,2
                                       Radhika Aramandla,2 Conrad Reihsmann,2 Joseph R. Luchsinger,4 Diane C. Saunders,2 Peng Wang,5
                                       Adolfo Garcia-Ocaña,5 Rita Bottino,6 Ashutosh Agarwal,3 Alvin C. Powers,1,2,7 and Marcela Brissova2
                                       Department of Molecular Physiology and Biophysics, Vanderbilt University School of Medicine, Nashville, Tennessee,
                                       1

                                       USA. 2Division of Diabetes, Endocrinology and Metabolism, Department of Medicine, Vanderbilt University Medical Center,
                                       Nashville, Tennessee, USA. 3Department of Biomedical Engineering, University of Miami, Miami, Florida, USA. 4Vanderbilt
                                       Brain Institute, Vanderbilt University School of Medicine, Nashville, Tennessee, USA. 5Diabetes, Obesity, and Metabolism
                                       Institute, Icahn School of Medicine at Mount Sinai, New York, New York, USA. 6Institute of Cellular Therapeutics,
                                       Allegheny-Singer Research Institute, Allegheny Health Network, Pittsburgh, Pennsylvania, USA. 7VA Tennessee Valley
                                       Healthcare System, Nashville Tennessee, USA.

                                               Pancreatic islets secrete insulin from β cells and glucagon from α cells, and dysregulated secretion
                                               of these hormones is a central component of diabetes. Thus, an improved understanding of the
                                               pathways governing coordinated β and α cell hormone secretion will provide insight into islet
                                               dysfunction in diabetes. However, the 3D multicellular islet architecture, essential for coordinated
                                               islet function, presents experimental challenges for mechanistic studies of intracellular signaling
                                               pathways in primary islet cells. Here, we developed an integrated approach to study the function of
                                               primary human islet cells using genetically modified pseudoislets that resemble native islets across
                                               multiple parameters. Further, we developed a microperifusion system that allowed synchronous
                                               acquisition of GCaMP6f biosensor signal and hormone secretory profiles. We demonstrate
                                               the utility of this experimental approach by studying the effects of Gi and Gq GPCR pathways
                                               on insulin and glucagon secretion by expressing the designer receptors exclusively activated
                                               by designer drugs (DREADDs) hM4Di or hM3Dq. Activation of Gi signaling reduced insulin and
                                               glucagon secretion, while activation of Gq signaling stimulated glucagon secretion but had both
                                               stimulatory and inhibitory effects on insulin secretion, which occur through changes in intracellular
                                               Ca2+. The experimental approach of combining pseudoislets with a microfluidic system allowed
                                               the coregistration of intracellular signaling dynamics and hormone secretion and demonstrated
                                               differences in GPCR signaling pathways between human β and α cells.

Authorship note: JTW and RH            Introduction
contributed equally to this work.      Pancreatic islets of Langerhans, small collections of specialized endocrine cells interspersed throughout the
Conflict of interest: MI and AA are    pancreas, control glucose homeostasis. Islets are composed primarily of β, α, and δ cells but also include
cofounders of Bio-Vitro, which is in   supporting cells, such as endothelial cells, nerve fibers, and immune cells. Insulin, secreted from the β cells,
the process of commercializing the     lowers blood glucose by stimulating glucose uptake in peripheral tissues, while glucagon, secreted from α
microfluidic device.                   cells, raises blood glucose through its actions in the liver. Importantly, β and/or α cell dysfunction is a key
Copyright: © 2020, American Society    component of all forms of diabetes mellitus (1–11). Thus, an improved understanding of the pathways gov-
for Clinical Investigation.            erning the coordinated hormone secretion in human islets may provide insight into how these may become
Submitted: February 5, 2020            dysregulated in diabetes.
Accepted: April 22, 2020                    In β cells, the central pathway of insulin secretion involves glucose entry via glucose transport-
Published: April 30, 2020.             ers where it is metabolized inside the cell, resulting in an increased ATP/ADP ratio. This shift closes
                                       ATP-sensitive potassium channels, depolarizing the cell membrane and opening voltage-dependent cal-
Reference information: JCI Insight.
2020;5(10):e137017.                    cium channels where calcium influx is a trigger of insulin granule exocytosis (12). In α cells, the path-
https://doi.org/10.1172/jci.           way of glucose inhibition of glucagon secretion is not clearly defined, with both intrinsic and paracrine
insight.137017.                        mechanisms proposed (13–15). Furthermore, gap junctional coupling and paracrine signaling between

insight.jci.org   https://doi.org/10.1172/jci.insight.137017                                                                                                      1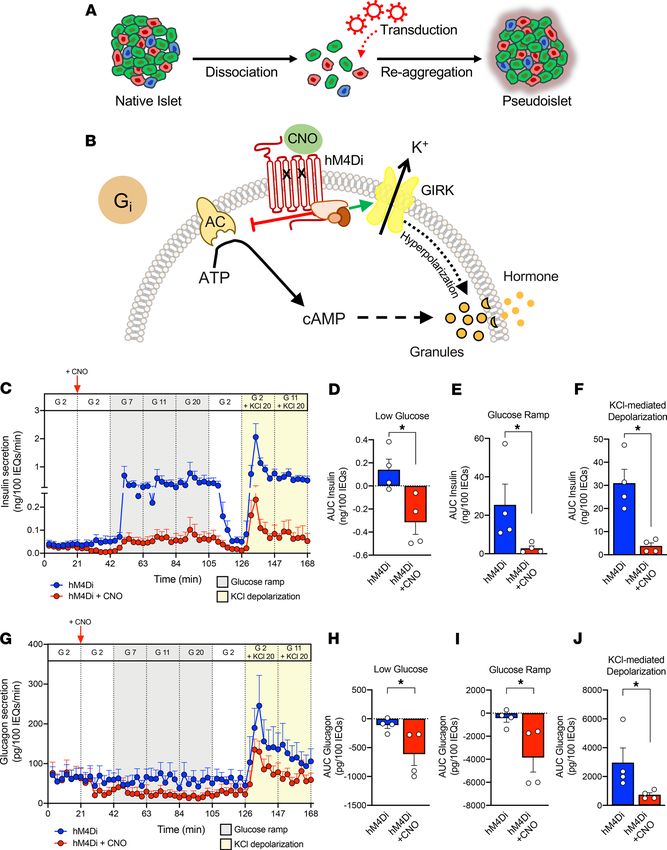
TECHNIC AL ADVANCE

                                  islet endocrine cells and within the 3D islet architecture are critical for islet function, as individual α or β
                                  cells do not show the same coordinated secretion pattern seen in intact islets (16–20).
                                       The 3D islet architecture, while essential for function, presents experimental challenges for mechanistic
                                  studies of intracellular signaling pathways in primary islet cells. Furthermore, human islets show a number
                                  of key differences from rodent islets, including their endocrine cell composition and arrangement, glucose
                                  set point, and both basal and stimulated insulin and glucagon secretion, highlighting the importance of
                                  studying signaling pathways in primary human cells (21–24).
                                       To study signaling pathways in primary human islet cells within the context of their 3D arrangement,
                                  we developed an integrated approach that consists of (a) human pseudoislets closely mimicking native
                                  human islet biology and allowing for efficient genetic manipulation and (b) a microfluidic system with
                                  the synchronous assessment of intracellular signaling dynamics and both insulin and glucagon secretion.
                                  Using this experimental approach, we demonstrate differences in Gq and Gi signaling pathways between
                                  human β and α cells.

                                  Results
                                  Human pseudoislets resemble native human islets and facilitate virally mediated manipulation of human islet cells.
                                  To establish an approach that would allow manipulation of human islets, we adapted a system where in
                                  human islets are dispersed into single cells and then reaggregated into pseudoislets (25–29) (Figure 1A and
                                  see Vanderbilt Pseudoislet Protocol in Supplemental Information for detailed protocol; supplemental mate-
                                  rial available online with this article; https://doi.org/10.1172/jci.insight.137017DS1). To optimize the for-
                                  mation and function of human pseudoislets, we investigated two different systems to create pseudoislets, a
                                  modified hanging drop system (30, 31) and an ultralow attachment microwell system. We found that both
                                  systems generated pseudoislets of comparable quality and function (Supplemental Figure 1, A and B) and
                                  thus combined groups for comparisons between native islets and pseudoislets. A key determinant of pseu-
                                  doislet quality was the use of a nutrient- and growth factor–enriched media (termed Vanderbilt pseudoislet
                                  media; see Vanderbilt Pseudoislet Protocol in Supplemental Information for detailed protocol).
                                       Pseudoislet morphology, size, and dithizone (DTZ) uptake resembled that of normal human islets (Fig-
                                  ure 1, B–D). Pseudoislet size was controlled to between 150 and 200 μm in diameter by adjusting the seed-
                                  ing cell density and thus resembled the size of an average native human islet. Compared with native islets
                                  from the same donor cultured in parallel using the same pseudoislet media, pseudoislets had similar insulin
                                  and glucagon content, though insulin content was reduced in pseudoislets from some donors (Figure 1E).
                                  Endocrine cell composition was also similar, with the ratio of β, α, and δ cells in pseudoislets unchanged
                                  compared with that in cultured native islets from the same donor (Figure 1, F and G).
                                       As the primary function of the pancreatic islet is to sense glucose and other nutrients and dynami-
                                  cally respond with coordinated hormone secretion, we assessed the function of pseudoislets compared
                                  with native islets by perifusion. We used the standard perifusion (herein referred to as macroperifusion)
                                  approach of the Human Islet Phenotyping Program of the Integrated Islet Distribution Program (IIDP),
                                  which has assessed nearly 300 human islet preparations. In this system, approximately 250 islet equiva-
                                  lents (IEQs) are loaded into a chamber and exposed to basal glucose (5.6 mM glucose; white) or various
                                  secretagogues (16.7 mM glucose, 16.7 mM glucose and 100 μM isobutylmethylxanthine [IBMX], 1.7 mM
                                  glucose and 1 μM epinephrine, 20 mM potassium chloride [KCl]; yellow) (Figure 1H). Pseudoislet insulin
                                  secretion was very similar to that of native islets in biphasic response to glucose, cAMP-evoked potenti-
                                  ation, epinephrine-mediated inhibition, and KCl-mediated depolarization (Figure 1H). Pseudoislets and
                                  native islets also had comparable glucagon secretion, which was inhibited by high glucose and stimulated
                                  by cAMP-mediated processes (IBMX and epinephrine) and depolarization (KCl) (Figure 1I). Compared
                                  with native islets on the day of arrival, pseudoislets largely maintained both insulin and glucagon secretion
                                  after 6 days of culture, with the exception of a slightly diminished second-phase glucose-stimulated insulin
                                  secretion and an enhanced glucagon response to epinephrine in cultured native islets and pseudoislets (Sup-
                                  plemental Figure 1, C–N). These results demonstrate that, after dispersion into the single-cell state, human
                                  islet cells can reassemble and reestablish intraislet connections crucial for coordinated hormone release
                                  across multiple signaling pathways.
                                       Interestingly, the islet architecture of both native whole islets and pseudoislets cultured for 6 days
                                  showed β cells primarily on the islet periphery, with α cells and δ cells situated within an interior layer.
                                  Furthermore, the core of both the cultured native islets and pseudoislets consisted largely of extracellular

insight.jci.org   https://doi.org/10.1172/jci.insight.137017                                                                                      2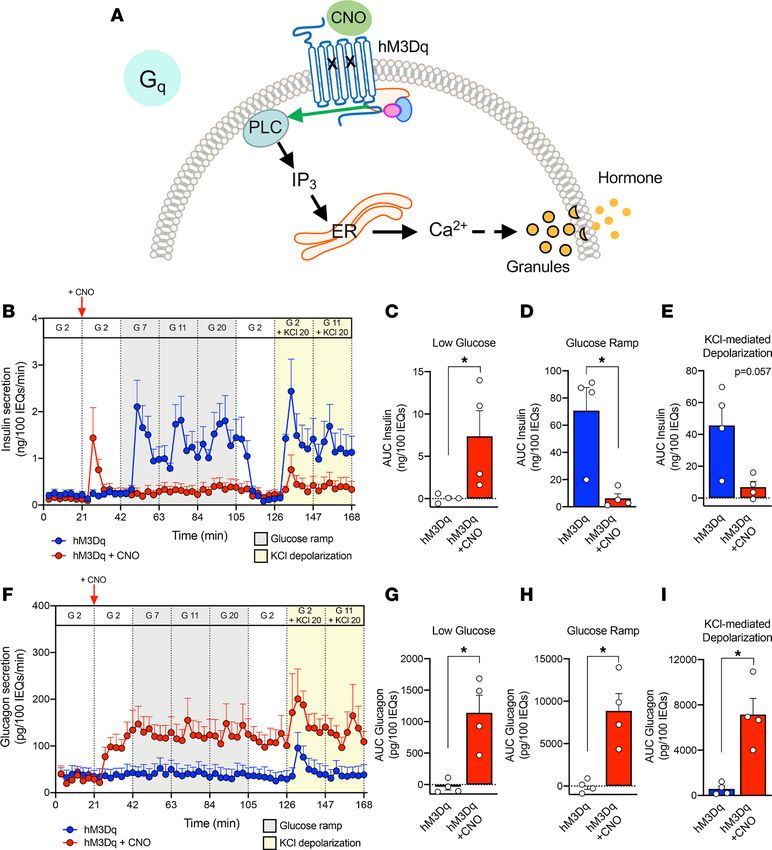
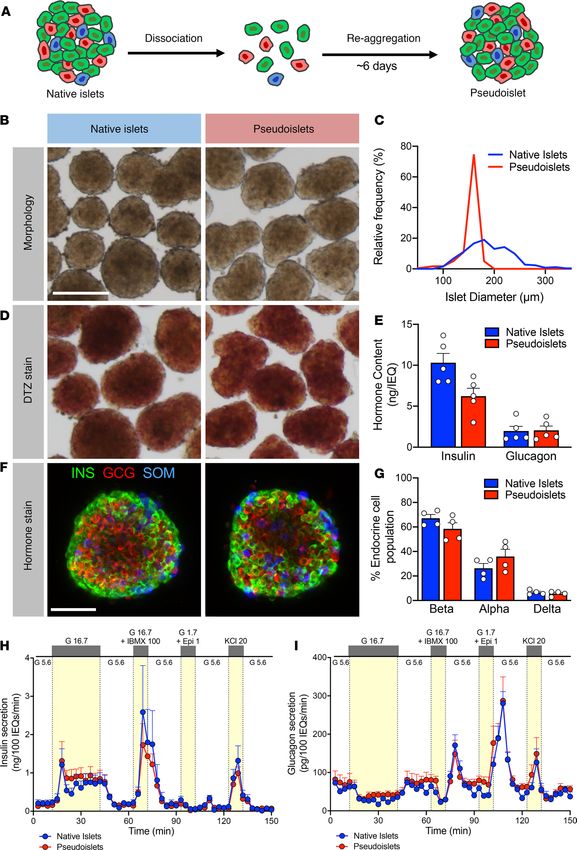
TECHNIC AL ADVANCE

Figure 1. Pseudoislets resemble native human islets in morphology, cell composition, and function. (A) Schematic of pseudoislet formation. (B)
Bright-field images showing the morphology of native islets and pseudoislets. Scale bar: 200 μm. (C) Relative frequency plot of islet diameter com-
paring hand-picked native islets with pseudoislets from the same donor. (D) Dithizone (DTZ) uptake of native islets and pseudoislets. Scale bar: 200
μm. (E) Insulin and glucagon content normalized to islet volume expressed in islet equivalents (IEQs); 1 IEQ corresponds to an islet with a diameter
of 150 μm; n = 5 donors; P > 0.05. (F) Confocal images of native islets and pseudoislets stained for insulin (INS; β cells), glucagon (GCG; α cells),

insight.jci.org   https://doi.org/10.1172/jci.insight.137017                                                                                            3
TECHNIC AL ADVANCE

and somatostatin (SOM; δ cells). Scale bar: 50 μm. (G) Quantification of relative endocrine cell composition of native islets and pseudoislets; n = 4
donors; P > 0.05. Insulin (H) and glucagon (I) secretory response to various secretagogues measured by perifusion of native islets and pseudoislets
from the same donor (n = 5). G 5.6, 5.6 mM glucose; G 16.7, 16.7 mM glucose; G 16.7 + IBMX 100, 16.7 mM glucose with 100 μM isobutylmethylxanthine
(IBMX); G1.7 + Epi 1, 1.7 mM glucose and 1 μM epinephrine; KCl 20, 20 mM potassium chloride (KCl). Wilcoxon matched-pairs signed-rank test was
used to analyze statistical significance in E and G. H and I were analyzed by 2-way ANOVA; P > 0.05. The area under the curve for each secretagogue
was compared by 1-way ANOVA with Dunn’s multiple comparison test (Supplemental Figure 1, E–H and J–M). Data are represented as mean ± SEM.

                                  matrix (collagen IV) and endothelial cells (caveolin-1) (Figure 2, A–C), likely reflective of the consequences
                                  of culture and the loss of shear stress along endothelial cells. The survival of intraislet endothelial cells in
                                  culture for an extended period of time could be due to the nutrient- and growth factor–enriched media.
                                  Additionally, the islet cell arrangement suggests that extracellular matrix and endothelial cells may facili-
                                  tate pseudoislet assembly. Proliferation, as assessed by Ki67, was low in both native and pseudoislets, with
                                  β cells below 0.5% and α cells around 1% (Figure 2, A and D). Similarly, apoptosis, as assessed by TUNEL,
                                  was very low (
TECHNIC AL ADVANCE
Figure 2. Pseudoislets resemble
native human islets in prolifera-
tion, apoptosis, and architecture
and express markers of α and β
cell identity. (A) Immunofluores-
cence visualization of labeling for
insulin (INS; β cells) and glucagon
(GCG; α cells) in combination with
detection of proliferation (Ki67),
apoptosis (TUNEL), extracellular
matrix (collagen IV, COLIV), and
endothelial cells (caveolin-1, CAV1).
Scale bar: 100 μm. (B) Quantifica-
tion of β and α cell proliferation
in native islets and pseudoislets,
expressed as a percentage of INS+
or GCG+ cells expressing Ki67; n = 3
donors; P > 0.05. (C) Quantification
of β and α cell apoptosis by TUNEL
assay; n = 3 donors; P > 0.05. (D)
Quantification of COLIV-expressing
extracellular matrix, expressed as
percentage of COLIV+ area to INS+
and GCG+ cell area; n = 3 donors; P
> 0.05. (E) Quantification of endo-
thelial cell area, expressed as per-
centage of CAV1+ cell area to INS+
and GCG+ cell area; n = 3 donors; P
> 0.05. (F) Expression of transcrip-
tion factors (TF) important for β
cell identity (NKX6.1 and PDX1), α
cell identity (MAFB and ARX), and
pan endocrine cell identity (PAX6
and NKX2.2). Scale bar: 50 μm. (G)
Quantification β cell identity mark-
ers in β cells of native islets and
pseudoislets (n = 3 donors/marker;
P > 0.05). (H) Quantification of α
cell identity markers in α cells of
native islets and pseudoislets (n
= 3–4 donors/marker; P > 0.05). (I
and J) Quantification of pan-endo-
crine markers in β (I) and α (J) cells
of native islets and pseudoislets (n
= 3 donors/marker; P > 0.05). Wil-
coxon matched-pairs signed-rank
test was used to analyze statistical
significance in B–E and G–J. Data
are represented as mean ± SEM.
Endogenous GPCRs, which couple to Gi proteins, include the somatostatin receptor in all islet cells as
well as the α2 adrenergic receptor in β cells (32, 33). CNO (10 μM) had no effect on insulin or glucagon
secretion in mCherry-expressing pseudoislets (Supplemental Figure 2, F and G), thus we compared the
dynamic hormone secretion of hM4Di-expressing pseudoislets with and without CNO in response to a
glucose ramp (2 mM glucose, 7 mM glucose, 11 mM glucose, 20 mM glucose; gray) and depolarization
by KCl (20 mM; yellow) by perifusion (Figure 3, C and G). Activation of Gi signaling had clear inhibitory
effects on insulin secretion by β cells at low glucose, which became more prominent with progressively
higher glucose concentrations (gray shading; Figure 3, C–E). Furthermore, bypassing glucose metabolism
insight.jci.org https://doi.org/10.1172/jci.insight.137017 5TECHNIC AL ADVANCE Figure 3. Gi activation reduces insulin and glucagon secretion. (A) Schematic of incorporation of efficient viral transduction into pseudoislet approach. (B) Schematic of the Gi-coupled GPCR signaling pathway. CNO, clozapine-N-oxide; AC, adenylyl cyclase; ATP, adenosine triphosphate; GIRK, G protein–coupled inwardly rectifying potassium channel; K+, potassium ion. (C) Dynamic insulin secretion assessed by macroperifusion in response to low glucose (G 2, 2 mM glucose; white), glucose ramp (G 7, 7 mM; G 11, 11 mM; G 20, 20 mM glucose; gray), and KCl-mediated depolarization (KCl 20, 20 mM potassium chloride in the presence of G 2 or G 11; yellow) in the absence (blue trace) or presence of CNO (red trace); n = 4 donors/each. 10 μM CNO was added after the first period of 2 mM glucose, as indicated by a vertical red arrow and then continuously administered for the duration of the experiment (red trace). Note the split of y axis to visualize differences between traces at G 2 ± CNO. (D–F) Insulin secretion was integrated by calculating the area under the curve (AUC) for response to the low glucose (white), glucose ramp (gray), and KCl-mediated depolarization (yellow). Baseline was set to the average value of each trace from 0 to 21 minutes (before CNO addition). (G–J) Glucagon secretion was analyzed in parallel with insulin as described above. Insulin and glucagon secretory traces in C and G, respectively, were compared in the absence versus presence of CNO by 2-way ANOVA; ****P < 0.0001 for both insulin and glucagon secretion. Area under the curve of insulin (D–F) and glucagon responses (H–J) to low glucose, glucose ramp, and KCl-mediated depolarization were compared in the absence versus presence of CNO by Mann-Whitney test; *P < 0.05. Data are represented as mean ± SEM. insight.jci.org https://doi.org/10.1172/jci.insight.137017 6
TECHNIC AL ADVANCE

                                  by directly activating β cells via depolarization with potassium chloride did not overcome this inhibition
                                  by Gi signaling (yellow shading; Figure 3, C and F). Together, these data demonstrate that in human β
                                  cells Gi signaling significantly attenuates, but does not completely prevent, insulin secretion and that this
                                  effect, at least in part, occurs downstream of glucose metabolism.
                                       The activation of Gi signaling also had inhibitory effects on glucagon secretion (Figure 3, G–J). We
                                  did not observe a substantial inhibition of glucagon secretion in the hM4Di and hM4Di+CNO group
                                  in response to glucose, but activation of Gi signaling with CNO caused a clear reduction in glucagon
                                  secretion, and secretion remained lower in the hM4Di+CNO group than in control hM4Di pseudo-
                                  islets. When stimulated with potassium chloride, pseudoislets with activated Gi signaling increased
                                  glucagon secretion but not to the level of controls. This demonstrates that the inhibitory effects of Gi
                                  signaling persist even if the α cell is directly activated by depolarization. Thus, in α cells, activation of
                                  Gi signaling reduces glucagon secretion across a range of glucose levels and when the cell is depolar-
                                  ized by potassium chloride.
                                       Activation of Gq signaling greatly stimulates glucagon and somatostatin secretion but has both stimulatory
                                  and inhibitory effects on insulin secretion. Gq-coupled GPCRs signal through phospholipase C, leading to
                                  IP3-mediated Ca2+ release from the endoplasmic reticulum (Figure 4A). Endogenous GPCRs, which
                                  couple to Gq proteins in islets, include the M3 muscarinic receptor and the free fatty acid receptor FFAR
                                  (also known as GPR40) (32, 33). To investigate Gq-coupled GPCR signaling, we introduced hM3Dq
                                  (Ad-CMV-hM3Dq-mCherry), a Gq DREADD, into dispersed human islet cells, allowed reaggregation,
                                  and assessed hM3Dq-expressing pseudoislets by perifusion. When CNO was added to activate Gq signal-
                                  ing, there was an acute increase in insulin secretion. However, this was not sustained, as insulin secretion
                                  fell quickly back to baseline, highlighting a dynamic response to Gq signaling in β cells (Figure 4, B–E).
                                  Furthermore, continued Gq activation inhibited glucose-stimulated insulin secretion, suggesting that in
                                  certain scenarios Gq signaling may override the ability of glucose to stimulate insulin secretion. These
                                  results highlight the value of assessing hormone secretion in the dynamic perifusion system. Finally, Gq
                                  activation reduced, but did not completely prevent, insulin secretion in response to direct depolarization
                                  with potassium chloride, indicating that the inhibitory effects cannot be overcome by bypassing glucose
                                  metabolism and suggesting that they occur downstream of the KATP channel. Together, these data indi-
                                  cate that activated Gq signaling can have both stimulatory and inhibitory effects on human β cells.
                                       In contrast, activation of Gq signaling in α cells robustly increased glucagon secretion in low glucose,
                                  and it remained elevated with continued CNO exposure during glucose ramp as well as in the presence of
                                  potassium chloride (Figure 4, F–I). This indicates that in contrast to the β cells, activation of Gq signaling
                                  in α cells robustly stimulates glucagon secretion, and this response is sustained across a glucose ramp and
                                  during KCl-mediated depolarization.
                                       Given the differing responses in β and α cells and the potential for paracrine signaling, we sought to
                                  measure somatostatin secretion and elucidate the effect of Gq activation in δ cells. The relatively low abun-
                                  dance of δ cells in the native islets and pseudoislets (approximately 5%) prevented detection of somatosta-
                                  tin in the perifusion and microperifusion experiments (below assay sensitivity), so we tested the effect of
                                  CNO in low (2 mM) and high (11 mM) glucose in the context of static incubation. In glucose alone, soma-
                                  tostatin secretion was below the assay detection limit in 3 of the 4 donors tested; in contrast, activation of
                                  Gq signaling increased somatostatin secretion in both low and high glucose (Supplemental Figure 3, A–D),
                                  showing that Gq signaling robustly stimulates δ cells.
                                       Integration of the pseudoislet system with genetically encoded biosensor and microfluidic device allows synchro-
                                  nous measurement of intracellular signals and hormone secretion. While conventional macroperifusion systems,
                                  including the perifusion system used in this study, reliably assess islet hormone secretory profiles (3, 6,
                                  7, 41, 42), their configuration does not allow coupling with imaging systems to measure intracellular
                                  signaling. To overcome this challenge, we developed an integrated microperifusion system consisting of
                                  pseudoislets and a microfluidic device that enables studies of islet intracellular signaling using genetically
                                  encoded biosensors in conjunction with hormone secretion (Figure 5A and Supplemental Figure 4, A–C).
                                  The microfluidic device (Supplemental Figure 4A) (43) is made of bioinert and nonabsorbent materials,
                                  with optimized design for nutrient delivery, synchronous islet imaging by confocal microscopy, and col-
                                  lection of effluent fractions for analysis of insulin and glucagon secretion. The microperifusion system
                                  uses smaller volumes, slower flow rates, and fewer islets than our conventional macroperifusion system
                                  (Supplemental Figure 4, D–F).

insight.jci.org   https://doi.org/10.1172/jci.insight.137017                                                                                         7
TECHNIC AL ADVANCE
Figure 4. Gq activation stimulates glucagon secretion but has stimulatory and inhibitory effects on insulin secretion. (A) Schematic of the Gq-coupled
GPCR signaling pathway. CNO, clozapine-N-oxide; PLC, phospholipase C; IP3, inositol triphosphate; ER, endoplasmic reticulum; Ca2+, calcium ion. (B–E)
Dynamic insulin secretion was assessed by macroperifusion and analyzed, as described in detail in Figure 3; n = 4 donors/each. (F–I) Glucagon secretion was
analyzed in parallel with insulin, as described in Figure 3. Insulin and glucagon secretory traces in B and F, respectively, were compared in the absence versus
presence of CNO by 2-way ANOVA; ****P < 0.0001 for both insulin and glucagon secretion. Area under the curve of insulin (C–E) and glucagon responses
(G–I) to each stimulus were compared in the absence versus presence of CNO by Mann-Whitney test; *P < 0.05. Data are represented as mean ± SEM.
To investigate the dual effects of activated Gq signaling on insulin secretion, we cotransduced pseudoislets
with hM3Dq and GCaMP6f (Supplemental Figure 4C), a calcium biosensor (Ad-CMV-GCaMP6f), as the Gq
pathway conventionally signals through intracellular Ca2+ (Figure 4A). In the absence of CNO, hM3Dq-express-
ing pseudoislets had stepwise increases in GCaMP6f relative intensity as glucose increased, corresponding to
increasing intracellular Ca2+ and highlighting the added value of the system (Figure 5B). This intracellular Ca2+
response to stepwise glucose increase was accompanied by increasing insulin secretion (Figure 5C), but the first
phase of insulin secretion was not as clearly resolved as in the macroperifusion (Figure 4B).
Since there are differences in the design of the macroperifusion and microperifusion systems, we used
multiphysics computational modeling with finite element analysis (44, 45) to model the insulin secretion
dynamics of the two systems (Supplemental Figure 4, H and I). This modeling accurately predicted the
insight.jci.org https://doi.org/10.1172/jci.insight.137017 8TECHNIC AL ADVANCE
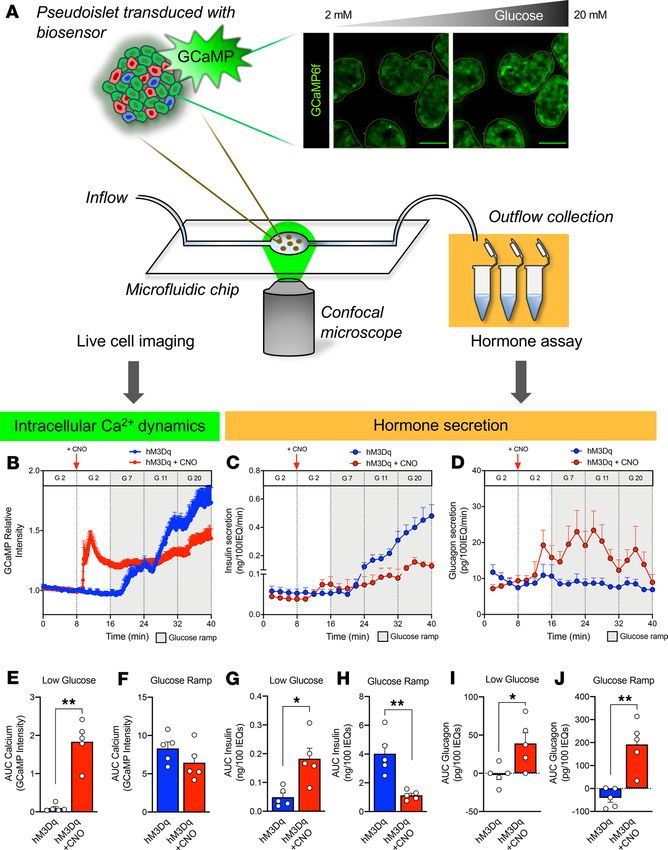
Figure 5. Pseudoislet system integrat-
ed with microfluidic device allows for
coregistration of hormone secretion and
intracellular signaling dynamics. (A)
Schematic of pseudoislet system inte-
gration with a microfluidic device to allow
for synchronous detection of intracellular
signaling dynamics by the genetically
encoded GCaMP6f biosensor and confocal
microscopy and collection of microperifu-
sion efflux for hormone analysis. Dynamic
changes in GCaMP6f relative intensity (B),
insulin secretion (C), and glucagon secre-
tion (D) assessed during microperifusion
in response to a low glucose (G 2 – 2 mM
glucose; white), glucose ramp (G 7, 7 mM;
G 11, 11 mM; and G 20, 20 mM glucose;
gray) and in the absence (blue trace) or
presence of CNO (red trace); n = 3 donors/
each. 10 μM CNO was added after the first
period of 2 mM glucose, as indicated by a
vertical red arrow and then continuously
administered for the duration of the
experiment (red trace). See Supplemen-
tal Videos 1 and 2 for representative
visualization of each experiment. Calcium
signal (E and F) and insulin (G and H) and
glucagon (I and J) secretion was integrat-
ed by calculating the area under the curve
(AUC) for response to the low glucose
(white) and glucose ramp (gray). Baseline
was set to the average value of each
trace from 0 to 8 minutes (before CNO
addition). Calcium and hormone traces in
B–D were compared in the absence versus
presence of CNO by 2-way ANOVA; *P <
0.05 for calcium trace, ****P < 0.0001
for both insulin and glucagon secretion.
Area under the curve of calcium (E and F),
insulin (G and H), and glucagon responses
(I and J) to low glucose and glucose ramp
were compared in the absence versus
presence of CNO by Mann-Whitney test;
*P < 0.05, **P < 0.01. Data are represent-
ed as mean ± SEM.
overall shape of each insulin secretory trace, with the macroperifusion showing a “saw-tooth” pattern
(Supplemental Figure 4H) while the microperifusion had a more progressive increase (Supplemental Fig-
ure 4I). Using this approach, we found that differences in the insulin secretory profiles were primarily due
to the different fluid dynamics and experimental parameters between the two perifusion systems, espe-
cially the experimental time for each stimulus and the flow rate. Overall, this analysis demonstrates how
perifusion parameters can affect insulin secretory pattern and indicates the strength of using complemen-
tary approaches. It also emphasizes the importance of validating new microperifusion devices (46, 47) by
comparing these with macroperifusion systems that have been used for many years by many laboratories.
When Gq signaling was activated with CNO, we again saw a transient stimulation of insulin secretion
at low glucose followed by relative inhibition through the glucose ramp, while glucagon secretion from α
cells was stimulated throughout the entire perifusion, independently of glucose concentration (Figure 5, C,
D, and G–J). Furthermore, the Ca2+ dynamics in response to Gq activation were consistent with the insulin
secretory trace showing a rapid but short-lived increase in intracellular Ca2+. Interestingly, the Ca2+ signal
remained elevated above baseline but did not significantly increase with rising glucose (Figure 5, B, E, and
F). This indicates that the dual effects of Gq signaling on insulin secretion in β cells are largely mediated by
changes in intracellular Ca2+ levels.
insight.jci.org https://doi.org/10.1172/jci.insight.137017 9TECHNIC AL ADVANCE
Discussion
The 3D multicellular human islet architecture, while essential for islet cell function presents experimental
challenges for mechanistic studies of intracellular signaling pathways. Using primary human islets, we
developed a pseudoislet system that resembles native human islets in morphology, cellular composition,
cell identity, and dynamic insulin and glucagon secretion. This system allows for efficient virally mediated
genetic manipulation in almost all cells in the pseudoislet. To evaluate the coordination between intracellu-
lar signals and islet hormone secretion, we developed an integrated system consisting of pseudoislets and a
microfluidic device that enables studies of islet intracellular signaling using genetically encoded biosensors
in conjunction with hormone secretion. Furthermore, we used this integrated approach to define aspects of
human islet biology by investigating GPCR signaling pathways using DREADDs and a calcium biosensor.
Despite α and β cells both being excitable secretory cells and sharing many common developmen-
tal and signaling components, this experimental approach allowed us to demonstrate similar and distinct
responses to activation of GPCR signaling pathways, highlighting the uniqueness in each cell’s molecular
machinery. The activation of Gi signaling was inhibitory in β and α cells, resulting in reduced insulin and
glucagon secretion, respectively, and showed a more substantial affect in β cells, where this signaling blunt-
ed insulin response to both a glucose ramp and to KCl-mediated depolarization. Interestingly, direct KCl
depolarization was not sufficient to overcome these inhibitory effects in either β or α cells, suggesting that
reduced cAMP via the inhibition of adenylyl cyclase, in addition to cAMP-independent pathways (48),
plays a role in both insulin and glucagon secretion. These results align well with those of recent studies in
β cells, suggesting that cAMP tone is crucial for insulin secretion, and observations in α cells highlighting
cAMP as a key mediator of glucagon secretion (13, 17, 19, 49).
There were major differences in response to activation of Gq signaling in β cells compared with α cells.
In α cells, the activated Gq signaling elicited a robust and sustained increase in glucagon secretion in the
presence of a glucose ramp and potassium chloride. In contrast, Gq signaling in β cells had a transient stim-
ulatory effect in low glucose and then inhibitory effects on both insulin and intracellular Ca2+ levels, with
sustained activation during glucose ramp. Interestingly, previous studies of acetylcholine signaling have
also reported dual effects on Ca2+ dynamics in β cells depending on the length of stimulation (50). This
signaling was thought to be mediated through the muscarinic acetylcholine receptor M3 (from which the
hM3Dq DREADD is based). Overall, these results suggest a negative feedback or protective mechanism
that prevents sustained insulin release from β cells in response to Gq signaling that is not active in α cells
under similar circumstances.
There are limitations and caveats to the current study. First, our approach resulted in DREADD expres-
sion in all cell types. Although we can distinguish the effects on islet α and β cells through their distinct
hormone secretion, it is possible that complex paracrine signaling contributes to the results described here.
Future modifications of this system could incorporate cell-specific promoters to target a particular islet cell
type. Second, the DREADDs are likely expressed at higher levels than endogenous GPCRs. To mitigate
this, we used the appropriate DREADD-expressing pseudoislets as our controls and were encouraged to
see normal secretory responses in these control pseudoislets. Third, while there is some concern that CNO
can be reverse metabolized in vivo into clozapine, which could potentially have off-target effects (51), this
is unlikely in our in vitro system. We also verified that CNO had no effect on mCherry-expressing pseudo-
islets, making it unlikely that CNO itself is competitively inhibiting endogenous receptors in human islets.
Fourth, we used a CNO concentration of 10 μM for all of our experiments, a standard concentration used
for in vitro assays (16, 52), but it is possible that islet cells may show dose-dependent effects. Finally, this is
an in vitro study focused on acute functional effects of these pathways on human islets, and chronic in vivo
studies of these pathways may show different results. For example, in mouse β cells, chronic in vivo activa-
tion of Gq pathways using the DREADD system lead to an increase in β cell function and mass (53) while
inhibition of Gi signaling with β cell–specific pertussis toxin expression affected only function (54). Future
work could involve transplantation of DREADD-expressing pseudoislets into immunodeficient mice to
study the effect of activating these pathways on human islets in vivo (55).
Overall, these findings demonstrate the utility of the pseudoislet system for its ability to manipulate human
islets. Other approaches include inducible pluripotent stem cells that allow similar genetic manipulation. How-
ever, it is unclear if these approaches create entirely normal human islet cells. We show in this system that α
and β cells in pseudoislets maintain their fully differentiated state as well as their dynamic responsiveness to
glucose and other stimuli. Additionally, this approach allows for the study of all islet cells within the context of
insight.jci.org https://doi.org/10.1172/jci.insight.137017 10TECHNIC AL ADVANCE
other cell types and 3D assembly. While our data suggest that breaking down and rebuilding the islet does not
impair paracrine interactions, this could be further evaluated by looking at secretion in response to factors that
exclusively rely on paracrine interactions such as ghrelin or certain amino acids (17, 56, 57).
Ultimately, the integration of the pseudoislet approach with a microfluidic perifusion system and live-
cell imaging provides a powerful experimental platform to gain insight into human islet biology and the
mechanisms controlling regulated islet hormone secretion, which currently limit the development of novel
therapeutic approaches. Here, we focus on virally mediated gene expression to alter signaling pathways,
but this system could be adapted to accommodate technologies such as CRISPR. Furthermore, after islet
dispersion into single cells, techniques to purify live-cell populations such as FACS with cell surface anti-
bodies (41, 58) could be incorporated to allow manipulation of the pseudoislet cellular composition as well
as cell-specific gene manipulation. Combined with accurate cell-specific targeting, this approach would
allow the measurement of intracellular dynamics at the individual cell level and distinguish intracellular
responses of islet endocrine cells to stimuli.
Methods
Human islet isolation. Human islets (n = 24 preparations, Supplemental Table 1) were obtained through part-
nerships with the IIDP (https://iidp.coh.org/), Alberta Diabetes Institute IsletCore (https://www.epicore.
ualberta.ca/IsletCore/), and Human Pancreas Analysis Program (https://hpap.pmacs.upenn.edu/) or iso-
lated at the Institute of Cellular Therapeutics of the Allegheny Health Network. Assessment of human
islet function was performed by islet macroperifusion assay on the day of arrival, as previously described
(42). Primary human islets were cultured in CMRL 1066 (MediaTech, 15-110-CV) media (5.5 mM glucose,
10% FBS [MilliporeSigma, 12306C], 1% Penicillin/Streptomycin [Gibco, 15140-122], 2 mM L-glutamine
[Gibco, 25030-081]) in 5% CO2 at 37oC forTECHNIC AL ADVANCE
Media from this incubation was assessed for insulin and glucagon by radioimmunoassay (insulin,
RI-13K, MilliporeSigma; glucagon, GL-32K, MilliporeSigma; somatostatin, RK-060-03, Phoenix
Pharmaceuticals) as previously reported (3).
Assessment of islet function by macroperifusion. Function of native islets and pseudoislets was studied in a
dynamic cell perifusion system at a perifusate flow rate of 1 mL/min as described previously (3, 42) using
approximately 250 IEQs/chamber. The effluent was collected at 3-minute intervals using an automatic
fraction collector. Insulin and glucagon concentrations in each perifusion fraction and islet extracts were
measured by radioimmunoassay (insulin, RI-13K; glucagon, GL-32K, MilliporeSigma).
Microperifusion platform. The microperifusion platform (Figure 5 and Supplemental Figure 4) is
based on a previously published microfluidic device with modifications (43). Design modifications were
incorporated using SolidWorks 2018 3D computer-aided design (CAD) software. Microfluidic devices
were machined, according to the CAD models, using a computer numerical controlled milling machine
(MDX-540, Roland) from poly(methyl methacrylate) workpieces. To reduce the optical working dis-
tance, through holes were milled into the culture wells and a no. 1.5 glass coverslip was bonded to the
bottom component of the microfluidic device using a silicone adhesive (7615A21, McMaster-Carr). Cus-
tom gaskets were fabricated using a 2-part silicone epoxy (Duraseal 1533, Cotronics Corp.) and bonded
into the top component of the device using a specialized polyester adhesive (PS-1340, Polymer Science).
The 2 components of the microfluidic device (Supplemental Figure 4A) were assembled in a commer-
cially available device holder (Fluidic Connect PRO with 4515 Inserts, Micronit Microfluidics), which
creates a sealed system and introduces fluidic connections to a peristaltic pump (P720, Instech) though
0.01-inch FEP tubing (IDEX, 1527L) and a low-volume bubble trap (Omnifit, 006BT) placed in the fluid
line just before the device inlet to prevent bubbles from entering the system (see Supplemental Figure 4B
for microperifusion assembly).
Assessment of pseudoislets by microperifusion. The microperifusion apparatus was contained in a tem-
perature-controlled incubator (37°C) fitted to a Zeiss LSM 880 laser-scanning confocal microscope
(Zeiss Microscopy Ltd) (Supplemental Figure 4B). Pseudoislets (~25 IEQs/chamber) were loaded in
a prewetted well, imaged with a stereomicroscope to determine loaded IEQ, and perifused at 100 μL/
min flow rate with Krebs-Ringer buffer containing 125 mM NaCl, 5.9 mM KCl, 2.56 mM CaCl2, 1 mM
MgCl2, 25 mM HEPES, 0.1% BSA, pH 7.4, at 37°C. Perifusion fractions were collected at 2-minute
intervals following a 20-minute equilibration period in 2 mM glucose using a fraction collector (model
2110, Bio-Rad) and analyzed for insulin and glucagon concentration by RIA (insulin, RI-13K; gluca-
gon, GL-32K, MilliporeSigma). GCaMP6f biosensor was excited at 488 nm and fluorescence emis-
sion detected at 493–574 nm. Images were acquired at 15-μm depth every 5 seconds using a ×20/0.80
Plan-Apochromat objective. Image analysis was performed with MetaMorph v7.1 software (Molecular
Devices). Pseudoislets in the field of view (3–7 pseudoislets/field) were annotated using the region-of-in-
terest tool. The GCaMP6f fluorescence intensity recorded for each time point was measured across
annotated pseudoislet regions and normalized to the baseline fluorescence intensity acquired over the
60 seconds in 2 mM glucose before stimulation. The calcium, insulin, and glucagon traces were aver-
aged from 5 microperifusion experiments from 3 independent donors.
Fluid dynamics and mass transport modeling. 2D finite element method (FEM) models, which incorpo-
rate fluid dynamics, mass transport, and islet physiology, were developed for the macroperifusion and
microperifusion platforms and implemented in COMSOL Multiphysics Modeling Software (release ver-
sion 5.0). Fluid dynamics were governed by the Navier-Stokes equation for incompressible Newtonian
fluid flow. Convective and diffusive transport of oxygen, glucose, and insulin were governed by the generic
equation for transport of a diluted species in the chemical species transport module. Islet physiology was
based on Hill (generalized Michaelis-Menten) kinetics using local concentrations of glucose and oxygen,
as previously described (44, 45). The geometry of the macroperifusion platform was modeled as the 2D
cross section of a cylindrical tube with fluid flowing from bottom to top (Supplemental Figure 4D). The
geometry of the microperifusion platform was modeled as a 2D cross section of the microfluidic device
with fluid flow from left to right (Supplemental Figure 4E). In both the macroperifusion and microper-
ifusion models, 5 islets with a diameter of 150 μm (5 IEQs) were placed in the flow path. FEM models
were solved as a time-dependent problem, allowing for intermediate time steps that corresponding with
fraction collection time during macroperifusion and microperifusion. A list of the parameters used in the
computational models is provided in Supplemental Table 3.
insight.jci.org https://doi.org/10.1172/jci.insight.137017 12TECHNIC AL ADVANCE
Statistics. Data are expressed as mean ± SEM. A P value of less than 0.05 was considered significant.
Analyses of area under the curve and statistical comparisons (Mann-Whitney test, Wilcoxon matched-
pairs signed-rank test, and 1- and 2-way ANOVA) were performed using Prism v8 software (GraphPad).
Statistical details of experiments are described in the figure legends and the Results.
Study approval. The Vanderbilt University Institutional Review Board does not classify deidentified
human pancreatic specimens as human subject research.
Author contributions
JTW, RH, HAN, MI, JRL, ΑA, MB, and ACP conceived and designed the experiments. JTW, RH, HAN,
GP, RA, CR, DCS, MI, PW, AGO, RB, and MB performed experiments or analyzed the data and inter-
preted results. JTW, MB, and ACP wrote the manuscript. All authors reviewed, edited, and approved the
final version.
Acknowledgments
We thank the organ donors and their families for their invaluable donation and the International Insti-
tute for Advancement of Medicine, Organ Procurement Organizations, National Disease Research
Exchange, and the Alberta Diabetes Institute IsletCore for their partnership in studies of human pan-
creatic tissue for research. This study used human pancreatic islets that were provided by the National
Institute of Diabetes and Digestive and Kidney Diseases–funded IIDP at the City of Hope (NIH grant
2UC4 DK098085). Experiments were performed in part through the use of the Vanderbilt Cell Imaging
Shared Resource (supported by NIH grants CA68485, DK20593, DK58404, DK59637 and EY08126).
This research was performed using resources and/or funding provided by the National Institute of Diabe-
tes and Digestive and Kidney Diseases–supported Human Islet Research Network (RRID:SCR_014393;
https://hirnetwork.org; UC4 DK104211, DK108120, DK112232, DK120456, DK122638, DK104208),
by NIH grants DK106755, DK117147, DK94199, T32GM007347, F30DK118830, F30DK112630,
F31DK118860, F30AA027126, P30DK020541, and DK20593; by grants from JDRF (2-SRA-2019-699-
S-B); by The Leona M. and Harry B. Helmsley Charitable Trust, and by the Department of Veterans
Affairs (BX000666).
Address correspondence to: Marcela Brissova or Alvin C. Powers, Vanderbilt University, 7465 MRB IV, 2213
Garland Avenue, Nashville, Tennessee 37232-0475, USA. Phone: 615.936.1729; Email: marcela.brissova@
vanderbilt.edu (MB). Phone: 615.936.7678; Email: al.powers@vumc.org (ACP). Or to: Ashutosh Agarwal,
University of Miami, #475, 1951 NW 7th Avenue, Miami, Florida 33136, USA. Phone: 305.243.8925;
Email: a.agarwal2@miami.edu.
1. Chen C, Cohrs CM, Stertmann J, Bozsak R, Speier S. Human beta cell mass and function in diabetes: Recent advances in
knowledge and technologies to understand disease pathogenesis. Mol Metab. 2017;6(9):943–957.
2. Halban PA, et al. β-Cell failure in type 2 diabetes: postulated mechanisms and prospects for prevention and treatment. Diabetes
Care. 2014;37(6):1751–1758.
3. Brissova M, et al. α Cell function and gene expression are compromised in type 1 diabetes. Cell Rep. 2018;22(10):2667–2676.
4. Lu M, Li C. Nutrient sensing in pancreatic islets: lessons from congenital hyperinsulinism and monogenic diabetes. Ann N Y
Acad Sci. 2018;1411(1):65–82.
5. Naylor RN, Greeley SA, Bell GI, Philipson LH. Genetics and pathophysiology of neonatal diabetes mellitus. J Diabetes Investig.
2011;2(3):158–169.
6. Hart NJ, et al. Cystic fibrosis-related diabetes is caused by islet loss and inflammation. JCI Insight. 2018;3(8):98240.
7. Haliyur R, et al. Human islets expressing HNF1A variant have defective β cell transcriptional regulatory networks. J Clin Invest.
2019;129(1):246–251.
8. Gloyn AL, et al. Activating mutations in the gene encoding the ATP-sensitive potassium-channel subunit Kir6.2 and permanent
neonatal diabetes. N Engl J Med. 2004;350(18):1838–1849.
9. Talchai C, Xuan S, Lin HV, Sussel L, Accili D. Pancreatic β cell dedifferentiation as a mechanism of diabetic β cell failure. Cell.
2012;150(6):1223–1234.
10. Cnop M, Welsh N, Jonas JC, Jörns A, Lenzen S, Eizirik DL. Mechanisms of pancreatic beta-cell death in type 1 and type 2 dia-
betes: many differences, few similarities. Diabetes. 2005;54 Suppl 2:S97–107.
11. Unger RH, Cherrington AD. Glucagonocentric restructuring of diabetes: a pathophysiologic and therapeutic makeover. J Clin
Invest. 2012;122(1):4–12.
12. Tokarz VL, MacDonald PE, Klip A. The cell biology of systemic insulin function. J Cell Biol. 2018;217(7):2273–2289.
13. Yu Q, Shuai H, Ahooghalandari P, Gylfe E, Tengholm A. Glucose controls glucagon secretion by directly modulating cAMP in
insight.jci.org https://doi.org/10.1172/jci.insight.137017 13TECHNIC AL ADVANCE
alpha cells. Diabetologia. 2019;62(7):1212–1224.
14. Gylfe E, Gilon P. Glucose regulation of glucagon secretion. Diabetes Res Clin Pract. 2014;103(1):1–10.
15. Hughes JW, Ustione A, Lavagnino Z, Piston DW. Regulation of islet glucagon secretion: Beyond calcium. Diabetes Obes Metab.
2018;20 Suppl 2:127–136.
16. Zhu L, et al. Intra-islet glucagon signaling is critical for maintaining glucose homeostasis. JCI Insight. 2019;5:127994.
17. Capozzi ME, et al. β Cell tone is defined by proglucagon peptides through cAMP signaling. JCI Insight. 2019;4(5):126742.
18. Svendsen B, et al. Insulin secretion depends on intra-islet glucagon signaling. Cell Rep. 2018;25(5):1127–1134.e2.
19. Elliott AD, Ustione A, Piston DW. Somatostatin and insulin mediate glucose-inhibited glucagon secretion in the pancreatic
α-cell by lowering cAMP. Am J Physiol Endocrinol Metab. 2015;308(2):E130–E143.
20. Unger RH, Orci L. Paracrinology of islets and the paracrinopathy of diabetes. Proc Natl Acad Sci USA. 2010;107(37):16009–16012.
21. Brissova M, et al. Assessment of human pancreatic islet architecture and composition by laser scanning confocal microscopy.
J Histochem Cytochem. 2005;53(9):1087–1097.
22. Dai C, et al. Islet-enriched gene expression and glucose-induced insulin secretion in human and mouse islets. Diabetologia.
2012;55(3):707–718.
23. Cabrera O, Berman DM, Kenyon NS, Ricordi C, Berggren PO, Caicedo A. The unique cytoarchitecture of human pancreatic
islets has implications for islet cell function. Proc Natl Acad Sci USA. 2006;103(7):2334–2339.
24. Rodriguez-Diaz R, et al. Paracrine interactions within the pancreatic islet determine the glycemic set point. Cell Metab.
2018;27(3):549–558.e4.
25. Yu Y, et al. Bioengineered human pseudoislets form efficiently from donated tissue, compare favourably with native islets in
vitro and restore normoglycaemia in mice. Diabetologia. 2018;61(9):2016–2029.
26. Peiris H, et al. Discovering human diabetes-risk gene function with genetics and physiological assays. Nat Commun.
2018;9(1):3855.
27. Arda HE, et al. Age-dependent pancreatic gene regulation reveals mechanisms governing human β cell function. Cell Metab.
2016;23(5):909–920.
28. Hilderink J, et al. Controlled aggregation of primary human pancreatic islet cells leads to glucose-responsive pseudoislets com-
parable to native islets. J Cell Mol Med. 2015;19(8):1836–1846.
29. Furuyama K, et al. Diabetes relief in mice by glucose-sensing insulin-secreting human α-cells. Nature. 2019;567(7746):43–48.
30. Zuellig RA, et al. Improved physiological properties of gravity-enforced reassembled rat and human pancreatic pseudo-islets.
J Tissue Eng Regen Med. 2017;11(1):109–120.
31. Foty R. A simple hanging drop cell culture protocol for generation of 3D spheroids. J Vis Exp. 2011;(51):2720.
32. Ahrén B. Islet G protein-coupled receptors as potential targets for treatment of type 2 diabetes. Nat Rev Drug Discov.
2009;8(5):369–385.
33. Persaud SJ. Islet G-protein coupled receptors: therapeutic potential for diabetes. Curr Opin Pharmacol. 2017;37:24–28.
34. Weis WI, Kobilka BK. The molecular basis of G protein-coupled receptor activation. Annu Rev Biochem. 2018;87:897–919.
35. Foord SM, et al. International Union of Pharmacology. XLVI. G protein-coupled receptor list. Pharmacol Rev. 2005;57(2):279–288.
36. Hauser AS, Attwood MM, Rask-Andersen M, Schiöth HB, Gloriam DE. Trends in GPCR drug discovery: new agents, targets
and indications. Nat Rev Drug Discov. 2017;16(12):829–842.
37. Armbruster BN, Li X, Pausch MH, Herlitze S, Roth BL. Evolving the lock to fit the key to create a family of G protein-coupled
receptors potently activated by an inert ligand. Proc Natl Acad Sci USA. 2007;104(12):5163–5168.
38. Wess J. Use of designer Gprotein-coupled receptors to dissect metabolic Pathways. Trends Endocrinol Metab. 2016;27(9):600–603.
39. Roth BL. DREADDs for neuroscientists. Neuron. 2016;89(4):683–694.
40. Guettier JM, et al. A chemical-genetic approach to study G protein regulation of beta cell function in vivo. Proc Natl Acad Sci
USA. 2009;106(45):19197–19202.
41. Saunders DC, et al. Ectonucleoside triphosphate diphosphohydrolase-3 antibody targets adult human pancreatic β cells for in
vitro and in vivo analysis. Cell Metab. 2019;29(3):745–754.e4.
42. Kayton NS, et al. Human islet preparations distributed for research exhibit a variety of insulin-secretory profiles. Am J Physiol
Endocrinol Metab. 2015;308(7):E592–E602.
43. Lenguito G, et al. Resealable, optically accessible, PDMS-free fluidic platform for ex vivo interrogation of pancreatic islets. Lab
Chip. 2017;17(5):772–781.
44. Buchwald P, Tamayo-Garcia A, Manzoli V, Tomei AA, Stabler CL. Glucose-stimulated insulin release: Parallel perifusion stud-
ies of free and hydrogel encapsulated human pancreatic islets. Biotechnol Bioeng. 2018;115(1):232–245.
45. Buchwald P. A local glucose-and oxygen concentration-based insulin secretion model for pancreatic islets. Theor Biol Med
Model. 2011;8:20.
46. Wang Y, et al. Application of microfluidic technology to pancreatic islet research: first decade of endeavor. Bioanalysis.
2010;2(10):1729–1744.
47. Jun Y, et al. In vivo-mimicking microfluidic perfusion culture of pancreatic islet spheroids. Sci Adv. 2019;5(11):eaax4520.
48. Schwetz TA, Ustione A, Piston DW. Neuropeptide Y and somatostatin inhibit insulin secretion through different mechanisms.
Am J Physiol Endocrinol Metab. 2013;304(2):E211–E221.
49. Tengholm A, Gylfe E. cAMP signalling in insulin and glucagon secretion. Diabetes Obes Metab. 2017;19 Suppl 1:42–53.
50. Gilon P, Nenquin M, Henquin JC. Muscarinic stimulation exerts both stimulatory and inhibitory effects on the concentration of
cytoplasmic Ca2+ in the electrically excitable pancreatic B-cell. Biochem J. 1995;311(Pt 1):259–267.
51. Gomez JL, et al. Chemogenetics revealed: DREADD occupancy and activation via converted clozapine. Science.
2017;357(6350):503–507.
52. Smith KS, Bucci DJ, Luikart BW, Mahler SV. DREADDS: Use and application in behavioral neuroscience. Behav Neurosci.
2016;130(2):137–155.
53. Jain S, Ruiz de Azua I, Lu H, White MF, Guettier JM, Wess J. Chronic activation of a designer G(q)-coupled receptor improves
β cell function. J Clin Invest. 2013;123(4):1750–1762.
54. Regard JB, et al. Probing cell type-specific functions of Gi in vivo identifies GPCR regulators of insulin secretion. J Clin Invest.
insight.jci.org https://doi.org/10.1172/jci.insight.137017 14TECHNIC AL ADVANCE
2007;117(12):4034–4043.
55. Dai C, et al. Age-dependent human β cell proliferation induced by glucagon-like peptide 1 and calcineurin signaling. J Clin
Invest. 2017;127(10):3835–3844.
56. Gray SM, et al. Intraislet ghrelin signaling does not regulate insulin secretion from adult mice. Diabetes. 2019;68(9):1795–1805.
57. DiGruccio MR, et al. Comprehensive alpha, beta and delta cell transcriptomes reveal that ghrelin selectively activates delta cells
and promotes somatostatin release from pancreatic islets. Mol Metab. 2016;5(7):449–458.
58. Dorrell C, et al. Isolation of major pancreatic cell types and long-term culture-initiating cells using novel human surface mark-
ers. Stem Cell Res. 2008;1(3):183–194.
insight.jci.org https://doi.org/10.1172/jci.insight.137017 15You can also read