Current Situation and Future Outlooks of the Chickpea Sub sector in Ethiopia
←
→
Page content transcription
If your browser does not render page correctly, please read the page content below
Current Situation and Future Outlooks of the Chickpea
                 Sub‐sector in Ethiopia

   Menale Kassie1, Bekele Shiferaw1, Solomon Asfaw1, Tsedeke Abate1,
Geoffrey Muricho1, Setotaw Ferede2, Million Eshete2, and Kebebew Assefa2

     1
      International Crops Research Institute for the Semi‐Arid Tropics
                            (ICRISAT), Nairobi

             2
             Ethiopian Institute of Agricultural Research (EIAR),
         Deber Zeit Agricultral Research Centre, Debre Zeit, Ethiopia

                                 June 2009

                             ©ICRISAT and EIAR
Table of contents List of Tables ..................................................................................................................... ii List of Figures.................................................................................................................... ii 1. Introduction................................................................................................................... 1 2. Methods.......................................................................................................................... 2 3. Global chickpea production and trade ....................................................................... 3 3.1. Chickpea import and export trends .......................................................................... 5 3.2. Chickpea producer price trends ............................................................................... 6 4. Chickpea sub-sector in Ethiopia.................................................................................. 7 4.1. Area and production trends...................................................................................... 8 4.2. Available technologies........................................................................................... 10 4.3. Chickpea producing areas ...................................................................................... 10 4.4. Chickpea seed systems........................................................................................... 11 5. Chickpea marketing systems ..................................................................................... 17 5.1. Structure of chickpea markets................................................................................ 17 5.2. Markets and grain quality ...................................................................................... 20 5.3. Chickpea exports and price trends ......................................................................... 22 5.4. Chickpea price trends in Ethiopia .......................................................................... 23 6. Outlooks for Ethiopian chickpea............................................................................... 26 7. Conclusions.................................................................................................................. 30 References........................................................................................................................ 33 Appendix.......................................................................................................................... 35
List of Tables
Table 1: Demand and supply for seed during the 2005 cropping year……………….….15
Table 2: Chickpea are and production forecast under different scenarios…………….…27

List of Figures
Figure 1: World chickpea production trends …………………………….………………4
Figure 2: Chickpea area share of major producing countries during 1994-2006…………5
Figure 3: Chickpea production share of major producing countries during 1994-2006…..5
Figure 4: Average chickpea export share by major exporting countries during 1994-
         2005…………………………………………………………………………….6
Figure 5: Average chickpea import share by major importing countries during 1994-
         2005………………………………………………………………………….…6
Figure 6: World chickpea producer price trends (1994-2005)……………………………7
Figure 7: Ethiopian chickpea production share in Africa (1994-2006)…………………...7
Figure 8: Average chickpea contribution to total pulse production during 1995-2008…...8
Figure 9: Chickpea area share from total average pulse cultivated area during 1995-
         2005…………………………………………………………………………….8
Figure 10: Pulse crop production trends in Ethiopia (1995-2008)………………………..8
Figure 11: Cultivated area under pulse production during 1995-2008……………………9
Figure 12: Chickpea yield trends in Ethiopia (1995-2008)……………………………….9
Figure 13: Region’s average chickpea cultivated area share during 1999-2008………...11
Figure 14: Region’s average chickpea production share during 1999-2008…………….11
Figure 15: Formal seed system framework in Ethiopia………………………………….13
Figure 16: Chickpea export trends in Ethiopia (1998-2005)…………………………….23
Figure 17: Major importers of Ethiopian chickpea ………………………………..…….23
Figure 18: Chickpea producer price trends (1994-2005)………………………………...24
Figure 19: Monthly average kabuli and desi producer price trends in Debre Zeit (2006-
           Jan 2008)……..………………………………………………………………25
Figure 20: Monthly average kabuli and desi retail price trend in Debre Zeit (April 2004-
           Jan 2008)……………………………………………………………………..25
Figure 21: Average CIF fertilizer (DAP and urea) prices (1996-2008)………………….27

                                                                                           ii
Figure 22: Chickpea area and production projection……………………………….........28
Figure 23: Chickpea demand and net-trade projection…………..………........................29
iii1. Introduction
Chickpea is a less labor-intensive crop and its production demands low external inputs
compared to cereals. In Ethiopia, chickpea is widely grown across the country and serves
as a multi-purpose crop (Shiferaw et al., 2007). First, it fixes atmospheric nitrogen in
soils and thus improves soil fertility and saves fertilizer costs in subsequent crops.
Second, it improves more intensive and productive use of land, particularly in areas
where land is scarce and the crop can be grown as a second crop using residual moisture.
Third, it reduces malnutrition and improves human health especially for the poor who
cannot afford livestock products. It is an excellent source of protein, fiber, complex
carbohydrates, vitamins, and minerals. Fourth, the growing demand in both the domestic
and export markets provides a source of cash for smallholder producers. Fifth, it
increases livestock productivity as the residue is rich in digestible crude protein content
compared to cereals.
Chickpea production works well in rotation with cereals such as wheat and teff widely
grown in relatively well-drained black soils. Globally, chickpea is adapted to black soils
in the cool semi-arid areas of the tropics, sub-tropics as well as the temperate areas. It is
the third most important pulses gown in the world after dry bean and pea and constitutes
20% of the world’s pulse production (Joshi et al., 2001). Chickpea was first produced in
the Middle East about 7, 000 years ago. At present, it is produced in over 40 countries
represented in all continents. However, the most important chickpea producing countries
are India, Turkey, Pakistan, Iran, Mexico, Australia, Ethiopia, Myanmar, and Canada.
Chickpea is currently grown on about 10.7 million hectares worldwide with average
annual production of 8.2 million tonnes. About 95% of chickpea cultivation and
consumption is in the developing countries.
There are two types of chickpea produced globally, namely desi and kabuli chickpeas.
kabuli chickpeas have a larger cream-colored seed with a thin seed coat whereas the desi
type has a smaller, reddish brown-colored seed with a thick seed coat. On average, world
production consists of about 75% of desi and 25% of kabuli types (Agricultural and Agri-
food Canada, 2004). Although kabuli types can be profitably adapted in the country,
Ethiopia traditionally produces largely the desi types. Morphologically, desi types have
1pink flowers while the kabuli types are characterized by white flowers. It is grown at the
end of the main rainy season using residual soil moisture. This allows farmers to practice
double cropping, which in turn increases productivity of scarce land resource and serves
as an additional source of income.
This study aims to assess the current situation and outlook for chickpea in Ethiopia. The
objective is to summarize the key features of the chickpea sub-sector and present some
projections for the future of the chickpea economy in the country. The study benefits
from reviews of various existing studies and analysis of secondary data, but presents a
more coherent synthesis of the existing situation and outlooks for the future. The brief
assessment is expected to be a simple reference for breeders and development agencies
about the key features, constraints, intervention areas and opportunities for harnessing the
chickpea sub-sector towards agricultural development in the country.
In order to present the key features in perspective, the study first presents the global
scenarios focusing on world chickpea area, production, prices, and international trade
(import and export of chickpea). Following this, the Ethiopian scenario is presented with
a focus on available technologies, seed systems for technology diffusion and impact and
market structures and constraints along the value chain. This is followed by presentation
of future outlooks and opportunities and the final section concludes by highlighting key
finding and issues for research and development policy.
2. Methods
Data used for this paper are primarily obtained from secondary sources such as
FAOSTAT, published documents and various national reports. The secondary data
comprised of aggregate data on global, regional and national production output, data on
export and import volumes of chickpea, global and national chickpea price trends over
years, and data related to access to seeds. The time series data used for this paper ranges
from a minimum of 3 years to a maximum of 14 years.
We employed a number of statistical tools to analyze, summarize and present the data.
For analyzing the historical trends over the years and estimate the growth rate, descriptive
statistics are used. Two approaches are followed to project future outlooks for chickpea in
2Ethiopia. First precedent growth rate which is obtained from a regression model is used
to project future chickpea area and production. In this case, two scenarios are developed
to project future outlooks for chickpea. In the fist scenario it is assumed that farmers will
continue producing chickpea using their existing technology and methods of production.
The second scenario assumes technological change as a result of adoption of improved
varieties, especially the newly released kabuli types. The base year used for this analysis
is 2008 and makes projections out to the year 2020.
The second approach used is a more robust quantitative modeling method to project
plausible futures for chickpea area, production, yield, demand and net-trade as part of a
global trade model. The global food projection modeling framework of IMPACT (the
International Model for Policy analysis of Agricultural Commodities and Trade) recently
calibrated and adapted for policy analysis of dryland crops is applied to examine the
future situation for chickpea in Ethiopia. It uses the new and spatially disaggregated
version of the model which allows supply, demand, and prices to be determined within
each country and regional sub-models and linked at the global level through trade.
Incorporating dryland crops such as chickpea into the IMPACT modeling framework
however required extensive crop-specific data on area, production, supply, demand, trade
and several associated parameters. For any specification of these underlying parameters,
IMPACT generates projections for crop area, production, demand for food, feed and
other uses, domestic and international prices and trade (import, export and net-trade). The
version of the model used for this paper has a base year of 2000 and makes projections
out to the year 2020. For detail information on the use of IMPACT model and projections
for a wider range of crops, refer to Shiferaw et al., 2008.
3. Global chickpea production and trade
Between 1994 and 2005, worldwide chickpea was grown in about 10.7 million hectares
with annual growth rate of 0.69% and coefficient of variation of 7.3%. 1 Compared to
cereals and other crops, there have not been significant increases in chickpea yields. For
the same period, annual increase in average yield was only 0.9% with a coefficient of
1
The data for world chickpea outlook and situation analysis are derived from FAOSTAT database (www.
faostat.org).
3variation of 4.2%. This poor performance in yield increase was mainly attributed to low
use of improved chickpea technology packages. For instance, in Ethiopia, of the total
chickpea land (194, 981 ha) managed by smallholder farmers in 2001/02 season, less than
one percent (0.69%) is planted with improved varieties (CSA, 2002).
The annual growth rate of world chickpea production during 1994-2005 was about
1.87%. The upward trends have been characterized by year to year variability with a
coefficient of variation of 9.4%, typical of rain fed crop. The increase in area and yield,
although marginal, contributed to the increase in production. There is high correlation
between production and area (90%) and production and yield (68%). The above analysis
indicated that in the past thirteen years (1994-2006), the overall growth in area,
production and productivity was almost stagnant ranging between 9 to 12 million
hectares, 7 to 9 million tonnes and 713 to 802 tonnes per hectare. A similar result is
depicted in Figure 1. However, there is an opportunity to increase productivity per unit
area through diffusion of appropriate and affordable chickpea technology packages and
complementary inputs such as irrigation since most of the chickpea is grown in receding
soil moisture, which may not be enough during drought seasons.
Figure 1: World chickpea production trends
14000 0.84
0.82
12000
Area and Production
0.80
10000 0.78
8000 0.76
0.74
Yield
6000 0.72
4000 0.70
0.68
2000
0.66
0 0.64
1994
1995
1996
1997
1998
1999
2000
2001
2002
2003
2004
2005
2006
Yield (MT/Ha) Area ('000 Ha) Production ('000 MT)
Source: FAOSTAT
Country wise, India is the largest producer of chickpea accounting for 66% of global
chickpea production and 63% of cultivated area. The average area and production share
4of major chickpea producing countries for the period 1994-2005 is presented in Figures 2
and 3.
Figure 2: Chickpea area share of major producing countries during Figure 3: Chickpea production share of major producing
1994-2006 countries during 1994-2006
Canada
Canada Mynamar Others
Myanmar 1% Others Ethiopia
1.6%
1.6%
6.9%
1.8%
Ethiopia 1% 7%
Australia
2% 2%
Australia
Mexico
2%
Mexico 2%
1% Iran
Iran 3.5%
7% Pakistan
Pakistan 7%
10% T urkey
India 7.6% India
Turkey 63% 66%
6%
Source: FAOSTAT
3.1. Chickpea import and export trends
International trade in chickpea is negligible compared to other agricultural commodities.
Although there is a positive export and import growth rate of 9.4% and 15.4%
respectively during 1994-2005, the marketed volume is only 8.7% of the total average
production (8,177 thousand tonnes) while more than 92% of the chickpeas are consumed
in the countries where they are produced. The international trade variability is high
compared to production variability. The coefficients of variation of export and import
during 1994-2006 are 28% and 35%, respectively. Major chickpea exporters are Turkey,
Australia, Mexico, Iran and Canada (see Fig. 4). The top three exporting countries
(Australia, Turkey and Mexico) accounted for 53% of exports. The main chickpea
importing countries are India, Pakistan, Spain, Bangladesh, Algeria, United Arab
Emirates, and Italy (see Fig. 5). Unlike exports, imports were not concentrated on a few
countries but distributed widely, with the top seven countries accounting for 64.3%.
5Figure 4: Average chickpea export share by major exporting Figure 5: Average chickpea import share by major importing
countries during 1994-2005 countries during 1994-2005
Sri Lanka
1.9% United Kingdom
Others United States 2.3%
1.7%
12%
Tunisia
United States France
2.4% Jordan
Australia 1.7% 2.5%
2%
25% Others
19% Saudi Arabia
2.7%
Italy
3%
Turkey
20%
United Ara
Emirates
Canada 4%
Tanzania 8%
2% Algeria
India 5.7%
Syrian 25.7%
Iran
2% 9% Bangladesh
7.5%
Myanmar Mexico Spain
8%
3% 17% Pakistan
11%
Source: FAOSTAT
Turkey and Canada produce about 50% of kabuli type of chickpea and export it. The
major importing countries like India, Pakistan and Bangladesh import desi type, whereas
developed countries, the Middle East, and Northern Africa import mainly the kabuli type
(Agricultural and Agri-food Canda, 2004).
3.2. Chickpea producer price trends
Though prices are not differentiated by chickpea types and grain size, chickpea price
shows upward trends (see Fig. 6) with average annual growth rate of 10.8%. This is a
good opportunity for producers to adopt improved technologies even though there is a
trade off as it might affects negatively rural net buyers and urban consumers (e.g. current
world food crisis). The upward trends have been characterized by high year-to-year
variability with a coefficient of variation of 31.5%.
6Figure 6: World chickpea producer price trends (1994-2005)
Producer price (US$/tonnes) 1800
1600
1400
1200
1000
800
600
400
200
0
1994
1995
1996
1997
1998
1999
2000
2001
2002
2003
2004
2005
Source: FAOSTAT
4. Chickpea sub-sector in Ethiopia
In Ethiopia, the earliest finding of chickpea is reported in 1520 BC (Joshi et al., 2001).
Ethiopia is the largest producer of chickpea in Africa accounting for about 46% of the
continent’s production during 1994-2006 (see Fig. 7). It is also the seventh largest
producer worldwide and contributes about 2% to the total world chickpea production (see
Fig. 2).
Figure 7: Ethiopian chickpea production share in Africa (1994-2006)
Western, South
ern &
Northern Central Africa
Africa 0%
29% Ethiopia
46%
Other Eastern
Africa
25%
Source: Computed based on FAOSTAT
7Chickpea, locally known as shimbra, is one of the major pulse crops (including faba
bean, field pea, haricot bean, lentil and grass pea) in Ethiopia and in terms of production
it is the second most important legume crop after faba beans. It contributed about 16% of
the total pulse production during 1999-2008 (see Fig. 8). The total annual average (1999-
2008) chickpea production is estimated at about 173 thousand tonnes. During the same
period, chickpea was third after faba beans and field peas in terms of area coverage (Fig.
9).
Figure 8: Average chickpea contribution to total pulse production Figure 9: Chickpea area share from total average pluse cultivated
during 1995-2008 area during 1995-2005 Ot he r pl us e s
Other pulses 8. 6%
6% Gr a s s p e a
9%
Grass pea Fa b a be a n
3 4. 8%
10%
Faba bean
41%
Field pea Fi e l d pe a
14% 16. 9%
Haricot bean
13% Chickpea Ha r i c o t be a n
14 %
C h i c kp e a
16 %
16%
Source: Computed based on CSA (various reports)
4.1. Area and production trends
Chickpea production and cultivated area are steadily increasing over the years 1999-2008
(see Figs. 10 and 11).
Figure 10: Pulse crop production trends in Ethiopia (1995-2008)
8000
Production ('000 tonnes)
7000
6000
5000
4000
3000
2000
1000
0
1995
1996
1997
1998
1999
2000
2001
2002
2003
2004
2005
2006
2007
2008
Faba bean Chickpea Haricot bean
Field pea Grass pea Other pulses
8Figure 11: Cultivated area under pulse production during 1995-2008
600
500
Area ('000 ha)
400
300
200
100
0
1995
1996
1997
1998
1999
2000
2001
2002
2003
2004
2005
2006
2007
2008
Faba bean Chickpea Haricot bean
Field pea Grass pea Other pluses
Source: Computed based on CSA (various reports)
The average annual growth rate in area and production showed that cultivated area under
chickpea and production of chickpea increased by 2.1% and 7.6%, respectively during
the same period. The production growth rate is relatively higher compared to faba beans
(5.7%). Grain yield of chickpea has also showed upward trends, particularly starting from
the year 2004 and onwards (Fig. 12), with an average annual growth rate of 5.9%. Most
of the chickpea is cultivated under rain fed conditions.
Figure 12: Chickpea yield trends in Ethiopia (1995-2008)
1400
1200
Yield (kg per ha)
1000
800
600
400
200
0
1995
1996
1997
1998
1999
2000
2001
2002
2003
2004
2005
2006
2007
2008
Source: Computed based on CSA (various reports)
94.2. Available technologies
At present the use of improved chickpea production technology packages is negligible.
Over the last three decades (1974-2005), 11 improved chickpea varieties (six kabuli and
five desi) were released in Ethiopia (see Annex 1 for chickpea varieties released and their
economically important traits). However, the adoption rate of these varieties is very low.
Official estimates from the Central Statistics Authority (CSA) show that, of the total
chickpeas cultivated area (194,981 ha) only 0.69% was covered by improved chickpea
seeds in 2001/02 (CSA, 2002). The main reasons indicated for low adoption rates are
insufficient seed production and marketing systems that limit the availability of quality
improved seeds, lack of credit, late delivery, and theft during the green stage (Byerlee et
al., 2007; Shiferaw et al., 2007). As described below, the government completely
controls the seed industry, even though parastatal seed production and distribution has
usually proven to be an ineffective system of seed supply. Solving these institutional,
infrastructural and social constraints can speed up adoption of improved chickpea
varieties.
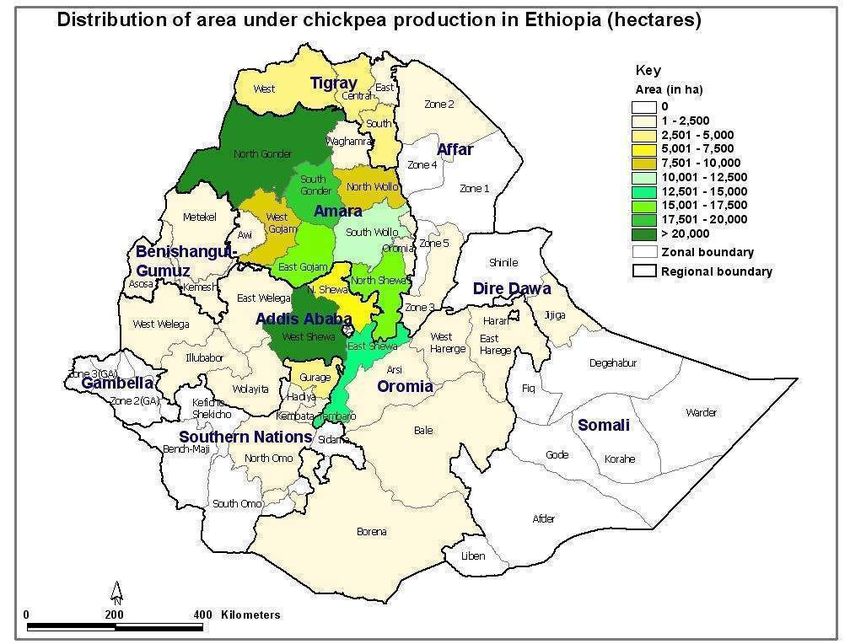
4.3. Chickpea producing areas
Although chickpea is widely grown in Ethiopia, the major producing areas are
concentrated in the two regional states - Amhara and Oromia. These two regions cover
more than 90% of the entire chickpea area and constitute about 92% of the total chickpea
production (see Figs. 13 and 14). The top 9 chickpea producing zones (North Gonder,
South Gonder, North Shewa, East Gojam, South Wello, North Wello, West Gojam,
Gonder Zuria) belong to the Amhara region and account for about 80% of the country’s
chickpea production (see Annex 2a for chickpea area and distribution by zone).
10Figure 13: Region's average chickpea cultivated area share Figure 14: Region's average chcikpea production share during 1999-2008
during 1999-2008 Others
Others
Tigray
S.N.N.P
S.N.N.P 1% 6%
0.7% Tigray 1%
1.3%
7.1%
Oromia
32%
Oromia
29.4%
Amhara Amhara
61.5% 60%
Source: Computed based on CSA (various reports)
In the Oromia region, the major producing zones are in West Shewa, East Shewa and
North Shewa, which account for about 85% of the total area and production in this
regional state. A summary map indicating the major chickpea growing areas of the
country is given in Annex 2b.
4.4. Chickpea seed systems
Generation and transfer of new technology are critical prerequisites for agricultural
development particularly for an agrarian based economy such as Ethiopia. Seed,
especially that of improved varieties, is an essential input for increasing crop
productivity. This suggests the need to place much emphasis on sustainable and efficient
seed systems.
Van Amstel et al. (1996) defined the seed system as ‘the sum of physical, organizational
and institutional components, their actions and interactions that determine seed supply
and use, in quantitative and qualitative terms’. Two distinctive but interacting seed
delivery systems are now recognized: the formal and informal sectors. The informal seed
system deals with small quantities of seed, is semi-structured, operates at the individual
farmer or community level (Cromwell et al., 1992), and may depend on indigenous
knowledge of plant and seed selection, sourcing, retaining and management, as well as
local diffusion mechanisms (Bishaw, 2004). The informal sector is more flexible and
adaptable to changing local conditions and less dependent on or less influenced by other
11external factors. The informal system comprises a multitude of individual private farmers
who select and save their own seed or exchange seed with others through traditional
means such as gift, barter, labor exchange, cash transactions or social obligations as well
as a diversity of local level seed production initiatives organized by farmers’ groups
and/or NGOs working under no legal norms and certification schemes of the organized
seed sector (Ibid).
The formal seed system is composed of institutional and organizational arrangements
consisting of all enterprises and organizations that are involved in the flow of modern
varieties from agricultural research to the farming communities. These include several
interrelated components such as variety development, release and registration, seed
multiplication and processing, seed quality control and certification, and seed marketing
and distribution. The formal system comprises of public and/or private plant breeding
institutions, parastatal, private seed companies, seed certification agencies, and
agricultural input distribution agencies/cooperatives operating within a specified national
seed policy and regulatory framework.
In Ethiopia, the two seed systems (sectors) are operational. The informal seed systems
(self-saved seed or farmer-to-farmer seed exchange) accounts for 90% of the seed used
by smallholder farmers (Belay, 2004). These are cost-effective systems and are fully
adequate in many cases, especially in hard-to-reach areas. This local production and
distribution facilitates maintenance of crop bio-diversity by preserving in situ locally
adapted varieties and by broadening the genetic base of production with multiple varieties
adapted to specific micro-climates and production system. Despite its vital contribution
this sector is not adequately linked into institutional sources for improved seed. Until the
1970s, formal breeding and seed multiplication activities were conducted on an ad-hoc
basis. In 1976, the National Seed Council was set up to formulate recommendations for
organized seed production and supply of modern varieties released from the national
programmes (Belay, 2002). The Ethiopian Seed Enterprise (ESE) was established in 1979
as a fully government-owned parastatal to undertake seed production, processing, and
distribution, while regulatory functions were managed by the Ministry of Agriculture and
Rural Development (MOARD).
12The formal seed system was and still is used as a major source for disseminating new
varieties (technology transfer channel) obtained from the Ethiopian Institute of
Agricultural Research, International Agricultural Research Centers and a number of
regional research centers and higher learning institutes in the form of basic (foundation)
seed or breeding lines. The ESE produces, processes, distributes, and markets improved
seed including chickpea based on the official demand projection of the regional bureaus
of agriculture. ESE is the only public seed enterprise responsible for production of seed
for all crops (cereals, pulses, fruits, vegetables and forage), although its seed production
is dominated by cereals, especially maize and wheat. ESE produces seed on its own farms
and through contract with public and private farms, cooperative unions, and smallholder
farmers. The framework of the formal seed system is presented in Figure 15. This system
equally applies for chickpea seed production and distribution.
The ESE follows the same production and marketing system for chickpea as in cereal
crops. The ESE gets chickpea breeder seeds from the national agricultural research
centers to produce pre-basic and basic or foundation seed on its own four farms located in
different regions. It then sells the foundation seed to individual farmers and cooperatives
for multiplication of certified seed that is sold to the agricultural office and cooperatives
too for distribution in different regions. For detail production and marketing of improved
chickpea varieties refer to Jones et al. (2006).
13Figure 15: Formal seed system Framework in Ethiopia
Regional Bureaus of Research centers &
agriculture, district MOARD institutes of higher
agricultural offices learning
Seed producers (ESE
Private seed Ethiopian Seed farms, state farms,
companies Enterprise (ESE) cooperatives, private
farms, smallholders)
Farmers’ cooperative
unions
End users (farmers)
Regulation
Supply
Demand
Source: Adopted from Alemu et al. (2007)
At present, the private sector is a limited force in Ethiopia’s seed market. In 2004,
although there were 26 firms licensed to produce seed, 33 to retail, and four to export
seed, only eight firms were active in seed production. This lack of private involvement
could be seen even in the hybrid maize seed sector, which has been largely privatized in
many other low-income countries. In Ethiopia, as of 2004, approximately 70% of maize
seed was produced by the ESE, while the remaining 30% was produced by Pioneer Hi-
Bred International and a handful of smaller firms under contract to ESE. For other crops,
the ESE is the only formal producer of seed (Alemu et al., 2008). Locally operating
international NGOs such as World Vision, CARE, and Catholic Relief Service—are also
involved in the production, marketing, and distribution of maize seed through a variety of
14community-based projects such as local seed banks and on-farm seed multiplication
projects.
The state-controlled seed system is characterized by limited production of crops and
varieties, unreliable seed quality, and late delivery (Byrelee et al., 2007). For instance
during the 2004/05 season, the supply of improved varieties channeled through the
formal system fell short of the estimated demand from the regional bureaus of agriculture
by 73% (see Table 1) (Ibid).
Table 1: Demand and supply for seed during the 2005 cropping year
Crop types Demanded quantity Supplied quantity Supply as a percent
(tonnes) (tonnes) of demand
Chickpea 4,819 2,641 55
Faba bean 7,773 476 6
Haricot bean 3,374 703 21
Wheat 51,849 10,628 20
Maize 15,522 8,246 53
Barely 7,084 1,163 16
Teff 7,839 420 5
Sesame 2,177 605 28
Total 111,760 30,404 27
Source: Based on Byrelee et al., (2007)
The very limited numbers of private seed enterprises and the low attention accorded to
the informal seed sector aggravated the seed supply crises and narrowed the options
available to farmers for obtaining good quality planting materials of modern varieties at
affordable prices, at the right place and time.
A more flexible seed system which is sustainable (both financially and institutionally),
that meets the seed needs of a diverse group of farmers, and reduces the current seed
supply crises is crucial in Ethiopia to accelerate agricultural growth and
commercialization to reduce poverty and enhance food security. This requires lifting the
entry barriers for participation of the private seed industry and encouraging the growth of
15the informal sector by providing adequate access to basic or foundation seed and
extension advice on seed production, processing, treatment and storage. Community
based seed production and marketing systems like quality declared seed (QDS) which is
tested in Tanzania for dissemination of truthfully labeled seed of high quality could be
one strategy for easing the seed shortage problem, especially for open-pollinated cereals
or self-pollinated legumes like chickpea. The private sector lack the incentive to
participate in the enhanced delivery of seeds of these crops as the size of the market is
small and farmers are able to use saved and recycled seed for 3-5 years.
Strengthening the on-going farmer based seed production program and revolving seed
scheme by improving farmers’ skills in seed multiplication can assist in increasing the
supply of seed for improved varieties both within communities and to the formal seed
system. The revolving seed scheme where target farmers often organized into groups or
cooperatives access a certain amount of seeds of improved varieties from a supplier (e.g.
NGO or ministry of agriculture) and return at least the same amount of seed in-kind is an
important mechanism in the absence of adequate supply of improved seeds to reach all
farmers. Currently, the scheme is run for disseminating improved varieties by the district
agricultural offices although there is a possibility to involve cooperatives. This scheme
was initially proposed for forage seeds distribution but recently grain seeds are also
distributed through this system. This system unlike the formal seed system does not
involve many transactions. The great advantage of this system it that it benefits resource-
poor farmers who may otherwise have poor access to or lack adequate cash to buy seed
from the formal seed system.
The revolving seed scheme is relevant for chickpea research and development projects
for the following reasons. First, the existing parastatal seed system focused more on the
production and marketing of cereals. Second, the seed rate for chickpea (100 kg per ha) is
high compared to cereals which may not be affordable by resource-poor farmers to buy
from the formal seed system. Third, it can be easily available to farmers on time unlike
the formal seed system currently characterized by late delivery and market failures. One
of the key challenges for the revolving seed scheme is the administrative costs involved
to ensure timely repayment or delivery of quality seed of the same variety. The
participation of the local government bodies and farmer groups seems to address this
16problem as peer-pressure and local monitoring of participants is critical to ensure
compliance and timely distribution of the seed to other farmers.
5. Chickpea marketing systems
5.1. Structure of chickpea markets
The chickpea marketing system in the country is very complex, linking a number of
actors as the grain moves from the producer to the consumer or end-user. The number of
links in the market chain reflects the services that are required to deliver chickpea to the
different consumers and end-users. Despite the length of the marketing chain, the
structure of the chickpea markets shows limited transformation or value addition that
takes place as the grain moves within a given marketing chain. The bulk of the chickpea
grain is transacted in unprocessed form. This suggests that, beyond transport and limited
storage, relatively few market services are provided by intermediaries, indicating a
relatively unsophisticated market structure. While the overall structure of the marketing
system is quite complex, few major marketing channels (value chains) linking producers
with different end-users have been identified (Shiferaw and Hailemariam, 2007):
i) Channel 1: Rural retailers channel
ii) Channel 2: Assembler to wereda 2 retailer channel
iii) Channel 3: Assembler to urban retailer channel
iv) Channel 4: Assembler to processor channel
v) Channel 5: Assembler to supermarkets channel
vi) Channel 6: Assembler to exporter channel
vii) Channel 7: Wereda wholesaler to exporter channel
viii) Channel 8: Farmers union to exporter channel
ix) Channel 9: Farmers union to processor channel
These nine marketing channels represent the full range of available outlets through which
the grain moves from the primary and secondary markets in rural areas to domestic
2
Wereda is an administrative division of Ethiopia (managed by a local government), equivalent to a
district. Weredas are composed of a number of kebele, or neighborhood farmer associations, which are the
smallest unit of local government in Ethiopia.
.
17consumers and grain exporters to meet end-user needs in foreign markets. The rural
retailers handle only a small volume of the total marketed surplus of mainly desi types.
They collect directly from farmers and retail it to rural consumers in village shops,
making this channel to be the shortest chain in the marketing system. The rural
consumers include those engaged in non-agricultural activities and farmer net buyers of
chickpeas (mainly those who do not grow the crop). The rural assemblers, who collect the
largest proportion of both desi and kabuli produce from farmers, are critical players in
feeding alternative marketing channels. Most of the processed and packed chickpea sold
in the supermarkets so far is prepared from desi types. This seems to be showing changes
as some supermarkets have already started selling unprocessed and processed kabuli
chickpeas to domestic consumers. The wereda wholesalers are also important as they
procure some of the produce from farmers and channel this to processors and exporters.
The farmers union is another player in the market with its own marketing chain extending
from the primary cooperatives to processors and exporters. The length of the chain and
the number of links in the value chain depend on the distance between the assemblers and
the final outlet to the consumer or the exporters.
Marketing of chickpea generally starts with the collection of grains from the farm-gate
and village markets (primary markets) moving on to the district towns (secondary
markets) and then on to terminal markets in the cities. In the marketing chain the product
passes successively through a number of market actors (representing the links in the
value chain) before it reaches the end user. Broadly, there are two types of wholesalers in
chickpea marketing in Ethiopia. These are wholesalers at district level towns and
wholesalers operating at the tertiary markets including the parastatal, the Ethiopian Grain
Trade Enterprise. Previously, wholesale chickpea trade was largely controlled by the
public enterprises, mainly by the Ethiopian Oilseeds and Pulses Exporting Corporation.
However, following the liberalization of grain market system in 1990, the role of public
enterprises significantly diminished and the role of private wholesalers increased. Market
survey results indicated that wholesale markets both at the secondary and terminal levels
are the main assembly centers for chickpea grains in their respective surrounding areas
(Shiferaw and Hailemariam, 2007). Almost every trader has a warehouse in the market
either self owned or on a rental basis. There is also an easy access to transport, which
18makes it well-located both for producers and other traders to move chickpea grain from
one market to the others. Almost all wholesalers have at least one cellular phone, highly
beneficial in conducting their buying and selling activities through a range of contacts
they have in different markets.
Usually, speculative storage to benefit from inter-seasonal price movements is rarely
practiced because of poor liquidity and high storage risks. Chickpea transaction from the
district level wholesalers to urban wholesalers, processors and exporters is usually
facilitated by arbitrage of brokers so as to coordinate inter-market chickpea flow usually
based on trust. Similar to other grain marketing practices in Ethiopia, brokers identify
chickpea buyers, sell chickpea on behalf of district level wholesalers and collect and send
back money from the sale of chickpea. The market intermediaries communicate market
information back to their clients on a regular basis.
Today Ethiopia also has several Farmers Unions and Primary Cooperatives involved in
chickpea and other grain trading activities. The farmers unions facilitate access to
improved seed, other inputs and credit to farmers. Recently, some of the Farmers Unions
have started selling grain to wholesalers and exporters.
There are also a few large scale and medium level mills that process chickpea mainly in
the tertiary market. For example, two large scale processors, East Africa and Green Star
are located in Ada-Liben district. Although most of the large scale processors need desi
type chickpeas, the newly established canning factory, Green Star Food Company, also
requires kabuli chickpea for processing. This is expected to be a good market opportunity
for farmers in the surrounding area to increase kabuli production. Another processing
plant located at the outskirts of Dukem town in Akaki district is Arba and Tryaki Grain
and Pulse Industry currently using lentils, grass pea (Lathyrus sativus) and Desi chickpea
for processing mainly for export to Turkey. The Arba and Tryaki Grain and Pulse
Industry is not currently using kabuli chickpeas, suggesting the need to pilot such a
program to stimulate local processing and value addition that may expand and diversify
markets for kabuli chickpea. Recently, lack of trust and collaboration between the
farmers and the Green Star processing company has however affected the supply of
kabuli chickpeas to the factory.
19On the other hand, almost all of the medium and small scale processors (locally known as
baltina) are found in the tertiary markets and their number is comparably higher than that
of large scale processors. They require both desi and kabuli chickpeas, although their
demand for desi is relatively higher. Almost all of them have more than one selling point
in and outside Addis Ababa. In addition, most of their products are available in most
supermarkets and directly sold to consumers through small outlets in urban areas.
There are also some grain exporting private and government owned companies. None of
the exporters specialize in chickpea trade. Some of the exporters also engage in multiple
businesses including wholesaling and retailing of grains in the domestic market. Because
of the limited availability of kabuli chickpeas in the markets very few exporters handle
kabuli types. Recent market studies show that desi type chickpea comprised about 82%
whereas kabuli type chickpea comprise the remaining 18%. The increased availability of
small-seeded kabuli chickpea is not however going to make Ethiopian exporters
competitive as domestic prices are high while prices for small-seeded kabuli in
international markets are very different from desi chickpeas. This is especially the case in
south Asian markets which are very sensitive to prices than quality at this time.
5.2. Markets and grain quality
A recent market study found that traders at all market levels classify chickpeas into three
informal grades, although the third chickpea grade was recognized by fewer respondents
especially in the primary and secondary markets (Shiferaw and Hailemariam, 2007).
About 75% of traders recognized kabuli chickpeas as having two grades (Grade 1 and 2).
There is uncertainty about the number of valid quality grades for desi types. For desi
chickpea, the majority of the sample traders in the primary markets (70%) recognized
only one quality grade for the commodity.
The study also looked at the market traits that are important in determining quality grades
for chickpeas. The major quality traits used in markets to classify chickpea grades include
grain color, grain size, presence of foreign matter and broken and shriveled seeds. For
kabuli chickpea, the highest quality grade requires about 98% white color grain, 96%
large seeded grain, and less than 4% foreign matter and 4% shriveled and broke grain.
20On the other hand, the second quality grade prescribes about 96% white colored grain,
91% large seeded grains, and less than 5% foreign matter and 5% shriveled and broken
grains. This indicates that kabuli grades drop when the proportion of white large seeded
grain decreases and the proportion of foreign matter and shriveled and broken grain
increase.
For desi chickpea, the requirements for the first quality grade are about 94% red color
grain, 96% large seeded grain, and not more than 6% foreign matter and less than 6%
shriveled grain. The second grade on the other hand requires about 80% red color grain,
90% large seeded grains, and not more than 8% foreign matter and shriveled and broken
grains. There seems to be overall awareness about what matters for quality, but much less
is known on how such grades relate to prices. This is unlike the case of major staple crops
like teff where the consumers and traders alike generally know about the different grades
and the associated prices.
This quality classification of chickpea is actually based on visual observation and it does
not include any of the hedonic characteristics of the product. In many cases, visual
inspection of the product is needed to determine the quality standards, which often
requires the presence of the trader or his/her agent at the point of transactions. The traders
usually take random samples from a given consignment using a special sampling device,
which can be inserted into sacks and check for the major market preferred traits before
they set their offer prices. While the Quality and Standards Authority of Ethiopia has
established three quality grades for chickpea, much less is known on how the informal
classification of chickpea grades based on grain size and color conforms to these
standards. Even though the quality characteristics of traded chickpea do not always
conform with the formal standards and requirements, the market still considers and gives
weight for some of the quality parameters than the others.
Compared to primary markets, secondary and tertiary markets had the highest proportion
(about 80%) of kabuli chickpea rated to be grade one while primary markets had most of
the chickpea in grade two categories (Shiferaw and Hailemariam, 2007). This may
indicate some divergence on how the same grain is rated into different quality grades in
the different markets, where primary markets generally under value quality. Quality
grades will not have any relevance if market prices do not reflect such differentiation.
21The survey results indicate that at all market levels (except for desi in primary markets)
quality seems to attract a price premium. On average, there was a margin of about 27
birr/100 kg for kabuli chickpea and 15 birr/100 kg for desi chickpea. Interestingly, the
level of significance of quality increases substantially in the tertiary market than the other
markets. The price differential between grades in this market for kabuli chickpea reaches
up to 72 birr/100 kg. The effect of quality on prices is much lower in the primary markets
than in the secondary and tertiary markets.
5.3. Chickpea exports and price trends
Though Ethiopia is the largest producer in Africa and seventh largest producer in the
world, its participation in the international market (import and export) is negligible. Over
80% of the total chickpea production is traded in the domestic market using various
market outlets (Shiferaw et al., 2007). For example, of the average production for 1997-
2007 of 171,011 tonnes, the country’s average export amounted to about 9.1% (or 15,532
tonnes) of total production. Ethiopia’s chickpea export volume is characterized by high
levels of fluctuations from year to year. Export was negligible between 1997 and 1999
but reached 19.9% and 30.4% of the total production, respectively, for the years 2001 and
2002. It again declined between 2003 and 2006 but peaked again to 23.15% in 2007 (Fig.
16). Chickpea production and marketing (local and export) are dominated by desi types.
Ethiopian desi chickpea is exported to South Asia, Middle East, North Africa, North
America, Europe, Southeast Asia, and Latin America (see Fig. 17 and Annex 3 for
quantity exported to these countries during 2004-2006). According to FAOSTAT, the
country imported (250 tonnes) only once during the period 1994-2005 as part of the drive
to introduce seeds of new varieties from abroad.
22Figure 16: Chickpea export trends in Ethiopia
60,000
50,000
40,000
Volume MT)
30,000
20,000
10,000
0
1997 1998 1999 2000 2001 2002 2003 2004 2005 2006 2007 2008
Source: Customs Authority of Ethiopia
Figure 17: Major importers of Ethiopian chickpea
45,000
40,000
35,000
Volume (MT)
30,000
25,000
20,000
15,000
10,000
5,000
0
2001 2002 2003 2004 2005 2006 2007 2008
Pakistan UAE India Bangladesh
Source: Ethiopian Customs Authority
5.4. Chickpea price trends in Ethiopia
From 1995 through 2001, the producer price trend was downward, however there is an
upward moment of prices since 2002 (see Fig. 18). In general, it has a positive annual
average growth rate of 0.12% and coefficient of variation of 18%.
23Figure 18: Chickpea producer price trends (1994-2005)
350
300
Price (US$/tonnes)
250
200
150
100
50
0
1994
1995
1996
1997
1998
1999
2000
2001
2002
2003
2004
2005
Source: Computed based on FAOSTAT
The FAOSTAT database does not differentiate prices by chickpea types. Using market
information from one of the spot chickpea growing areas (Deber Zeit) in Ethiopia, kabuli
and desi chickpeas producer and retail price trends are explored. Figure 19 and 20 shows
that both producer and retail price are higher for kabuli chickpea than for desi types. The
retail price movement is much steeper than the producer price. Retail price is more
variable than producer price. The coefficients of variation are 21% and 37% for kabuli
and desi retail price, respectively. On the other hand, the coefficients of variation for
kabuli and desi producer price are 12% and 20%, respectively. The annual average
growth rate (AAGR) of kabuli retail price (4.5%) is more than doubled compared to desi
retail price (2.3%). On the contrary, the AAGR of desi producer price (3.68%) is much
higher than kabuli producer price (0.37%).
24Figure 19: Monthly average Kabuli and Desi producer price trends in Deber Zeit (Feb 2006-Jan
2008)
600
500
Price (ETB/100kg)
400
300
200
100
0 Aug
Aug
June
June
Sept
Oct
Sept
Oct
Nov
Nov
Feb
Feb
Dec
Dec
April
April
May
March
July
Jan
May
March
July
Jan
2006 2007 2008
Kabuli Desi
Figure 20: Monthly average Kabuli and Desi retail price trends in Deber Zeit (April 2004-Jan 2008)
600
500
Price (ETB/100kg)
400
300
200
100
0
Aug
Aug
Aug
Aug
June
June
June
June
Sept
Oct
Oct
Sept
Sept
Sept
Oct
Oct
Nov
Nov
Nov
Nov
Feb
Feb
Feb
Dec
Dec
Dec
Dec
April
April
April
April
May
July
May
May
May
July
July
July
Jan
Jan
Jan
Jan
Mar
Mar
Mar
2004 2005 2006 2007 2008
Kabuli Desi
256. Outlooks for Ethiopian chickpea
A number of factors including improved technology availability, relative profitability
compared to other competing crops, domestic and international policy environment and
adequate rainfall will influence the production and future outlooks for chickpea. The
ability to respond to international markets will depend on the elasticity of supply and
domestic demand changes. Analysis of the future situation of chickpea production in
Ethiopia will therefore need to consider estimated historical area, yield and price trends
and the policy interest to expand agricultural commercialization – especially exportable
commodities in the country. The effect of higher fertilizer prices is especially expected to
enhance the competitiveness of Ethiopian chickpea, which is traditionally grown in
rotation with cereals. Ethiopia also has some 10 million hectares of underutilized
vertisols (suffering from seasonal water-logging), which are largely suitable for chickpea
production.
Two alternative methods are used to project future chickpea outlook for Ethiopia; a
regression method based on historical area and yield growth patterns and simulation
modeling using the IMPACT model. In this section we present the projected future
outlooks for chickpea using these two methods.
In the first approach a classic regression model is used for projection under two
scenarios. In the fist scenario it is assumed farmers will continue producing chickpea
using their existing method of production (business as usual). The second scenario
assumes technological change as a result of adoption of large seeded and high-yielding
kabuli chickpea varieties.
Assuming there is no technological and price change (business as usual scenario),
chickpea production and area is forecasted to increase by 8% and 21% by year 2020
(Table 2). The soaring fertilizer price may push farmers particularly resource poor
farmers to switch from cereal production to those crops that do not demand fertilizer such
as chickpea. The DAP price increased by 99% from 2007 to 2008, almost doubled within
one year time (see Fig. 21).
26Table 2: Chickpea area and production forecast under different scenarios using regression
methods
Scenario 1 Scenario 2
Year Area (‘000 Production Area under Production Change in
ha) (‘000 tonnes) new varieties (‘000 production (%)
(%) tonnes) compared to 2008
2008 208.657 277.7existing varieties that improve yields over time using the current rates of productivity
growth. In this sense, the IMPACT model scenario is similar to the second scenario
presented using the regression methods above. In terms of the projected area and
production trends over the 20–year horizon for which the projections are made, the IMPACT
model results suggests that chickpea area and production in Ethiopia will show
significant growth in the coming years. The IMPACT model results for production
projections are similar to the regression methods, but the area and production responses
seem to be more elastic. This is perhaps attributed to the dissimilarity in the methods
employed and the base year considered for projection. Compared to 2008 levels, the
IMPACT model projects indicate that chickpea area and production will increase by 48%
and 146% respectively (Fig. 22). The implication is that if the available new varieties of
chickpea reach farmers, chickpea is likely to see significant growth in production which
is likely to generate significant marketable surplus that can be exported. Analysis of the
long-term trends for chickpea also shows an increasing trend for harvested yield. Chickpea
yield in 2020 is projected to be 1.97 tonnes per ha up from 1.19 tonnes per ha in 2008, an
increase of 66%.
Figure 22: Chickpea area and production projection for Ethiopia
800
Production & Area ( '000)
700
600
500
400
300
200
100
0
2000
2001
2002
2003
2004
2005
2006
2007
2008
2009
2010
2011
2012
2013
2014
2015
2016
2017
2018
2019
2020
Production (1000 tonnes) Area (1000ha)
28You can also read