The importance of changing urban scenery in the assessment of citizens' soundscape perception. On the need for different time-related points of ...
←
→
Page content transcription
If your browser does not render page correctly, please read the page content below
Noise Mapp. 2021; 8:138–161

Research Article

Jerónimo Vida Manzano*, José Antonio Almagro Pastor, and Rafael García Quesada

The importance of changing urban scenery in the
assessment of citizens’ soundscape perception. On
the need for different time-related points of view
https://doi.org/10.1515/noise-2021-0011
Received Aug 21, 2020; accepted Mar 01, 2021
                                                                         1 Introduction
Abstract: The city of Granada is experimenting a big urban               Environmental urban noise control and management by the
transformation, attending national and international com-                local administration are usually and traditionally accom-
mitments on clean air, energy efficiency and savings linked              plished through strategic noise maps (SNM) and local noise
to greenhouse gases reduction strategies and sustainable                 action plans (NAP) development. Under this legal and tech-
development action plans. This situation constitutes a good              nical approach, citizens’ participation, though regulated,
scenario for new noise control approaches that take into                 promoted and driven by municipal official entities such
account the sound variable and citizens empowering in                    as Local Agenda 21, has never been anything more than
urban design, such as the soundscape assessment of urban                 testimonial and quite a minority. In this context, noise con-
territory. In this way, soundscape tools have been used in               trol in urban environments rarely includes the way noise is
Granada as a complementary method for environmental                      perceived and understood by the individuals or by society.
noise characterisation where traditional noise control tech-                  The city of Granada has a long tradition and experience
niques are difficult to be carried out or give limited results.          managing local noise issues. The local administration has
After 2016 strategic noise map and in the preparation of the             always counted on the University of Granada for help and
new noise action plan, the city came across a great acoustic             expert assessment on environmental noise management
challenge in a new area located outskirts characterised by               and control through harmonised methods as demanded
growing urbanisation, still under development, the greatest              by law. The collaboration between Granada City Council
legal protection because of sensitive teaching and hospital              and the University of Granada has usually led to positive
buildings and the greatest noise exposure from nearby ring-              bidirectional synergies enriching both organisms, being
way supporting heavy traffic flow. As quiet urban areas are              Granada 2008 SNM [1], subsequent 2013 NAP [2] and latest
not characterised by the absence of noise but for the pres-              2016 SNM [3] great examples of this collaboration and signs
ence of the right noise, this research intended to provide               of concern and compromise of the city of Granada with
the local administration with results and proposals to trans-            environmental noise management and control.
form this conflict area in a pleasant or quiet urban place.                   In this context, Granada is currently undergoing a ma-
Main results came from important and significative differ-               jor urban transformation within Smart City and sustainable
ences in morning and evening characterisation, as great                  development principles to face urban challenges arising
differences appear in soundscape assessment over the day                 from international local commitments adopted in 2009 as
and along the soundwalk path, indicating the importance                  a signatory city to the Covenant of Mayors and renewed in
of time and local issues to adequately characterised citi-               2016 as a signatory city to the Covenant of Mayors for Cli-
zens perception to be considered by administration in the                mate and Energy in Europe [4]. By assuming these commit-
development of strategies and effective noise control ac-                ments, cities and towns take climate and energy action to
tions.                                                                   secure a better future for their citizens focusing on reducing
                                                                         air contaminants (including noise) and greenhouse gases
Keywords: noise, environment, perception, soundscape
                                                                         (GHG) emissions and increasing energy savings and effi-

                                                                         José Antonio Almagro Pastor: Scientific Instrumentation Center,
*Corresponding Author: Jerónimo Vida Manzano: Applied                    CITIC, University of Granada, 18071 – Granada, Spain
Physics Department, Faculty of Sciences, University of Granada,          Rafael García Quesada: Building Construction Department, School
18071 – Granada, Spain; Email: jvida@ugr.es                              of Architecture, University of Granada, 18071 – Granada, Spain

  Open Access. © 2021 J. Vida Manzano et al., published by De Gruyter.             This work is licensed under the Creative Commons Attribution
4.0 License
The importance of changing urban scenery in the assessment of citizens’ soundscape perception | 139

ciency by boosting renewable energy sources. New trends defining soundscape as the “acoustic environment as per-
in mobility and transport systems, revised public use of ceived or experienced and/or understood by a person or
urban spaces or citizens empowering to say some, are dif- people, in context” [12] ISO also provides standard require-
ferent elements of sustainable development that have to ments and supporting information on data collection and
be revised, reinforced and integrated for a better quality of reporting for soundscape studies [16] and guidance on how
life in Granada. If we focus in noise and air issues, sharing to analyse data collected [17].
emissions sources and demanding integral and integrated             The assessment of the urban acoustic environment tak-
solutions, the city should start new approaches to manage ing into consideration people experiences, perceptions or
and control air contamination problems, linked to parti- interpretations in context, is something that had never been
cles and nitrogen dioxide mainly emitted by home heating done before within the local noise management system in
boilers and diesel vehicles, and urban environmental noise the city of Granada. The prevention, management and con-
from road traffic.                                             trol of noise issues employing standardized methods have
      Legal regulations in Spain and Europe include acoustic a long tradition in Granada, where high concern has always
specifications and requirements for urban areas to be classi- been expressed by citizens and a high degree of commit-
fied as “quiet areas”, a type of urban territory highly valued ment has always been proved by local administration too.
by citizens as indicated by the importance given to the “ab- Local Agenda 21 in Granada has traditionally encouraged
sence of noise” question in social surveys carried out in citizens’ participation in general sustainable development
Granada for the assessment of community response to envi- matters [18]. After more than 10 years of strategic noise
ronmental noise [5]. But even though this may seem a mere maps (SNM) and noise action planning (NAP) according
questions of noise levels standards, transforming urban ar- to END [19], new urban areas experiencing great transfor-
eas into quiet areas is not just a matter of reducing decibels mations in a new scenario chaired by stricter air quality
as previous studies in Granada [2, 3, 5] and acoustic envi- standards, low gases emissions or energy efficiency criteria,
ronment perception research have shown [6–9]. According suggested that it was time for the soundscape approach in
to these, the local administration will have it difficult to the city [20].
satisfy sustainability commitments just by putting down ur-         In this work we focus on the differences found in the
ban noise levels, not even using technology in a sensorised objective perception of urban sound quality with time and
town under the Smart City concept, unless the most im- the associated changing environmental situation in the
portant sensor, the human sensor, is given a relevant role city of Granada in soundscape characterisation of complex
in the development of urban design, strategies and action noise affected urban territory under development.
plans.
      The acoustic environment can be transformed into a
valuable urban resource if adequate sound levels rather
than low levels are promoted, a task that focuses on sounds
                                                               2 Methods
people want or prefer [10]. As stated by EEA [11], the term
“quiet” may accidentally lead to the assumption that a quiet 2.1 Case study area
area is an area with very low noise or even no noise. But
when talking about the need for quiet areas and quietness The study area is a new urban area located outskirts char-
we are referring to urban areas understood as pleasant, acterised by recent growing urbanisation. This area is de-
but not necessarily silent, by citizens in context [12]. The limited to the south by surrounded ringway, as shown in
soundscape approach in urban noise research has already Figure 1, and by the municipal district of Zaidín to the north
given some answers to main questions concerning the way as shown in Figure 2.
citizens opinion should be taken into consideration [8, 13].        This area, called in Spanish “Parque Tecnológico de la
At the same time, other questions arise as complex rela- Salud” (PTS), concentrates high-level research, teaching
tionships between soundscape and public space usage are and sanitary services infrastructures and also increasing
analysed [14].                                                 population in nearby new residential buildings. The biggest
      Even though soundscape is not a new concept connect- hospital in the city, University Hospital San Cecilio; two Uni-
ing environmental noise and urban planning research, with versity of Granada faculties, School of Medicine and School
valid references as early as 1967 [15], the importance of hu- of Health Sciences; even new business, entrepreneurship
man perception with an emphasis in the context in which and innovation centres, endows this urbanstarea a high level
the evaluation takes place is taken into consideration by of representativeness with respect what 21 -century urban-
the International Organization for Standardization when isation under sustainable development principles should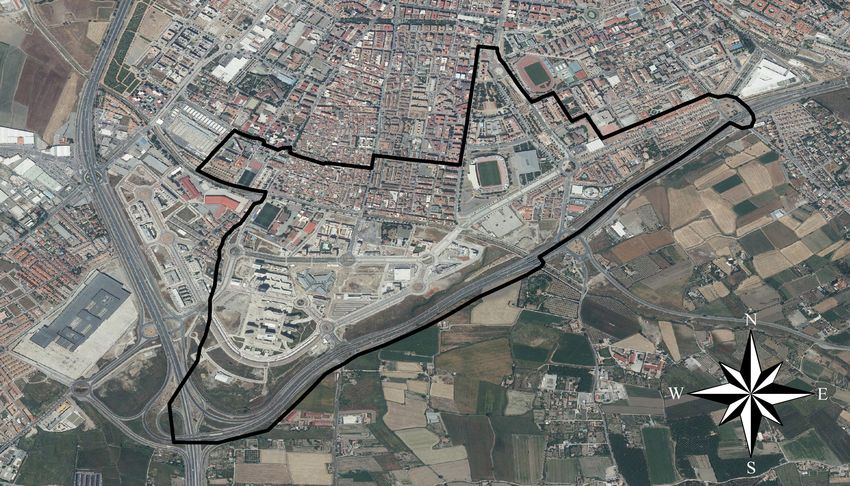
140 | J. Vida Manzano et al.
be in Granada. All these infrastructures contribute to the The PTS area was typified as “Sanitary, Educational
attractiveness of this area for new residents who also ap- and Cultural” (SEC) in the acoustic zoning of the city car-
preciate the excellent transport communications provided ried out in 2009, where acoustic quality objectives (AQO)
by a brand new metropolitan train that crosses the area. are set to Ld=60 dBA, Le=60 dBA and Ln=50 dBA, the low-
The new part of this PTS area, limit to the north-west est in legislation as recommended because of the “sanitary”
with the urban consolidated part of the city with new resi- and “teaching” activities that take place in the area. The
dential buildings, sports facilities, parks and leisure areas northern part of the study area also includes territory typi-
as well. fied as “residential” (R) where 5 dBA higher AQO than in
Figure 1: Granada south-east view showing the study area in the foreground, surrounded by the ringway around the city and old part of
Granada in the background
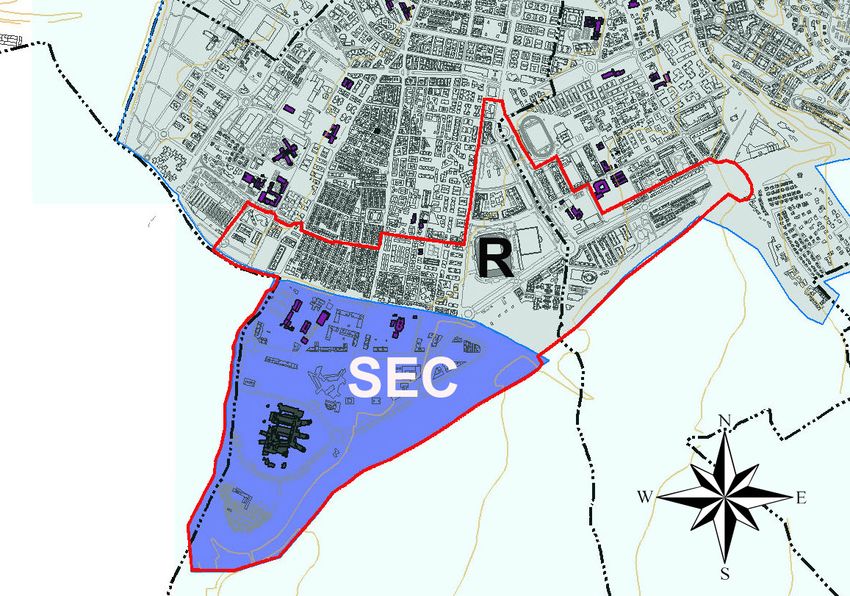
Figure 2: Study area contour (left) and situation within acoustic areas context (right)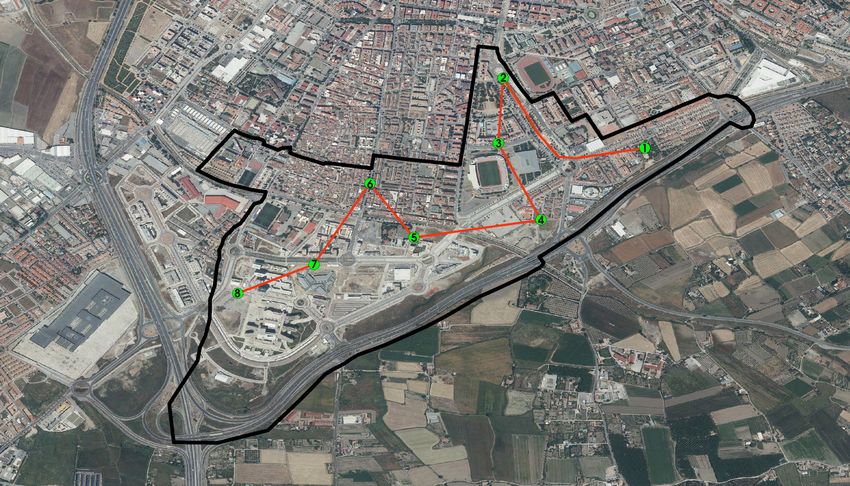
The importance of changing urban scenery in the assessment of citizens’ soundscape perception |        141

SEC territory apply (Ld=65 dBA, Le=65 dBA and Ln=55 dBA).            shown in SICA, Noise Pollution Information System, Min-
An increasing number of citizens are moving their homes              istry of Ecological Transition, Government of Spain [3].
to this area, mainly to new buildings built in the limits                 In these maps, traffic noise from nearby ringway abso-
between the SEC and R part of the study area (see Figure 2).         lutely dominates and conditionate the situation, summa-
     As described in [20] heavy traffic flow driving the             rized in Table 1 taking into consideration the territory above
nearby ringway around the city and noise from University             and below legal acoustic quality objectives (AQO) for each
Hospital activities heavily affect the overall complicated           indicator. Additionally, the population exposed to environ-
acoustic quality of this area, where the lowest legal acoustic       mental noise is presented in Figure 7 with an indication of
quality objectives face the greatest citizens noise exposi-          citizens over AQO as in Table 1.
tion in the city. Since noise barriers and other technical                We observe exceedances over 20 dBA near the ringway
solutions are considered insufficient by the local adminis-          and over 15 dBA at almost the whole extension of the corner
tration, the soundscape approach was adopted. A means of             and the east side of the highway (see Figure 3). This situa-
gaining additional knowledge to complement traditional               tion determines that the PTS study area is a ZPAE, in Span-
acoustic engineering practices with community advice and             ish “Zona de Protección Acústica Especial” and, according
participation in urban planning and development.                     to law, it demands the elaboration of a specific local noise
                                                                     action plan. To do so, as described in [20], environmental
                                                                     noise levels and traffic flows were registered to revise SNM
2.2 Environmental noise context                                      results and see how the situation had progressed since 2016,
                                                                     confirming the given global noise diagnosis of PTS study
Information from the city of Granada’s 2016 Strategic Noise          area.
Map (SNM) give us an overall noise description of the study
area as inferred from Ld, Le and Ln noise indicators maps

Figure 3: Study area environmental noise extracted from Granada 2016 Strategic Noise Map. From left to right, up to down: Ld (dBA), Le
(dBA), Ln (dBA) and Lden (dBA)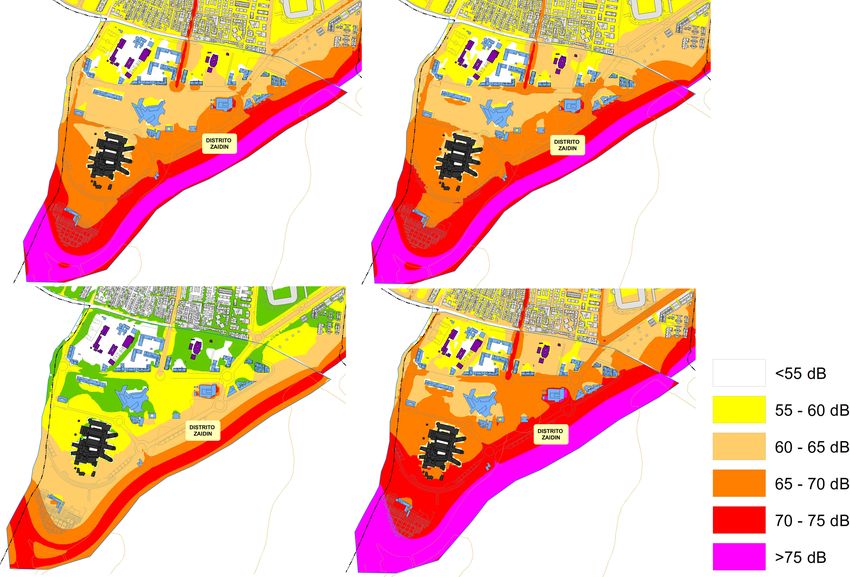
142 | J. Vida Manzano et al.

         Ld > 60 dBA 51% (252 persons)                 Le > 60 dBA 44% (218 persons)                Ln > 50 dBA 72% (356 persons)

Figure 4: Population exposed to environmental noise ranges as derived from 2016 Granada SNM results, with an indication of people over
AQO as in Table 1

Figure 5: Detailed view of PTS study area (north up, as in Figure 2) in which ZPAE area is marked in pink (left), and MEUA is marked in red
(right)

Table 1: PTS study area environmental noise diagnosis from 2016
                                                            time, 218 persons during evening period and 356 persons
Granada SNM                                                 during night time live exposed over AQO limits (51%, 44%
                                                            and 72% of study area population respectively).
  PTS Study Area. Urban area size: 844.336 m2
                                                                  So, when analysing noise conflict areas for the identifi-
 Indicator     AQO       Under AQO         Exceeding AQO cation of urban territory of interest for noise control, ZPAE
              (dBA)                                         areas, in contrast to ZT, in Spanish “Zona Tranquila” that de-
    Ld          60         18,8%               81,2%        limitates urban areas not exceeding legal limits, the study
    Le          60         16,1%               83,9%        area is marked as a hotspot in left Figure 5. But when the
    Ln          50         12,0%               88,0%        priority criterion is applied to identify which part of the
                                                            city deserves to be attended first (in Noise Action Planning
                                                            – NAP) [21], the study area is not the most urgent (Most
    If we concentrate on people exposed to noise, the mag-
                                                            Exposed Urban Area – MEUA), as shown in right Figure 5.
nitude of the problem has a different interpretation taking
                                                                  A comparison between daytime and global noise con-
into consideration that still few people are living within
                                                            flict zones yields relevant data. Specifically, there is a part
the study area. In absolute terms, 252 persons during day
The importance of changing urban scenery in the assessment of citizens’ soundscape perception |   143

of the PTS that during the day is a conflict zone (ZPAE) while        control. At the same time, it delimitates a perfect territory
in the global characterization (MEUA) it is qualified as low          for soundscape research before further urbanisation and
conflict within conflict, that is, not a priority area for noise      development take place in the area.

Figure 6: Soundwalk path across PTS study area and photographic description of the eight evaluation stops (P1 to P8)
144 | J. Vida Manzano et al.

Figure 7: Main noise descriptors and legal acoustic quality objectives during the morning (SW_M) and evening (SW_E) soundwalks at path
stops (P1 to P8)

2.3 Procedure and data collection                             our invitation. Four men, age 55, 24, 23 and 20 respec-
                                                              tively, participated in both soundwalks while the rest of
The assessment was carried out by means of data from a participants were different persons during the morning and
soundwalk across the entire study area together with si- evening experiences.
multaneous sound level recordings. From the northeastern           As explained in [20], the group was guided along eight
“Residential” (R) area, characterized by a higher popula- listening stops during the morning walk (identified as
tion density and less business activity, to the southeastern SW_M) and evening walk (identified as SW_E) following
“Sanitary, Educational and Cultural” (SEC) area, character- instructing recommendations by A. Radicchi [7] before, dur-
ized by just the opposite: less population outside working ing and after the soundwalks. Stop number 4 could not be
hours and more business, health and university activity, completed during morning soundwalk (SW_M; 13/04/2018)
especially in the mornings. Taking into consideration per- because of heavy rain. No incidences took place during the
sonal recommendations and works from A. Radicchi [7] evening soundwalk (SW_E; 23/04/2018)
and F. Aletta et al. [22], the final soundwalk path across         Coincident environmental noise levels were registered
the study area was defined including eight stop locations with a Rion NL-52 type 1 sound level meter during ten min-
and delimited, as shown in Figure 6 (soundwalk path and utes at every stop, including A-weighted and C-weighted
photographic description).                                    1 second equivalent noise level and spectral information.
     In order to analyse differences in soundscape assess- Highest environmental noise descriptors were registered at
ment (ZPAE vs MEUA) the soundwalk was repeated twice stop location number 6 (P6) both during SW_M and SW_E,
along the same path, morning and afternoon. It was con- while beginning and final soundwalk stops, P1 and P8, pre-
ducted on different days of the same month and under sim- sented overall lower values and variations. Figure 7 shows
ilar weather conditions. This is the main characteristic that main noise descriptors for SW_M and SW_E together with
differentiates our work to investigate time dependent fac- reference AQO for “Residential” (R) area, affecting stop
tors influencing soundscape evaluations at one site from numbers P1, P2, P3, P4 and P6, and “Sanitary, Educational
other researchers that evaluate soundscape across multiple and Cultural” (SEC) area, affecting stops P5, P7 and P8. Es-
urban spaces as in [14].                                      pecially significative is the morning-evening environmental
     The soundwalks took place on a Friday morning (13- noise differences that can be appreciated in the first part of
04-2018) and later on a Monday evening (23-04-2018) with soundwalk path (P1 to P4), not so important in the second
the same climatology. Fourteen people, 20 to 55 years old part of the itinerary (P5 to P8).
(3 women, 11 men; average age 29,3; SD=10,5) participated
in the morning soundwalk. Nine people, 20 to 55 years old
(3 women, 6 men; average age 34,9; SD=14,1) participated 2.4 Soundwalk questionnaire
in the evening. Participants were equally distributed in
both soundwalks among these groups: university (students At the time the soundwalk questionnaire was designed,
taking a degree in Physics and environmental noise re- only part 1 of ISO 12913 was published [12] and there was
searchers), local administration (environmental techniques still a limited consensus on harmonised questionnaires for
and Local Agenda 21 techniques) and citizens that attended soundscape research. In Granada it was designed following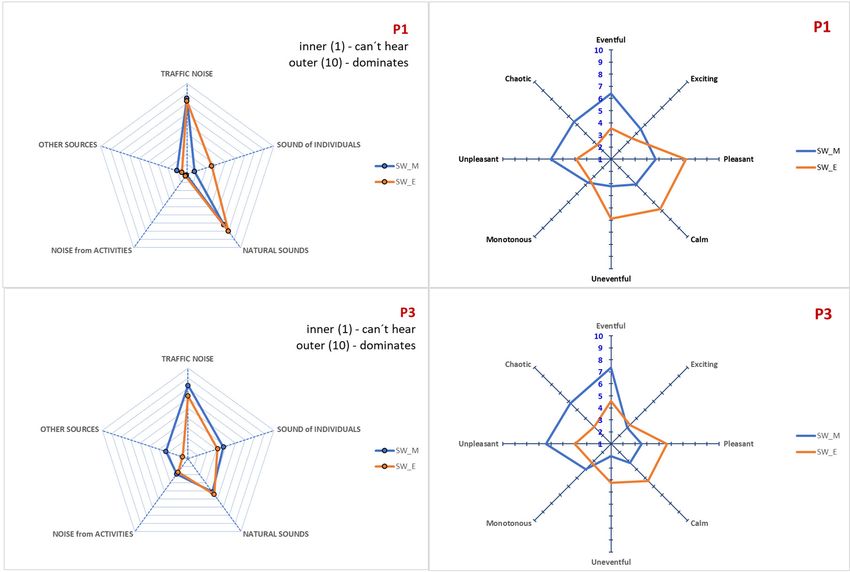
Table 2: Soundwalk questionnaire detailed description

No.    QUESTION                                                                                    SCALE type.                      Desired information
                                                                                                Numeric (1-10) or
                                                                                                   Verbal scale
Q1     How often do you visit this place?                                                     7 pre-defined options        Occasional/ frequent visit to this place
Q2     Describe OVERALL PRESENT SURROUNDING sound environment (describa el am-                “very bad” (1) to “very      Overall soundscape appraisal/ sound
       biente sonoro)                                                                               good” (10)                            quality
Q3     Is present surrounding sound environment APPROPRIATE to the present place?                “not at all” (1) to       Environmental sound appropriateness
       (¿es apropiado?)                                                                          “perfectly” (10)
Q4     Can you presently HEAR these sounds? (¿puede oír?)                                       “can’t hear” (1) to           Environmental sound dominance
       [4.1 traflc, 4.2 persons, 4.3 natural sounds, 4.4 activities and 4.5 other noise       “dominant noise” (10)
       sources]
Q5     Present surrounding SOUND ENVIRONMENT IS? (el ambiente sonoro es)                       “strong disagree” (1)       Assessment of emotional components
       [5.1 pleasant, 5.2 chaotic, 5.3 exciting, 5.4 uneventful, 5.5 calm, 5.6 unpleasant,    to “strong agree” (10)       according to Ö. Axelsson et al. model
       5.7 eventful, 5.8 monotonous]
Q6     Please value HOW SUITABLE is this place to practice each of the 15 so-                  “not adequate” (1) to
       cial/recreational activities listed below (valore si es adecuado)                      “really adequate” (10)
       [outdoor games, appreciate parks and gardens, fishing/navigation, experiencing
       peace/quiet, experiencing everyday life, sports outdoor individual practice, share
       time with family/friends, escape city stress, enjoy with inland water like fountains
       and lakes, talk/chat and social interactions, swimming bathing, walking/jogging,
       picnic/barbecue, shopping, enjoy cultural heritage like monuments]
Q7     Describe overall present surrounding sound environment QUIETNESS (valore la             “it is not”, “slightly”,
       tranquilidad)                                                                          “moderately”, “quiet”,
                                                                                                     “very quiet”
Q8     Describe overall present surrounding sound environment PLEASANTNESS (valore             “it is not”, “slightly”,   As Q5.1 (numeric scale) but on a verbal
       si es agradable)                                                                             “moderately”,                         basis
                                                                                                 “pleasant”, “very                  Connected with Q2
                                                                                                      pleasant”
Q9     Describe overall present surrounding sound environment LOUDNESS (valore el              “it is not”, “slightly”,             Perceived loudness
       ruido)                                                                                 “moderately”, “loud”,
       (volume, magnitude, not quality)                                                              “very loud”
Q10    PERCEIVED LOUDNESS from individual noise sources in this place. (sonoridad                “very low”, “low”,               Perceived dominance
       percibida de distintas fuentes)                                                           “normal”, “high”,        Connected to Q4 (numeric scale) but on a
                                                                                                                                                                      The importance of changing urban scenery in the assessment of citizens’ soundscape perception |

       [27 sources divided in Human (3), Mechanic (9), Traflc (4), Geophysics (6) and                “very high”                        verbal scale
       Biologic (5) noise sources]
                                                                                                                                                                      145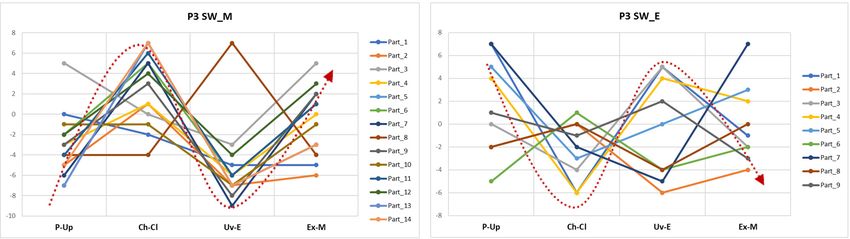
146 | J. Vida Manzano et al.

previous experiences in public surveying for noise annoy-
ance determination [21] and works from F. Aletta et al. [22]
                                                             3 Results and discussion
and A. Radicchi et al. [23].
                                                             Following the main objective of this work, that is the char-
     This review work led us to 10 main questions with an
                                                             acterisation of local environmental and time factors influ-
introduction project page, a demographic info page, and
                                                             encing soundscape assessment, we will refer to the first
a free creativity drawing page. A detailed description of
                                                             soundwalk during morning period as SW_M and second
questions and type of responses are presented in Table 2.
                                                             soundwalk during evening period as SW_E. The eight stops
Five questions use a numeric (1-10) scale (Q2, Q3, Q4, Q5
                                                             locations will be referred as P1 to P8, and questions will be
and Q6) and four use a 5 items verbal answers scale (Q7, Q8,
                                                             numbered as Q1 to Q10. Pearson’s correlation coefficient
Q9 and Q10)
                                                             and corresponding p-values (r,p) will be given in every stage
     Q5 is the main question regarding perceived affective
                                                             of the analysis involving correlations between acoustic and
quality, translated into English from original Spanish fol-
                                                             soundscape metrics and responses to the questionnaire.
lowing O. Axelsson et al. [24]. Even though ISO 12913-2
standard [16] had not yet been published at the time of
the soundwalk, altogether the questionnaire reasonably
                                                             3.1 Overall appraisal and appropriateness
matches this standard (or data can be adapted by simple
transformation) in the instruction of the participants, the
                                                             According to Annex A.2 in ISO 12913-3 for the determination
methodology of the procedure and in method A for data
                                                             of central tendencies of responses in the analysis of data
collection (Annex C of [16]).
                                                             related to soundscape assessment by Method A [17], for all
     As Table 2 shows original Spanish questionnaire freely
                                                             category scales the median values should be reported as
translated into English, underlined English terms are also
                                                             the measure of central tendency and the range (highest vs.
included in bracket original Spanish for better interpreta-
                                                             lowest values span) as the measure of dispersion. This is
tion and understanding.
                                                             shown in Table 3 for questions Q2 (overall appraisal) and
                                                             Q3 (appropriateness) during morning and evening walks.
                                                             We have also added information about mean values.
                                                                  Figures 8 and 9 show mean responses to questions Q2
                                                             and Q3 at each stop site together with noise equivalent level
                                                             descriptor (T=10 minutes, dBA) and percentile levels L10

Table 3: Analysis of answers to questions Q2 (overall appraisal) and Q3 (appropriateness) at stop sites during the morning (SW_M) and
evening (SW_E) walks

                                                (Q2) Overall APPRAISAL                          (Q3) APPROPRIATENESS
  Soundwalk               Stop
                                           Mean        Median        Range                  Mean        Median      Range
     SW_M                                  4,50           4,0           6                   4,29          3,5         7
                           P1
     SW_E                                  6,11           7,0           6                   5,44          6,0         7
     SW_M                                  5,00           5,0           5                   6,08          7,0         8
                           P2
     SW_E                                  6,44           7,0           6                   6,67          7,0         7
     SW_M                                  4,93           5,5           5                   6,29          5,0         5
                           P3
     SW_E                                  6,44           7,0           6                   7,00          7,0         6
     SW_M                                 no data      no data       no data               no data      no data    no data
                           P4
     SW_E                                  6,67           7,0           3                   7,00          7,0         7
     SW_M                                  5,50           5,5           6                   6,14          6,0         8
                           P5
     SW_E                                  5,00           5,0           6                   5,56          5,0         6
     SW_M                                  4,25           3,5           7                   4,75          5,0         7
                           P6
     SW_E                                  3,56           3,0           6                   4,78          5,0         6
     SW_M                                  4,07           4,0           6                   5,21          6,0         8
                           P7
     SW_E                                  4,11           4,0           7                   5,11          6,0         7
     SW_M                                  4,43           4,0           6                   3,86          3,5         6
                           P8
     SW_E                                  4,89           5,0           5                   4,89          5,0         7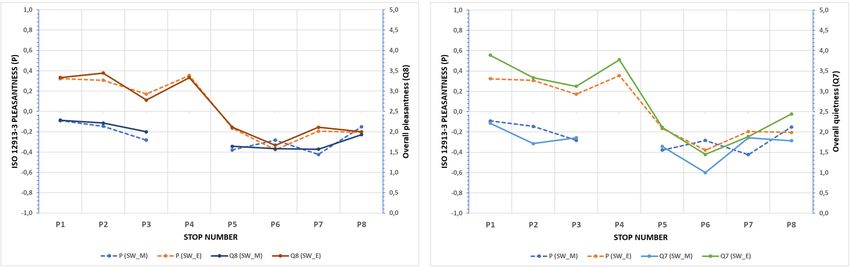
The importance of changing urban scenery in the assessment of citizens’ soundscape perception |        147

Figure 8: Mean Q2 and Q3 responses and coincident environmental noise characterisation (using LeqT, L10 and L90) at different stop sites
during SW_M

Figure 9: Mean Q2 and Q3 responses and coincident environmental noise characterisation (using Leq, L10 and L90) at different stop sites
during SW_E
148 | J. Vida Manzano et al.

Figure 10: Overall appraisal (Q2) as a function of appropriateness (Q3) during the morning (SW_M) and evening (SW_E) soundwalks

Table 4: Overall sound quality (Q2) and appropriateness (Q3) correlation vs noise descriptors

  SW_M                                                                 SW_E
r (p)         Q2                           Q3                          r (p)          Q2                       Q3
Leq           −0,1548 (0,740)              0,1705 (0,715)              Leq            −0,7865 (0,021)          −0,5590 (0,150)
Lmax          −0,0892 (0,849)              0,2583 (0,576)              Lmax           −0,7136 (0,047)          −0,3658 (0,373)
Lmin          −0,1893 (0,684)              −0,2636 (0,568)             Lmin           −0,3885 (0,342)          −0,5117 (0,195)
L10           −0,0772 (0,869)              0,2934 (0,523)              L10            −0,7537 (0,031)          −0,4974 (0,210)
L50           −0,3039 (0,508)              −0,0820 (0,861)             L50            −0,6526 (0,079)          −0,6129 (0,106)
L90           −0,2243 (0,629)              −0,2553 (0,581)             L90            −0,3831 (0,349)          −0,5086 (0,198)

and L90 (in dBA). From these figures and data in Table 3 it            is necessary to appreciate an overall good sound quality
can be observed that mean response to questions Q2 and                 of the environment (Q2) or vice versa. Our results show a
Q3 increase with lower environmental levels, but not to the            significant positive correlation between mean Q2 and mean
same amount nor in the same way. Overall appraisal (Q2)                Q3 per site as stated by F. Aletta et al. [22], but this correla-
and appropriateness (Q3) improve during the evening at                 tion is greater during SW_E (r=0,8709, p=0,005) and not as
most stops as environmental noise levels drop down, but                important during SW_M (r=0,6933, p=0,084) as shown in
the evaluation is not better at certain stops even though              Figure 10.
evening noise levels are lower than in the morning. Alto-                   Results seem to confirm that a high level of appropriate-
gether, these results are pointing out the importance of site          ness (Q3) are indeed necessary to appreciate an overall good
location and local characteristics in soundscape evalua-               sound quality of the environment (Q2). These two percep-
tions.                                                                 tual attributes of the soundscape are especially connected
     On investigating certain stops, characterized by similar          during the evening period when environmental noise condi-
equivalent noise levels during morning or evening sound-               tion is characterised by fewer fluctuations and lower levels
walks but quite different evaluations for Q2 and Q3, we                than in the morning.
realized that overall appraisal and appropriateness get a                   Further analysis on how environmental noise descrip-
similar assessment at stop sites characterized by low envi-            tors correlate with Q2 and Q3, proved that overall appraisal
ronmental noise levels and, at the same time, low (L10-L90)            (Q2) negatively correlates with certain noise descriptors but
difference (as in P1 during SW_M and P8 during SW_E). All              only during the evening (SW_E). As shown in Table 4, there
this indicates low fluctuations and a stable environmental             is a good correlation between Q2 and descriptors Leq, Lmax,
noise context at those stop sites when the assessment was              L10 and L50, corresponding the highest correlation coef-
made.                                                                  ficient to Leq and L10 indices. Appropriateness (Q3) also
     Figures 8 and 9 also show that overall appraisal (Q2)             improves correlation with environmental noise descriptors
and appropriateness (Q3) express linked perceptual evalu-              during the evening, but not reaching significance as shown
ations as they follow similar evolution over the path during           by p-values much greater than 0,05. Our results for Q2 differ
morning and evening. It seems that appropriateness (Q3)                from those of F. Aletta et al. [22], stating that L50 presented
The importance of changing urban scenery in the assessment of citizens’ soundscape perception | 149
the highest absolute correlation with subjective judgment ment they were doing the evaluation. Assessment by Q4
of the overall surrounding sound and appropriateness of in our questionnaire is equivalent to part 1 (sound source
the environment, as we find in Granada greater relevance identification) of Method A in ISO 12913-2 [16]. Traffic noise,
of high environmental noise levels (better Lmax and L10 sounds from individuals, natural sounds, noise from activi-
correlation). On the other side, results for appropriateness ties and, finally, other sources not individually considered
(Q3) seems to indicate low dependence on environmental were included in the questionnaire for which possible an-
noise metrics. swers ranged from “can’t hear” to “dominant noise” in a
numerical scale from 1 to 10 respectively. Part 1 of Method
A in ISO 12913-2 uses five response categories later assigned
3.2 Environmental sound dominance scale values from 1 to 5 as explained in table A.1 of ISO
12913-3 [17], so our results are easily assimilable. Figure 11
Environmental sound dominance was analysed using Q4 in shows results for the morning (SW_M) and evening (SW_E)
the assessment questionnaire, asking participants if they soundwalks.
could hear sounds from selected sources in the precise mo-
Figure 11: Environmental sound dominance for SW_M (top) and SW_E (down)150 | J. Vida Manzano et al.
Figure 12: Differences SW_M and SW_E at selected stops within the soundwalk path. P1 and P6 (up) located in (R) urban territory and P5 and
P8 at (SEC) territory
Even though traffic noise is always the dominant Stops P1 and P6 are relevant because they represent
source, both during morning and evening soundwalks, it typical residential locations within the study area heav-
is so to a lesser degree during the evening which draws a ily affected by urban road traffic flows and noise from city
completely different scenery during this period. Figure 11 life activities, including citizens behaviour and movement.
shows that traffic noise goes down during SW_E at stops Stops P5 and P8 are relevant because they are locations
P1 to P3, located in “Residential” (R) territory of the study affected by ringway heavy traffic flows and noise from aca-
area, but prevails in similar magnitude at stops P5, P7 and demic and sanitary buildings nearby. Natural sounds gain
P8 which are located at “Sanitary, Educational and Cul- dominance at P5, P8 and, to a lesser amount, at P6 during
tural” (SEC) territory, consequently with great academic SW_E with respect SW_M. Sounds of individuals experi-
and sanitary activity around that area whole day round. ment minor changes at stops P6 and P8, where more peo-
Nevertheless, natural sounds and sounds of individuals ple live and walk around both during morning and evening
gain dominance during the evening at every single stop in periods, but gain dominance during SW_E at no so densly
the path. These results show that important changes take populated stops P1 and P5.
place in the acoustic environment along the day not directly Apparently, these results have selective effect in over-
connected with traffic noise, but with the conjunction of all appraisal (Q2) and appropriateness (Q3) during SW_E,
factors that make this dominant noise source don’t hide previously discussed, as we observe that the generalised
other sources. natural sounds and sounds of individuals greater domi-
Figure 12 shows differences in environmental sound nance during SW_E is not traduced in a better assessment
dominance at four selected stops including P1 and P6 lo- at every stop in the path, but only at stops located in “Resi-
cated at R territory within PTS study area and P5 and P8 dential” part of PTS study area. To further investigate this
located at SEC territory. fact, these results will be analysed again in the next section.The importance of changing urban scenery in the assessment of citizens’ soundscape perception | 151
3.3 Assessment of emotional components population is not yet dense in the area, a fact that trans-
forms the local environment, noise sources and the appear-
Assessment of the eight emotional components according ance of streets and squares. Contrarily, stops located from
to Ö. Axelsson et al. model [24] were carried out with ques- mid path to the end, especially stops P7 and P8, lie in an
tion 5 using a numeric scale from 1 to 10 to express the urban territory where urbanisation is still to be fully devel-
perceived quality of surrounding sound environment, rang- oped, being non-permanent (transient) populations around
ing from “strongly disagree” to “strongly agree” respectively. hospital and university greater than resident population.
The eight scales were the same as recommended in Figure Altogether turns in a quite different morning/evening ur-
C.4 of ISO 12913-2 for part 2 (perceived affective quality) in banscape that participants in soundwalk noticed as shown
Method A, including pleasant (5.1), chaotic (5.2), exciting in Figure 13.
(5.3), uneventful (5.4), calm (5.5), annoying (5.6), eventful Comparing in Figure 14 the assessment given by ques-
(5.7) and monotonous (5.8). Our results, compared to the tions Q4 (environmental sound dominance) and Q5 (emo-
recommended five response categories and scale values tional components) at stops P1 and P3, heavily affected by
in Table A.1 of ISO 12913-3 (from 5 – strongly agree to 1 – this different morning/evening evaluation, it seems that
strongly disagree) have, as before, a direct and easy trans- “natural sounds” and “sounds of individuals” perception
formation. during the evening is not the reason for Q5 results.
Having in mind the difficulties that could arise among Now, as before, the evaluation changes and improves
participants in understanding the real meaning of the eight in the residential part of the soundwalk path but, again, the
model components, additional information was given in the generalised dominance of nature and individuals sound
questionnaire next to each dimension (in Spanish), high- does not seem to be the reason for such differences. Con-
lighting main four components 5.1 Pleasant (I like it) vs trast differences were calculated next considering each par-
5.6 Annoying (it’s unpleasant) and 5.7 Eventful (something ticipant answers to Q5 at each stop, both during SW_M,
happens/movement) vs 5.4 Uneventful (static environment), in which 14 participants took part, and SW_E in which 9
and added components 5.3 Exciting (pleasant and event- participants collaborated.
ful) vs 5.8 Monotonous (annoying and uneventful) and 5.2 Contrast differences (Axelsson et al. model compo-
Chaotic (annoying and eventful) vs 5.5 Calm (pleasant and nents answer differences) of every participant at stop loca-
uneventful). Mean responses to the eight model dimensions tion 3 (P3) are represented in Figure 15 in which “P-Up”
from participants during the morning (SW_M) and evening refers to the contrast (Pleasant-Unpleasant), “Ch-Cl” to
(SW_E) soundwalks at each stop site have been estimated (Chaotic-Calm), “Uv-E” to (Uneventful-Eventful) and “Ex-
and represented in Figure 13. M” to (Exciting-Monotonous). Contrast differences are com-
Our results show an evident different morning/evening puted for each participant as the difference between percep-
assessment in stops P1, P2 and P3 and similar morn- tion to opposite dimensions (P-Up, Ch-Cl, Uv-E and Ex-M)
ing/evening perception in the rest of the path. Urbanisation assigning a scale value ranging from 10 (strongly agree) to 1
is almost complete around stops P1 to P4 even though the (strongly disagree) to the response categories in Q5. Though
Figure 13: Assessment of emotional components (Q5) at each stop site according to Axelsson et al. model (2010) during SW_M (left) and
SW_E (right) soundwalks152 | J. Vida Manzano et al. Figure 14: Side by side comparison of assessments at stops number P1 and P3 from questions Q4 (left) and Q5 (right) during morning and evening soundwalks Figure 15: Contrast differences analysis at stop number P3 from collaborators taking part in SW_M (14 participants) and SW_E (9 partici- pants) soundwalks. The dotted red line indicates change tendency from “annoying-chaotic-eventful” soundscape (left) in the morning to a more “pleasant-calm-uneventful” interpretation in the evening (right) some participants collaborated in both soundwalks, the in contrast differences are also observed during the evening, designation on the right does not correspond to the same which indicates that the evaluation of emotional model participants (for example, Part_3 during the morning is not components is highly affected by factors that are no so evi- the same as Part_3 during the evening). We can see how dent during the morning but gain importance during the the perceived affective quality in P3 moves from a some- evening. what “annoying-chaotic-eventful” soundscape to a more A similar change is observed in stops P1 and P2 and to “pleasant-calm-uneventful” interpretation. High variations a lesser extent in stop number P5, evidencing that typical
The importance of changing urban scenery in the assessment of citizens’ soundscape perception | 153

“upper left side” assessment, as that during the morning in
Figure 15 left graph, moves to a “lower right side” percep-
tion during the evening as that in Figure 15 right graph. An
evolution indicating that different morning/evening local
characteristic rather than dominant noise sources changes
would be the main reason for this perception.
     To better understand this data behaviour, we have at-
tended ISO 12913-3 recommendation in Annex A.3 regard-
ing affective responses and its representation in a two-
dimensional model (figure A.1 in ISO 12913-3, [17]), just as
in Figure 13, except that dimensions “Exciting” and “Un-
pleasant” in Axelsson’s et al. model are respectively written
as “Vibrant” and “Annoying” in ISO 12913-3. In this type of
representation, the two main dimensions are how pleasant
or annoying (unpleasant) the environment was judged and
the amount of activity (human or another type) experienced      Figure 16: Pleasantness (P) and Eventfulness (E) as derived from
                                                                ISO 12913-3 formulae and Q5 data at every stop in the path during
around, that is how eventful or uneventful the acoustic en-
                                                                SW_M and SW_E
vironment was perceived. According to ISO 12913-3, “pleas-
antness”, designed as “P”, is the magnitude representing
the first main dimension and “eventfulness”, designed as        ingly, except at P6 and P8. The situation at P2 is especially
“E”, the second one and both can be calculated, respectively,   remarkable as it experiments a similar improvement of
employing formulae A.1 and A.2 when emotional compo-            pleasantness as in P1, but it doesn’t follow a similar de-
nents are given a scale value from 5 to 1 as in Table A.1,      crease in eventfulness during the evening. Special charac-
Annex A, ISO 12913-3 [17].                                      teristics affect P2 during evening nevertheless its proximity
     The coordinate for pleasantness, P, and eventfulness, E,   to P1. Something that would never be assumed from envi-
are estimated from formulae A.1 and A.2 in [17] as followws:    ronmental noise descriptors, quite similar as those in P1
                                                                (as it can be observed in Figure 9), that makes this stop
    P = (p − a) + cos 45∘ · (ca − ch) + cos 45∘ · (v − m)
                                                                gain overall appraisal (Q2) and appropriateness (Q3) (see
                                                                Figure 9) and pleasantness, even though a lower change
    E = (e − u) + cos 45∘ · (ch − ca) + cos 45∘ · (v − m)
                                                                in eventfulness as seen in Figure 17. Similar comments ap-
in which a is “annoying”, ca is “calm”, ch is “chaotic”,        ply to P6 and P8, affected by multiple factors changing
e is “eventful”, m is “monotonous”, p is “pleasant”, u is       local characteristics from morning to evening that does not
“uneventful” and v is “vibrant”.                                rely solely on environmental noise descriptors or the dom-
     Transforming our data accordingly, and changing the        inance of specific noise sources like traffic or sound from
range of formulae to +/−1 dividing by 9,657, as suggested in    nature or individuals. In the case of P2, we think that the
page 5 ISO 12913-3, pleasantness “P” and eventfulness “E”       big fountain and roundabout (see Figure 6) together with
were estimated for SW_M and SW_E, as shown in Figure 16,        the nearby metropolitan rail traffic makes the difference.
a preferred representation of data shown in Figure 13.          Stop P6 is heavily affected by its proximity to the border of
     As it would be expected, higher values of eventfulness     R and SEC territory delimitation with dense low-speed road
explain lower values of pleasantness during the morning         traffic and dense people walking around and near open
soundwalk and, contrarily during the evening, lower event-      spaces. Finally, stop P8 is affected by ring-road traffic flows
fulness gives higher pleasantness. Out of these, results in     and, especially, activity from hospital and university at a
P2 are some kind of surprising as P and E are almost co-        near distance.
incident during the evening, highlighting once again the             Correlation between the eight sound attributes in Ax-
importance of the local environment in the evaluation as        elsson et al. model and noise descriptors was next analysed,
stop P2 present similar results as P1 and P3 during the morn-   finding that “chaotic” and “eventful” present positive corre-
ing, but an a priori unexpected result during the evening.      lation against Leq, Lmax and L10 during the morning, and
Comparison SW_M vs SW_E for “pleasantness” and “event-          opposite feelings “calm” and “uneventful” negative corre-
fulness” is shown in Figure 17.                                 lation with these descriptors (absolute r > 0,6) But only
     It can be seen that pleasantness increases at every stop   “eventful” and “calm” correlations have significative p-vale
from morning to evening as eventfulness decreases accord-       under 0,05 (see Table 5).
154 | J. Vida Manzano et al. Table 5: Correlation between sound attributes in Axelsson et al. model (perceived affective quality) and noise descriptors MORNING (r, p) Pleasant Chaotic Exciting Uneventful Calm Unpleasant Eventful Monotonous Leq −0,4492 0,312 0,6963 0,082 −0,1297 0,782 −0,5754 0,176 −0,8599 0,013 0,3093 0,500 0,7856 0,036 −0,4491 0,312 Lmax −0,4534 0,307 0,7800 0,039 −0,1429 0,760 −0,6341 0,126 −0,8520 0,015 0,3999 0,374 0,8144 0,026 −0,3777 0,404 Lmin 0,0373 0,937 0,2955 0,520 0,2011 0,665 −0,3321 0,467 −0,5477 0,203 −0,0898 0,848 0,4277 0,338 −0,6999 0,080 L10 −0,5233 0,228 0,6916 0,085 −0,2196 0,636 −0,6084 0,147 −0,9149 0,004 0,3263 0,475 0,8011 0,030 −0,3927 0,384 L50 −0,3519 0,439 0,6182 0,139 −0,0384 0,935 −0,4405 0,323 −0,7115 0,073 0,2657 0,565 0,6854 0,089 −0,4970 0,257 L90 −0,0089 0,985 0,3518 0,439 0,1931 0,678 −0,3365 0,461 −0,5701 0,181 −0,0418 0,929 0,4682 0,289 −0,6827 0,091 EVENING (r,p) Pleasant Chaotic Exciting Uneventful Calm Unpleasant Eventful Monotonous Leq −0,6256 0,097 0,7136 0,047 0,0280 0,948 −0,6283 0,095 −0,6233 0,099 0,7365 0,037 0,5592 0,150 0,6813 0,063 Lmax −0,6316 0,093 0,6664 0,071 −0,0590 0,890 −0,6240 0,098 −0,5953 0,120 0,6742 0,067 0,5056 0,201 0,7094 0,049 Lmin −0,2110 0,616 0,3469 0,400 0,4091 0,314 −0,3587 0,383 −0,3879 0,342 0,3610 0,380 0,4366 0,279 0,0095 0,982 L10 −0,6411 0,087 0,6947 0,056 −0,0025 0,995 −0,6102 0,108 −0,5945 0,120 0,7203 0,044 0,5310 0,176 0,6856 0,061 L50 −0,4866 0,221 0,5824 0,130 0,1710 0,686 −0,4903 0,217 −0,5273 0,179 0,6329 0,092 0,5284 0,178 0,3399 0,410 L90 −0,1846 0,662 0,3339 0,419 0,4007 0,325 −0,3339 0,419 −0,3604 0,380 0,3554 0,388 0,4116 0,311 0,0448 0,916
The importance of changing urban scenery in the assessment of citizens’ soundscape perception | 155

Figure 17: Pleasantness (P, left) and Eventfulness (E, right) morning vs evening comparisons at every stop in the path during soundwalks

     On the contrary, during the evening all except “exciting”     Finally, similar correlation analysis was performed be-
correlates (absolute r > 0,6 except “eventful” for which r > tween Q4 and Q5 answers as shown in Table 6. “Traffic
0,5) with Leq, Lmax and L10, negatively for “pleasant”, noise” was found to be positively correlated with “chaotic”,
“uneventful” and “calm” and positively for the rest of the “unpleasant” and “eventful” and negatively correlated with
components, being “unpleasant” the dimension with more “uneventful” and “calm” but only during the evening walk
significative p-values (see Table 5).                          (see Table 6)
     We may conclude that lower environmental noise dur-           On the other hand, “Sound of Individuals” was found
ing the evening gives a much better overall appearance to correlate with “eventful” during the evening walk but be
of the city, driving participants towards the perception of negatively correlated with “calm” in the morning and the
pleasantness and calmness and less annoyance as the main evening.
factor affecting the global evaluation during SW_E. On the         “Natural sounds” positive correlates with “pleasant”
contrary, higher levels may affect perception towards feel- both in the morning and the evening and with “exciting” in
ings of chaos and eventfulness, altogether highlighting the the morning but negatively with “chaotic” and “unpleas-
importance of time and local ambient in soundscape evalu- ant”during the evening.
ations.                                                            These results are in accordance with observations
                                                               about differences in perceived affective quality in the morn-

Table 6: Best correlation results for selected sound dominance (Q4) and perceived affective quality (Q5) components during morning and
evening soundwalks

                                         SW_E                   SW_E                  SW_E                 SW_E               SW_E
     Traflc noise (Q4.1)              Chaotic (Q5.2)        Unpleasant              Eventful           Uneventful          Calm (Q5.5)
                                                               (Q5.6)                (Q5.7)               (Q5.4)
                                        r = 0,8553          r = 0,7633            r = 0,8838          r = −0,8435          r = −0,8401
                                        p = 0,007            p = 0,028             p = 0,004            p = 0,008           p = 0,009

                                           SW_M              SW_E                    SW_M             SW_E
 Sound of Individuals (Q4.2)                   Eventful (Q5.7)                            Calm (Q5.5)
                                        r = 0,7104        r = 0,7210             r = −0,7678      r = −0,7523
                                        p = 0,074          p = 0,044               p = 0,044        p = 0,031

                                          SW_M            SW_E                      SW_M                SW_E                    SW_E
    Natural sounds (Q4.3)                    Pleasant (Q5.1)                    Exciting (Q5.3)      Chaotic (Q5.2)        Unpleasant
                                                                                                                               (Q5.6)
                                        r = 0,7855           r = 0,8327           r = 0,8195          r = −0,7163          r = −0,7170
                                         p = 0,036           p = 0,010             p = 0,024            p = 0,046            p = 0,045
156 | J. Vida Manzano et al.
Figure 18: Mean overall appraisal (Q2 answers) together with mean Q5 answers at every soundwalk stop [P1 to P8] during SW_M (left; no
data at P4) and SW_E (right)
ing vs evening, as natural sounds and sounds of individuals 3.4 Soundscape assessment by non-ISO
would “move” the Q5 assessment towards the sector “pleas- standard
ant” and “calm” as “unpleasant” and “chaotic” would lose
prominence during SW_E. Analysis of answers from questions Q7, Q8 and Q9 follow.
These results disagree with those of Aletta et al. [22] These three questions are rated on 5 verbal response cat-
concerning humans and calmness but agree in the other egories interested in overall quietness (Q7), pleasantness
components. Similar results are found as in Kang et al. [8] (Q8) and loudness (Q9). It should be noted that “quietness”
for the positive influence of natural sounds in the evalu- means the free translation of the original Spanish word in
ation of environmental pleasantness or traffic noise as a questionnaire “tranquilidad”, the same way as “pleasant-
negative factor for pleasantness. ness” refers to “agradable” in Spanish and, finally, “loud-
Finally, if we compare results from Q5 against Q2 (over- ness” refers to “volumen del ruido” in Spanish question-
all appraisal), we find again important differences between naire. So, these questions were not formulated according
morning and evening soundwalks, being the most impor- to ISO 12913 standard recommendations but, instead, fol-
tant that the overall appraisal of the environment (Q2) is lowed works and recommendations from Aletta [22] and
closer to emotional component Q5.1 “pleasant” and, to a Radicchi [23]. Nevertheless, there are some complementary
lesser extent, to Q5.5 “calm” and Q5.3 “exciting” especially connections among questions, which was the reason to
during the evening. include them in questionnaire for later analysis purposes:
On the other hand, Q5.2 “chaotic”, Q5.6 “unpleasant” question Q7 (overall quietness) could be considered con-
and Q5.7 “eventful” are the emotional evaluation of the nected to question/answer 5.5 “Calm” and question Q8
environment quite distant from its overall sound quality (overall pleasantness) would be connected both to ques-
assess by Q2, as shown in Figure 18. tion/answer 5.1 “Pleasant” and question Q2 (overall ap-
praisal).
Results show that Quietness (Q7) positively correlates
with (Q8) pleasantness and negatively with (Q9) loudness,
Table 7: Pearson’s correlation coeflcient and corresponding p-values (r,p) analysis for Q7 (quietness) vs Q8 (pleasantness) and Q9 (loud-
ness) and Q8 vs Q9 during morning and evening soundwalks
r (p) pleasantness (Q8) loudness (Q9)
quietness (Q7) SW_M 0,6207 (0,137) −0,7072 (0,076)
SW_E 0,9482 (< 0,001) −0,8843 (0,004)
pleasantness (Q8) SW_M −0,5123 (0,240)
SW_E −0,8290 (0,011)The importance of changing urban scenery in the assessment of citizens’ soundscape perception | 157
Figure 19: Overall quietness (Q7), pleasantness (Q8) and loudness (Q9) correlations during the morning (left) and evening (right) sound-
walks
but the correlation is much better during the evening both annoyance and correlations show better results (minor rel-
for Q8 and Q9 as shown in Table 7. On the other hand, pleas- evance during the morning).
antness (Q8) presents a weak negative correlation with loud- Contrarily, similar correlations during morning and
ness (Q9) during the morning that, once again, increases evening are found between these magnitudes and noise
considerably during the evening (Table 7). metrics as shown in Table 8. Overall quietness (Q7) nega-
Overall loudness (Q9), which refers to environmental tively correlates with most descriptors except background
noise magnitude, volume, not quality, appears as quite noise (Lmin and L90) during the evening (p-value > 0,5).
responsible for the overall feeling of quietness and pleas- Pleasantness (Q8) doesn’t present good coefficients during
antness, a perception that strengthens during the evening the morning, but it presents certain negative correlation
as shown in Figure 19, when peaks and maximums in a with Leq, Lmax and L10 during the evening (small p-values
lower environmental noise background generate greater but > 0,05). Finally, overall loudness (Q9) correlates with
every descriptor and period, except for L90 and Lmin de-158 | J. Vida Manzano et al.
Table 8: Overall quietness (Q7), pleasantness (Q8) and loudness (Q9) correlation vs noise descriptors [Pearson’s correlation coeflcients (r)
and p-value (p)]
SW_M SW_E
r (p) Q7 Q8 Q9 r (p) Q7 Q8 Q9
Leq −0,8115 −0,6498 0,8490 Leq −0,8048 −0,6559 0,8810
(0,027) (0,114) (0,016) (0,016) (0,077) (0,004)
Lmax −0,7976 −0,6588 0,8755 Lmax −0,8157 −0,6722 0,7459
(0,032) (0,108) (0,010) (0,014) (0,068) (0,034)
Lmin −0,7856 −0,3562 0,7077 Lmin −0,2806 −0,1646 0,6367
(0,036) (0,433) (0,075) (0,501) (0,697) (0,090)
L10 −0,7819 −0,6568 0,7785 L10 −0,8047 −0,6609 0,8634
(0,038) (0,109) (0,039) (0,016) (0,074) (0,006)
L50 −0,8303 −0,6491 0,8812 L50 −0,5909 −0,4707 0,8756
(0,021) (0,115) (0,009) (0,123) (0,239) (0,004)
L90 −0,7799 −0,3898 0,7572 L90 −0,2664 −0,1505 0,6333
(0,039) (0,387) (0,049) (0,524) (0,722) (0,092)
Figure 20: Evening correlation data for Q2 (appraisal, left) and Q3 (appropriateness, right) vs Q7 (quietness) graphed as orange dots and fit
equations, compared with morning data (dots in blue) for which there is no correlation
Figure 21: Pleasantness “P” estimated according to ISO 12913-3 2019 and overall mean pleasantness (Q8, left) and quietness (Q7, right) at
every stop during morning and evening soundwalksThe importance of changing urban scenery in the assessment of citizens’ soundscape perception | 159 Figure 22: Percentage distribution of the five ordinal-category scale answers to question Q7 (overall quietness, right axis) and equivalent noise level descriptor (left axis) at every stop in path during the morning (up) and evening (bottom) soundwalks
160 | J. Vida Manzano et al.

scriptors, which appears as a reasonable result. Altogether, pleasantness (Q8) positively correlates with birds and move-
noise indicator Leq and Lmax seem to be good and stable ment of vegetation and trees to a greater extent during
indicators in most cases in this assessment.                  mornings than evenings and negatively correlates with mo-
     General sound quality (Q2) and appropriateness (Q3) torcycles but only during evenings, which reinforce previ-
do not correlate at all with Q7, Q8 or Q9 (overall quietness, ous results on greater tolerance to noise during the morning
pleasantness and loudness respectively) during the morn- period.
ing walk, but they do during the evening. Q2 correlates
positively with Q7 (r=0,9367, p=0,001) and Q8 (r=0,9145,
p=0,001) and negatively with Q9 (r=−0,8836, p=0,004). On
the other hand, appropriateness Q3 somehow correlates
                                                              4 Conclusions
positively with quietness Q7 (r=0,6944, p=0,056) and, more
                                                              Soundscape approach applied to a new urban area affected
significantly, with pleasantness Q8 (r=0,7549, p=0,030) and
                                                              by high road noise levels and growing urbanization pres-
negatively with loudness Q9 (r=−0,7437, p=0,034).
                                                              sure contributes to a better knowledge and, to some extent,
     This fact highlights the importance of background lev-
                                                              characterization of noise issues taking into consideration
els and city life agitation in the perception and interpreta-
                                                              human perceptions. But this research also shows impor-
tion of the urban soundscape. It can also be pointing out
                                                              tant differences in the perceived quality of the acoustic
the importance given by citizens to less noisy environments
                                                              environment along the day, that is, time factors affecting
during the evening and the tolerance to high levels during
                                                              soundscape assessment, and along the sound path itself,
the morning.
                                                              that is, local environmental issues affecting how sounds
     The results also point out the importance of questions
                                                              are perceived by people.
like Q7 (overall quietness) or Q8 (overall pleasantness)
                                                                   The main conclusion is that soundscape assessment
as they represent valuable contrast elements for decision-
                                                              should not be carried out by single evaluations limited in
making complementing other assessment data that could
                                                              space and time, but repeatedly over long periods and at
be, occasionally, misunderstood. In this sense, Q8 closely
                                                              different times of the day and different dates in the year if
reproduces ISO 12913-3 pleasantness “P” as shown in Fig-
                                                              soundwalk techniques are going to be applied. If auditions
ure 21, making it a good alternative, better than Q7, if emo-
                                                              are to be used for soundscape characterizations, enough
tional data are not available.
                                                              sound sources representing a wide variety of local condi-
     Additionally, Figure 22 shows how answers to Q7 dis-
                                                              tions and acoustic environments should be used, especially
tribute along with information on noise equivalent descrip-
                                                              in conflict context such as PTS study area analyzed in this
tor, giving a full description of how they complement to un-
                                                              work.
derstand the big changes that take place during the evening
                                                                   After that, our results show that high level of appropri-
at certain stops that would keep undetected under tradi-
                                                              ateness is necessary to appreciate an overall good sound
tional environmental noise data or limited perception data.
                                                              quality of the environment and that overall loudness ap-
Mean overall quietness at every stop is shown in Figure 21.
                                                              pears as responsible for the feeling of quietness and pleas-
                                                              antness, a perception that strengthens during the evening.
                                                                   Personal judgment about the overall surrounding
3.5 Perceived dominance of individual
                                                              sound environment shows greater tolerance to high envi-
       sources                                                ronmental levels during the morning. The overall appraisal
                                                              of the environment is found to be closer to the emotional
Answers from question Q10 “Perceived intensity from dif-
                                                              component “pleasant” and, to a lesser extent, to “calm”
ferent noise” (perceived dominance) on a five items ver-
                                                              and “exciting” especially during the evening. All these find-
bal scale, complements question Q4 about “Environmental
                                                              ings should be taken into account when designing the new
sound dominance” on a (0-10) numeric scale. Sounds from
                                                              urbanisation of the area, to incorporate all those urban
adults dominate “Human” noise sources during the morn-
                                                              elements that reduce environmental noise relevance and
ing and evening, sounds from bicycles moving around and
                                                              increments overall good appraisal of the environment. The
emergency vehicles dominate “Mechanic” noise and near
                                                              elaboration of noise control plans should also consider
road traffic noise clearly dominates “Traffic” noise sources
                                                              these results, as great differences between morning and
followed by motorcycles especially during the evening.
                                                              evening have been found connected to subjective judgment
Birds flying around dominates “Biologic” noise sources
                                                              rather than to environmental noise levels in the area.
and vegetation and water are the main “Geophysics” noise
sources. The most important conclusion from Q10 is that
You can also read