The "sound of silence" in Granada during the COVID-19 lockdown - De Gruyter
←
→
Page content transcription
If your browser does not render page correctly, please read the page content below
Noise Mapp. 2021; 8:16–31

Research Article

Jerónimo Vida Manzano*, José Antonio Almagro Pastor, Rafael García Quesada, Francesco
Aletta, Tin Oberman, Andrew Mitchell, and Jian Kang

The “sound of silence” in Granada during the
COVID-19 lockdown
https://doi.org/10.1515/noise-2021-0002
Received Sep 11, 2020; accepted Nov 13, 2020
                                                                          1 Introduction
Abstract: Exceptional circumstances in the city of Granada                When SARS-CoV-2, better known as Coronavirus, was rec-
due to the COVID-19 lockdown have provided the oppor-                     ognized by the WHO as a pandemic on March 11th 2020,
tunity to characterise the impact of humans on its urban                  Spain was three days away from being subjected to the
acoustic climate. Traditional environmental noise man-                    most rigorous containment the country has ever known
agement and urban sound planning usually take into ac-                    (BOE, March 14) [1]. Strict containment measures were im-
count noise sources in the city, such as industrial activi-               plemented in many countries around the world with so-
ties or road traffic noise, in model estimations, as well as              called “lockdowns” leading to heavy limitations of move-
in empirical research. But trying to isolate human impact                 ment for people and goods, bans of most domestic and in-
by itself, human activity including social activity, walking,             ternational travels and social distancing and “stay-home”
talking or just going around the city, has always been a                  recommendations [2]. Changes of routines or forced lock-
difficult or even impossible task. The COVID-19 lockdown                  downs are attributes and corollaries of a new way of liv-
measures have provided the opportunity to study urban                     ing a global pandemic. In this struggle of opposites, of
climate as never before, affected just by natural or ani-                 contrasting experiences, cities have been left with sound-
mal noise sources. Previous soundscape research at some                   scapes worthy of mention.
iconic sites in the city of Granada carried out in 2019 before                 With most human activities in urban contexts severely
the lockdown and a special measuring campaign carried                     limited because of lockdown policies, cities around the
out at the same locations during the lockdown in 2020 of-                 world have experienced unprecedented decreases of envi-
fered valuable information on sound levels and local char-                ronmental noise levels: metropolis like New York, Paris,
acteristics in order to carry out this comparison. Results                Rome, Barcelona, and many more, reported dramatic re-
show a great change in environmental noise levels that is                 ductions of noise levels generated by road traffic and other
interesting not only because of its magnitude, but also for               transportation modes [3–6].
its implications, especially at those sites where social hu-                   As a typical “non-essential” activity, tourism was one
man activity was an identifying characteristic. Natural or                on which lockdown measures had the strongest impact. If
animal sounds became surprisingly evident at some study                   the acoustic environments of bigger cities have received
sites, especially where road traffic noise dramatically de-               a lot of attention because of the reductions in road traf-
creased, leading to significantly lower background noise                  fic noise, less is known about the effect that the COVID-
levels. Important spectral changes are observed before and                related containment measures had on the soundscapes of
during the lockdown, suggesting a shift from anthropic to                 smaller historical towns and cities. In this paper, some
animal sources in the acoustic environment.                               case studies are selected in the city of Granada (Spain),
                                                                          with a focus on iconic and monumental urban spaces, to
Keywords: Lockdown; Environmental noise; Sound-
                                                                          investigate the effect that the stop of touristic activities
scapes; COVID-19; Cultural heritage
                                                                          had on the acoustic environments of those sites. The ra-
                                                                          tionale for selecting those sites is investigating pedestrian
                                                                          areas, where road traffic noise (from distance) is expected
*Corresponding Author: Jerónimo Vida Manzano: University
of Granada, Hospital Real, Avenida del Hospicio, 18010 Granada,
Spain; Email: jvida@ugr.es
José Antonio Almagro Pastor, Rafael García Quesada: Depart-               Francesco Aletta, Tin Oberman, Andrew Mitchell, Jian Kang:
ment of Applied Physics, Faculty of Sciences, University of Granada,      University College London, Gower St, Bloomsbury, WC1E 6BT Lon-
Campus Fuentenueva s/n, 18071 Granada, Spain                              don, United Kingdom of Great Britain and Northern Ireland

   Open Access. © 2021 J. Vida Manzano et al., published by De Gruyter.               This work is licensed under the Creative Commons Attribu-
tion 4.0 License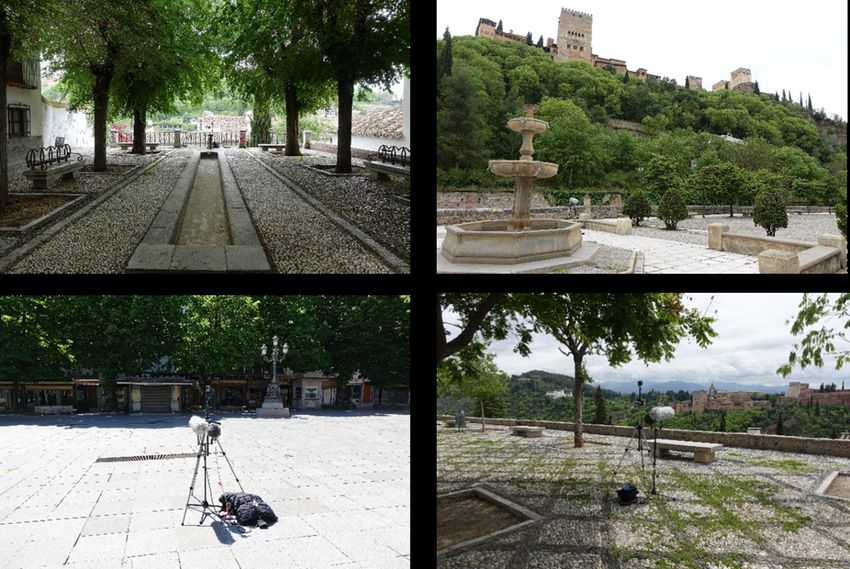
The “sound of silence” in Granada during the COVID-19 lockdown | 17

to be a secondary sound source even in normal conditions              The aims of this study are: 1) quantifying in terms of
(i.e., without lockdown) and human sounds are likely to          sound pressure levels (SPL) the noise reduction induced
be more prominent, and considering what is the impact of         by the lack of human activities at typical touristic desti-
the latter on the background noise levels of the sites using     nations in Granada; 2) exploring possible changes in tem-
the “opportunity” offered by the lockdown.                       poral and spectral patterns in the acoustic environments
      Tourism research has investigated thoroughly how           of the Granada sites between the normal situation and the
people experience iconic and monumental spaces (e.g.,            lockdown situation.
[7]). It has been argued that the aesthetic appreciation of a
touristic destination can be affected by its environmental
qualities, like the scenery and the soundscape and these
contribute to the overall tourist experience [8]. In general,
                                                                 2 Materials and methods
soundscapes are gaining increasing attention in cultural
heritage studies [9–11]; this trend is supported also by the     2.1 Case study sites
framework provided by the UNESCO Convention on the In-
tangible Cultural Heritage [12] and one of its subsequent        This work relies on four urban spaces in Granada that can
declarations [13, 14]. The soundscape approach plays also        be considered as iconic sites because of their touristic rele-
an important role in the tourism management of natural           vance, beauty and for being places where citizens and vis-
areas [15–19]. Yet, studies about the soundscape of touris-      itors gather to talk, walk, play or simply enjoy the environ-
tic destinations in urban rather than natural contexts are       ment. They are not the only places with such characteris-
still scarce [20, 21]. Liu et al. [22] studied the soundscapes   tics in Granada but sites where best coincidence measure-
of historical areas of Beijing, China. Puyana Romero et          ments and recordings are available before and after COVID
al. [23] noted significant differences in soundscape assess-     lockdown period. Figure 1 shows an overview image of
ments between tourists and residents in their study on the       the four selected locations in 2019 and Figure 2 shows the
soundscape of the city centre of Naples, Italy. A previous       same locations in 2020. Main characteristics are summa-
study in Naples by the same research group [24] focused          rized in Table 1 after a brief description of case study sites.
on the changes in the sound environment in pedestrian ar-
eas of the historic centre experienced after the implemen-
tation of a Limited Traffic Zone (LTZ), which led to signif-
icant noise levels reductions from road traffic noise, even      2.1.1 Placeta de los Carvajales viewpoint (CAR)
if in a less extreme situation as the one cities are experi-
encing due to the COVID-19 pandemic. In other studies in         Placeta de Carvajales is a small square located in the lower
other regions of the world reporting about sound environ-        Albaycín close to the bank of the river Darro; one of the
ment changes during the 2020 lockdown measures, atten-           less known viewpoints of the Alhambra. Since the 16th
tion is now being given not only to road traffic noise, but      century, it has maintained the empty urban configuration.
also human sound sources [3, 25].                                Carvajales is named in that way regarding to one of the
      This study highlights the exceptional state of silence     most influential noble families of the 15th and 16th cen-
that the city centre of Granada has experienced. The Al-         turies, from the province of León, who accompanied the
hambra, the most visited monument in Spain, can also be          Catholic Monarchs in the Reconquest of Granada. Since
contemplated from historical viewpoints, that are sites of       the 1960s, when the last reforms were undertaken, the
touristic interest themselves. Among them, there are the         image of the viewpoint has not changed. It can only be
Paseo de Los Tristes, the Placeta de Los Carvajales and          reached on foot, through the centenary and narrow streets
the Plaza de San Nicolás. Finally, the urban space of Bib-       of the quarter, which eliminates at any time of the year,
Rambla Square is an urban space for gathering and people         much of the noise of motor vehicles. On the other hand, the
flow, also typical of a tourist city like Granada.               bustle of the people is constant. A frontal view of the Al-
      In the Spring of 2019, as part of a different project,     hambra from the Alcazaba and from a lower point of view
there was an opportunity to measure the sound pressure           than San Nicolás, makes it a favourite place to visit for the
levels in these emblematic spaces. With the lockdown of          locals and especially for young people.
mid-March 2020, it was possible to repeat measurements
in the same places and points that had been already mea-
sured one year before, making it possible to carry out this
comparison research work.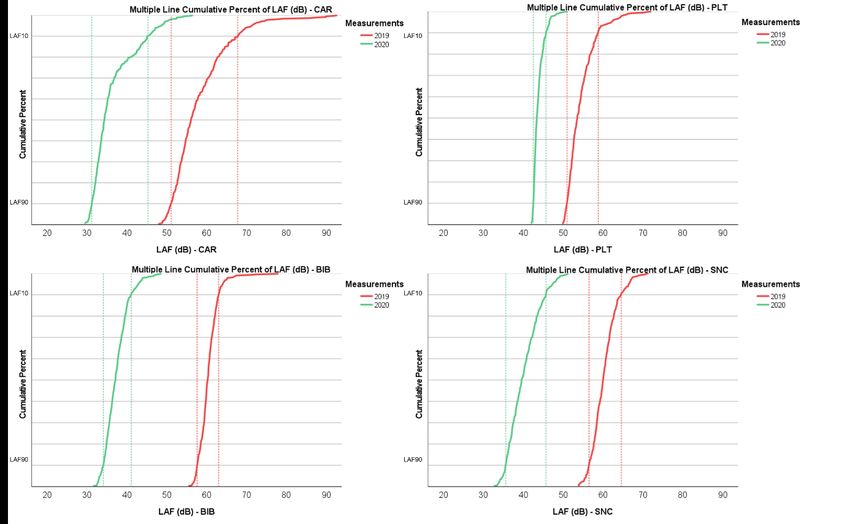
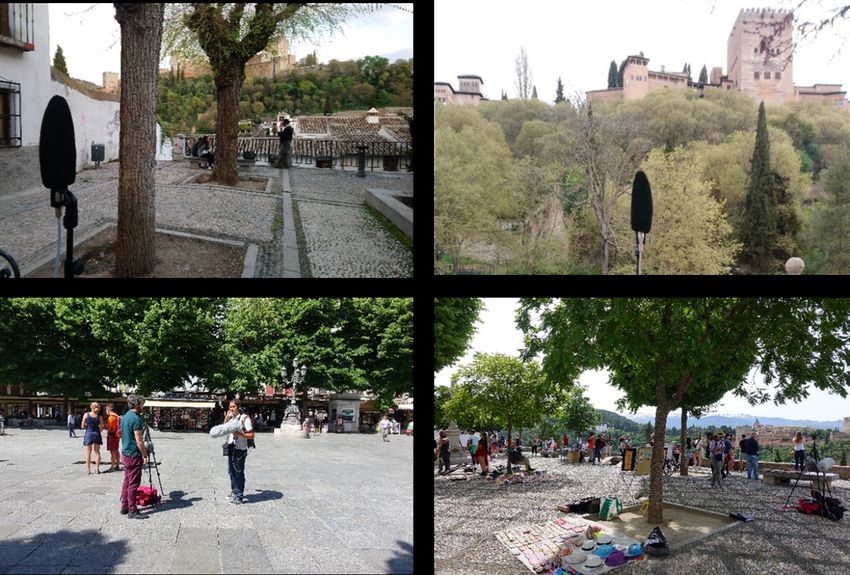
18 | J. Vida Manzano et al.

Figure 1: From left to right and from top to bottom Placeta de Carvajales (CAR), Paseo de los Tristes (PLT), Plaza de Bib-Rambla (BIB) and
Plaza de San Nicolás (SNC). Own resource (2019)

Figure 2: From left to right and from top to bottom Placeta de Carvajales (CAR), Paseo de los Tristes (PLT), Plaza de Bib-Rambla (BIB) and
Plaza de San Nicolás (SNC). Own resource (2020)
The “sound of silence” in Granada during the COVID-19 lockdown | 19

Table 1: Main characteristics of selected case study sites

ID       LOCATION                                     GENERAL DESCRIPTION                    TYPICAL SOUND ENVIRONMENT
         [LAT_N, LON_W]
CAR      Albaicín, old Moorish district               Viewpoint square of the Alhambra,      No nearby traflc, sound from hu-
         [37,178946, −3,594216]                       isolated and away from traflc          man voices and occasionally pets
PLT      Albaicín, old Moorish district               The lowest and longest viewpoint       Traflc noise though limited circu-
         [37,178794, −3,589437]                       of the Alhambra, following river       lation, sound from humans and
                                                      bed, full of restaurants and people    nearby river
BIB      City centre                                  City centre square, no traflc but      No nearby traflc, sound from hu-
         [37.175395, −3.599808]                       dense people walking concentra-        mans, hostel, and tourism activity
                                                      tion because of work in nearby
                                                      buildings, including Town Hall, or
                                                      leisure
SNC      Albaicín, old Moorish district               Most important, direct view and        Some traflc noise and sounds from
         [37.181128, −3.592788]                       emblematic Alhambra viewpoint,         humans, including singing and mu-
                                                      lots of people concentrates there,     sic play
                                                      both locals and visitors

2.1.2 Paseo de los Tristes viewpoint (PLT)                           of the city. It has been a place for comedies, a bullring; but
                                                                     above all, a very important commercial space.
The Paseo de los Tristes, meaning the path of the sad ones                Bib-Rambla occupied a strategic place in the Nasrid
is an emblematic longitudinal square on the banks of the             city and, later, in Castilian. It was close to the silk market
river Darro and at the foot of the Alhambra. It takes its            (Alcaicería), to the first University of Granada, to the main
name from the path that the relatives and friends of the             commercial axis that connected with Plaza Nueva (Zacatín
deceased used to take from the Santa Ana’s church (where             Street), and also to the religious centres of the time (the
the funeral was held) to the cemetery of San José, located           Great Mosque and the Cathedral) that were so important
on the same hill as the Alhambra and a few hundred me-               in the active life of the city for centuries. All this has made
tres away from it, up the slope of the “Cuesta de los chinos”.       it a neuralgic place of meeting for people, the main place
     Under normal circumstances it receives a large influx           of commerce, an area with a high density of people flows.
of people who walk from the Carrera del Darro towards the                 The noise of motor vehicles in this square is practically
Albaycín or who rest in one of its terraces and bars, enjoy-         non-existent; there is only the noise heard from other ad-
ing the views of the Nasrid monument.                                jacent streets. On the other hand, the bustle of the shops
     The Darro River always has a significant flow of water,         and the people who pass through make it a place subject
even in the summer season, but the murmur of the water               to a high level of sound pressure.
is masked by the voices. Vehicle access to the area is also
frequent but only allowed to local residents, especially by
public transport and motorbikes, which use this route with           2.1.4 San Nicolás viewpoint (SNC)
one of the main accesses to the Albaycín.
                                                                     The origins of the Roman city of Ilíberri, or also known as
                                                                     Florentia, are very close to this beautiful Albaycín square.
2.1.3 Bib-Rambla square (BIB)                                        It seems that the location of the Roman Forum was in the
                                                                     Placeta de las Minas and therefore, from a very early age
It was one of the squares within the walls of the Muslim             this square was an emblematic place of public attendance
city, which was colloquially called the Sandy Gate due to            in the city. Iberians, Romans, Visigoths, Almoravids, Al-
its configuration of alluvial deposits from the River Darro.         mohads, Nasrids, Castilians, Aragonese and Navarrese...
On the plan of the of Vico’s Platform from the end of the            were, among others, the different origins of these people
16th century, the square can still be seen with the canvas of        from Granada who enjoyed the best views from this fa-
the wall on its south-west side, still intact. Since the Nasrid      mous viewpoint named after Saint Nicholas.
era, Bib-Rambla has always been a commercial epicentre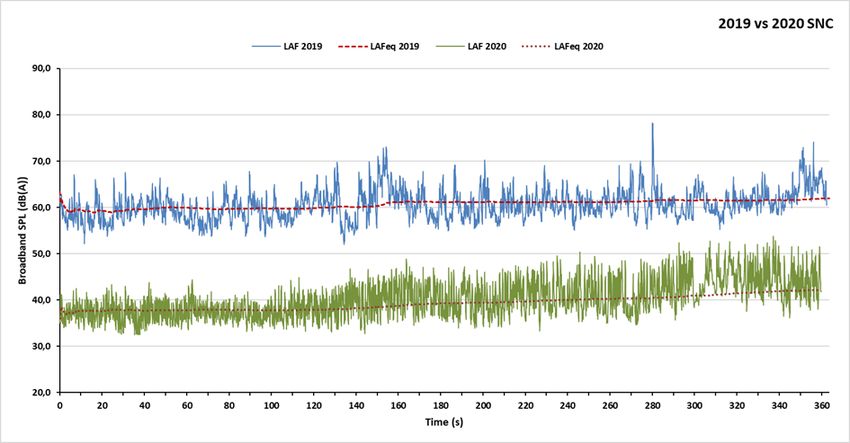
20 | J. Vida Manzano et al.

     Traffic noise in this area is moderate due to the influx      minutes interval recordings at each site in 2019 and 2020
of vehicles on its perimeter. The murmur of the people is al-      trying to filter and, consequently, avoid the presence of
ways very high due to their unbeatable views of the Nasrid         anomalous events (ambulances, people shouting, talking
monument. Flamenco singers, laughter, children’s games             too near to equipment, malfunctioning, etc.) while main-
adorn the usual soundscape of this space.                          taining the same environmental circumstances and char-
                                                                   acteristic in 2019 and 2020 with the only difference of hu-
                                                                   man presence. First data analysis and preview with BK
2.2 Data acquisition                                               Connect [28] converted each six minutes recording extract
                                                                   in a set of 3,600 individual 0.1 second sound level mea-
Audio samples were collected using a Brüel & Kjaer 4145            surements from which we estimated acoustic parameters
microphone mounted on a tripod, connected to its 2804              as shown below.
power supply. The signal is then fed into a Zoom F8 field               So, as far as this analysis is concerned, the database
recorder. The level was calibrated each time using a Brüel         consists of a set of two 6 minutes sound recordings at each
& Kjaer 4231 calibrator at 94 dB. Headroom is set depend-          selected site, one during 2019 and a second one in 2020,
ing on the conditions from 6 to 20 dB enabling the record-         under the same circumstances of recording place, date and
ing of 114 dB peaks. The signal is re-escalated using the cal-     period of the day with the only change being lockdown
ibration signal and then analysed using BK Connect soft-           condition, as weather conditions were also quite similar
ware. This procedure complies with [26, 27]. In 2019 a large       from one year to another.
piece of foam that was originally suited for Brüel & Kjaer
environmental microphones was used as windscreen (see
photos) but in 2020 a RØDE spherical blimp was included
in the setup.
                                                                   3 Results
     Sound recordings were performed during March and
May in 2019 at selected sites under normal human circum-           3.1 Data post-processing
stances, which means quite a lot of people were around             Acoustic parameters according to ISO 12913-3 [29] were es-
as well as some traffic, though limited because of traffic         timated, including LAeq (dB(A)), LCeq (dB(C)), LAF5 and
restrictions in these places. Same sound recordings were           LAF95 (dB(A)), as well as other normal environmental in-
done at selected sites during lockdown period in April and         dices including LAFmax, LAFmin, LAF10, LAF50, LAF90,
May 2020 (see details in Table 2).                                 LAE (all in dB(A)) and the standard deviation (SDEV) of
     The same equipment, an omnidirectional micro-                 data as shown in Table 3. As stated before and, again, ac-
phone, used in 2019 was employed in 2020 measurements              cording to ISO 12913-3 [29] psychoacoustic metrics were
and the 2019 procedure and protocol was also repeated in           also computed using BK Connect including Loudness (N
2020. A new Soundfield ambisonic microphone and 360-               and N5, sone), Sharpness (S, acum), Tonality (T), Rough-
degree video camera were included in the 2020 campaign,            ness (R, asper) and Fluctuation Strength (F, vacil) as
though at present we are only considering the same type of         shown in Table 4.
recordings taken during 2019 and 2020 for evaluation pur-               Loudness and its percentiles were calculated accord-
poses. Sound recordings available intervals vary from 10           ing to ISO 532-1 [30], Sharpness according to DIN 45692 [31]
to 15 minutes at each site. From these, we have selected six       (Low-level compatibility was not used), Tonality according

Table 2: Sound recordings date, time and lockdown conditions

  Site ID       Site short name                                  Date                 Time                  Lockdown
   CAR          Placeta de los Carvajales viewpoint              20-03-19             ~18.40h               NO
                                                                 01-05-20             ~13.30h               FULL
    PLT         Paseo de los Tristes viewpoint                   20-03-19             ~17.30h               NO
                                                                 27-04-20             ~13.00h               FULL
    BIB         Bib-Rambla square                                15-05-19             ~11.30h               NO
                                                                 01-05-20             ~15.30h               FULL
    SNC         San Nicolás viewpoint                            17-05-19             ~11.20h               NO
                                                                 01-05-20             ~11.50h               FULL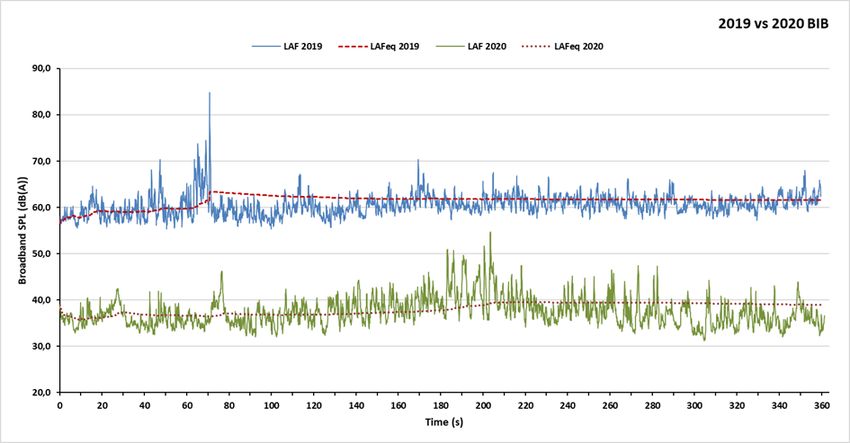
The “sound of silence” in Granada during the COVID-19 lockdown | 21

Table 3: Summary environmental noise indices data in Granada, before (2019) and during lockdown (2020) at four selected sites

SITE         YEAR   LCeq     LAeq     LAF5       LAF10 LAF50 LAF90 LAF95 LAF10-                  LAFmax        LAFmin        LAE       SDEV
                                                                         LAF90
CAR          2019   71.9     71.8     70.9       67.2 56.2 51.0 50.1      16.2                      93.8          47.2       97.4      7.1
             2020   42.8     41.3     47.8       44.7 34.2 31.2 30.7      13.5                      59.8          29.0       66.9      5.4
PLT          2019   63.9     57.5     61.8       59.1 53.6 50.9 50.5       8.2                      76.6          49.3       83.0      3.8
             2020   52.8     44.3     46.6       45.8 43.4 42.5 42.4       3.2                      54.3          41.9       69.8      1.5
 BIB         2019   66.6     61.5     64.0       62.9 60.3 57.8 57.2       5.1                      84.9          55.4       87.1      2.3
             2020   48.4     39.0     43.3       41.4 37.0 34.0 33.4       7.4                      54.7          31.2       64.6      3.1
SNC          2019   67.3     62.0     65.9       64.2 60.1 56.7 55.9       7.5                      78.2          52.0       87.6      3.1
             2020   50.0     42.2     47.4       45.7 39.5 35.5 34.7      10.2                      53.8          32.5       67.8      3.9

Table 4: Summary psychoacoustic metric data in Granada, before (2019) and during lockdown (2020) at four selected sites

       SITE           YEAR                N               N5                  S                T                R                    F
       CAR            2019              23.9             20.8                1.4             0.09              1.55                1.24
                      2020               3.7              3.8                2.9             0.06              1.60                0.97
       PLT            2019              12.5             14.4                1.3             0.14              1.50                1.04
                      2020               5.4              5.8                1.7             0.06              1.70                0.98
       BIB            2019              17.0             16.4                1.8             0.15              1.38                1.21
                      2020               3.2              3.9                1.2             0.13              1.26                0.70
       SNC            2019              16.0             18.2                1.4             0.14              1.30                1.48
                      2020               4.2              4.7                1.8             0.07              1.88                1.25

to ECMA-74 [32] (maximum of 5 tones, resolution of 2 Hz, a            3.2 Overall effect of lockdown measures on
threshold of 1 dB and no lower threshold of hearing correc-               broadband environmental noise
tions), Roughness is calculated according to [30] with 70
Hz modulation frequency and 59.5 sone Loudness thresh-                Noise reductions in terms of absolute 2019 vs 2020 mea-
old, and Fluctuation Strength with 4 Hz modulation fre-               surements give us differences around 20 dB(A) in three
quency and 116 sone Loudness threshold.                               sites and up to 30 dB(A) at Mirador de Carvajales (site no.
                                                                      1-CAR). This is an impressive noise level reduction that
                                                                      would hardly take place in any city even if the strictest
                                                                      noise control and abatement proposals would ever be
                                                                      applied. In relative terms, the observed noise reduction
                                                                      reaches 40% at site no. 1, over 30% at sites no. 3 (Plaza
                                                                      Bib-Rambla-BIB) and no. 4 (Mirador San Nicolás-SNC) and

Table 5: Absolute and relative changes in sound levels before (2019) and during lockdown (2020); (*) LCeq dB(C)

SITE     Observed change     LCeq de-     LAeq de-      LAF10 de-     LAFmax         LAF90 de-      LAFmin        LAF10-        LAE
         (2019 vs 2020)      crease       crease        crease        decrease       crease         decrease      LAF90         decrease
                                                                                                                  decrease
CAR      Absolute dB(A)*     29.1         30.5          22.5          34.1           19.8           18.2          2.7           30.5
         Relative (%)        40.5         42.5          33.4          36.3           38.8           38.6          16.5          31.3
PLT      Absolute dB(A)*     11.1         13.3          13.3          22.2           8.4            7.4           4.9           13.2
         Relative (%)        17.4         23.1          22.5          29.0           16.4           15.1          60.3          15.9
BIB      Absolute dB(A)*     18.2         22.5          21.5          30.1           23.8           24.2          − 2.3         22.5
         Relative (%)        27.3         36.6          34.2          35.5           41.2           43.7          −44.7         25.8
SNC      Absolute dB(A)*     17.3         19.8          18.5          24.4           21.2           19.5          −2.8          19.8
         Relative (%)        25.7         31.9          28.8          31.2           37.3           37.5          −35.3         22.6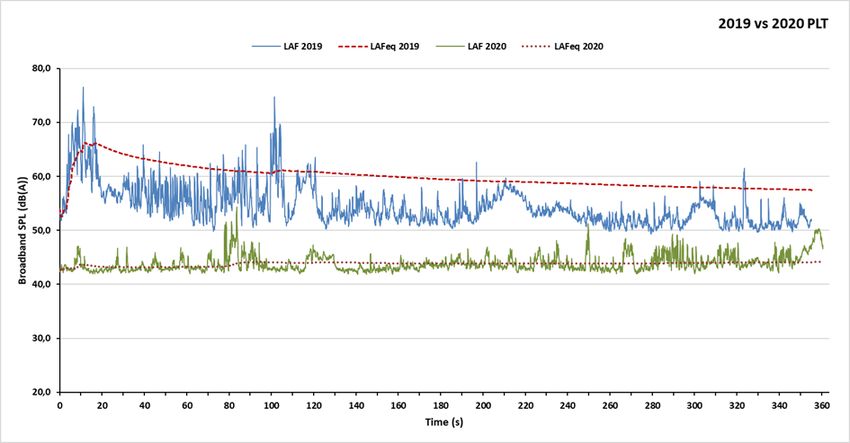
22 | J. Vida Manzano et al.

over 20% at site no. 2 (Paseo de Los Tristes-PLT) which, all
together, describe a unique sound environment absolutely
dominated by natural and animal sounds. To further in-
vestigate and understand these changes, absolute and rel-
ative differences have been computed, as shown in Table 5.
     If we look at background noise as characterised by
LAF90 together with the minimum noise level index,
LAFmin, we observe an important decrease in sites no. 1
(CAR), no. 3 (BIB) and no. 4 (SNC) with similar absolute re-
ductions in terms of LAF90 and LAFmin values and lower
values in site no. 2 (PLT). As the nearby river in PLT is the
main ambient difference, we may conclude water flowing
explain these figures. Nevertheless, background noise ex-
perienced a very important reduction as shown in Figure 3
(a), in which we can see that human absence causes it to
decrease by more than 40% in site no. 3 (BIB), where peo-
ple moving around reach higher figures than in the rest of
the places, where citizens and visitors mostly stand and
gaze at views.
     Greater changes are observed comparing higher noise
levels before and during the lockdown, as shown in Fig-
ure 3. Maximum levels (LAFmax) experience more than               Figure 3: Environmental background and minimum noise indices
30% reduction in each site, being especially significant the      (LAF90, LAFmin) (top) and environmental high and maximum noise
shortening in the difference with LAF10 values during the         indices (LAF10, LAFmax) comparison before (2019) and during lock-
                                                                  down period (2020) (bottom)
lockdown. As high noise values are normally connected
to human activity and machinery, lockdown measures not
only have given more relevance to background noise but            reduce but rather increases (negative numbers in Table 5),
have also diminished maximum sound pressure levels to             indicating a widening of the acoustic range for environ-
almost 40% in sites no. 1 (CAR) and no. 4 (SNC) and over          mental sounds in these places, where natural and animal
40% in site no. 3 (BIB), where humans moving around is            (mostly birds) sounds became evident in an extremely di-
a dominant characteristic of the site. Again, high levels re-     minished background noise after lockdown. This is also
duction is not so big at site no. 2 (PLT), because of the river   observed in the standard deviation of the data, which in-
and limited road traffic to attend the residents’ needs.          creases in these two sites after lockdown.
     In environmental noise analysis, the difference                   Finally, sound exposure level LAE relative to one sec-
(LAF10-LAF90) is normally used as an aid to identify              ond (as usual in environmental studies) shows greater re-
low noise situations characterised by high equivalent             duction at site no. 1 (CAR) during the lockdown, closely fol-
levels because of occasional high noise episodes occa-            lowed by site no. 3 (BIB) and 4 (SNC) and finally site no. 2
sionally taking place. Site no. 1 (CAR) presents an impres-       (PLT). These results are in accordance with the informa-
sive 16.2 dB(A) (LAF10-LAF90) difference in 2019, which           tion coming from the rest of the noise indices, confirming
best describes people around shouting and singing from            that sites no. 1 (CAR) in Albaicín and no. 3 (BIB) in the town
time to time in an otherwise very quiet place. During the         centre have benefited the most from lockdown measures,
lockdown, this difference goes down but still remains at          closely followed by normally crowded Mirador San Nicolás
13.5 dB(A) resulting in a 16.6 % difference (see Table 5).        (site no. 4 – SNC) and site no. 2 (PLT) at the end of this com-
Site no. 2 (PLT) presents a 60.3% change as the differ-           parison because of river proximity.
ence (LAF10-LAF90) drops from 8.2 dB(A) to 3.2 dB(A)                   In order to provide further insights about the differ-
indicating a limited variety of sound sources at that site        ences observed between 2019 and 2020, a more statisti-
in the absence of human presence. This is something               cal approach was attempted. A direct comparison of the
you can confirm by listening to the audios available at           sound levels time series at the four selected sites should be
https://soundcloud.com/anecoica-ugr                               interpreted with caution since we are dealing with asyn-
     Special attention must be given to sites no. 3 (BIB) and     chronous measurements. For this reason, a distributions
no. 4 (SNC) where the difference (LAF10-LAF90) does not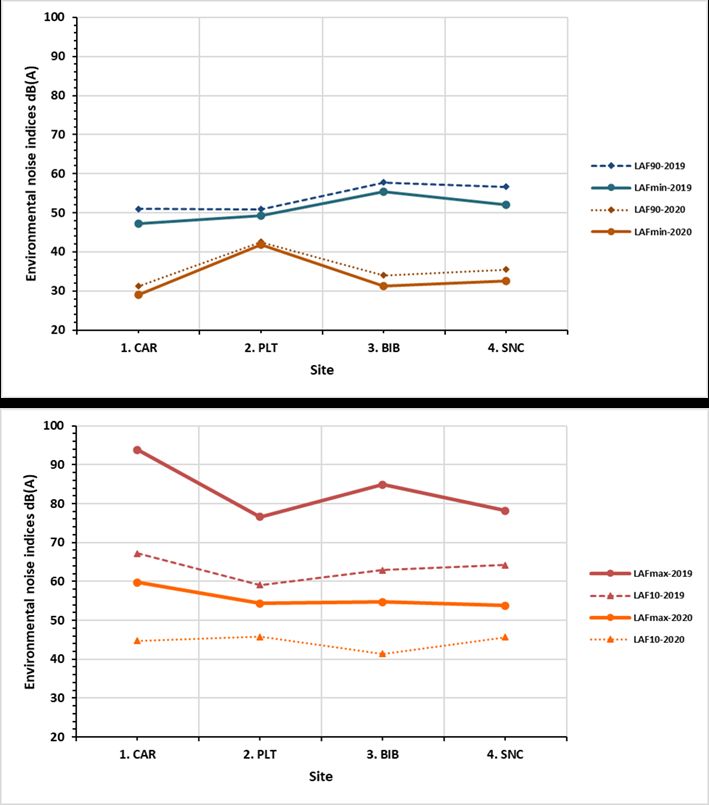
The “sound of silence” in Granada during the COVID-19 lockdown | 23

Figure 4: Cumulative distributions of LAF values for the four investigated sites, for the 2019 (red lines) and 2020 (green lines) measure-
ments campaigns; for each series, the left dashed line represents LAF90, while the right dashed line represents LAF10

                                                                           the LAF values for all the four sites were aggregated into a
                                                                           2019 and 2020 dataset. A Mann-Whitney U test was run to
                                                                           determine if there were differences in LAF values between
                                                                           the 2019 and 2020 measurements data. Distributions of the
                                                                           LAF values for 2019 and 2020 were not similar, as assessed
                                                                           by visual inspection: the shift towards lower LAF values
                                                                           between 2019 and 2020 can also be observed in Figure 5.
                                                                           LAF values for 2020 (mean rank = 719.4) were statistically
                                                                           significantly lower than for 2019 (mean rank = 2149.6), U =
                                                                           2779.5, z = −46.25, p < .001.

Figure 5: Aggregated (all four sites) LAF values distributions, split as
per the 2019 and 2020 measurements campaigns
                                                                           3.3 Overall spectral differences caused by
                                                                               lockdown measures on environmental
analysis was considered. Figure 4 shows the cumulative
                                                                               noise
distributions of LAF values for each site, for the 2019 and
2020 measurements campaigns. The “offset” of the distri-
                                                                           A-frequency weighting, dB(A), makes readings approxi-
butions is evident at all sites: the LAF10 values (i.e., nois-
                                                                           mate the human hearing response, giving more weight to
ier events) of the 2020 datasets are always lower than the
                                                                           higher frequencies, especially from 0.8 kHz to 8 KHz, to
LAF90 values (i.e., background noise) of the 2019 datasets,
                                                                           which the human ear is more sensitive. On the contrary,
signifying a considerable drop in general environmental
                                                                           C-frequency weighting, dB(C), acts almost equally on low
noise levels.
                                                                           and high frequencies, remaining essentially flat between
     To test statistically the overall difference between the
                                                                           31.5 Hz and 8 kHz weighting. So, the difference between
before- and during-lockdown measurement campaigns,
                                                                           A and C weighted measurements indicates the presence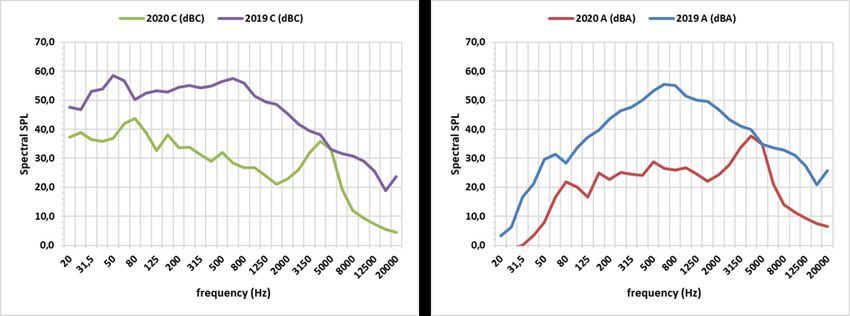
24 | J. Vida Manzano et al.

Figure 6: Overall C and A-weighted sound spectrum in 2019 vs 2020 at site no. 1 (CAR)

Figure 7: Overall C and A-weighted sound spectrum in 2019 vs 2020 at site no. 2 (PLT)

Figure 8: Overall C and A-weighted sound spectrum in 2019 vs 2020 at site no. 3 (BIB)
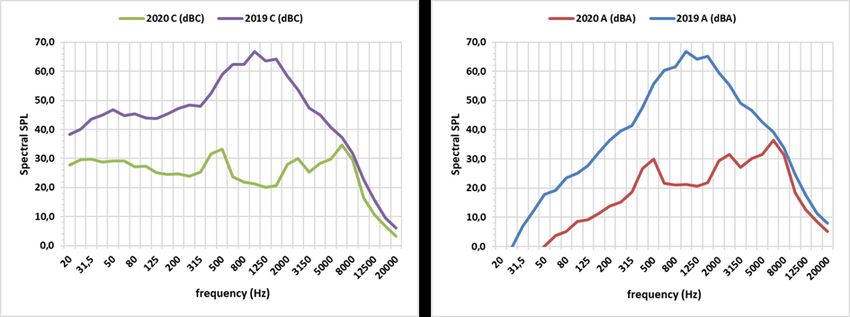
The “sound of silence” in Granada during the COVID-19 lockdown | 25

Figure 9: Overall C and A-weighted sound spectrum in 2019 vs 2020 at site no. 4 (SNC)

of low-frequency sound which is typically associated with             riod, this study aimed to characterise the physical magni-
building and industrial machine noise, such as air han-               tude of this reduction and to investigate the new spectral
dlers, or hum noise from small machines, like computers               composition of the urban soundscape. The acoustic envi-
or televisions, normally annoying but not necessarily de-             ronment is the result of combining all the sound sources
tected by human ear because of their low frequency [33].              within a given area, which includes human-caused sounds
So, having this in mind, we can see in Table 5 that greater           as well as natural or animal sounds. Low-frequency noise
relative LCeq vs LAeq differences around 10% take place               is common as background noise in urban environments
in Bib-Rambla (BIB) and similar differences around 6% in              as well as emission from artificial sources as stated be-
Tristes (PLT) and San Nicolás (SNC) miradors, while quiet             fore. But it also comes from natural air movement and tur-
little difference is appreciated in Carvajales (CAR).                 bulence and it is important and relevant in noise loud-
      If we look at the noise spectra in 2019 and 2020 at             ness judgement or noise annoyance estimation, greater for
each site (see: Figure 6, Figure 7, Figure 8, Figure 9), we           low-frequency for equal sound pressure level, or even pro-
find quite similar compositions and change in Carvajales              tection against simultaneous higher frequency noise on
(CAR), spectral peaks at 0.5 kHz, 2.5 kHz and 6 kHz dur-              hearing [34]. So, the decreased presence of low-frequency
ing the lockdown in 2020 and 1 kHz in 2019 and no low                 sound during the lockdown and, at the same time, se-
frequencies peaks distinguished over the rest either dur-             lected low frequencies standing out in these places sug-
ing the lockdown or before, both in dB(C) and dB(A). On               gest that background noise has not only dramatically gone
the contrary, significant dB(C) and dB(A) spectrum differ-            down but has also enhanced the audibility of specific local
ences are found at the rest of sites, where low-frequency             sounds in the environment.
peaks are clearly present both during the lockdown and                     Measured broadband and spectral noise levels data
before, at frequencies ranging from 31.5 Hz to 100 Hz. As             before and during COVID lockdown have highlighted im-
nearby heavy road traffic, mainly buses, or maintenance               portant urban acoustics changes in Granada that can be
and air conditioning machinery are more likely to be de-              solely attributed to human activity. Data analysis has also
tected in Bib-Rambla (BIB) than in Tristes (PLT) and San              evidenced the great magnitude these changes can achieve
Nicolás (SNC), the differences dB(C) vs dB(A) are greater at          and the notoriety of humans to substantially block natural
BIB.                                                                  or animal sound sources in the city.
                                                                           Local authorities, urban managers and planners nor-
                                                                      mally concentrate their work in controlling excess noise
                                                                      coming from industrial sources or road traffic rather than
4 Discussion                                                          from social activity. In doing so, preferential attention is
                                                                      given to existing problems and, if considering future sce-
The main effect of full-time (24h) citizens’ lockdown is, ob-
                                                                      narios for urban planning, modelling tools are used to esti-
viously, urban noise reduction. But beyond the evident re-
                                                                      mate environmental noise levels in which human activity
sult that sound levels go down during the whole day pe-
26 | J. Vida Manzano et al.
is never the main source, nor even one of the noise sources trial or machine noise such as CAR. Spectral changes dif-
considered in the model [35]. ferences are greater in the rest of study case sites, espe-
The exceptional urban conditions after COVID lock- cially those affected by some traffic noise (even though
down have made it possible to investigate the human im- in a limited way), where some standing frequencies also
pact on environmental noise and evaluate to what ex- appear and, consequently, discomfort and annoyance
tent human activity and, especially social activity, affects should also increase when accordingly evaluated.
the acoustic climate in the city. Besides the inherent in- Even though perception has not been assessed in this
terest linked to a new, anomalous and exceptional sit- study, some information may be extracted from psychoa-
uation characterization, results are also interesting for coustic metrics as shown in Table 4. Loudness reduction
soundscape evaluations as pointed out by Aletta et al. [25] in CAR and BIB is over 80% during the lockdown, whereas
including citizens’ perception assessment from environ- it reaches 74% in SNC or limited to 57% at PLT. On the
mental noise monitoring networks where auditions are contrary, sharpness increases at every site except at BIB
necessary to evaluate and distinguish among city sound (−34,5%). Distortion increases sharpness as it does loud-
sources [36]. While gathering information on the percep- ness, so why loudness and sharpness reduce at BIB but
tion of the acoustic environment during the lockdown it doesn’t at CAR, where only loudness reduces similarly
was impossible because of the “stay-home” mandates, the (around 80%), should be further investigated. In any case,
recordings performed on site by the authors may certainly it is highlighting the importance of the observed spectral
be used in future studies for laboratory experiments to get changes in soundscape evaluation. Finally, temporal pat-
information on the comparison between the 2019 and 2020 terns during COVID lockdown show fewer fluctuations and
conditions. sound noise levels concentrating around instantaneous
noise equivalent level except when local natural or animal
sounds take place.
4.1 Noise reduction quantification
Environmental noise reduction is found to be greater in 4.3 Effect of human activity on noise in the
sites where human activity was predominant, either be- context of Strategic Noise Mapping
cause people are normally around (CAR) or because they
(SNM)
are normally moving around (like BIB). The reduction is
not so significant in sites where natural or animal sounds
The main effect of lockdown in the city of Granada is the
are a normal characteristic of the place, such as PLT, in
almost total absence of motor vehicles circulating around.
which higher differences between extreme sound levels
Few buses and taxis attend citizens’ demands for mini-
lead to higher noticeability of such animal and/or natural
mum commuting resulting in a very low contribution of
sounds in the soundscape. In this respect, the sounds from
road traffic to environmental noise. As the Strategic Noise
River Darro acquire a special prominence in the sound-
Map (SNM) [37] and the Local Noise Action Plan (LORCA)
scape of this particular place.
[38] pointed out, road traffic is the main source of noise
Special attention should be given to places like BIB
in the city, so limited or totally restricted traffic around se-
and SNC, being both normally crowded places with very
lected places during lockdown is significantly reflected in
limited traffic noise, in which negative (LAF10-LAF90) dif-
results, as shown in Table 3.
ferences during lockdown indicates the broadening of en-
Environmental noise indices taken from 2016 SNM are
vironmental limits in these places leading to a new situ-
shown in Table 6 together with LAeq levels from selected
ation in which you can even get to notice some natural
6 minutes chunks used in this comparison. When attempt-
and animal sounds never so clearly noticed there before
ing to compare SNM noise levels with other sound pressure
or sounds coming from long distances in the city like bells
levels from shorter recordings, it should be taken into con-
sounds from churches far away from the site.
sideration that SNM levels are computed on a long-time
basis (yearly), average indices corresponding to day (Ld,
12h), evening (Le, 4h) and night (Ln, 8h) periods together
4.2 Changes in temporal and spectral with 24h indices (Lden). Long-time yearly averages are al-
patterns ways lower than short-time average levels and they should
only be considered as reference values for environmental
Spectral change differences before and during COVID lock- conditions.
down are less significant in places without traffic, indus-The “sound of silence” in Granada during the COVID-19 lockdown | 27
Table 6: Granada 2016 Strategic Noise Map yearly average noise indices values at selected sites together with LAeq from 2019 and 2020
short time measurements
Rate dB(A) Ld Le Ln Lden LAeq 2019 chunk LAeq 2020 chunk
CAR 47.3 46.6 42.1 50.2 71.8 41.3
PLT 56.0 55.5 50.3 58.7 57.5 44.3
BIB 56.7 52.3 50.0 58.2 61.5 39.0
SNC 53.3 52.9 47.8 56.2 62.0 42.2
Having this in mind and focusing on day time indices 4.4 Effect of human noise on the selected
(Ld) coincident with our recordings, we see that site no. sites’ urbanscape
3 (BIB) is the noisiest place of the four, as affected by
heavy road traffic noise driving through the centre of the 4.4.1 Carvajales viewpoint (CAR)
city. Next site no. 2 (PLT, with limited traffic for residents
and tourist buses for visitors followed by site no. 4 (SNC) This beautiful mirador in Albaicin includes a long sur-
slightly affected by light road traffic noise from adjacent face level fountain perpendicular to front line viewpoint.
streets and site no. 1 (CAR) being the least affected by This fountain had water running in 2019 before lockdown
road traffic. This scenario differs from our recordings be- as well as a lot of people around talking, singing or just
fore lockdown because of human noise in sites no. 1 (CAR), peacefully enjoying the site. Some dogs were also present
3 (BIB) and 4 (SNC) which is not considered by SNM. Dur- at the time the recordings took place. This was a normal
ing the lockdown period (2020), the new scenario locates situation at this viewpoint, where there is no traffic, and
site no. 3 (BIB) as the quietest place without human pres- walking is the only way to get over there.
ence and the other three in a much quieter situation as that The low-risk context of this place makes it perfect for
described by SNM. staying with children, altogether making it a quite vibrant
but still peaceful place as noise mainly comes from people
just present in that place. During the COVID-19 pandemic
the situation completely changed because of the absence
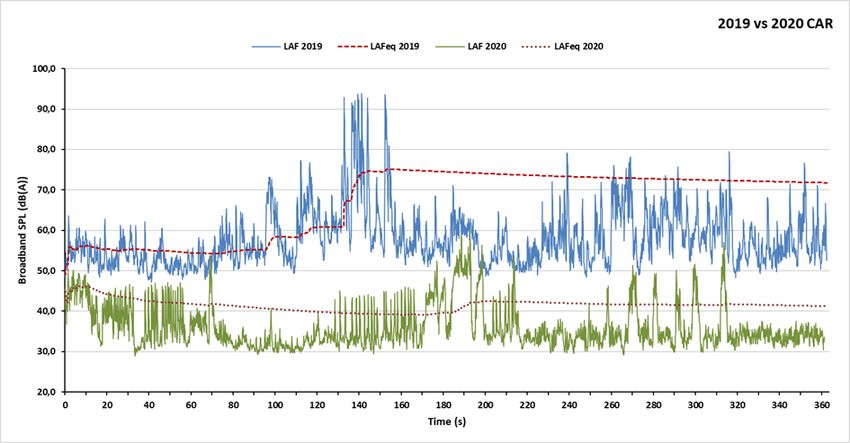
Figure 10: Broadband sound pressure levels in 2019 and during the lockdown in 2020 for the six minutes period recording together with the
equivalent noise level at site no. 1 (CAR)28 | J. Vida Manzano et al.
of human activity, giving place to a great decrease in noise This scenario is perfectly captured by the sound
levels as commented before. recording in 2019 as shown in Figure 11, which contrasts
If we look at the time series data during the six minutes with the lockdown scenario in which the total absence of
recording before lockdown and during the lockdown, the people and traffic gives an almost linear evolution only dis-
absence of human noise and the increase of natural con- turbed by water flowing (river) and limited birds in a not
tribution on soundscape can be easily observed in lowered so friendly environment under normal circumstances be-
maxima and a lower standard deviation of the data around cause of human activity. Water flowing is, in fact, a main
the average equivalent noise level in 2020 (Figure 10). The contributor to SPL around 45 dBA in 2020, revealing its im-
considerable drop in SPLs during the lockdown in 2020 ev- portance in this space. A police vehicle passing-by in near
idences natural non-anthropic sounds, mainly birds. It is distance (more than 50 m away) from the recording site, as
relevant that in this viewpoint, environmental levels are well as the sound of a digging machine working inside the
frequently below 40 dBA. It is a place protected by the ad- Alhambra gardens in far distance (more than 200 m away)
jacent buildings, making the sound of the wind passing were the only minor human environmental disturbances.
through the treetops become insignificant. The most rele- The murmur of water and birds were the protagonists in
vant anthropic sounds came from a nearby construction 2020, revealing the importance of non-anthropic sounds.
site, sporadically produced by building materials.
4.4.3 Bib-Rambla square (BIB)
4.4.2 Paseo de Los Tristes viewpoint (PLT)
Bib-Rambla square is one of the busiest and crowded
The “Paseo de Los Tristes” is a long street that used to be spaces in Granada, located in the centre of the city and
the only access to the ancient Arabic and Moorish quar- very near to Town Hall, bars, restaurants and shopping
ter of Albayzin (sometimes written Albaicín) Road traf- area. There is no road traffic around this square but heavy
fic is limited to taxis and tourist buses as well as resi- traffic with local buses, taxis and authorized vehicles drive
dent and authorized vehicles. A lot of people get there by through Reyes Católicos street, merely 100 metres from the
walking along the riverside (Darro river) and crowded bars centre of the square.
and restaurants just before the high step drive towards Al- During the 2019 recording period it was full of peo-
baicín. ple, the sun was shining in the sky and you could feel
Figure 11: Broadband sound pressure levels in 2019 and during the lockdown in 2020 for the six minutes period recording together with the
equivalent noise level at site no. 2 (PLT)The “sound of silence” in Granada during the COVID-19 lockdown | 29
Figure 12: Broadband sound pressure levels in 2019 and during the lockdown in 2020 for the six minutes period recording together with the
equivalent noise level at site no. 3 (BIB)
life around. Some pigeons were flying over tourists and During 2020, the total absence of people and few birds
citizens but were not the dominant sound source, mostly (mostly pigeons fed by people) made bells sound from the
characterised by a vibrant environment with children nearby cathedral and other churches the only soundmark
playing, visitors having something to drink in nearby bars in the area. Normally, the crowded square causes sound
or sitting in public seats distributed all over the square. levels to stay high most of the time, with a low standard
deviation around the mean value as shown in the 2019
Figure 13: Broadband sound pressure levels in 2019 and during the lockdown in 2020 for the six minutes period recording together with the
equivalent noise level at site no. 4 (SNC)30 | J. Vida Manzano et al.
figure. On the contrary, the absence of human presence a statistically significant way, with 2020 values be-
boosts natural, cultural and other city sounds from nearby ing considerably lower compared to 2019.
streets increasing the standard deviation as well as the am- • Variations in the spectral content of the 2019 and
plitude LF10 vs LF90 as commented before. Sound levels 2020 measurements are smaller at locations less af-
decreased considerably in this case too, as shown in Fig- fected by road traffic noise, while they are greater at
ure 12. sites where traffic was a dominant source in the pre-
lockdown scenario.
Sound recordings provide data that can be studied by
4.4.4 San Nicolás viewpoint (SNC)
other disciplines. Ornithologists, entomologists, sociolo-
gists, or psychologists are called to listen to the preva-
San Nicolás is one of the most famous viewpoints in the
lence of non-anthropic noise and draw conclusions in
city of Granada, located in Albaicín right in front of Alham-
their fields of knowledge. Further experiments with these
bra over the opposite hill. It is always full of people, citi-
recordings can provide information to plan, design, and
zens and visitors, peddlers mixed with guitar played by lo-
restore built environments, detecting the needs for ade-
cal residents, just admiring the view or having something
quate acoustic environments that suit the landscape, his-
to drink in nearby bars and restaurants. Even though one
tory and architecture of a city. Not only to support the
can only get there by walking, some authorized vehicles
well-being and health of the local population, but also to
drive through adjacent streets at low speeds. The ambient
enhance the visit of tourists meeting and exceeding their
soundscape could be very well defined as vibrant because
experiential expectations. Previous experiences show this
there is movement around and, normally, in comfort and
is possible [39], and a holistic approach is desirable [35].
peaceful acceptance of environmental noise. Altogether,
Some foundations on green areas have been explored [40]
you get quite high equivalent levels at mid-day and central
and citizens can be empowered to help research and im-
hours of the afternoon and evening as shown in Figure 13
prove on soundscapes [41].
During the lockdown, the total absence of human ac-
tivity and traffic around boosted birds, natural sounds and
Acknowledgement: The authors would like to thank the
cultural sounds like bells from churches all over Granada
Tourism Board of Granada City Council for the opportunity
or the Muslim call to prayer (Adhan) from a nearby mosque
and permission to record these sound stages. We would
at certain times. Our recordings during COVID-19 captured
also like to thank the Scientific Instrumentation Centre
birds and air movement and a light aeroplane flying in
of the University of Granada for helping us with this re-
the distance which did not contribute much to the overall
search. The authors from University College London re-
equivalent level.
ceived funding through the European Research Council
(ERC) Advanced Grant (no. 740696) on “Soundscape In-
dices” (SSID).
5 Conclusions
Conflict of Interests: The authors declare no conflict of in-
The forced lockdown due to the COVID-19 pandemic in terest regarding the publication of this paper.
the Spring of 2020 has brought sudden and unexpected
changes for the acoustic environments of cities. However,
this situation also became a unique opportunity to experi-
References
ence how silent urban soundscapes can be. The main re-
sults of this case study show that: [1] Gobierno de España, Real Decreto 463/2020, de 14 de marzo,
• In terms of recorded sound pressure levels, the por el que se declara el estado de alarma para la gestión de la
situación de crisis sanitaria ocasionada por el COVID-19. 2020.
lack of human activities between the 2019 (pre-
[2] Aletta F, Osborn D. The COVID-19 global challenge and its impli-
lockdown) and 2020 (during-lockdown) measure- cations for the Environment – what are we learning. UCL Open
ments campaigns at four typical touristic destina- Environ. 2020;1(1):5.
tions in Granada accounted for reductions ranging [3] Acoucité. Lockdown during COVID-19 pandemic:Impact on
between 13.3 and 30.5 dB(A). Sound Environment (Summary Report, version 11th June 2020).
Acoucité; 2020.
• Considering the LAF datasets aggregated from the
[4] Bruitparif, Les effets du confinement sur le bruit en ile-de-
four sites in Granada, the LAF values distributions France. 2020.
of the 2019 and 2020 measurements are different inThe “sound of silence” in Granada during the COVID-19 lockdown | 31
[5] Aletta F, Brinchi S, Carrese S, Gemma A, Guattari C, Mannini L, [24] Maffei L, DiGabriele M, Masullo M, Aletta F. On the perception
et al. Analysing urban trafic volumes and mapping noise emis- of Limited Trafic Zones as urban noise mitigation action. Noise
sions in Rome (Italy) in the context of containment measures for Mapp. 2014;1(1):50–8.
the COVID-19 disease. Noise Mapp. 2020;7. [25] Aletta F, Oberman T, Mitchell A, Tong H, Kang J. Assessing the
[6] Ajuntament de Barcelona, Informe COVID-19 d’alteració dels changing urban sound environment during the COVID-19 lock-
nivells sonors, 15 April 2020. down period using short-term acoustic measurements. Noise
[7] Cohen E. A Phenomenology of Tourist Experiences. Sociology. Mapp. 2020;7(1):123–34.
1979;13(2):179–201. [26] ISO, ISO 1996-1:2016 Acoustics. Description, measurement and
[8] Kirillova K, Fu X, Lehto X, Cai L. What makes a destination beau- assessment of environmental noise. Basic quantities and as-
tiful? Dimensions of tourist aesthetic judgment. Tour Manage. sessment procedures. 2016.
2014;42:282–93. [27] ISO, ISO 1996-2:2017 Acoustics – Description, measurement
[9] Zhang D, Zhang M, Liu D, Kang J. Soundscape evaluation in Han and assessment of environmental noise – Part 2: Determination
Chinese Buddhist temples. Appl Acoust. 2016;111:188–97. of sound pressure levels. 2017.
[10] Aletta F, Kang J. Historical Acoustics: Relationships between [28] HBK, Brüel & Kjaer BK Connect, n.d.
People and Sound over Time. Acoustics (Basel). 2020;2(1):128– [29] ISO, ISO 12913: 2019 Acoustics — Soundscape — Part 3: Data
30. analysis. 2019.
[11] Jordan P. Historic Approaches to Sonic Encounter at the Berlin [30] ISO, ISO 532-1 Acoustics — Methods for calculating loudness.
Wall Memorial. Acoustics (Basel). 2019;1(3):517–37. 2017.
[12] UNESCO. Convention for the Safeguarding of the Intangible Cul- [31] DIN, DIN 45692 Measurement technique for the simulation of
tural Heritage, Secr. United Nations; 2003. the auditory sensation of sharpness. 2009.
[13] Berardi U, Iannace G, Ianniello C. Acoustic intervention in a cul- [32] ECMA. ECMA-74 Measurement of airborne noise emitted by
tural heritage: The chapel of the Royal Palace in Caserta, Italy. information technology and telecommunications equipment,
Buildings. 2015;6(1):1–14. ECMA Int. Stand. 2019.
[14] UNESCO. General Assembly Resolution 39C/59 – The Impor- [33] Ziaran S. The assessment and evaluation of low-frequency
tance of Sound in Today’s World: Promoting Best Practices, noise near the region of infrasound. Noise Health. 2014 Jan-
Secr. Paris: United Nations. 2017. Feb;16(68):10–7.
[15] Schwarz O. What should nature sound like? Techniques of en- [34] Berglund B, Hassmén P, Job RF. Sources and effects of low-
gagement with nature sites and sonic preferences of Israeli vis- frequency noise. J Acoust Soc Am. 1996 May;99(5):2985–3002.
itors. Ann Tour Res. 2013;42:382–401. [35] Alves S, Estevez-Mauriz L, Aletta F, Echevarria-Sanchez GM,
[16] Krause B, Gage SH, Joo W. Measuring and interpreting the tem- Romero VP. Towards the integration of urban sound planning in
poral variability in the soundscape at four places in Sequoia Na- urban development processes: the study of four test sites within
tional Park. Landsc Ecol. 2011;26(9):1247–56. the SONORUS project. Noise Mapp. 2015;2:57–85.
[17] Lynch E, Joyce D, Fristrup K. An assessment of noise audi- [36] Alsina-Pagès RM, Freixes M, Orga F, Foraster M, Labairu-Trenchs
bility and sound levels in U.S. National Parks. Landsc Ecol. A. Perceptual evaluation of the citizen’s acoustic environment
2011;26(9):26. from classic noise monitoring. Cities Health. 2020;00:1–5.
[18] Miller NP. US National Parks and management of park sound- [37] Vida Manzano J, Puga JL, León-Martín LM. Nuevo Mapa Es-
scapes: A review. Appl Acoust. 2008;69(2):77–92. tratégico de Ruido de la Ciudad de Granada. 2016. http://sicaw
[19] Votsi NP, Mazaris AD, Kallimanis AS, Pantis JD. Natural quiet: an eb.cedex.es/docs/mapas/fase3/aglomeracion/GRANADA/ME
additional feature reflecting green tourism development in con- MORIA_Granada_3F.pdf
servation areas of Greece. Tour Manag Perspect. 2014;11:10–7. [38] Vida Manzano J, Puga JL, León-Martín LM. LORCA, Limitación,
[20] Zhou Z, Kang J, Jin H. Factors that influence soundscapes in his- cOntrol y Reducción de la Contaminación Acústica en Granada.
torical areas. Noise Control Eng J. 2014;62(2):60–8. 2013. http://sicaweb.cedex.es/docs/planes/Fase2/Aglomerci
[21] Aletta F, Brambilla G, Maffei L, Masullo M. Urban soundscapes: ones/PAR_Granada.pdf
characterization of a pedestrian tourist route in Sorrento (Italy). [39] Schulte-Fortkamp B, Jordan P. When soundscape meets archi-
Urban Sci. 2017;1(1):4. tecture. Noise Mapp. 2016;3(1):216–31.
[22] Liu A, Liu F, Deng Z, Chen W. Relationship between soundscape [40] Brambilla G, Gallo V. QUIETE: A scheme for a new index of the en-
and historical-cultural elements of Historical Areas in Beijing: vironmental quality of green areas. Noise Mapp. 2016;3(1):49–
a case study of Qianmen Avenue. Proc. Internoise. Conf. Mel- 58.
bourne, 2014. [41] Aspuru I, García I, Herranz K, Santander A. CITI-SENSE: methods
[23] Romero VP, Brambilla G, Di Gabriele M, Gallo V, Maffei L. The in- and tools for empowering citizens to observe acoustic comfort
fluence of the soundscape on the tourists’ environmental qual- in outdoor public spaces. Noise Mapp. 2016;3(1):37–48.
ity perception. Proc. Euronoise Conf.Maastricht, 2015.You can also read