Chrom-Lasso: a lasso regression-based model to detect functional interactions using Hi-C data - Oxford Academic Journals
←
→
Page content transcription
If your browser does not render page correctly, please read the page content below
Briefings in Bioinformatics, 00(00), 2021, 1–13

                                                                               doi: 10.1093/bib/bbab181
                                                                               Problem Solving Protocol

Chrom-Lasso: a lasso regression-based model to

                                                                                                                                                            Downloaded from https://academic.oup.com/bib/advance-article/doi/10.1093/bib/bbab181/6278150 by guest on 09 September 2021
detect functional interactions using Hi-C data
Jingzhe Lu, Xu Wang, Keyong Sun and Xun Lan
Corresponding author. Xun Lan, School of Medicine, Tsinghua University, Beijing, 100084, China. Tel.: +0086-10-62770517; Fax: +0086-10-62791875;
E-mail: xlan@tsinghua.edu.cn

Abstract
Hi-C is a genome-wide assay based on Chromosome Conformation Capture and high-throughput sequencing to decipher 3D
chromatin organization in the nucleus. However, computational methods to detect functional interactions utilizing Hi-C
data face challenges including the correction for various sources of biases and the identification of functional interactions
with low counts of interacting fragments. We present Chrom-Lasso, a lasso linear regression model that removes complex
biases assumption-free and identifies functional interacting loci with increased power by combining information of local
reads distribution surrounding the area of interest. We showed that interacting regions identified by Chrom-Lasso are more
enriched for 5C validated interactions and functional GWAS hits than that of GOTHiC and Fit-Hi-C. To further demonstrate
the ability of Chrom-Lasso to detect interactions of functional importance, we performed time-series Hi-C and RNA-seq
during T cell activation and exhaustion. We showed that the dynamic changes in gene expression and chromatin
interactions identified by Chrom-Lasso were largely concordant with each other. Finally, we experimentally confirmed
Chrom-Lasso’s finding that Erbb3 was co-regulated with distinct neighboring genes at different states during T cell
activation. Our results highlight Chrom-Lasso’s utility in detecting weak functional interaction between cis-regulatory
elements, such as promoters and enhancers.
Key words: 3D genomics; Hi-C data analysis; lasso regression; functional chromatin interactions

                                                                               layer of complexity to the already complex process of transcrip-
Introduction                                                                   tional regulation.
Chromatin interactions are spatial structures that can bring                      Chromosome Conformation Capture (3C), which involves
distal regulatory elements to spatial proximity to each other or               cross-linking and fragmentation of chromatin followed by PCR
gene promoters and thereby affect gene transcription [1]. The                  amplification, has revolutionized the investigation of chromatin
formation of interactions is precisely regulated and is essential              interactions [4]. Hi-C integrates 3C and high-throughput
for the normal cellular process [2]. Previous studies demon-                   sequencing to enable unbiased profiling of the genome-wide
strated that transcription factors (TFs), such as estrogen recep-              spatial proximity [5]. Sequencing data generated by the Hi-C
tors, can induce promoter–enhancer interactions upon binding                   experiment are composed of hybrid fragments, the two ends of
to enhancers distal to the downstream genes and subsequently                   which are mapped to two distant genomic locations. A hybrid
activate the expression of these genes [3]. Interactions add a new             fragment is indicative of spatial proximity of the two locations

Jingzhe Lu is a PhD candidate student at the School of Medicine, Tsinghua University, Beijing, China. Her expertise is in bioinformatics.
Xu Wang is a PhD candidate student at the School of Medicine and the Tsinghua-Peking Center for Life science, Tsinghua University, Beijing, China. Her
expertise is in tumor immunology.
Keyong Sun is a PhD candidate student at the School of Medicine and the Tsinghua-Peking Center for Life science, Tsinghua University, Beijing, China. His
expertise is in techniques of single-cell sequencing and tumor immunology.
Xun Lan is an assistant professor at the School of Medicine and the Tsinghua-Peking Center for Life science, Tsinghua University, Beijing, China. His
expertise is in bioinformatics and tumor immunology.
Submitted: 18 January 2021; Received (in revised form): 13 May 2021
© The Author(s) 2021. Published by Oxford University Press.
This is an Open Access article distributed under the terms of the Creative Commons Attribution Non-Commercial License (http://creativecommons.org/
licenses/by-nc/4.0/), which permits non-commercial re-use, distribution, and reproduction in any medium, provided the original work is properly cited.
For commercial re-use, please contact journals.permissions@oup.com

                                                                                                                                                   1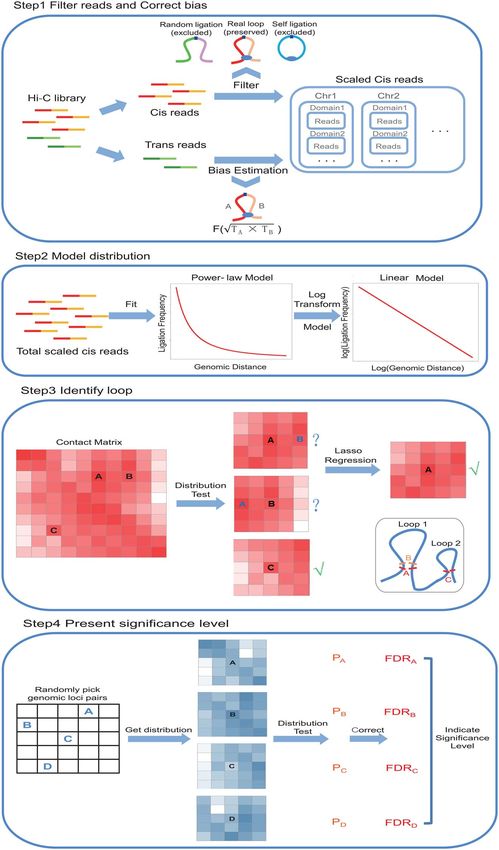
2     Lu et al.

the two ends mapped to and most existing statistical models to        methods (HiCCUPS [14], GOTHiC [7], HOMER [15], diffHic [16], HIP-
identify interactions using Hi-C data are to find a higher-than-      PIE [17] and Fit-Hi-C [6]) showed that the interactions identified
expected number of hybrid fragments linking a pair of genomic         by GOTHiC were the most reproducible and GOTHiC recovered
loci [6, 7].                                                          the largest number of true-positive interactions [10]. Although
    Many challenges remain in the statistic modeling of Hi-C          another popular Hi-C data analysis tool, FitHiC2 [18], added an
data. For example, (i) biases from different sources, including the   inter-chromosomal interaction calling function and a merging
efficiency of endonuclease digestion, the efficiency of ligation in   filter module compared to Fit-Hi-C, the core interaction call-
the Hi-C experiment and GC content biases in the subsequent           ing algorithm remains similar. We showed that Chrom-Lasso
high-throughput sequencing [8]. (ii) The signal-to-noise ratio        detected more 5C validated interactions compared to GOTHiC
of the sequencing data is not ideal. Hi-C requires hundreds of        and identified more interactions with potential biological signif-

                                                                                                                                           Downloaded from https://academic.oup.com/bib/advance-article/doi/10.1093/bib/bbab181/6278150 by guest on 09 September 2021
millions, in some cases billions of reads to reach saturation         icance than that of GOTHiC and Fit-Hi-C. Moreover, we applied
in identifying genome-wide interactions, and suffers from low         the method to study the dynamics of chromatin interactions
sensitivity when sequencing depth is insufficient [8]. (iii) Cur-     during the process of CD8+ T cell activation. The results showed
rently, the analysis of Hi-C data mostly focuses on the detection     that the changes in chromatin interactions detected by Chrom-
of structural interactions such as the interactions between the       Lasso were consistent with the changes in gene expression and
boundaries of topologically associated domains (TADs) because         with the state of the T cells. We experimentally validated the
these interactions are more stable across the entire cell popu-       interactions involved Erbb3, which shared co-regulation with
lation, therefore, easier to be detected using the Hi-C assay [9].    distinct neighboring genes via chromatin loops at the different
However, the fine-tuning of gene expression is usually mediated       stages of T cell activation, demonstrating the power of Chrom-
by regulatory elements, such as enhancers through their inter-        Lasso in detecting functional interactions associated with tran-
actions with gene promoters. Functional interactions between          scriptional regulation.
regulatory elements are generally less stable and only exist in
a small fraction of cells at a given snapshot [2]. Hybrid frag-
                                                                      Materials and methods
ments linking regulatory elements are therefore less likely to be
identified.                                                           The statistical framework of Chrom-Lasso
    Analysis of Hi-C genomic data requires computational meth-        See Supplementary File: The mathematical specification of the
ods that can distinguish fragments generated by spatial prox-         Chrom-Lasso algorithm.
imity ligations from random ligations and linear proximity liga-
tions, mitigate complex sources of biases and identify functional     The comparison between Chrom-Lasso and other
interactions with high statistical power. Though a handful of         software
methods exist to detect interactions based on a variety of math-
ematical models, the comparison among these methods demon-            To compare the results between GOTHiC/Fit-Hi-C and Chrom-
strated that each method has its advantages and disadvantages         Lasso, we downloaded the GOTHiC/Fit-Hi-C analysis results of 15
that may be suitable for distinct tasks [10].                         samples of the GM12878 Hi-C dataset ([19], Supplementary Table
    We present Chrom-Lasso, a lasso regression-based model            S1 available online at https://academic.oup.com/bib). We chose
to identify interactions from Hi-C data. Chrom-Lasso corrects         GM12878 dataset because it has the highest number of 5C iden-
the complex confounding factors at each locus using an                tified intra-chromosomal interactions (interactions occur within
assumption-free approach based on the number of inter-                the same chromosome), which we took as true-positives events.
chromosomal hybrid fragments (hybrid fragments occur                  The significant interactions identified by GOTHiC were selected
between different chromosomes) detected at that locus. Because        by FDR < 0.05 and read counts >10, the significant interactions
the vast majority of the inter-chromosomal hybrid fragments           identified by Fit-Hi-C were selected by FDR < 0.05 [10] and the
are formed by random ligations and any bias at a specific             significant interactions identified by Chrom-Lasso were selected
genomic locus can be reflected in the number of inter-                by FDR < 0.05 for further analysis. To focus on long-range inter-
chromosome hybrid fragments associated with that locus [11].          actions, we set 20 000 bp as the minimum genomic distance
Another important feature of Chrom-Lasso is that, instead of          between two interacting loci identified by both GOTHiC/Fit-Hi-C
testing the number of hybrid fragments in each genomic locus          and Chrom-Lasso.
independently, it models the distribution of hybrid fragments             Unlike GOTHiC or Fit-Hi-C, which divides the genome into
surrounding a pair of interacting loci as power-law distribution,     bins with fixed size and chromatin interactions are defined as
in which the expected hybrid fragment decreases as the distance       two bins with a significantly elevated number of hybrid frag-
between the location of the fragments and the focal loci              ments linking them, Chrom-Lasso outputs a pair of genomic
increases [12, 13]. Thus, it can utilize not only the fragments       positions (1 bp in length) as the most likely centers of the
within a specific region but also fragments nearby to increase        two interacting regions based on the distribution of the sur-
the statistical power of detecting interactions and avoid calling     rounding hybrid fragments. Because the downstream compar-
an artificial spike at a single locus as a signal. Chrom-Lasso        ison between Chrom-Lasso and GOTHiC/Fit-Hi-C relies heavily
also takes advantage of the linearity of log-transformed power-       on overlapping interaction loci with known functional elements
law distribution and converts the deconvolution of the complex        in the genome, for a fair comparison, we expanded the inter-
signals in Hi-C data to a conventional feature selection problem      acting loci identified by Chrom-Lasso to match the bin size of
in multiple linear regression, which is subsequently carried out      GOTHiC/Fit-Hi-C.
using lasso regression. Last but not least, Chrom-Lasso generates
                                                                      Overview of interactions detected by different methods
a background P-value distribution using millions of randomly
picked genomic loci to calculate false discovery rate (FDR).          We first compared the total number of significant intra-
    We assessed the performance of Chrom-Lasso by comparing           chromosomal interactions detected by the three methods in
its results with that of GOTHiC [7] and Fit-Hi-C [6]. A previous      different samples. The significant intra-chromosomal interac-
comprehensive evaluation across different Hi-C data analysis          tions identified by GOTHiC were selected using the following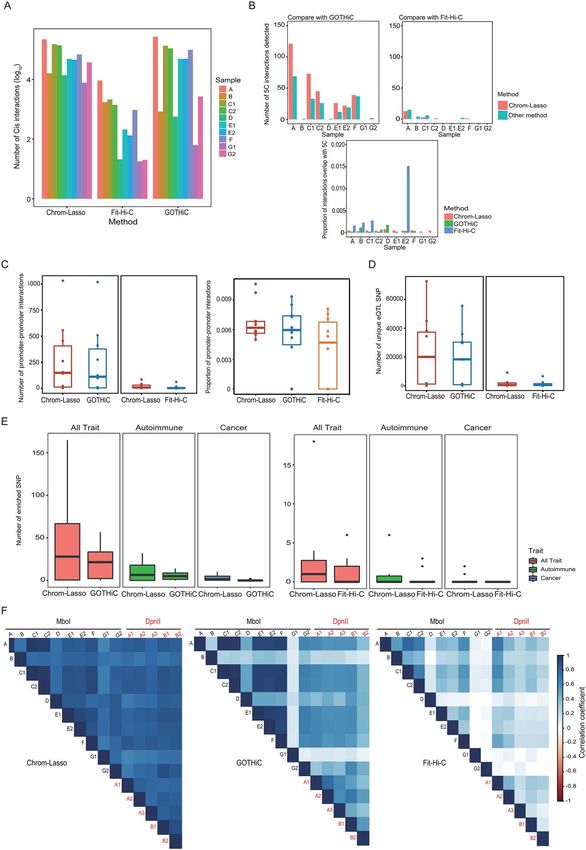
Chrom-Lasso: a Hi-C data analysis method          3

criteria, FDR < 0.05 and read counts >10. The significant                (MboI or DpnII) to assess the reproducibility of Chrom-Lasso
intra-chromosomal interactions identified by Fit-Hi-C and                between Hi-C samples treated with the same restriction
Chrom-Lasso were selected with FDR < 0.05 [10].                          endonuclease or different restriction endonucleases.

Overlapping with 5C cis interactions                                     The data analysis of in vitro mouse CD8+ T cell
We downloaded cis interactions (interactions occur within the            activation model
same chromosome) identified experimentally via 5C technology
                                                                         For analyzing Hi-C data, the preprocessing of raw sequencing
in GM12878 cells from a public database [20], and then we set
                                                                         data followed the preprocessing protocol of Juicer [14], a tool
a 2500 bp range for both directions of each interacting loci for
                                                                         developed to identify chromatin interactions using Hi-C data.

                                                                                                                                               Downloaded from https://academic.oup.com/bib/advance-article/doi/10.1093/bib/bbab181/6278150 by guest on 09 September 2021
Chrom-Lasso results to match the 5000 bp bin size used in
                                                                         And for further identifying interactions from Hi-C data, we used
GOTHiC/Fit-Hi-C. We considered a Hi-C interaction overlapping
                                                                         Chrom-Lasso, and all source code and test data were uploaded
with a 5C interaction if both of the interacting regions called
                                                                         to GitHub with a detailed tutorial (see Availability).
from Hi-C had an overlapping segment with interacting regions
                                                                            To process RNA-seq data, all sequencing data from each
identified using 5C. When comparing Chrom-Lasso with the
                                                                         sample were aligned to the ‘mm10’ reference genome using
other method, we first selected the same number of significant
                                                                         the HISAT2 aligner tool [28], and the transformation from raw
interactions detected by Chrom-Lasso as that detected by the
                                                                         reads to gene counts was done by HTSeq [29]. The differentially
method we are comparing it to under an FDR cutoff of 0.05. We
                                                                         expressed gene analysis was done via R package ‘DESeq2’ [30],
also calculated the proportions of interactions overlap with 5C
                                                                         and the gene set enrichment analysis (GSEA) [31] was done with
in all detected interactions by the three methods.
                                                                         R package ‘fgsea’ [32].

Overlapping with GWAS hits and eQTLs
                                                                         Overlapping with ChIP-seq peaks
We came up with three strategies to examine whether the
                                                                         To evaluate the overlap between interacting regions with TF and
interacting regions found by Hi-C data analysis methods were
                                                                         histone modification, we first downloaded the ChIP-seq peaks of
enriched with functional genomic loci discovered by large-scale
                                                                         different TF and histone modifications from the ENCODE project
population studies. (i) We tested which of the two methods iden-
                                                                         [33, 34]. We then defined a score to evaluate the enrichment of
tified more interacting regions overlapped with disease-related
                                                                         interacting loci overlapping with these ChIP-seq signals. For a
single-nucleotide polymorphisms (SNPs) [21]. We chose to test
                                                                         specific TF or histone modification, the numerator of the enrich-
SNPs associated with autoimmune disease, cancer and all kinds
                                                                         ment score was the length of the ChIP-seq regions overlapping
of diseases. For finding interacting regions related to disease-
                                                                         interacting regions divided by the total length of interacting
associated SNPs, we used GoShifter [22], a tool developed to find
                                                                         regions, and the denominator of enrichment score was the total
enriched SNPs for a given list of genomic loci. (ii) We sought
                                                                         length of all ChIP-seq regions divided by the length of the whole
to investigate if the chromatin interactions overlapped with
                                                                         genome. If the enrichment score for a TF or histone modification
eQTL SNPs, which we downloaded from the GTEx consortium
                                                                         in a sample was above 1, we inferred that this functional element
[23–25]. We chose eQTLs for the spleen because GM12878 is a
                                                                         was enriched in the interacting regions of this sample; other-
lymphocyte-derived cell line. For the spleen eQTL records, we
                                                                         wise, the functional element was deemed as depleted in the
counted the total number of unique eQTL SNP loci overlapping
                                                                         interacting regions. We used significant interactions (FDR < 0.05)
interacting regions detected by Chrom-Lasso or GOTHiC/Fit-Hi-C
                                                                         for this analysis.
in each sample. To focus our analysis on long-range functional
interactions, we removed interactions with a distance of less
                                                                         Analyzing changes in gene expression level
than 20 000 bp. (iii) We counted the number of interactions with
both interacting loci located in gene promoter regions. We used          The demonstration of RNA-seq analysis results was the com-
the first base of the first exon as the transcription start site (TSS)   bination of differentially expressed gene analysis and GSEA.
and the promoter regions are defined as upstream and down-               For each of the three transitions of cell states during the in
stream 1000 bp from the TSS of genes based on the genome ‘gtf’           vitro mouse CD8+ T cell activation, from naïve T cell (Tn) to
file from GENCODE [26], we then searched for interactions with           short-term activated effector T cell (Teff1), from short-term acti-
both loci associated with promoter regions. When comparing               vated effector T cell (Teff1) to long-term activated effector T
Chrom-Lasso with the other method, we first selected the same            cell (Teff2) and from long-term activated effector T cell (Teff2)
number of significant interactions detected by Chrom-Lasso as            to exhausted T cell (Tex), we did differentially expressed gene
that detected by the method we are comparing it to under an FDR          analysis and then ranked all genes according to their log2 fold
cutoff of 0.05. We also calculated the proportions of promoter–          change, followed by pre-ranked GSEA using the ranked gene list
promoter interactions in all detected interactions by the three          to calculate their enrichment on KEGG pathways [35] associated
methods.                                                                 with the immune system and cell cycle. We finally derived the
                                                                         normalized enrichment score (NES) from the GSEA results for
Assessing reproducibility                                                each transition then drew the heat map to show the change of
                                                                         gene expression level of related pathways during each transition.
We calculated the total number of interactions detected in
domains based on general human domain files for each
                                                                         Analyzing changes in chromatin interactions
replicate in the GM12878 dataset [27] and then calculated
the correlation between different samples to evaluate the                To study the changes in the strength of interactions during this
reproducibility of interaction calling in different methods. We          process, we proposed a strategy that we counted the total num-
analyzed the GM12878 dataset consisted of 15 samples ([19],              ber of interactions related to genes involved in pathways. We
Supplementary Table S1 available online at https://academic.ou           analyzed the same KEGG pathways as in RNA-seq data analysis.
p.com/bib) treated with different restriction endonucleases              We defined that interactions with one end anchored within a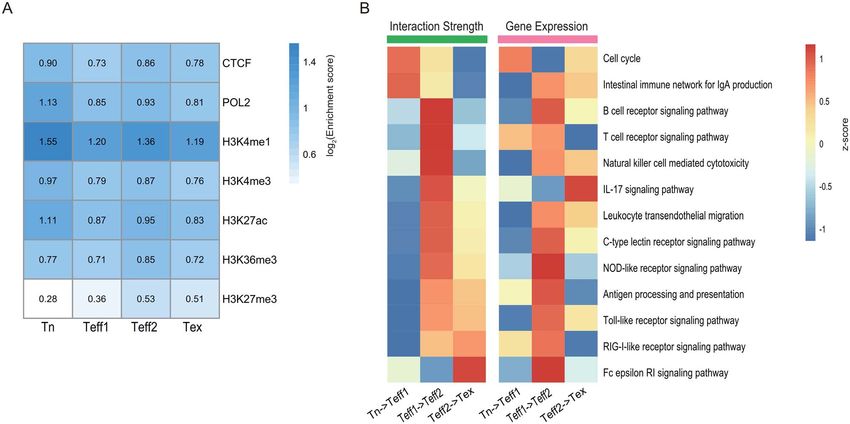
4     Lu et al.

5000 bp range centered by the TSS of a gene as interactions asso-     fluorescence-activated cell sorting were fixed with 1% formalde-
ciated with promoter regions, here we relaxed the criteria for        hyde at room temperature (RT) for 10 min. Formaldehyde was
defining promoters to find more promoter-linked interactions          quenched with glycine (a final concentration of 0.2 M) for 10 min
to better illustrate the strength of interactions of a pathway. For   at RT. Then, T cells were washed once with cold 1× PBS and
each Hi-C sample, we first counted the total number of signifi-       lysed in 150 μl lysis buffer (10 mM Tris-HCl pH 8.0, 10 mM NaCl,
cant interactions (FDR < 0.05) involved in each pathway gene set,     0.2% Igepal CA630 and proteinase inhibitor) on ice for 50 min.
which was the sum of significant interactions associated with         Pelleted nuclei were washed once with 250 μl of ice-cold Hi-C
all genes in this pathway. Then, we divided the total number          lysis buffer, and the supernatant was discarded carefully with
of significant interactions associated with this pathway by the       a pipette. Chromatin was solubilized in 25 μl 0.5% SDS and
total number of significant interactions detected in this sample      incubated at 62◦ C for 10 min. 72.5 μl of water and 12.5 μl of 10%

                                                                                                                                             Downloaded from https://academic.oup.com/bib/advance-article/doi/10.1093/bib/bbab181/6278150 by guest on 09 September 2021
to assess the strength of interaction for this pathway in this        Triton X-100 (Sigma, 93443) were added to quench the SDS at
sample.                                                               37◦ C for 20 min. Then, the chromatin was digested with 50 U
                                                                      MboI at 37◦ C overnight with rotation with a total volume of
Screening functional interactions for experimental validation         125 μl. MboI was then inactivated at 62◦ C for 20 min. To fill in
                                                                      the restriction fragment overhangs and mark the DNA ends with
The selection of interactions for validation was by the follow-       biotin, 0.75 μl 10 mM dCTP, 0.75 μl 10 mM dGTP, 0.75 μl 10 mM
ing strategy: we first counted the total number of interactions       dTTP, 18.75 μl 0.4 mM biotin-14-dATP and 20 U Klenow were
involved in the promoter region of the genes in the four samples,     added to the solution and the reaction was incubated at 37◦ C
and we preserved genes that were the intersection of genes            for 1.5 h with rotation. After adding 450 μl ligation mix (331.5 μl
in Tn, Teff1 and Teff2 as our highly interactive genes. After         water, 60 μl 10× NEB T4 DNA ligase buffer, 50 μl 10% Triton X-
intensive study of literature, we picked interactions with one end    100, 6 μl 10 mg/ml BSA and 2.5 μl 400 U/μl T4 DNA ligase), the
anchored near gene Erbb3, which plays an important role in the        fragments were ligated at RT for 4 h with rotation. This was
regulation of cell proliferation and differentiation [36].            followed by a reversal of crosslinking and DNA purification. DNA
                                                                      was sheared to 300–500 bp with Covaris M220. The biotin-labeled
                                                                      DNA was then pulled down with 75 μl Dynabeads M-280 Strep-
Mice
                                                                      tavidin (Thermo Fisher Scientific, 11205D). Sequencing library
C57BL/6 mice were purchased from Vital River Laboratories and         preparation was performed on beads, including end repair, dATP
maintained under specific pathogen-free conditions in the Ani-        tailing, adaptor ligation and PCR amplification. Twelve cycles of
mal Facility of Tsinghua University. All mice used in the experi-     PCR amplification were performed with Q5® High-Fidelity DNA
ments were 8-week-old female mice. All studies were approved          Polymerase (NEB, M0491S). Finally, size selection was done with
by the Animal Care and Use Committee of Tsinghua University.          AMPure XP beads and fragments ranging from 200 to 1000 bp
                                                                      were selected. All the libraries were sequenced on Illumina
                                                                      HiseqXten-PE150 (Novogene) according to the manufacturer’s
Isolation and in vitro activation of naïve CD8+ T cell
                                                                      instruction.
Naïve CD8+ T cells were isolated from single-cell suspensions of
splenocytes using EasySep™ Mouse Naïve CD8+ T Cell Isolation
Kit (STEMCELL technologies, 19858) according to the manufac-          RNA sequencing library preparation and sequencing
turer’s instructions. Freshly purified naïve CD8+ T cells were        RNA of T cells (0.2 million cells per sample) was extracted using
stimulated with anti-mouse CD3e (10 μg/ml) (BioLegend, 100314)        the Monarch Total RNA Miniprep Kit (NEB, T2010S). After qual-
and anti-mouse CD28 (10 μg/ml) (BioLegend, 102112). Overnight,        ity analysis, mRNA enrichment was carried out with NEBNext
recombinant mouse IL-2 (PeproTech, AF212-12-20) was added to          Poly(A) mRNA Magnetic Isolation Module kit (NEB, E7490L) and
the culture at 300 U/ml. T cells were used for further experiments    bulk RNA-seq libraries were constructed using NEBNext Ultra
after 2 or 5 days of in vitro activation.                             RNA Library Prep Kit for Illumina (NEB, E7530L). All experi-
                                                                      mental procedures followed the manufacturer’s specification.
                                                                      All libraries were sequenced on an Illumina Hiseq Xten-PE150
Cell sorting
                                                                      (Novogene) according to the manufacturer’s instruction.
Cells were sorted on a BD influx (BD Biosciences). Single-cell
suspensions of freshly purified naïve CD8+ T cells and activated
CD8+ T cells were incubated with PBS containing 1% FBS and            PCR analysis of the ligation products
then stained with the indicated antibodies for 30 min on ice.         Three or four primer pairs were designed to test if the ligation
Staining reagents included FITC anti-CD8 (53-6.7) (BD, 553031),       events occurred across five interacting regions in different states
eFluor 450 anti-CD44 (IM7) (eBioscience, 48-0441-82), APC anti-       of the T cell activation time-course. To improve the sensitivity
CD62L (MEL-14) (eBioscience, 47-0621-82), APC anti-PD-1 (J43)         and accuracy of detection, a nested PCR method was performed.
(BD, 562671) and PE anti-TIM-3 (5D12) (BD, 566346). Dead cells and    The first-round PCR was performed using 0.5 ng Hi-C library
cell aggregates were excluded from analyses by Fixable Viability      products; 1 of 100 of the first-round PCR product was then
Dyes eFluor™ 506 (eBioscience, 65-0866-18) and FSC-H/FSC-A            used in the second-round PCR amplification. For PCR reactions,
characteristics. Gating criteria were as follows: for Tn: CD8+ ,      each well was mixed with 25 μl NEBNext High-Fidelity 2X PCR
CD44− , CD62L+ ; for Teff1 and Teff2: CD8+ , PD-1+ , TIM-3− ; for     Master Mix (NEB, M0541L) and 5 μl of 10 μM corresponding paired
Tex: CD8+ , PD-1+ , TIM-3+ .                                          primers (Supplementary Tables S2 and S3 available online at
                                                                      https://academic.oup.com/bib). All amplification reactions were
                                                                      carried out using the following thermocycling program: 98◦ C for
Hi-C library generation and sequencing                                30 s, 25 cycles of (98◦ C for 10 s, 60◦ C for 30 s, 72◦ C for 1 min)
All the procedures are performed as in situ Hi-C protocol with        and a final 72◦ C for 5 min. All second-round PCR products were
minor modifications [19, 37]. Briefly, 0.2 million T cells from       resolved by electrophoresis on 1.5% agarose gels.
Chrom-Lasso: a Hi-C data analysis method 5
Results of hybrid fragments linking two nearby genomic loci (C, D)
linearly decreases as the log transformation of the summed
A lasso linear regression model to identify interactions
distance from C, D to the interacting loci B, E increases
from Hi-C data
(Supplementary File, 6 available online at https://academic.ou
Existing algorithms for identifying chromatin interactions usu- p.com/bib). Instead of testing if the number of hybrid fragments
ally divide the genome into bins with fixed length and build a linking to two genomic loci is higher than expected or not given
statistical model to find the pairs of bins having higher than a genome-wide or a local background distribution, Chrom-
expected numbers of hybrid fragments linking the two bins [6]. Lasso defines its null hypothesis as no linear relationship
Random distribution of background hybrid fragments is usually exists between the log-transformed number of hybrid fragments
modeled as negative binomial distribution, Poisson distribution linking two surrounding regions of the interacting loci and the
Downloaded from https://academic.oup.com/bib/advance-article/doi/10.1093/bib/bbab181/6278150 by guest on 09 September 2021
or a mixture of these distributions [7, 11, 38]. The vast majority log-transformed distance from the two loci to the interacting loci
of these models test individual bins independently using a local (Supplementary File, 7 available online at https://academic.ou
or a global background without considering the distribution of p.com/bib). Accordingly, the alternative hypothesis of Chrom-
the reads of their neighbors. The probability of two genomic Lasso is that there exists a linear relationship. The parameters
loci interacting with each other and joint by the ligase during of the linear model are estimated with lasso regression with the
a Hi-C experiment decreases as the genomic distance between ‘L1’ penalty using the R package ‘nnlasso’ [40].
the two loci increases, and it has been shown that the rela- We model the observed log counts of hybrid fragments as
tionship between the probability of interaction and the genomic the dependent variable and consider it as a mixture of hybrid
distance is best described as a power-law distribution [12, 13]. fragments generated from ligations of all pairs of potentially
A great property of the power-law distribution is that it can be interacting loci within a certain region. The testing regions are
transformed into a linear relationship by taking the logarithm of centered on one pair of potentially interacting loci and extended
both the independent and dependent variables. We took advan- by five restriction cutting sites in both directions. The expected
tage of the special relationship and model the distribution of distribution of hybrid fragments of two pairs of closely posi-
hybrid fragments surrounding the two interacting loci to explain tioned and potentially interacting loci can be highly correlated;
the ligation probability of the restriction endonuclease cutting thus, the parameters can be difficult to estimate if regular linear
sites (RECSs) at various distances to the two interacting loci regression is used. Lasso regression can help select the true
(Supplementary File, 3 available online at https://academic.oup. interacting centers among the closely positioned potentially
com/bib). interacting loci for the reason that it penalizes the sum of the
In theory, all hybrid fragments are formed by ligating two absolute value of the coefficients of all pairs of potentially inter-
distant RECSs during the Hi-C experiment. Thus, we mapped acting loci (Supplementary File, 8 available online at https://aca
each end of the hybrid fragments to its nearby cutting site and demic.oup.com/bib). As a result of its modeling strategy, Chrom-
discarded hybrid fragments with one end mapped to a genomic Lasso can achieve higher accuracy by utilizing information of the
locus that is 500 bp away from any consensus RECS. A previous surrounding regions of potentially interacting loci in contrast
study showed that genomic loci located in different TADs seldom with testing each pair of loci independently. Another advan-
interact with each other [27]. Therefore, to limit the number of tage of Chrom-Lasso is that the estimated coefficient for each
statistical tests, instead of testing the number of hybrid frag- pair of interacting loci can be interpreted as the proportion
ments linking every possible pairwise genomic locus across the of cells having the interaction at the snapshot of the experi-
genome against the expected number under the null hypothesis, ment. Finally, Chrom-Lasso calculates the FDR for the potential
we only considered pairwise locus within the same TADs and interacting loci based on the distribution of P-values generated
excluded testing the interactions between genomic loci located by fitting random pairs of genomic loci to the linear model
in different TADs. (Supplementary File, 9 available online at https://academic.oup.
The strategy Chrom-Lasso takes to identify interaction can be com/bib).
briefly described as follows (Figure 1). After filtering hybrid frag-
ments produced via self-ligation and random-ligation as intro-
Chrom-Lasso identified more functional interactions
duced in a previous study [39], Chrom-Lasso attempts to remove
than existing software
biases in the data in a single step utilizing the variation in
the number of inter-chromosomal hybrid fragments mapping to GOTHiC is a Hi-C data analysis method based on a binomial
different RECSs. Due to the low signal-to-noise ratio of the Hi-C probabilistic model that resolves different sources of biases and
experiment and the scarcity of inter-chromosomal interactions, identifies true interactions [7]. And it also applies the ratio
the vast majority of the inter-chromosomal hybrid fragments are of observed-over-expected counts to measure the strength of
formed by random ligations. Thus, the variation in the number of the interaction. This model takes no consideration of genomic
inter-chromosomal hybrid fragments linked to different RECSs distance and yields a well-controlled FDR. Fit-Hi-C computes
can reflect the biases in the Hi-C data generated at various steps confidence estimates for Hi-C data by capturing the relationship
of the experiment [11]. A normalization factor for each RECS is between genomic distance and ligation probability without any
calculated based on the number of inter-chromosomal hybrid parametric assumption [6]. Another newly developed method
fragments linked to that RECS. The normalization factors of the HiC-DC [41] calls a significant overlap of long-range contacts
two RECSs under test are then multiplied to calculate the ran- with Fit-Hi-C [18].
dom ligation probability between them (Supplementary File, 4 A previous study quantitatively compared the performance
available online at https://academic.oup.com/bib). of six algorithms to detect interactions using Hi-C data and
The log transformation of the probability density function showed that GOTHiC found the most cis interactions in
of the power-law distribution is a linear function. Therefore, the majority of the tested datasets. The same study also
if an interaction exists between two genomic loci (B, E) reported that GOTHiC called more reproducible interactions
(Supplementary File, 2, figure b available online at https://a and recovered the highest number of true-positive interactions
cademic.oup.com/bib), the log transformation of the counts [10]. Based on the results of significant intra-chromosomal6 Lu et al.
Downloaded from https://academic.oup.com/bib/advance-article/doi/10.1093/bib/bbab181/6278150 by guest on 09 September 2021
Figure 1. Schematic overview of Chrom-Lasso. The overall analysis strategy of Chrom-Lasso involves four steps. Step1 is to filter the random-ligation reads and self-
ligation reads from the Hi-C library and to take the trans (inter-chromosomal) reads as the reflection of biases resulting from the Hi-C experiment and high throughput
sequencing to estimate biases for further detecting functional interactions. Step2 focuses on modeling the distribution between ligation frequency and genomic
distance which fits linear distribution after log transformation. Step3 detects true chromatin interactions based on testing whether the potential interacting center
and its surrounding reads fit the distribution modeled in Step2, and when two or more potential interaction centers are detected within a user-defined neighborhood
region (e.g. interaction center A and B), it performs lasso regression to determine the iinteracting center(s) fit the model the best. Step4 is to calculate the FDR for
interactions according to a background P-value distribution inferred by randomly picking genomic loci pairs and testing their reads distribution.
interactions (FDR < 0.05) detected by different methods from interactions detected by different methods in the same
this study, we noticed that Chrom-Lasso called a compara- chromosomal region, showing that Chrom-Lasso detects inter-
ble number of interactions with GOTHiC and significantly actions anchored at RECS map without the bin size limitation
more than Fit-Hi-C (Figure 2A). We visualized the significant (Supplementary Figure S1 available online at https://academiChrom-Lasso: a Hi-C data analysis method 7
c.oup.com/bib). Considering GOTHiC and Fit-Hi-C’s overall Hi-C and Chrom-Lasso capture the dynamics of
performance compared to other existing methods, we decided functional interactions during the process of CD8+
to compare our method, Chrom-Lasso, to GOTHiC and Fit- T cell activation
Hi-C to assess its performance. The comparison was made
To further validate the ability of Chrom-Lasso to investigate bio-
using the publicly available data of in situ Hi-C assay in the
logical function related to chromosome organization, we applied
GM12878 cells ([19], Supplementary Table S1 available online at
Chrom-Lasso to study the dynamic changes of interactions dur-
https://academic.oup.com/bib). To make a fair comparison, we
ing the process of CD8+ T cell activation.
focused on long-range interactions with a distance between
Cytotoxic CD8+ T cells are the main effector cells of the
the two interacting loci above 20 kb and preserved significant
adaptive immune system responding to infections and diseases
interactions with the same total number (see Materials and
[46]. Activation of CD8+ T cells involves profound changes in the
Downloaded from https://academic.oup.com/bib/advance-article/doi/10.1093/bib/bbab181/6278150 by guest on 09 September 2021
methods).
gene regulatory networks [47]. Accumulate evidence has demon-
To compare the power to recall true-positive interactions
strated that spatial chromatin organization formed by interac-
between Chrom-Lasso and other methods, we used interactions
tions added a new perspective to the understanding function-
detected using 5C technology in the GM12878 cell line as true-
ality of transcriptional regulation [48]. Here, we sought to inves-
positive interactions [10, 19]. We demonstrated that Chrom-
tigate the dynamic changes of interactions and their impact on
Lasso identified more true-positive interactions than GOTHiC,
transcriptional regulation throughout CD8+ T cell activation by
which detected the largest number of true-positive interactions
generating Hi-C and RNA-seq data in cells at four different states
among the six widely used Hi-C interaction calling methods
during the process.
[10], in most samples. Chrom-Lasso also had more stable per-
The in vitro CD8+ T cell activation model started from naïve
formance of detecting 5C interactions among samples with dif-
CD8+ T cells separated from mouse spleen (day 0) to exhausted
ferent total sequenced reads than Fit-Hi-C (Figure 2B, detailed
CD8+ T cells marked by the expression of Tim-3 on day 5 after
methods see Materials and methods). We then tested the meth-
constant anti-CD3/CD28 and IL2 stimulation. We collected cells
ods’ performance in detecting promoter–promoter interactions.
for Hi-C experiments at four different states, including naïve T
Promoters are more likely to involve in long-range interactions
cells (Tn, day 0), the short-term activated effector T cells (Teff1,
than a set of random loci in the genome and promoter–promoter
day 2), the long-term activated effector T cells (Teff2, day 5)
interactions play important role in recruiting genes to shared
and exhausted T cells (Tex, day 5). We also performed RNA-
transcription factories [42], so the performance of detecting
seq in cells at these four states with three replicates for each
promoter–promoter interactions reflects the power of detect-
state (see Materials and methods). We preprocessed the raw Hi-C
ing potential functional interactions through different methods.
sequencing data following the Juicer preprocessing protocol [14],
Chrom-Lasso is more likely to detect promoter–promoter inter-
and then we identified interactions using Chrom-Lasso.
actions than other methods (Figure 2C, detailed methods see
To assess the performance of detecting interactions associ-
Materials and methods).
ated with cis-regulatory elements that involve transcriptional
To further evaluate the functional relevance of interactions,
regulation, we overlapped interacting loci of significant inter-
we overlapped the interacting loci with expression quantitative
actions (FDR < 0.05) identified by Chrom-Lasso with the mouse
trait loci (eQTL) SNPs [24] and disease-associated SNPs [21].
spleen ChIP-seq peaks of different TFs and histone modifica-
GWAS/eQTL SNPs are, on average, more likely to form functional
tions from ENCODE (see Materials and methods). We found
interactions than a set of random genomic loci. Functional
that the interacting loci identified at four different cell states
interactions that connect regulatory elements with genes
were enriched with binding sites of insulator protein such as
play important role in transcriptional regulation, and the
CTCF similar to previous reported [49], showing Chrom-Lasso’s
GWAS/eQTL SNPs located in the regulatory elements region
ability to find known structural interacting loci. Our results also
can influence gene expression through the interaction with
suggested that the interacting loci were enriched with histone
target genes [43–45]. Our results showed that interactions
markers related to active chromatin state, enhancers (H3K4me1
detected by Chrom-Lasso were more likely to overlap with
and H3K27ac) and promoters (H3K4me3), consistent with the
eQTL SNPs (Figure 2D, detailed methods see Materials and
expectation that functional interactions preferentially involve
methods). For disease-associated SNPs, we examined three
promoters and distal regulatory elements such as enhancers
sets of SNPs, all disease-associated SNPs, cancer-associated
(Figure 3A). However, the enrichment level of histone markers
SNPs and autoimmune disease-associated SNPs. Similar to
for transcribed regions (H3K36me3) and the Polycomb repression
the eQTL SNPs, we found that interacting regions detected
(H3K27me3) was weaker than that of the functional regulatory
by Chrom-Lasso were more enriched for disease-associated
elements (Figure 3A). Together, these results highlight the strong
SNPs (Figure 2E).
capability of Chrom-Lasso in identifying interactions associ-
To assess the reproducibility between replicates, we demon-
ated with functional elements that may impact transcriptional
strated that the numbers of interactions in TADs detected by
regulation.
Chrom-Lasso were more correlated among the replicates than
Next, we sought to study the dynamic changes of interactions
that detected by GOTHiC and Fit-Hi-C (Figure 2F). In addition,
during the process of CD8+ T cell activation and their impact
we showed that Chrom-Lasso produced more consistent contact
on the function of biological pathways. We defined interaction
maps and interactions between biological replicates treated with
strength for a certain pathway as the proportion of signifi-
two different restriction endonucleases than that of GOTHiC and
cant interactions (FDR < 0.05) involved with promoter regions
Fit-Hi-C (Figure 2F).
of all genes belong to that pathway in the total number of
Our results highlight the ability of Chrom-Lasso in detecting
detected significant interactions (see Materials and methods).
functional interactions. The increased statistical power is likely
We found that the interaction strength of the cell cycle path-
due to borrowed information from nearby regions, leading to the
way increased from the naïve state to the short-term activated
detection of a larger number of functionally relevant interactions
effector state (Figure 3B, left panel). However, the interaction
with high reproducibility.
strength for the immune response-related pathways, such as8 Lu et al.
Downloaded from https://academic.oup.com/bib/advance-article/doi/10.1093/bib/bbab181/6278150 by guest on 09 September 2021
Figure 2. Comparison between Chrom-Lasso and other software. (A) The total number of significant cis interactions (interactions occur within the same chromosome,
FDR < 0.05) detected by different methods. (B) Bar plots demonstrate the number of 5C interactions detected by the tested methods in indicated replicates when
comparing same number of top significant interactions (upper panels), and the proportion of interactions overlap with 5C in all interactions identified (the lower
panel). (C) Box plots show the number of promoter–promoter interactions found in the top significant interactions (left), and the proportion of promoter–promoter
interactions in all interactions identified (right). (D) Box plots show the number of unique eQTL SNPs involving interactions found by tested methods. (E) Box plots
compare the number of disease-associated SNPs involving interacting loci in different replicates. The comparison was done in three GWAS categories: SNPs associated
with all diseases (red), SNPs associated with autoimmune diseases (green) and SNPs associated with cancer (blue). (F) Correlation matrices show the correlation between
different replicates (treated with MboI or DpnII) based on the number of interactions detected in each TAD.
the T cell receptor signaling pathway, initially decreased from These findings remained consistent under different FDR cut-
the naïve state to the short-term activated effector state and offs (Supplementary Figure S2 available online at https://acade
then increased after long-term activation (Figure 3B, left panel). mic.oup.com/bib). These results suggest that cell proliferationChrom-Lasso: a Hi-C data analysis method 9
Downloaded from https://academic.oup.com/bib/advance-article/doi/10.1093/bib/bbab181/6278150 by guest on 09 September 2021
Figure 3. Widespread changes in gene expression and chromatin interactions during the process of CD8+ T cell activation. (A) Heat map represents the log2 enrichment
score of the indicated ChIP-seq targets in four samples. (B) Heat maps show the changes in gene expression and interaction strength in the cell cycle and immune-
related KEGG pathways during CD8+ T cell activation. The left panel shows the scaled log fold change of interaction strength measured the proportion of significant
2
interactions (FDR < 0.05) involved in the promoter region of genes in the indicated pathway, and the right panel shows the scaled log2 enrichment score of pre-ranked
GSEA of the same pathway.
dominated the initial stage of T cell activation, leading to a rapid population, and the second stage was the cytotoxic stage to
expansion of the T cell population, which performs the effector perform immune response. The consistency between the change
function in combating infections. of interaction strength and change of gene expression level in
To investigate the regulatory function of chromatin inter- cell cycle and immune system-related pathways suggests that
actions on gene expression, we examined the correlation of Chrom-Lasso performed well in identifying functional inter-
changes in the interaction strength and changes in gene expres- actions that regulate gene expression via three-dimensional
sion during T cell activation. The principal component analysis genome organization.
of all RNA-seq samples demonstrated that long-term activated
effector cells shared similar characteristics with exhausted cells
in gene expression profile (Supplementary Figure S3 available Chromatin interactions facilitated co-regulation
online at https://academic.oup.com/bib). Therefore, we mainly between Erbb3 and neighboring genes
focused our analysis on the process from the naïve state to the After confirming the capability of Chrom-Lasso to detect func-
long-term activated effector state. tional interactions genome-wide, we selected specific interac-
For each transition from one state to the subsequent state, tions that might play important role in regulating gene tran-
we ranked all genes according to their log2 fold change in scription during T cell activation to perform experimental val-
expression. Then, we used these pre-ranked genes to perform idation. Interactions with both ends overlapped genes are of
GSEA on cell cycle and immune system-related KEGG pathways particular interest because such interactions may mediate the
and finally derived the NES to represent the change of activity co-regulation of the genes at the two ends through 3D chromatin
of pathways during the activation process (see Materials and organization [1]. Therefore, we searched for genes involved in a
methods). The GSEA results demonstrated that the expression high number of interactions and sought to validate interactions
level of genes in the cell cycle pathway was upregulated from the between such genes and neighboring genes (see Materials and
naïve state to the short-term activated effector state, yet most of methods).
the immune response-related pathways were not significantly We noticed that gene Erbb3, which is known to play an
activated at this initial stage (Figure 3B, right panel). However, essential role in the regulation of cell proliferation and differ-
we discovered a significant upregulation of the expression level entiation [36], interacted with different neighboring genes in Tn,
of genes in most immune response-related pathways from the Teff1 and Teff2 cells. The interactions in the region centered on
short-term activated effector state to the long-term activated the Erbb3 locus undergone significant reorganization during
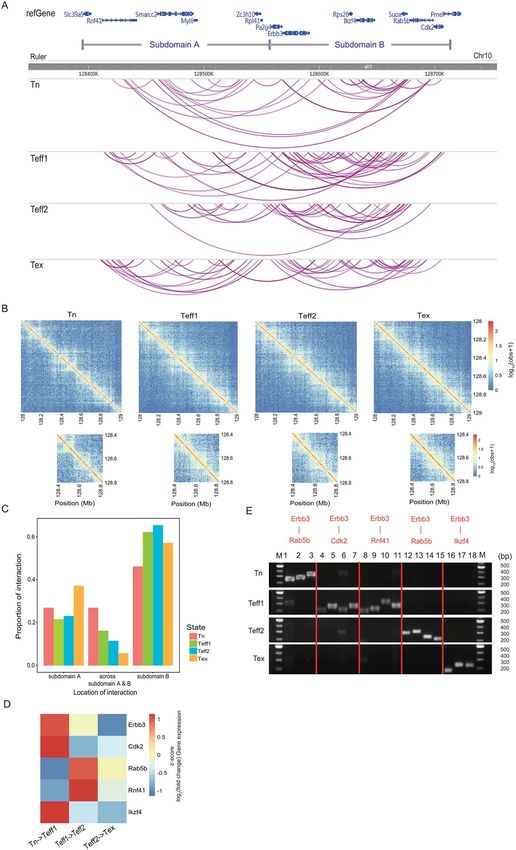
effector state (Figure 3B, right panel). T cell activation (Figure 4A). We found that the interactions
These results were in line with the dynamic changes in the nearby Erbb3 were sparsely distributed in Tn cells, and the
interaction strength. The change of gene expression level in cell interaction intensity of the region upstream of Erbb3 was
cycle and immune system-related pathways combined with the significantly increased in Teff1 and Teff2 cells (Figure 4A,
change of interaction strength implied that the in vitro activation Figure 4B). Moreover, a new domain boundary at the middle
of mouse CD8+ T cell was mainly composed of two stages, the of the region is increasingly apparent in Teff2 and Tex cells, as
first stage was the cell proliferation stage to enlarge the T cell shown in the decrease of the proportion of interactions with two10 Lu et al.
Downloaded from https://academic.oup.com/bib/advance-article/doi/10.1093/bib/bbab181/6278150 by guest on 09 September 2021
Figure 4. The PCR validation of Erbb3 involved interactions. (A) An overview of all interactions in the genomic region on chr10. The top panel shows the loci of genes
involved in this region. We also separate this region into two potential subdomains A and B based on the changes in the proportion of interactions across these two
subdomains, and the four panels below represent the distribution of all interactions detected in four samples in this region. Each purple line stands for an interaction.
(B) Contact matrices demonstrate the log10 hybrid-fragment counts from the four Hi-C libraries at chr10: 128 000 000–129 000 000 at 5 kb resolution. (C) The proportion
of interactions located in subdomain A, subdomain B and across these two subdomains in four samples. (D) Heat map depicts the scaled log2 fold change of averaged
gene expression level. (E) PCR validation results of selected interactions. For each interaction detected by Chrom-Lasso, we captured the hybrid fragments surrounding
the interacting loci from the Hi-C library and then designed primers based on the sequence of hybrid fragments for PCR. The result showed that the hybrid fragments
are only detected in the corresponding Hi-C library, not in other Hi-C libraries.
ends across subdomain A and subdomain B through four states Chrom-Lasso identified interactions showed that Erbb3 inter-
(Figure 4C), and this new boundary may be a major cause of the acted with Rab5b, an intracellular membrane trafficking-related
dissociation between Erbb3 and genes in subdomain A. The gene [50], at the naïve state. Erbb3 was then connected withChrom-Lasso: a Hi-C data analysis method 11
Cdk2, a cell cycle-related gene [51], and Rnf41, a gene involved sites can be used to correct the biases. Moreover, Chrom-
in cytokine receptor signaling [52], at the short-term activated Lasso borrows power from hybrid fragments surrounding the
effector state. Erbb3 was subsequently connected with Rab5b interacting loci via a lasso regression model. The application of
at the long-term activated effector state, and Ikzf4, a gene lasso regression improved accuracy and resolution in detecting
associated with an inhibitory function of T cells [53], at the true interacting centers by effectively removes correlated
exhausted state. The dynamic changes in interactions nearby interactions. Furthermore, Chrom-Lasso randomly picks pairs of
the Erbb3 locus were consistent with the notion that T cells genomic loci and tests if the log frequency of hybrid fragments
first went through the cell cycle and expanded in number then decreases linearly as the log genomic distance between the
turned on their cytotoxic function during the activation process. two ends of the hybrid fragments increases. The distribution
More importantly, we found that when two genes are inter- of P-values generated by such tests is used to estimate the
Downloaded from https://academic.oup.com/bib/advance-article/doi/10.1093/bib/bbab181/6278150 by guest on 09 September 2021
acting with each other, their expression levels tend to change FDR of the interactions. Last but not least, Chrom-Lasso
in the same direction when cells transit from one state to the provides a beta coefficient value for each pair of interacting
next, suggesting that the expression level of two interacting loci to represent the relative strength of interaction, which
genes may be co-regulated. For example, the interaction between implies the relative proportion of cells that has the interaction
Erbb3 and Cdk2 emerged in Teff1 cells; meanwhile, we found (Supplementary Figure S5 available online at https://academi
an upregulation of the expression level of both Erbb3 and Cdk2 c.oup.com/bib).
in Teff1 cells compared to Tn cells (Figure 4D). Similarly, the Chrom-Lasso detected significantly more interactions iden-
interaction between Erbb3 and Rab5b appeared in Teff2 cells tified by 5C experiments than GOTHiC, which was shown to
and the expression level of both genes increased compared to outperform five other existing methods in this measure [10],
that in Teff1 cells (Figure 4D). The interaction between Erbb3 and highlighting the efficiency and accuracy of Chrom-Lasso in iden-
Ikzf4 was detected in Tex cells and the expression level of both tifying true-positive functional interactions. We demonstrated
interacting genes was downregulated compared to that in Teff2 that interacting loci identified by Chrom-Lasso has a higher rate
cells (Figure 4D). The consistency between the emergence of of overlapping with eQTL SNPs, disease-associated SNPs and
interaction and the co-regulation of the connected genes further promoter–promoter co-regulations when compared to GOTHiC
demonstrated the ability of Chrom-Lasso to detect functional and Fit-Hi-C, which was reported to perform better in identifying
interactions. functional interactions. We also highlighted that Chrom-Lasso
Finally, we validated the gene–gene interactions identified reproduced very consistent significant interactions despite the
by Chrom-Lasso by confirming the enrichment of the hybrid biases caused by different experimental conditions. In conclu-
fragments linking the genes in the respective Hi-C libraries (see sion, we presented Chrom-Lasso as an approach for Hi-C data
Materials and methods). PCR results demonstrated that the analysis and demonstrated its efficacy in detecting long-range
captured hybrid fragments for each Erbb3 involved gene–gene functional interactions with high reproducibility.
interaction only existed in the corresponding Hi-C library that To further assess the performance of Chrom-Lasso in captur-
identified the interaction (Figure 4E, Supplementary Table S2 ing the dynamic changes in functional interactions, we used Hi-C
available online at https://academic.oup.com/bib), and we also to investigate the changes in interaction strength during CD8+
selected another two interactions with both interacting loci T cell activation. We discovered intense interaction involved
located in the gene promoter regions in each sample for PCR with genes in the cell cycle pathway in the early stage of CD8+
validation (Supplementary Figure S4, Supplementary Table S3 T cell activation and interaction strength of immune system-
available online at https://academic.oup.com/bib), highlighting related pathways such as T cell receptor signaling pathway
the high accuracy and specificity of Chrom-Lasso. enhanced in the subsequent stage. The changes in the inter-
action strength of these pathways were consistent with the
changes in gene expression we observed. Finally, we experi-
mentally validated the dynamic changes in the interactions
Discussion facilitating the co-regulation of Erbb3 and its neighboring genes
The analysis of Hi-C data remains challenging for the following at different stages of T cell activation. Interestingly, we observed
reasons. (i) Various biases exist in the Hi-C data, including exper- a dynamic domain boundary formation, which potentially disso-
imental biases such as the cutting efficiency at restriction sites, ciated the interaction between Erbb3 and its downstream genes
ligation efficiency between pairs of cutting sites and sequencing in long-term stimulated effector or exhausted T cells.
biases such as GC content and mappability of reads. (ii) The real The comparison between Chrom-Lasso and GOTHiC or Fit-
interactions captured by Hi-C include both functional interac- Hi-C and the application of Chrom-Lasso to analyze the in vitro
tions that bring regulatory elements into spatial proximity such time-course T cell activation data demonstrated the strong sta-
as interactions linking gene promoter with distant enhancer and tistical power of Chrom-Lasso in detecting weak functional inter-
structural interactions such as CTCF-related interactions which actions from a noisy background within TADs. Combined with
are involved in the boundaries of TADs. Higher statistical power tools that can accurately define boundary domains [54, 55], we
is required to detect functional interactions, because unlike expect our strategy to provide researchers with a powerful tool
structural interactions, functional interactions are transient and for a broader range of variants of the Hi-C assay, such as single-
unstable, perhaps only exist in a small portion of cells at a cell Hi-C, Capture Hi-C and BL-Hi-C [56–58], which also generate
given time. data following a power-law distribution.
Chrom-Lasso estimates the overall biases from inter-
chromosomal hybrid fragments because the vast majority
of the inter-chromosomal hybrid fragments are formed by
Availability
random ligations and the differences in the probability of Chrom-Lasso is an open-source Hi-C interaction calling tool
inter-chromosomal ligation at different cutting sites reflect the available in the GitHub repository (https://github.com/Lan-la
combined effect of various sources of biases. Therefore, the b/Chrom-Lasso). The computational time of Chrom-Lasso is
probability of inter-chromosomal ligation at different cutting mainly determined by the density of cutting sites of restrictionYou can also read