RELATIONSHIP OF SARS-COV-2-SPECIFIC CD4 RESPONSE TO COVID-19 SEVERITY AND IMPACT OF HIV-1 AND TUBERCULOSIS COINFECTION
←
→
Page content transcription
If your browser does not render page correctly, please read the page content below
The Journal of Clinical Investigation                                                                                                                                    RESEARCH ARTICLE

Relationship of SARS-CoV-2–specific CD4 response to
COVID-19 severity and impact of HIV-1 and tuberculosis
coinfection
Catherine Riou,1,2 Elsa du Bruyn,1,3 Cari Stek,1,3,4 Remy Daroowala,1,3,4 Rene T. Goliath,1 Fatima Abrahams,1 Qonita Said-Hartley,5
Brian W. Allwood,6 Nei-Yuan Hsiao,2,7 Katalin A. Wilkinson,1,3,8 Cecilia S. Lindestam Arlehamn,9 Alessandro Sette,9,10
Sean Wasserman,1,3 Robert J. Wilkinson,1,3,4,8 and on behalf of the HIATUS consortium11
Wellcome Centre for Infectious Disease Research in Africa and Institute of Infectious Disease and Molecular Medicine, 2Division of Medical Virology, Department of Pathology, and 3Department of Medicine,
1

University of Cape Town, Cape Town, South Africa. 4Department of Infectious Diseases, Imperial College London, London, United Kingdom. 5Department of Radiology, University of Cape Town, Cape Town, South
Africa. 6Division of Pulmonology, Department of Medicine, Stellenbosch University and Tygerberg Hospital, Cape Town, South Africa. 7National Health Laboratory Service, University of Cape Town and Groote
Schuur Hospital, Cape Town, South Africa. 8The Francis Crick Institute, London, United Kingdom. 9Center for Infectious Disease, La Jolla Institute for Immunology, La Jolla, California, USA. 10Department of
Medicine, School of Medicine, University of California San Diego, La Jolla, California, USA. 11Members of the HIATUS consortium are detailed in Supplemental Acknowledgments.

             T cells are involved in control of coronavirus disease 2019 (COVID-19), but limited knowledge is available on the relationship
             between antigen-specific T cell response and disease severity. Here, we used flow cytometry to assess the magnitude,
             function, and phenotype of SARS coronavirus 2–specific (SARS-CoV-2–specific) CD4+ T cells in 95 hospitalized COVID-19
             patients, 38 of them being HIV-1 and/or tuberculosis (TB) coinfected, and 38 non–COVID-19 patients. We showed that SARS-
             CoV-2–specific CD4+ T cell attributes, rather than magnitude, were associated with disease severity, with severe disease being
             characterized by poor polyfunctional potential, reduced proliferation capacity, and enhanced HLA-DR expression. Moreover,
             HIV-1 and TB coinfection skewed the SARS-CoV-2 T cell response. HIV-1–mediated CD4+ T cell depletion associated with
             suboptimal T cell and humoral immune responses to SARS-CoV-2, and a decrease in the polyfunctional capacity of SARS-
             CoV-2–specific CD4+ T cells was observed in COVID-19 patients with active TB. Our results also revealed that COVID-19 patients
             displayed reduced frequency of Mycobacterium tuberculosis–specific CD4+ T cells, with possible implications for TB disease
             progression. These results corroborate the important role of SARS-CoV-2–specific T cells in COVID-19 pathogenesis and
             support the concept of altered T cell functions in patients with severe disease.

Introduction                                                                                                 host immune system, including profound lymphopenia, skewed dis-
Coronavirus disease 2019 (COVID-19), caused by SARS coronavirus                                              tribution and activation of T cell subpopulations, disruption of the B
2 (SARS-CoV-2), emerged in December 2019 and is the cause of a                                               cell compartment, and elevated plasma concentrations of proinflam-
devastating pandemic resulting in more than 100 million infections                                           matory cytokines (3–7). A growing body of evidence suggests that
and over 2 million deaths within the last year. COVID-19 shows an                                            SARS-CoV-2–specific T cell response plays a key role in modulating
extremely variable clinical course, ranging from an asymptomatic                                             COVID-19 pathogenesis (8–13). Although the precise nature of T cell
state or mild respiratory symptoms to severe viral pneumonia with                                            responses conferring protection is still unclear, it is now well estab-
or without acute respiratory distress syndrome (1). Although most                                            lished that SARS-CoV-2 elicits a broad T cell response in the majority
COVID-19 cases are mild (~80%), up to a quarter of people infected                                           of patients, with CD4 responses being dominant over CD8 (14). More-
with SARS-CoV-2 present with severe disease necessitating hospi-                                             over, preexisting SARS-CoV-2 cross-reactive T cells may also contrib-
talization, and approximately 5% of critical cases require intensive                                         ute to the divergent manifestations of COVID-19. These cells, likely
care, putting extreme pressure on health systems. Severe disease is                                          acquired during previous infections with endemic human coronavi-
most commonly observed in males, older people, and individuals                                               ruses, have been identified in 20% to 50% of individuals unexposed
with preexisting comorbidities (such as hypertension, type 2 diabetes,                                       to SARS-CoV-2 in different populations around the world (8, 10, 15–
obesity, or chronic lung disease; ref. 2). Immunologically, COVID-19                                         20). It is yet to be determined whether preexisting immunity to SARS-
severity has been associated with major systemic alterations of the                                          CoV-2 is sufficient to confer protection or attenuate the severity of
                                                                                                             COVID-19. Our knowledge regarding SARS-CoV-2–induced immune
                                                                                                             responses is rapidly expanding, yet very few studies have simultane-
Conflict of interest: The authors have declared that no conflict of interest exists.                         ously examined the magnitude or functional and phenotypical profile
Copyright: © 2021, Riou et al. This is an open access article published under the
                                                                                                             of SARS-CoV-2–responding T cells in relation to disease severity. This
terms of the Creative Commons Attribution 4.0 International License.
Submitted: March 1, 2021; Accepted: April 29, 2021; Published: June 15, 2021.
                                                                                                             represents an important gap in our understanding of the role played by
Reference information: J Clin Invest. 2021;131(12):e149125.                                                  T cells during the clinical course of COVID-19, which has implications
https://doi.org/10.1172/JCI149125.                                                                           for pathogenesis and the assessment of vaccine efficacy.

                                                                                                                                                                                                                1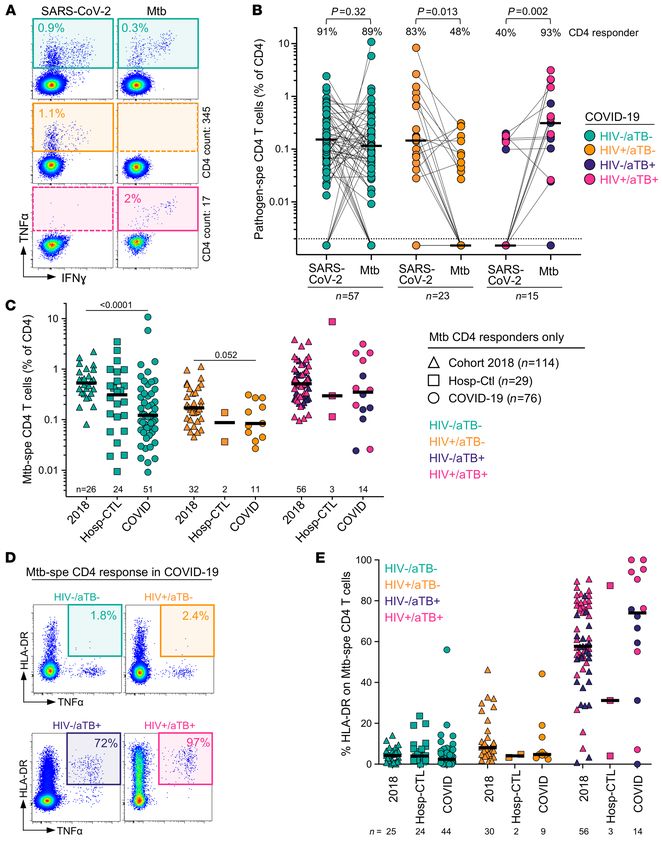
RESEARCH ARTICLE                                                                                                      The Journal of Clinical Investigation

                                                                                                           (aTB) and COVID-19 is also of particular concern.
Table 1. Clinical characteristics of COVID-19 patients and SARS-CoV-2–uninfected                           Both diseases are primarily respiratory illnesses,
hospitalized controls (non-COVID)                                                                          eliciting a hyperinflammatory state in the lung. It is
                                             COVID-19 (n = 95)        Non-COVID (n = 38)        P values   thus reasonable to speculate that the hyperinflam-
                                                                                                           matory milieu induced by COVID-19 could acceler-
Age (median, IQR)                                  52 [43–57]              51 [38–66]            0.87
Male (%)                                              57.9%                   34.2%              0.014     ate TB disease progression and vice versa (25, 26).
Female (%)                                            42.1%                  65.8%               0.014     Moreover, profound lymphopenia and hyperinflam-
SARS-CoV-2 PCR positive (%)                      100%, n = 95                  0%                 NA       mation associated with COVID-19 could favor M.
SARS-CoV-2 serology positiveA (%, n)             70.5%, n = 67                 0%                 NA       tuberculosis reactivation. These concerns are further
      COI (median, IQR)                        7.06 [0.32–27.06]        0.07 [0.07–0.08]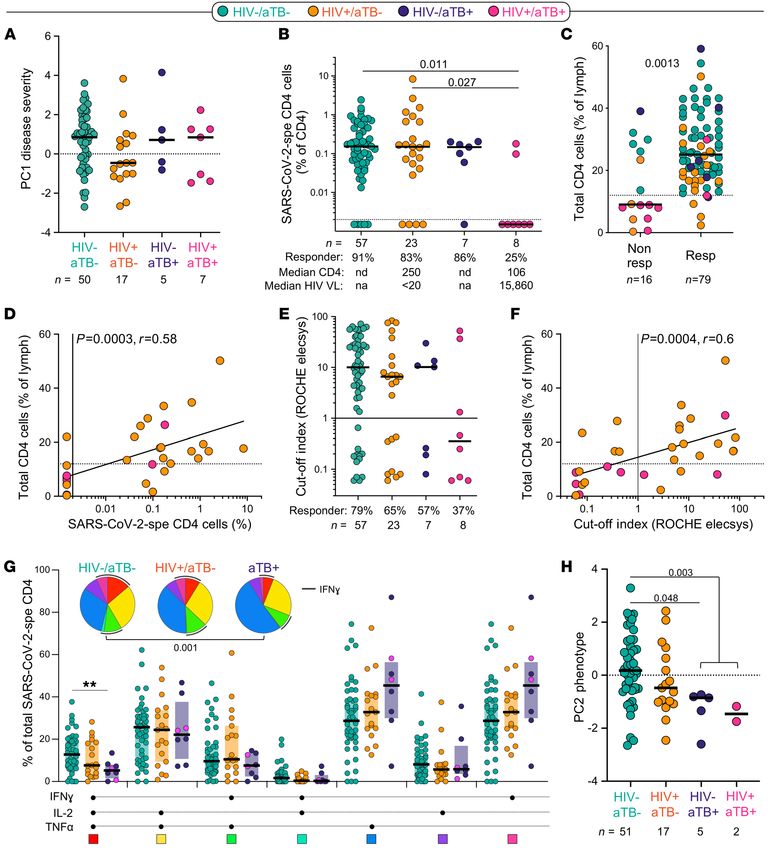
The Journal of Clinical Investigation                                                                                           RESEARCH ARTICLE

Figure 1. Measures of COVID-19 disease severity. (A) An unsupervised 2-way hierarchical cluster analysis (HCA, Ward’s method) was employed to grade
COVID-19 disease, using the WHO ordinal scale scoring, Roche Elecsys anti–SARS-CoV-2 antibody cutoff index, WCC, CRP, D-dimer, ferritin, LDH, and radio-
graphic evidence of disease extent expressed as percentage of unaffected lung. COVID-19 status (COVID-19 cases in red and SARS-CoV-2–uninfected hospital-
ized controls in blue) and outcome (survived in white and deceased in black) of each patient is indicated at the top of the dendrogram. Data are depicted as a
heatmap colored from minimum to maximum values detected for each parameter. (B) Constellation plot-cluster analysis based on all measured parameters.
Each dot represents a participant and is color-coded according to his or her COVID-19 status. Each cluster obtained for the HCA is identified by a number. (C)
Principal component analysis (PCA) on correlations, based on the 8 clinical parameters, was used to explain the variance of the data distribution in the cohort.
Each dot represents a participant. The 2 axes represent principal components 1 (PC1) and 2 (PC2). Their contribution to the total data variance is shown as a
percentage. (D) Loading plot showing how each parameter influences PC1 and PC2 values. (E) Comparison of PC1 score values between COVID-19 cases who
survived and those who died. Bars represent medians. Statistical comparisons were calculated using the nonparametric Mann-Whitney U test. Only partici-
pants with complete clinical data were included in the analysis (n = 79 COVID-19 patients and n = 25 hospitalized controls).

(WHO) ordinal scale score (see Methods), with approximately half                  132 cells/mm3 and a median log viral load less than 1.3 log mRNA
being classified as mild/moderate cases (WHO < 5) and the other                   copies/mL. HIV-1–infected non–COVID-19 controls had a lower
half as severe cases (WHO 5 or higher; ref. 34). Most non–COVID-19                median CD4 count (20 cells/mm3, P = 0.03) and higher viral loads
controls did not require oxygen therapy (57.9%). The majority of the              (5.37 log mRNA copies/mL, P = 0.0005) owing to proportional-
COVID-19 patients received treatment with steroids (78.9%) follow-                ly fewer participants being on ART in this group (46.1%). Last, 15
ing the outcome of the RECOVERY trial (35).                                       participants in the COVID-19 group had active TB (8 of them also
     About 1/3 of the recruited participants were HIV-1 infected                  being HIV-1 infected), and 5 non–COVID-19 controls had active
(n = 31). In the COVID-19 group, the majority of HIV-1–infected                   TB (all of them being HIV-1 infected). It is important to mention
patients were on ART (74.2%) and had a median CD4 count of                        that most of the HIV-1–infected participants without active TB

                                           J Clin Invest. 2021;131(12):e149125 https://doi.org/10.1172/JCI149125                                           3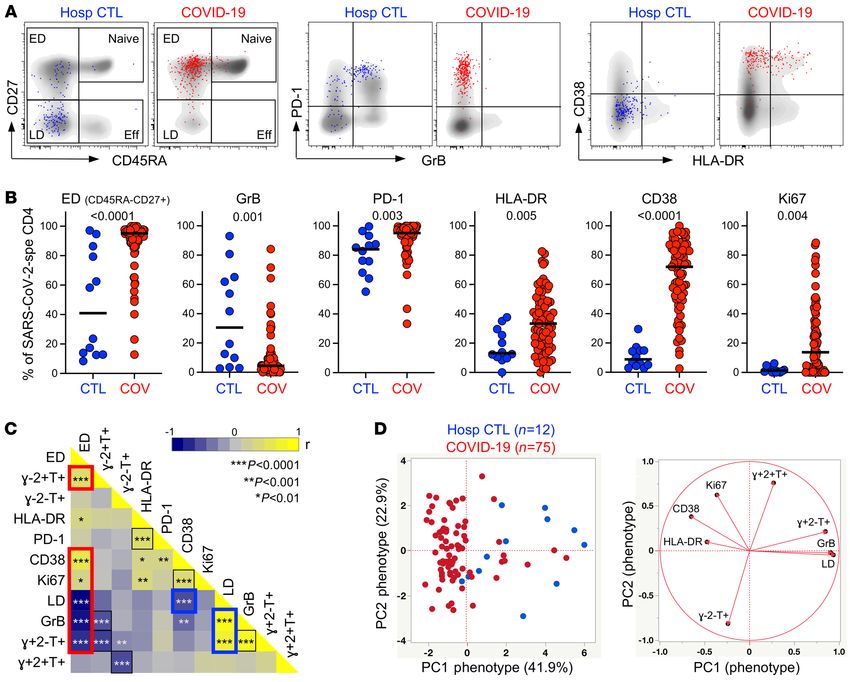
RESEARCH ARTICLE                                                                                               The Journal of Clinical Investigation

Figure 2. Prevalence, magnitude, and functional profile of SARS-CoV-2–specific CD4+ T cells between COVID-19 cases and SARS-CoV-2–uninfected
hospitalized patients. (A) Representative flow cytometry plots of IFN-γ and TNF-α expression. NS, no stimulation. (B) Proportion of patients exhibiting a
detectable SARS-CoV-2 CD4 response in each group. The number of studied patients is indicated in the pie (n = 79 COVID-19 patients and n = 25 hospi-
talized controls). (C) Frequency of SARS-CoV-2–specific CD4+ T cells in hospitalized control (blue, n = 13) and COVID-19 responders (red, n = 79). Statistical
comparisons were calculated using the nonparametric Mann-Whitney U test. (D) Polyfunctional profile of SARS-CoV-2–specific CD4+ T cells in hospitalized
controls and COVID-19 patients. The median and IQR are shown. Each response pattern is color-coded, and data are summarized in the pie charts. Wilcox-
on’s rank test was used to compare response patterns between groups. Statistical differences between pies were defined using a permutation test.

were virally suppressed (77.3%, 17/22), whereas only 1 of the 7                  an increased level of SARS-CoV-2–specific antibodies in patients
HIV-1–infected participants with active TB was aviremic. Further                 with severe COVID-19 defined by the WHO ordinal scale (Supple-
details on the clinical characteristics of the HIV-infected group                mental Figure 1). Thus, based on the clinical data available in this
and the HIV/aTB-coinfected group are presented in Supplemental                   study, 8 clinical parameters were combined to perform a hierar-
Table 1; supplemental material available online with this article;               chical clustering analysis, including WHO ordinal scale scoring,
https://doi.org/10.1172/JCI149125DS1.                                            Roche Elecsys anti–SARS-CoV-2 antibody cutoff index, WCC,
     The comparisons of the clinical characteristics between dis-                CRP, D-dimer, ferritin, LDH, and radiographic evidence of dis-
charged and deceased patients are presented in Supplemental Table                ease expressed as the percentage of unaffected lung. Two main
2; 29.5% (28/95) COVID-19 patients died. As previously reported,                 clusters were identified: cluster 1 encompassed almost exclusively
COVID-19 patients who died were older, were predominantly male,                  COVID-19 cases (92%), and cluster 2 contained 62.5% of hospi-
had more severe disease according to their WHO ordinal scale clas-               talized SARS-CoV-2–uninfected controls and 37.5% of COVID-19
sification, and were characterized by elevated systemic inflamma-                cases. Moreover, 2 subgroups emerged from cluster 1, where cluster
tion. No deaths occurred in the non–COVID-19 control group.                      1a was enriched in COVID-19 patients who died (Figure 1, A and
     Measures of COVID-19 severity. The WHO ordinal scale,                       B). Principal component analysis (PCA) showed a good separation
stratifying patients according to their oxygen therapy require-                  between COVID-19 cases and hospitalized non–COVID-19 controls
ment, has been widely used as a correlate of COVID-19 severity.                  in which PC1 accounted for 32.7% and PC2 17.4% of the variance
Additionally, a wide range of nonspecific indicators of systemic                 (Figure 1C). The corresponding loading plot shows that the lung per-
inflammation, including among others C-reactive protein (CRP),                   centage unaffected score, oxygen therapy requirement, and WCC
ferritin, serum amyloid A (SAA), procalcitonin, lactate dehydro-                 were the main drivers of PC1 variance (Figure 1D). Furthermore, the
genase (LDH), D-dimer, IL-6, IL-10, white cell count (WCC), or                   PC1 score in COVID-19 patients who died was significantly higher
neutrophil count, have been associated with adverse COVID-19                     (P < 0.0001) compared with patients who survived (Figure 1E). This
outcomes (36–39). Furthermore, higher levels of SARS-CoV-2–                      analytical approach grades disease severity as a continuum, allow-
specific antibodies have been shown to associate with increased                  ing the simultaneous integration of multiple clinical parameters of
COVID-19 severity (40, 41). In this study cohort, we also observed               known relevance in COVID-19 outcome.

   4                                      J Clin Invest. 2021;131(12):e149125 https://doi.org/10.1172/JCI149125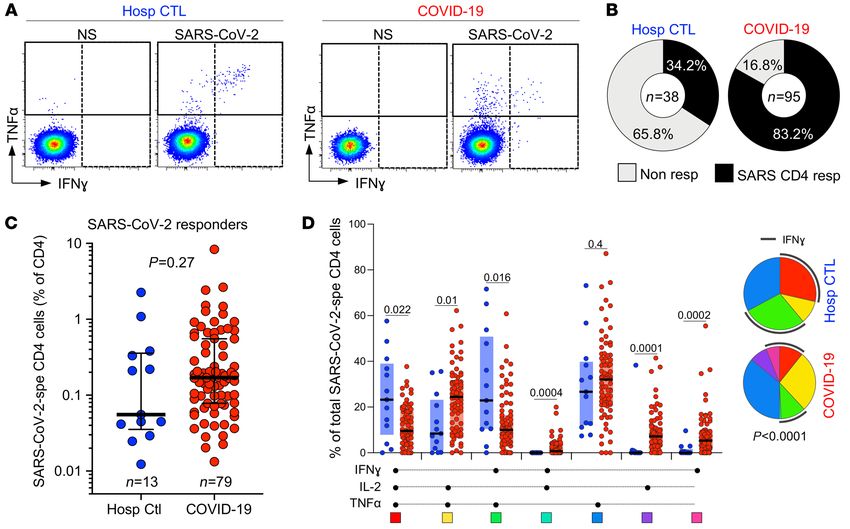
The Journal of Clinical Investigation                                                                                          RESEARCH ARTICLE

Figure 3. Memory and activation profile of SARS-CoV-2–specific CD4+ T cells between COVID-19 cases and SARS-CoV-2–uninfected hospitalized
patients. (A) Overlay flow plots of CD45RA, CD27, PD-1, GrB, CD38, and HLA-DR expression. Dots depict SARS-CoV-2–specific CD4+ T cells and density plots
depict total CD4+ T cells. Four memory subsets can be delineated: naive (CD45RA+CD27+), early differentiated (ED, CD45RA–CD27+), late differentiated
(LD, CD45RA–CD27–), and effector (Eff, CD45RA+CD27–). (B) Summary graphs of the expression of each marker in SARS-CoV-2–specific CD4+ T cells (n = 75
COVID-19 patients and n = 12 hospitalized controls). The phenotype of SARS-CoV-2–specific CD4+ T cells was assessed only in those with response greater
than 20 events. Bars represent medians. Statistical comparisons were calculated using the nonparametric Mann-Whitney U test. (C) Heatmap of pairwise
Spearman’s correlations between phenotypical and functional traits of SARS-CoV-2–specific CD4+ T cells. Spearman’s rank r correlation values are shown
from blue, –1, to yellow, 1. The red box identifies the profile of ED SARS-CoV-2–specific CD4+ T cells and the blue box the profile of LD cells enriched in hos-
pitalized controls. (D) PCA (left) based on the 8 phenotypical and functional attributes of SARS-CoV-2–specific CD4+ T cells (LD, GrB, HLA-DR, Ki67, CD38
and the proportion of IFN-γ+IL-2+TNF-α+, IFN-γ+IL-2–TNF-α+, and IFN-γ–IL-2–TNF-α+ cells) and corresponding loading plot (right).

     Distinct phenotype of SARS-CoV-2–responding CD4+ T cells in                  response among the SARS-CoV-2–responding participants from
COVID-19 and non–COVID-19 patients. First, we compared the                        both groups; although not statistically significant, the median
prevalence, magnitude, and phenotypical profile of SARS-CoV-2–                    response in COVID-19 cases was approximately 3-fold higher
responding CD4+ T cells (e.g., cells producing IFN-γ, TNF-α, or                   compared with non–COVID-19 controls (0.17%, IQR: 0.08%–
IL-2; Figure 2A) between hospitalized non–COVID-19 controls                       0.55% and 0.05%, IQR: 0.03%–0.36%, respectively; Figure 2C).
and confirmed COVID-19 patients. SARS-CoV-2–reactive CD4+                         Of note, in the COVID-19 group, the frequency of SARS-CoV-2–
T cells were detected in 34.2% (13/38) of non–COVID-19 con-                       specific CD4+ T cells strongly associated with the magnitude of
trols, whereas 83.2% (79/95) of COVID-19 patients exhibited a                     SARS-CoV-2 nucleocapsid–specific IgG (P < 0.0001, r = 0.61; Sup-
SARS-CoV-2–specific response (Figure 2B). These data concord                      plemental Figure 2A), as previously reported (8, 15, 42, 43).
with several publications demonstrating the presence of preex-                        When cytokine responses were analyzed individually, TNF-α
isting SARS-CoV-2 cross-reactive CD4+ T cells in 20% to 50% of                    was the predominant cytokine produced by CD4 cells in response
SARS-CoV-2–unexposed individuals (8, 10, 15–18). We observed                      to SARS-CoV-2 peptides. A short-term (5-hour) whole-blood assay
high variability in the magnitude of the SARS-CoV-2 CD4+ T cell                   in both groups revealed that TNF-α production was significant-

                                           J Clin Invest. 2021;131(12):e149125 https://doi.org/10.1172/JCI149125                                           5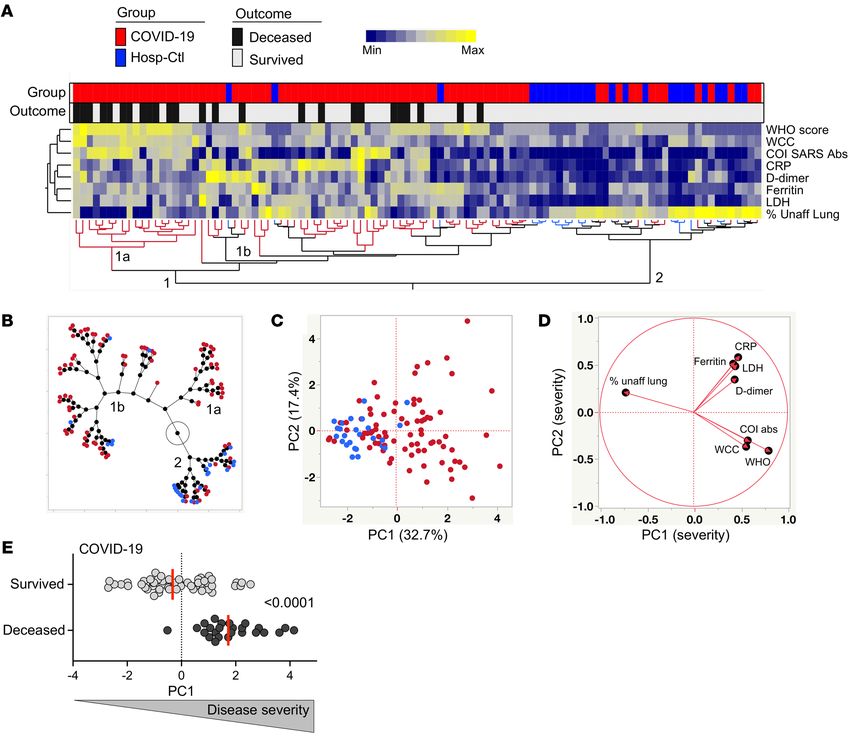
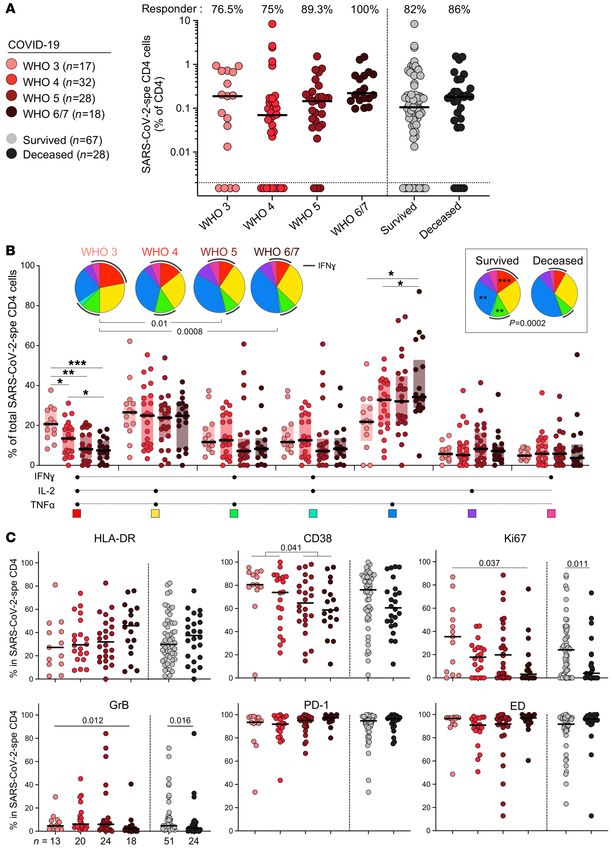
RESEARCH ARTICLE                                                                                                 The Journal of Clinical Investigation

Figure 4. SARS-CoV-2–specific CD4+ T cell response in COVID-19 cases stratified by WHO ordinal scale score and outcome. (A) Prevalence and frequency of
SARS-CoV-2–specific CD4+ T cells in COVID-19 cases. Patients were stratified according to WHO ordinal score and outcome. (B) Polyfunctional profile of SARS-
CoV-2–specific CD4+ T cells in COVID-19 cases stratified by WHO score and outcome. Wilcoxon’s rank test was used to compare response patterns between
groups (*P < 0.05, **P < 0.01, ***P < 0.001). Statistical differences between pie charts were defined using a permutation test. (C) Memory and activation profile
of SARS-CoV-2–specific CD4+ T cells in COVID-19 cases stratified by WHO score and outcome. The phenotype of SARS-CoV-2–specific CD4+ T cells was assessed
only in those with response greater than 20 events (n = 75 COVID-19 patients). Statistical comparisons were defined using a Kruskal-Wallis test, adjusted for
multiple comparisons (Dunn’s test) for the different WHO groups and the Mann-Whitney U test to compare COVID-19 patients who survived or died.

   6                                       J Clin Invest. 2021;131(12):e149125 https://doi.org/10.1172/JCI149125
The Journal of Clinical Investigation RESEARCH ARTICLE
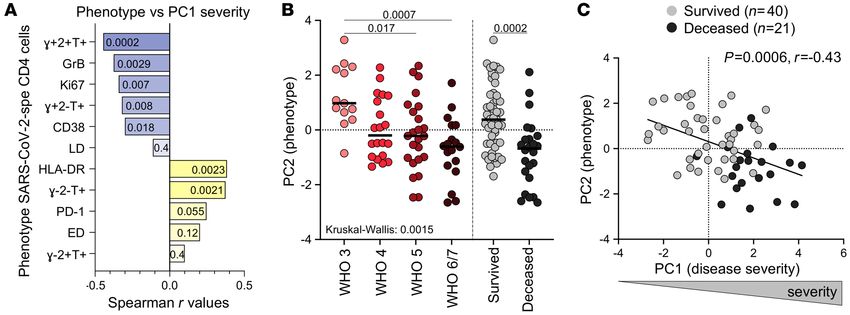
Figure 5. Relationship between COVID-19 severity and functional and phenotypical traits of SARS-CoV-2–specific CD4+ T cells. (A) Spearman’s correla-
tion r values between indicated SARS-CoV-2–specific CD4+ T cell features and COVID-19 severity (defined by the composite analysis of clinical parameters,
PC1 severity). Negative associations are represented in blue and positive associations in yellow. P values are indicated for each comparison. (B) Compar-
ison of the overall profile of SARS-CoV-2–specific CD4+ T cells (PC2 phenotype) in COVID-19 cases (n = 74) stratified by WHO ordinal score and outcome.
Statistical comparisons were defined using a Kruskal-Wallis test, adjusted for multiple comparisons (Dunn’s test) for the different WHO groups and the
Mann-Whitney U test to compare COVID-19 patients who survived or died. (C) Association between COVID-19 severity (PC1 severity) and the overall profile
of SARS-CoV-2–specific CD4+ T cells (PC2 phenotype). COVID-19 survivors are depicted in gray and patients who died in black. Correlation was tested by a
2-tailed nonparametric Spearman’s rank test.
ly higher compared with IL-2 and IFN-γ (Supplemental Figure expression of HLA-DR, CD38, and Ki67 in SARS-CoV-2 CD4+ T
2B). Combined analyses of all measured cytokines (IL-2, IFN-γ, cells was significantly reduced compared with acute COVID-19
and TNF-α) showed that the overall polyfunctional profile of patients (reflecting viral clearance), cells maintained an elevated
SARS-CoV-2–specific cells in COVID-19 participants was distinct PD-1 expression and retained their early differentiated phenotype
from uninfected controls (P < 0.0001). In COVID-19, the CD4 (Supplemental Figure 2C).
response was characterized by limited expression of IFN-γ and Pairwise associations of the functional and phenotypical
was enriched in cells coexpressing IL-2 and TNF-α. Conversely, in characteristics of SARS-CoV-2–responding CD4 cells identified
non–COVID-19 controls, most SARS-CoV-2–reactive CD4+ T cells 2 signatures: (a) activated cells exhibiting an early differenti-
were distributed between triple functional cells (IL-2+IFN-γ+T- ated memory phenotype and preferentially secreting IL-2 and
NF-α+) and cells coproducing IFN-γ and TNF-α (Figure 2D). TNF-α, characteristic of COVID-19 patients, and (b) late differ-
We next assessed the memory differentiation (CD27, CD45RA), entiated memory cells with elevated GrB expression endowed
cytotoxic potential (granzyme B [GrB]), and activation profile (HLA- with polyfunctional capacities predominantly observed in
DR, CD38, Ki67, programmed cell death protein 1 [PD-1]) of SARS- SARS-CoV-2–responsive CD4+ T cells from uninfected indi-
CoV-2–responding CD4+ T cells (Figure 3A). In COVID-19 patients, viduals (Figure 3C). To determine whether the overall pheno-
SARS-CoV-2–specific CD4+ T cells almost exclusively displayed an typical profile of SARS-CoV-2–responding CD4+ T cells allows
early differentiated memory phenotype (CD45RA–CD27+, median: discrimination between COVID-19–induced and preexisting
95.1%, IQR: 88.7%–97.4%). By contrast, in non–COVID-19 con- cross-reactive CD4 responses, we performed a PCA (Figure
trols, the memory profile of SARS-CoV-2–reactive CD4+ T cells was 3D) and hierarchical clustering analysis (Supplemental Figure
highly variable between individuals, with 50% exhibiting predomi- 2D), including 8 parameters (e.g., the proportion of IFN-γ+TNF-
nantly a late differentiation profile (CD45RA–CD27–). Moreover, the α+IL-2+, IFN-γ–TNF-α+IL-2+ IFN-γ–TNF-α+IL-2 – cells; the propor-
SARS-CoV-2 response in uninfected controls was characterized by tion of the early differentiated memory phenotype; and GrB,
significantly elevated expression of GrB compared with COVID-19 HLA-DR, CD38, and Ki67 expression). Both analyses showed
cases (median: 30.6%, IQR: 5%–64.2% vs. 4.4%, IQR: 1.9%–9.6%, that based on the functional and phenotypical traits of SARS-
respectively, P = 0.001). CoV-2–responding CD4+ T cells, COVID-19 patients could be
As expected, the expression of HLA-DR, CD38, and Ki67 on distinguished from non–COVID-19 controls.
SARS-CoV-2–responding CD4+ T cells was significantly higher The functional and phenotypical signature of SARS-CoV-2–spe-
in COVID-19 cases compared with non–COVID-19 controls (P = cific CD4+ T cells is associated with disease severity. We next investi-
0.005, P < 0.0001, and P = 0.004, respectively), likely reflecting gated the relationship between the profile of SARS-CoV-2–specific
ongoing viral replication (Figure 3B). The expression of CD38 and CD4+ T cells and COVID-19 severity. Although no difference was
Ki67 was inversely associated with the time COVID-19 patients observed in the prevalence or magnitude of SARS-CoV-2–specific
spent in clinical care (P = 0.0006, r = –0.39; and P = 0.017, r = CD4 responses based on participants’ WHO ordinal scale score or
–0.27, respectively, data not shown). As previously reported (14, outcome (survived vs. deceased; Figure 4A), their polyfunctional
16, 44), in convalescent COVID-19 patients (n = 9), although the profile was related to disease severity. Less severe forms of disease
J Clin Invest. 2021;131(12):e149125 https://doi.org/10.1172/JCI149125 7RESEARCH ARTICLE The Journal of Clinical Investigation Figure 6. Impact of HIV, aTB, and HIV/aTB coinfection on SARS-CoV-2–specific CD4+ T cell response. (A) Comparison of COVID-19 severity (defined by the composite analysis of clinical parameters, PC1 severity) between patients grouped according to HIV and/or aTB coinfection. (B) Prevalence and frequencies of SARS-CoV-2–specific CD4+ T cells in COVID-19 patients stratified by HIV and/or aTB coinfection. Statistical comparisons were defined using a Krus- kal-Wallis test adjusted for multiple comparisons (Dunn’s test). (C) Comparison of the frequency of total CD4+ T cells between SARS-CoV-2 CD4 responders and nonresponders. Dots are color-coded according to patient’s HIV and TB status. Statistical comparison was performed using the Mann-Whitney U test. (D) Association between the frequency of SARS-CoV-2–specific CD4+ T cells and total CD4+ T cells in HIV-infected COVID-19 patients. Correlation was tested by a 2-tailed nonparametric Spearman’s rank test. (E) Prevalence and magnitude of SARS-CoV-2–specific serological response (defined using the Roche Elecsys assay) in COVID-19 patients stratified by HIV and/or aTB coinfection. (F) Association between the magnitude of SARS-CoV-2–specific serological response and the frequency of total CD4+ T cells in HIV-infected COVID-19 patients. Correlation was tested by a 2-tailed nonparametric Spearman’s rank test. (G) Polyfunctional profile of SARS-CoV-2–specific CD4+ T cells in COVID-19 cases stratified by HIV or aTB coinfection. For this analysis, HIV–/aTB+ and HIV+/aTB+ patients were combined in 1 group (aTB). Dots are color-coded according to patients’ HIV and TB status. Wilcoxon’s rank test was used to com- pare response patterns between groups (**P < 0.01). Statistical differences between pie charts were defined using a permutation test. (H) Comparison of the overall profile of SARS-CoV-2–specific CD4+ T cells (PC2 phenotype) in COVID-19 cases stratified by HIV or aTB coinfection. Statistical comparisons were defined using a Kruskal-Wallis test adjusted for multiple comparisons (Dunn’s test). 8 J Clin Invest. 2021;131(12):e149125 https://doi.org/10.1172/JCI149125
The Journal of Clinical Investigation RESEARCH ARTICLE
were associated with enhanced capacity of SARS-CoV-2–specific CD4 counts (median: 106 cells/mm3), we hypothesized that the
CD4+ T cells to coexpress IFN-γ, TNF-α, and IL-2. By contrast, lack of a SARS-CoV-2–specific response could be related to CD4
TNF-α monofunctional cells were more prevalent in patients with lymphopenia. Because recent CD4 count data were not available for
more severe disease (Figure 4B). These functional profiles also relat- all patients, we used the frequency of total CD4+ T cells, measured
ed to disease outcome (Figure 4B, inset). Assessing the phenotypical by flow cytometry, as a surrogate measurement of CD4 count: the
profile of SARS-CoV-2–specific CD4+ T cells, the following trends lowest frequencies of CD4+ T cells were observed in participants
were observed in less severe forms of COVID-19 (WHO 4 or lower): with HIV-1+/aTB+ (Supplemental Figure 3B). The frequency of total
increased expression of CD38, Ki67, and GrB and reduced expres- CD4 cells was significantly higher in SARS-CoV-2 responders com-
sion of HLA-DR. However, PD-1 expression and the memory matu- pared with nonresponders (median: 25% and 9%, respectively, P =
ration profile of SARS-CoV-2–specific CD4+ T cells were comparable 0.0013; Figure 6C). Moreover, in HIV-infected patients, the magni-
between COVID-19 patients stratified by their WHO score (Figure tude of SARS-CoV-2–specific CD4+ T cells was associated with the
4C). Of note, no difference in the magnitude of SARS-CoV-2–specif- frequency of total CD4+ T cells (P = 0.0006, r = 0.58; Figure 6D) and
ic CD4+ T cell response was observed between COVID-19 patients absolute CD4 count (P = 0.001, r = 0.59, data not shown). Interest-
receiving steroid treatment or not (P = 0.12, data not shown). ingly, patients coinfected with HIV and aTB also exhibited a limited
Each functional and phenotypical attribute of SARS-CoV-2–spe- capacity to generate SARS-CoV-2 antibodies: only 3 out of 8 patients
cific CD4+ T cells was assessed individually for the strength of its had a positive serology of modest magnitude (Figure 6E). As for the
correlation with disease severity (defined by the composite analysis frequency of SARS-CoV-2–specific CD4 response, the magnitude of
of clinical parameters described in Figure 1C, e.g., PC1 severity). The SARS-CoV-2 antibodies correlated with the frequency of total CD4+
highest Spearman’s rank r values for significant negative correlations T cells in HIV-infected patients (P = 0.0011, r = 0.56; Figure 6F). Of
were observed between the proportion of IFN-γ+IL-2+TNF-α+ cells, note, in our cohort, the lack of a SARS-CoV-2–specific CD4 response
GrB and Ki67 expression, and disease severity; positive associa- in patients with aTB was not associated with increased mortality:
tions were found between the proportion of IFN-γ–IL-2–TNF-α+ cells, death was recorded in 4 out of the 8 SARS-CoV-2 CD4 responders
HLA-DR expression, and disease severity (Figure 5A). Moreover, the and 2 out of the 7 of CD4 nonresponders (data not shown).
global functional and phenotypical pattern of SARS-CoV-2–specific We did not observe significant differences in the memory and
CD4+ T cells described in Figure 2H (PC2 phenotype) was associat- activation profile of SARS-CoV-2–specific CD4+ T cells based on
ed with patients’ WHO ordinal scale score and outcome (survived patients’ HIV or TB status (Supplemental Figure 3C). However,
vs. deceased; Figure 5B). Overall, COVID-19 severity (PC1 severi- in COVID-19 patients with concomitant aTB, SARS-CoV-2–spe-
ty) strongly correlated with the traits of SARS-CoV-2–specific CD4+ cific CD4+ T cells displayed lower polyfunctional capacity, char-
T cells (PC2 phenotype) (P = 0.0006, r = –0.43, Figure 5C), with acterized by significant reduction of the cells with 3 functions,
severe disease being characterized by poor polyfunctional potential, compared with HIV–/aTB– patients (Figure 6G). Finally, although
reduced proliferation capacity, and enhanced HLA-DR expression HIV infection did not significantly alter the functional and pheno-
on SARS-CoV-2–specific CD4+ T cells. typical profile of SARS-CoV-2–specific CD4+ T cells, in patients
Preexisting lymphopenia impairs the immune response to SARS- with aTB, the global SARS-CoV-2–specific CD4+ T cell pattern was
CoV-2, and current TB reduces the polyfunctional potential of SARS- significantly different compared with HIV-uninfected COVID-19
CoV-2–specific CD4+ T cells. Given the systemic inflammation induced patients (Figure 6H).
by chronic HIV infection and active TB, questions have been raised Acute SARS-CoV-2 infection decreases M. tuberculosis–specific
whether these 2 diseases in particular could distort the immune CD4+ T cell response. Many viruses, including SARS-CoV-2, cause a
response to SARS-CoV-2, leading to increased mortality. Indeed, temporary immunosuppressive effect, which could lead to the reac-
emerging evidence shows that TB and HIV are independently asso- tivation of subclinical bacterial infection (45). Thus, in a TB-endem-
ciated with an increased risk for COVID-19 mortality (27, 30, 32). ic country such as South Africa, many concerns have been raised
Thus, we defined the impact of HIV, TB, and HIV/aTB coinfection on about the possibility that COVID-19 could reactivate latent TB.
the magnitude and phenotypical and functional profile of the SARS- To better understand the potential impact of COVID-19
CoV-2 CD4+ T cell response. Disease severity at enrollment (defined on M. tuberculosis coinfection, we compared the frequency and
by PC1 severity or WHO ordinal scale on its own) was comparable phenotype of M. tuberculosis–specific CD4+ T cells in COVID-19
irrespective of HIV and/or TB coinfection (Figure 6A and data not patients, hospitalized non–COVID-19 controls, and outpatient
shown). However, age (an established risk factor for severe disease participants with latent TB (LTBI) or aTB recruited to unrelated
and mortality), could be a confounder because HIV+/aTB+, HIV–/ studies prior to the emergence of the COVID-19 pandemic (Sup-
aTB+, and HIV+/aTB– patients were significantly younger compared plemental Table 3). M. tuberculosis–specific T cell responses were
with the HIV–/aTB– COVID-19 patients (median: 40, 43, 47, and 55 also assessed using a whole-blood assay (Figure 7A). Because HIV
years, respectively; Supplemental Figure 3A). infection is known to decrease M. tuberculosis–specific CD4+ T cell
Although the proportion of SARS-CoV-2 CD4 responders was response and aTB induces significant changes in the phenotype of
similar between HIV–/aTB–, HIV+/aTB–, and HIV–/aTB+ patients M. tuberculosis–specific CD4+ T cells (46), patients were grouped
(≥83%), in HIV-infected patients with aTB (HIV+/aTB+), only 25% according to their HIV and TB status for this analysis. The pro-
(2/8) exhibited detectable SARS-CoV-2–specific CD4+ T cells (Figure portion of CD4 responders to SARS-CoV-2 and M. tuberculosis
6B). Of note, among responders, the frequency of SARS-CoV-2–spe- were comparable in HIV-uninfected COVID-19 patients (~90%).
cific CD4+ T cells was comparable between all groups (Figure 6B). In HIV-infected patients with COVID-19, the proportion of an M.
Given that HIV+/aTB+ patients are characterized by low absolute tuberculosis–specific CD4 response was significantly lower com-
J Clin Invest. 2021;131(12):e149125 https://doi.org/10.1172/JCI149125 9RESEARCH ARTICLE The Journal of Clinical Investigation Figure 7. Impact of COVID-19 on M. tuberculosis–specific CD4+ T cell response. (A) Representative examples of flow cytometry plots of SARS-CoV-2– and M. tuberculosis–specific CD4+ T cell responses in 3 COVID-19 patients (1 HIV–/aTB–, 1 HIV+/aTB–, and 1 HIV+/aTB+). (B) Comparison of the prevalence and frequencies of SARS-CoV-2– and M. tuberculosis–specific CD4+ T cells in COVID-19 patients stratified by HIV or aTB coinfection. The proportion of responders to each patho- gen (S: SARS-CoV-2 and M: M. tuberculosis) is presented with pies at the top of the graph. Statistical comparisons were performed using the χ2 test. Participants were grouped according to their HIV and/or TB status. Black bars represent the medians. (C) Comparisons of the frequencies of M. tuberculosis–specific CD4+ T cells in a cohort recruited before the emergence of COVID-19 (2018, n = 114), SARS-CoV-2–uninfected hospitalized controls (n = 29), and COVID-19 cases (n = 76). Participants were stratified according to their HIV and/or TB status. Statistical comparisons were defined using a Kruskal-Wallis test adjusted for multiple comparisons (Dunn’s test) for each subgroup. (D) Representative flow cytometry plots of HLA-DR expression on TNF-α–producing M. tuberculosis–specific CD4+ T cells in 3 COVID-19 patients (1 HIV–/aTB–, 1 HIV+/aTB–, and 1 HIV+/aTB+). (E) Summary graph of HLA-DR expression on M. tuberculosis–specific CD4+ T cells in a cohort recruited before the emergence of COVID-19 (2018), SARS-CoV-2–uninfected hospitalized controls, and COVID-19 cases stratified according to HIV and TB status. The phenotype of M. tuberculosis–specific CD4+ T cells was assessed only in those with response greater than 20 events. 10 J Clin Invest. 2021;131(12):e149125 https://doi.org/10.1172/JCI149125
The Journal of Clinical Investigation                                                                             RESEARCH ARTICLE

pared with that of SARS-CoV-2 (48% vs. 83%, respectively, P =            uninfected patients (~34%). This is in accordance with several
0.013). Conversely, in COVID-19 patients with aTB, SARS-CoV-2            studies reporting that SARS-CoV-2 cross-reactive memory T cells
responses were only detected in 40% of participants, whereas             are detectable in 20% to 50% of individuals with no prior exposure
14/15 (93%) exhibited an M. tuberculosis–specific CD4 response           to SARS-CoV-2 (8, 10, 15–20). Limited information is available
(Figure 7B). We did not find any relationship between the extent         regarding the phenotype and function of these memory responses.
of CD4 lymphopenia and the absence of M. tuberculosis–specific           Our data showed that SARS-CoV-2–responding CD4+ T cells were
responses (data not shown). Upon comparison of the frequency of          qualitatively different in acute COVID-19 cases compared with
M. tuberculosis–specific CD4+ T cells between the current cohort         uninfected individuals. In the former group, SARS-CoV-2–specific
and the 2018 prepandemic cohort with LTBI, we found that the             CD4+ T cells almost exclusively displayed an early differentiated
magnitude of M. tuberculosis–specific CD4+ T cells was approxi-          memory phenotype and limited capacity to produce IFN-γ; in the
mately 5-fold lower in the HIV-uninfected COVID-19 group and             latter group, SARS-CoV-2–responsive CD4+ T cells preferential-
approximately 2-fold lower in the HIV-infected COVID-19 group            ly exhibited a late differentiated memory phenotype and were
compared with prepandemic samples (medians: 0.17% vs. 0.53%              enriched in GrB, suggesting that cytotoxic memory CD4+ T cells
for HIV–, P < 0.0001 and 0.09% vs. 0.17% for HIV+, P = 0.052,            could be a relevant component in SARS-CoV-2 immunity, as pre-
respectively). However, comparable frequencies were observed             viously described for other viral infections (48). However, to date,
in those with aTB (medians: 0.35% for COVID-19 vs. 0.53% for             the functional role for preexisting cross-reactive T cell memo-
prepandemic cohort, P = 0.3; Figure 7C). These data suggest that         ry in COVID-19 remains unproven. In a comprehensive review,
acute SARS-CoV-2 infection may diminish the pool of M. tubercu-          Leipsitch et al. describe 3 possible scenarios outlining potential
losis–specific memory T cell responses.                                  mechanisms by which cross-reactive memory T cells could confer
     Last, HLA-DR expression on M. tuberculosis–specific CD4+ T          some form of protection against COVID-19 by reducing the viral
cells has been shown to be a robust marker to distinguish active         burden and/or limiting disease severity or its duration (49).
or subclinical TB from latent M. tuberculosis infection, regardless           Several publications have reported that severe COVID-19
of HIV infection (46, 47). Thus, to define whether COVID-19 can          elicits drastic changes in the overall distribution and phenotypical
promote M. tuberculosis reactivation, we compared the expression         landscape of circulating T cells, characterized by severe lympho-
of HLA-DR on M. tuberculosis–specific CD4+ T cells in the differ-        penia (preferentially affecting CD8 T cells) and widespread T cell
ent cohorts (Figure 7D). In participants without aTB, no difference      activation (4–6). Furthermore, an immune signature of the SARS-
in the expression of HLA-DR was observed between COVID-19                CoV-2–specific T cell response correlating with COVID-19 severi-
patients, hospitalized non–COVID-19 controls, and the 2018               ty is also emerging (8–13). Most of these studies compared patients
prepandemic cohort, irrespective of their HIV status (Figure 7E).        with very divergent forms of disease (hospitalized vs. nonhospital-
Moreover, in these patients, the memory maturation profile and           ized patients, convalescent patients who had mild or severe dis-
expression of other activation markers (such as CD38, Ki67, and          ease, or hospitalized vs. convalescent patients). Here, we report on
PD-1) in M. tuberculosis–specific CD4+ T cells were similar between      the immune profile of SARS-CoV-2 CD4 response in hospitalized
COVID-19 patients and hospitalized non–COVID-19 controls                 acute COVID-19 patients stratified by disease severity based on
(Supplemental Figure 4). In aTB patients, elevated HLA-DR                multiple clinical parameters of known relevance in COVID-19 out-
expression was observed compared with latently infected individ-         come. Our data showed that the quality rather than the quantity of
uals, as expected. However, although not statistically significant,      SARS-CoV-2–specific CD4+ T cells may contribute to an efficient
the proportion of activated M. tuberculosis–specific CD4+ T cells        COVID-19 immune response as previously described for other
tended to be higher in COVID-19–coinfected patients compared             viral infections (50). Indeed, more severe forms of COVID-19 cor-
with the non–COVID-19 group (median: 74 %, IQR: 49%–94% vs.              relate with the SARS-CoV-2–specific CD4 response, displaying a
57.7%, IQR: 50%–77%, respectively; Figure 7E). This suggests that        limited capacity to produce IFN-γ, reduced expression of GrB and
acute COVID-19 does not promote the reactivation of latent M.            Ki-67, and elevated expression of HLA-DR. This is in agreement
tuberculosis infection but could enhance the activation of the M.        with other reports showing that reduced IFN-γ production charac-
tuberculosis–specific CD4+ T cell response during active TB.             terizes severely ill patients (11, 12). Moreover, the overall profile of
                                                                         SARS-CoV-2–specific CD4+ T cells differed significantly between
Discussion                                                               patients who survived COVID-19 and patients who died. The
In this study, using a cohort of acute COVID-19 cases and SARS-          altered Th1 profile observed in severe COVID-19, reminiscent of
CoV-2–uninfected hospitalized patients, we interrogated the              an exhausted phenotype, could contribute to increased inflamma-
SARS-CoV-2–specific CD4+ T cell response patterns in relation to         tion with poorer viral control. It thus remains to be seen whether
various measures of clinical disease severity to better understand       recovery from COVID-19 can induce long-lasting, efficient mem-
the immune determinants of COVID-19 clinical course. Moreover,           ory T cells, regardless of the severity of the COVID-19 episode.
in a subset of patients, we investigated whether HIV and/or TB                In this study, we also report the impact of HIV, TB, and HIV/
coinfections affected the CD4 response against SARS-CoV-2 and            TB coinfection on SARS-CoV-2 immunity. The clinical and epide-
conversely, whether COVID-19 affected the M. tuberculosis–spe-           miological interactions of COVID-19 with TB and/or HIV-1 pose
cific CD4 response.                                                      an additional health threat. In South Africa, 2 large epidemiolog-
     First, by measuring the prevalence of SARS-CoV-2–specific           ical studies have shown that TB and HIV-1 were independently
CD4 responses, we showed that SARS-CoV-2–reactive CD4+ T                 associated with increased risk of severe COVID-19 and death (27,
cells were detected in a substantial proportion of SARS-CoV-2–           28). Although comorbidities associated with HIV-1 and TB may

                                     J Clin Invest. 2021;131(12):e149125 https://doi.org/10.1172/JCI149125                                 11
RESEARCH ARTICLE The Journal of Clinical Investigation
primarily drive COVID-19 severity in these populations, it is also of a transient suppression of cellular immunity and/or (b) increase
plausible that HIV- and/or TB-associated immune dysregulation the risk of progressive primary TB infection by reducing the pool
may contribute to heightened risk. of memory T cells targeting M. tuberculosis. We showed in this
To date, the immunological impact of HIV on SARS-CoV-2 study that COVID-19 did not induce a concomitant activation of
immune response has been mainly reported in isolated or limit- M. tuberculosis–specific CD4+ T cells, suggesting that acute SARS-
ed cases of coinfection (51–53). Only 2 studies have measured CoV-2 infection may not immediately result in progression of
the effect of HIV-1 infection on the overall profile of T cells in latent M. tuberculosis to subclinical or active TB disease. However,
COVID-19 cases: Karim et al. showed that viremic HIV-infected we found a significant reduction in the frequency of M. tubercu-
COVID-19 patients exhibited lower frequencies of tissue-hom- losis–specific CD4+ T cells in COVID-19 patients compared with
ing CXCR3+ CD8+ T cells and higher T cell activation compared healthy prepandemic participants with LTBI. Because an intact T
with HIV-uninfected patients (54). Similarly, Sharov showed that cell response is an essential component in M. tuberculosis control,
viremic HIV-infected COVID-19 patients displayed enhanced this decline in M. tuberculosis–specific CD4+ T cells could affect the
exhaustion of their T cell compartment (55). This suggests that ability of the host to control latent or new M. tuberculosis infection.
systemic immune activation associated with untreated HIV could However, longitudinal studies are required to investigate wheth-
skew the SARS-CoV-2 immune response. In our study, where er T cell normalization after COVID-19 recovery is accompanied
most of the HIV+/aTB– participants were virally suppressed (17 by homeostatic reexpansion or peripheral redistribution of the M.
out of 22), we showed that HIV infection alone did not alter the tuberculosis–specific memory T cell pool. Furthermore, it remains
functional and phenotypical profile of SARS-CoV-2 CD4+ T cells to be assessed whether alterations in the frequency or phenotype
compared with HIV-uninfected patients. However, HIV-1–infect- of SARS-CoV-2–specific CD4+ T cells, observed in the context of
ed patients characteristically displayed a lower CD4+ T cell fre- HIV and aTB coinfections, have an impact on COVID-19 clinical
quency compared with HIV-uninfected patients, which in turn outcome, as the limited number of patients and the cross-section-
was associated with lower magnitudes of SARS-CoV-2–specific al design of this study precluded speculation on this issue.
CD4+ T cells and lower levels of IgG targeting SARS-CoV-2 nucle- Overall, our results showed that the functional and pheno-
ocapsid associated with total CD4+ T cell frequency. Moreover, typical signature of SARS-CoV-2–specific CD4+ T cells, rather
in most HIV+/aTB+ patients with the most severe lymphopenia than magnitude, was associated with COVID-19 severity in hos-
(CD4 frequency < 10%), SARS-CoV-2–specific responses were pitalized patients. These results further advance our knowledge
undetectable. These results suggest that preexisting lymphopenia, of COVID-19 immunopathology, inform potential correlates of
observed in untreated HIV-1 infection or in those with poor CD4 protection, and could provide a rationale for future evaluation of
reconstitution despite ART usage, may impede the generation of T novel vaccine responses. Moreover, our findings revealed poten-
cell and/or antibody responses against SARS-CoV-2. These results tial mechanisms by which HIV-1 and TB coinfections could exac-
will need to be confirmed in a larger cohort and could potential- erbate COVID-19 pathology.
ly be assessed by using different approaches (such as the agnos-
tic activation-induced markers assay) to confirm the inability of Methods
lymphopenic patients to mount a T cell response to SARS-CoV-2.
Despite COVID-19 and aTB coinfection cases reported in multi- Study cohorts
ple countries (56–58), immunological data on the SARS-CoV-2 Hospitalized COVID-19 and non–COVID-19 patients. We enrolled 133
response in the context of active TB coinfection is scarce. Given hospitalized patients (95 with confirmed acute COVID-19 and 38
that both diseases can elicit a hyperinflammatory state in the lung SARS-CoV-2 uninfected) from Groote Schuur Hospital in Cape Town,
with overlap in the cytokine and chemokine profile found in bron- South Africa, between June and August 2020. The clinical characteris-
cho-alveolar lavage samples during severe COVID-19, TB, or HIV/ tics of all patients included in this study are presented in Table 1, and
TB coinfection (59, 60), it can be speculated that one disease may the comparisons of the clinical characteristics between discharged and
exacerbate the other, leading to unfavorable outcomes. One study deceased COVID-19 patients are presented in Supplemental Table 2.
recently showed, using an IFN-γ release assay, that aTB impairs Case-control study (2018). To compare the frequency and profile
the ability to mount a SARS-CoV-2–specific immune response in of M. tuberculosis–specific CD4+ T cells between samples collected
coinfected subjects (61). Here, we showed that active TB coinfec- before and during the SARS-CoV-2 pandemic, we used data generat-
tion skewed the functional profile of SARS-CoV-2–specific CD4+ ed from participants recruited at the Ubuntu Clinic, Site B, Khayelit-
T cells, leading to a reduction of their polyfunctional capacity. It is sha, between March 2017 and December 2018. This cohort has been
possible that the excessive inflammation triggered by COVID-19 described in detail (62) and the clinical characteristics of the study par-
and TB coinfection underlies the premature functional exhaus- ticipants are shown in Supplemental Table 3. Briefly, 122 adults (age
tion of SARS-CoV-2–specific T cells. Future studies to specifically 25 or older) were included in this study and classified into 4 groups
examine differences in the inflammatory environment between according to their HIV-1 and TB status: LTBI/HIV– (n = 24), LTBI/HIV+
COVID-19 and COVID-19/aTB patients in the blood and lung (n = 30), aTB/HIV– (n = 32), and aTB/HIV+ (n = 36). The median age
would shed more light on the interplay between the 2 diseases. was comparable between the 4 groups (median: 35 years, IQR: 31–45).
Additionally, in countries where the prevalence of latent All active TB cases were sputum Xpert M. tuberculosis/RIF (Cepheid)
M. tuberculosis infection is high, the profound lymphopenia induced positive and had clinical symptoms and/or radiographic evidence of
by SARS-CoV-2 and use of steroids as a treatment for COVID-19 TB. The latent TB group were all asymptomatic, had a positive IFN-γ
could (a) predispose patients to TB reactivation as a consequence release assay (IGRA, QuantiFERON-TB Gold In-Tube), tested sputum
12 J Clin Invest. 2021;131(12):e149125 https://doi.org/10.1172/JCI149125The Journal of Clinical Investigation RESEARCH ARTICLE
Xpert M. tuberculosis/RIF negative, and exhibited no clinical evidence detect SARS-CoV-2–specific T cells using synthetic SARS-CoV-2 Pep-
of active TB. HIV-infected participants with LTBI had a significantly Tivator peptides (Miltenyi Biotec), consisting of 15-mer sequences
lower plasma HIV-1 viral load and higher absolute CD4 count com- with 11 amino acids, overlap covering the immunodominant parts of
pared with the HIV-infected aTB group. These differences were due the spike (S) protein, and the complete sequence of the nucleocapsid
to higher ART usage in the LTBI group compared with the aTB group. (N) and membrane (M) proteins (67). All peptides were combined in
Convalescent COVID-19 donors. Flow cytometry data were also a single pool and used at a final concentration of 1 μg/mL. Briefly,
available from a limited number of COVID-19 convalescent patients 400 μL whole blood was stimulated with the SARS-CoV-2 S, N, and M
(n = 9). These participants were health care workers recruited between protein peptide pool or a pool of 300 M. tuberculosis–derived peptides
July and September 2020 from Groote Schuur Hospital in Cape Town. (Mtb300, 2 μg/mL, provided in-house; ref. 68) at 37°C for 5 hours in
All had a SARS-CoV-2 PCR-positive test, had mild symptoms, and the presence of costimulatory antibodies against CD28 (clone 28.2)
did not require hospitalization. All participants were symptom free at and CD49d (clone L25) (1 μg/mL each; BD Biosciences) and Brefel-
the time of sampling. Blood samples were obtained at a median of 4.7 din-A (10 μg/mL, MilliporeSigma). Unstimulated blood was incubated
weeks after the SARS-CoV-2 PCR test. with costimulatory antibodies, Brefeldin-A, and an equimolar amount
of DMSO. Red blood cell lysis and white cell fixation were performed
Clinical data in a single step using a transcription factor fixation buffer (eBiosci-
At enrollment, participants’ clinical status was assessed according to the ence, Thermo Fisher Scientific) for 20 minutes. Cells were then cryo-
WHO ordinal scale based on their requirements for oxygen and support- preserved in freezing media (50% FBS, 40% RPMI, and 10% dimethyl
ive therapy (34). The WHO scale is the following: WHO 2 is ambulatory sulfoxide) and stored in liquid nitrogen until batched analysis.
with limitation of activities, WHO 3 is hospitalized without requiring
supplemental oxygen, WHO 4 is hospitalized with oxygen therapy by Cell staining and flow cytometry
mask or nasal prongs, WHO 5 is hospitalized and requiring noninvasive Cell staining was performed on cryopreserved cells that were thawed,
ventilation or use of high-flow oxygen devices, WHO 6 is hospitalized washed, and permeabilized with a transcription factor perm/wash buf-
and receiving invasive mechanical ventilation, and WHO 7 is hospi- fer (eBioscience, Thermo Fisher Scientific). Cells were then stained
talized and receiving invasive mechanical ventilation and additional at room temperature for 45 minutes with antibodies for CD3 BV650
organ support such as extracorporeal membrane oxygenation. Absolute (OKT3, BioLegend), CD4 BV785 (OKT4, BioLegend), CD8 BV510
CD4 count (for HIV-infected patients) and WCC were obtained from (RPA-8, BioLegend), CD19-BV750 (HIB19, BioLegend), CD45RA
patients’ medical files from the date closest to research blood collection. Alexa Fluor 488 (HI100, BioLegend), CD27 PE-Cy5 (1A4CD27, Beck-
CRP, ferritin, D-dimer, LDH, and HIV-1 viral load were measured from man Coulter), CD38 APC (HIT2, BD Biosciences), HLA-DR BV605
blood collected at enrollment. All clinical tests were performed by the (L243, BioLegend), Ki67 PerCP-Cy5.5 (B56, BD Biosciences), PD-1
South African National Health Laboratory Services (NHLS). Postero- PE (J105, eBioscience, Thermo Fisher Scientific), GrB BV421 (BG11,
anterior chest radiographs were assessed for the total percentage of the BD Biosciences), IFN-γ BV711 (4S.B3, BioLegend), TNF-α PE-Cy7
lung fields unaffected by any visible pathology. Thus, in the COVID-19 (MAB11, BioLegend), and IL-2 PE/Dazzle 594 (MQ1-17H12, BioLeg-
group, this score quantified the percentage of normal lung that was not end). Samples were acquired on a BD Biosciences LSR II and analyzed
visibly affected by known features of COVID-19 pneumonia on the using FlowJo v9.9.6. A positive response was defined as any cytokine
radiograph. In patients with TB or other respiratory infections, this score response that was at least twice the background of unstimulated cells.
similarly quantified the percentage of normal lung not visibly affected To define the phenotype of SARS-CoV-2–specific CD4+ T cells, a cut-
by the relevant pathology on the radiograph. Individuals with a normal off of 20 events was used.
chest radiograph would thus score 100%.
Statistics
Measurement of SARS-CoV-2 nucleocapsid–specific IgG in plasma Graphical representations were performed in Prism (v9; GraphPad
SARS-CoV-2–specific antibodies were assayed by the Elecsys anti– Software) and JMP (v14.0.0; SAS Institute). Statistical tests were per-
SARS-CoV-2 immunoassay (Roche). This semiquantitative elec- formed in Prism. Nonparametric tests were used for all comparisons.
trochemiluminescent immunoassay measures SARS-CoV-2 nucle- The Kruskal-Wallis test with Dunn’s multiple-comparison test was
ocapsid–specific IgG. The assay was performed by the NHLS and used for group comparisons, and the Mann-Whitney and Wilcox-
interpreted according to manufacturer’s instructions (Roche, V 1.0 on’s matched-pair test were used for unmatched and paired samples,
2020-05). Results are reported as numeric values in form of a cutoff respectively. P values less than 0.05 were considered to indicate sta-
index (signal sample/cutoff), where a cutoff index less than 1.0 corre- tistical significance.
sponds to nonreactive plasma and a cutoff index of 1.0 or greater to
reactive plasma. At 14 days after SARS-CoV-2 PCR confirmation, the Study approval
sensitivity and specificity of the Elecsys anti–SARS-CoV-2 immuno- This study was approved by the University of Cape Town’s Faculty of
assay is reported as 99.5% (95% CI, 97.0% to 100.0%) and 99.80% Health Sciences Human Research Ethics Committee (207/2020 and
(95% CI, 99.69% to 99.88%), respectively (63–65). 050/2015), and written informed consent was obtained from all par-
ticipants with the capacity to provide it. Relatives provided proxy con-
Whole blood–based T cell detection assay sent for participants without capacity to consent for themselves (e.g.,
Blood was collected in sodium heparin tubes and processed within because of decreased level of consciousness). In cases where partic-
3 hours of collection. The whole-blood assay was adapted from the ipants regained capacity, informed consent was obtained from them
protocol described by Hanekom et al. (66). We adapted this assay to directly at that time.
J Clin Invest. 2021;131(12):e149125 https://doi.org/10.1172/JCI149125 13You can also read