Non-random Mis-segregation of Human Chromosomes - UCL Discovery
←
→
Page content transcription
If your browser does not render page correctly, please read the page content below
Article

Non-random Mis-segregation of Human
Chromosomes
Graphical Abstract                                             Authors
                                                               Joseph Thomas Worrall, Naoka Tamura,
                                                               Alice Mazzagatti, ..., Elina Vladimirou,
                                                               Floris Foijer, Sarah Elizabeth McClelland

                                                               Correspondence
                                                               s.mcclelland@qmul.ac.uk

                                                               In Brief
                                                               Worrall et al. show that individual human
                                                               chromosomes can respond differently to
                                                               defects in mitosis that lead to
                                                               chromosome mis-segregation. Following
                                                               nocodazole washout, chromosomes 1
                                                               and 2 are particularly prone to a
                                                               weakening of centromeric cohesion and
                                                               elevated rates of chromosome lagging
                                                               during anaphase.

Highlights
d   Aneuploidy rates vary between chromosomes after drug-
    induced mis-segregation

d   Chromosomes 1 and 2 comprise a large proportion of
    anaphase lagging chromosomes

d   Mitotic delay and cohesion fatigue drive chromosome mis-
    segregation

d   Chromosomes 1 and 2 are particularly prone to cohesion
    fatigue

           Worrall et al., 2018, Cell Reports 23, 3366–3380
           June 12, 2018 ª 2018 The Author(s).
           https://doi.org/10.1016/j.celrep.2018.05.047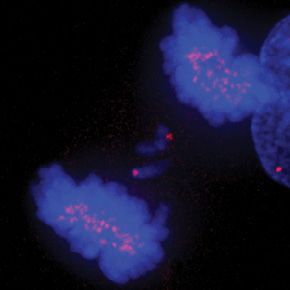
Cell Reports

                                                                                                                    Article

Non-random Mis-segregation of Human Chromosomes
Joseph Thomas Worrall,1,4 Naoka Tamura,1,4 Alice Mazzagatti,1 Nadeem Shaikh,1 Tineke van Lingen,1 Bjorn Bakker,2
Diana Carolina Johanna Spierings,2 Elina Vladimirou,3 Floris Foijer,2 and Sarah Elizabeth McClelland1,5,*
1Barts  Cancer Institute, Queen Mary University of London, London EC1M 6BQ, UK
2European   Research Institute for the Biology of Ageing, University of Groningen, University Medical Center Groningen, A. Deusinglaan 1,
Groningen 9713, the Netherlands
3UCL Cancer Institute, University College London, 72 Huntley Street, London WC1E 6DD, UK
4These authors contributed equally
5Lead Contact

*Correspondence: s.mcclelland@qmul.ac.uk
 https://doi.org/10.1016/j.celrep.2018.05.047

SUMMARY                                                                rescence in situ hybridization (FISH) of centromere-targeted
                                                                       probes is low throughput and subject to significant artifacts (Fag-
A common assumption is that human chromosomes                          gioli et al., 2012; Fenech, 2007; Knouse et al., 2014; Valind et al.,
carry equal chances of mis-segregation during                          2013; van den Bos et al., 2016), limiting the resolution of previous
compromised cell division. Human chromosomes                           efforts to examine biased mis-segregation (Brown et al., 1983;
vary in multiple parameters that might generate                        Evans and Wise, 2011; Fauth et al., 1998; Hovhannisyan et al.,
bias, but technological limitations have precluded a                   2016; Spence et al., 2006; Torosantucci et al., 2009; Xi et al.,
                                                                       1997). New technologies such as next-generation sequencing-
comprehensive analysis of chromosome-specific
                                                                       based methods (Bakker et al., 2016; van den Bos et al., 2016)
aneuploidy. Here, by imaging specific centromeres
                                                                       are still expensive and technically challenging (Bakker et al.,
coupled with high-throughput single-cell analysis                      2015; Gao et al., 2016; Knouse et al., 2014). To resolve this we
as well as single-cell sequencing, we show that                        analyzed individual chromosome aneuploidy rates in a high-
aneuploidy occurs non-randomly following common                        throughput manner and in the absence of fitness effects and
treatments to elevate chromosome mis-segregation.                      selection. We used the ImageStreamX cytometer to quantify
Temporary spindle disruption leads to elevated mis-                    FISH-marked centromeres in thousands of single cells, following
segregation and aneuploidy of a subset of chromo-                      induction of chromosome mis-segregation using nocodazole
somes, particularly affecting chromosomes 1 and 2.                     washout. We show that resulting aneuploidy in daughter cells
Unexpectedly, we find that a period of mitotic delay                   is non-random and validate our findings using single-cell
weakens centromeric cohesion and promotes chro-                        sequencing. Interestingly, chromosomes 1 and 2 are highly
                                                                       prone to lagging at anaphase following nocodazole washout,
mosome mis-segregation and that chromosomes 1
                                                                       and this occurs in multiple non-transformed cell types. We find
and 2 are particularly prone to suffer cohesion
                                                                       that these chromosomes are inherently susceptible to cohesion
fatigue. Our findings demonstrate that inherent                        fatigue that results in elevated lagging at anaphase and aneu-
properties of individual chromosomes can bias chro-                    ploidy in daughter cells.
mosome mis-segregation and aneuploidy rates, with
implications for studies on aneuploidy in human                        RESULTS
disease.
                                                                       High-Throughput Screening Using the ImageStreamX
INTRODUCTION                                                           Cytometer Reveals Non-random Aneuploidy following
                                                                       Induction of Chromosome Mis-segregation
Aneuploidy—deviation from a multiple of the haploid chromo-            We examined aneuploidy rates in diploid h-TERT-immortalized
some number—is the leading cause of spontaneous miscarriage            human retinal pigment epithelium cells (RPE1). Non-transformed
and birth defects in humans (Nagaoka et al., 2012) and repre-          human cells exhibit very low rates of spontaneous chromosome
sents a key hallmark of cancer, in which recurrent patterns of         segregation errors, so we disrupted the fidelity of cell division to
aneuploidy are observed (Ben-David et al., 2016; Duijf et al.,         elevate chromosome mis-segregation and allow the detection of
2013; Taylor et al., 2018). Human chromosomes vary widely in           bias between chromosomes. We used a nocodazole shake-off
size, gene density, interphase nuclear territory, and heterochro-      and washout treatment to promote chromosome segregation
matin distribution (Figure 1A; Table S1). However, the question of     errors (Figure 1B) due to formation of merotelic attachments (Ci-
whether these or additional characteristics generate bias in           mini et al., 2001; Zhang et al., 2015), a key proposed driver of
mis-segregation rates has not been answered to date, because           chromosome mis-segregation and aneuploidy in cancer (Ba-
high-throughput methods to analyze chromosome-specific                 khoum et al., 2009; Ertych et al., 2014). To determine aneuploidy
aneuploidy were lacking. The standard approach to measure              rates independently of selection effects, we analyzed cells 12 hr
aneuploidy, manual scoring of chromosome number using fluo-            after nocodazole washout and shake-off, verifying that this

3366 Cell Reports 23, 3366–3380, June 12, 2018 ª 2018 The Author(s).
This is an open access article under the CC BY license (http://creativecommons.org/licenses/by/4.0/).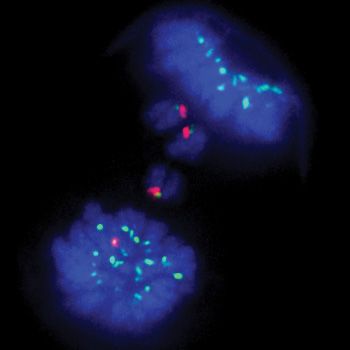
A

                B

    C   D           E                      F

G           H

    I

                                                    (legend on next page)

                        Cell Reports 23, 3366–3380, June 12, 2018 3367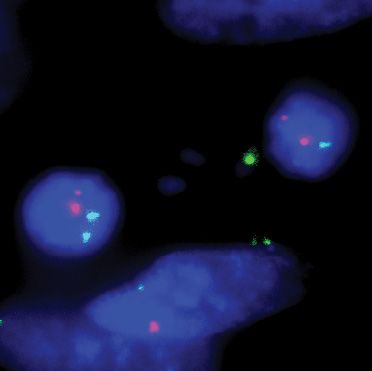
procedure does not affect cell viability (Figures 1C–1F, S1A, and                mosome aneuploidy rates were occasionally skewed toward
S1B). Live-cell imaging and fluorescence-activated cell sorting                  loss in both ImageStream and SCS. This is likely due to disrup-
(FACS)-based cell cycle profiling revealed that at this time point,              tion of cytoplasmic micronuclei (MN) formed from lagging
cells have exited mitosis and are mainly in G1, without cell death               chromosomes during preparation for aneuploidy analysis
or further division events that could influence population                       (Crasta et al., 2012; Thompson and Compton, 2011) (Video S1;
aneuploidy rates (Figures S1C–S1F; Video S1). We used the                        Figures S1C and S1D), as we observed fewer MN after prepara-
ImageStreamX Mark II cytometer (hereafter ImageStream), an                       tion for ImageStream analysis (Figures S3B–S3D). There was no
imaging flow cytometer previously used to detect monosomy                        obvious enrichment of aneuploidy for chromosomes that were
and trisomy in peripheral blood mononuclear cells with high                      refractory to ImageStream analysis (chromosomes 4, 5, 13, 14,
accuracy (Minderman et al., 2012), to analyze aneuploidy                         19, 21, and 22) with SCS (Figure 1I), but we cannot exclude
frequencies of individual chromosomes marked with centro-                        potential bias for these chromosomes below the limit of detec-
mere-specific FISH probes. This approach has advantages                          tion. Combining ImageStream analysis with SCS therefore dem-
over conventional FISH-based methods; a ‘‘FISH-in suspen-                        onstrates that specific chromosomes are prone to aneuploidy
sion’’ procedure improves signal-to-noise ratio, thousands of                    following the induction of chromosome mis-segregation using
cells per sample are analyzed, and centromere number is                          nocodazole washout, with chromosomes 1, 2, and 3 consistently
determined using both automated spot counting and fluores-                       affected.
cence intensity measurements (Minderman et al., 2012) (see
Experimental Procedures; Figure S2). We were able to analyze                     Chromosomes 1 and 2 Exhibit High Rates of Lagging at
the majority of the 23 human chromosomes except for a subset                     Anaphase in Multiple Non-transformed Cell Types
of human chromosomes that lacks sufficiently unique pericen-                     To examine whether chromosome-specific aneuploidy was re-
tromeric sequence to generate specific centromeric FISH                          flected in chromosome lagging rates, nocodazole-treated
probes (chromosomes 4, 5, 13, 14, 19, 21, and 22; Table S2).                     RPE1 cells were released for 1 hr to observe anaphases (Figures
As expected we observed an increase in overall aneuploidy                        S4A, S4B, 2A, and 2B). We performed FISH with specific centro-
following nocodazole washout (Figures 1G and 1H). Chi-square                     mere probes and determined the frequency of lagging of a panel
testing revealed that aneuploidy rates varied more than ex-                      of chromosomes. Strikingly, chromosomes 1 and 2 were found
pected if chromosome mis-segregation rates were equal be-                        lagging in 56.4 ± 9% and 25.8 ± 2% of anaphases with errors
tween chromosomes (p < 10 6; see Supplemental Experimental                       (Figures 2A–2C) and constituted 23.3 ± 7% and 10.9 ± 3% of
Procedures). To identify specific chromosomes that deviated                      lagging chromatids, respectively, significantly higher than the
significantly from expected rates, we used post hoc binomial                     4.3% expected (p < 0.00005, chi-square test; Figure 2D). This
tests, Bonferroni corrected for multiple testing, which indicated                indicates that more than a third of lagging chromatids following
that chromosomes 1, 2, 3, 7, and 10 were affected significantly                  nocodazole washout are due to just two chromosomes and ex-
more than expected following nocodazole washout (Figure 1H,                      plains the consistently elevated aneuploidy of chromosomes 1
red dots). A subset of chromosomes was also affected signifi-                    and 2. Aneuploidy rates in daughter cells are lower than lagging
cantly less than expected (chromosomes 8, 11, 16, and X; Fig-                    rates because merotelically attached lagging chromosomes are
ure 1H, open circles). To validate ImageStream aneuploidy                        often resolved to the correct daughter cell (Cimini et al., 2004;
analysis, we performed single-cell sequencing (SCS) and aneu-                    Thompson and Compton, 2011). Nocodazole washout also en-
ploidy detection using AneuFinder (Bakker et al., 2016), which                   riched lagging of chromosomes 1 and 2 in BJ cells, primary
corroborated elevated aneuploidy for chromosomes 1, 2, and                       human umbilical endothelial cells (HUVEC), and h-TERT-immor-
3 following nocodazole washout (Figures 1I and S3A). SCS did                     talized fallopian epithelial cells (FNE1) (Figures 2E–2H and S4C–
not detect elevated aneuploidy for chromosomes 7 or 10,                          S4J). These data demonstrate that chromosomes 1 and 2 are
potentially because of the smaller number of cells analyzed or                   highly prone to chromosome mis-segregation following nocoda-
an artifact of the ImageStream analysis. We noticed that chro-                   zole washout, and this is common to multiple non-transformed

Figure 1. Chromosome Mis-segregation Induced by Nocodazole Washout Leads to Non-random Aneuploidy
(A) Cartoon illustrating a selection of known chromosomal attributes (Cremer and Cremer, 2010). Gene density (number of genes divided by length of chro-
mosome [Mb]) was divided equally into five groups.
(B) Immunofluorescence image and quantification of segregation errors from RPE1 anaphase cells following nocodazole washout. Centromeres marked by
CREST anti-sera. Mean and SD from three independent experiments is shown. Scale bar in this and all following images represents 5 mm.
(C) Experimental workflow for (D)–(F).
(D) Quantification of percentage annexin V+ (early apoptotic) and annexin V+ DAPI+ cells (late apoptotic) analyzed by flow cytometry.
(E) Representative trypan blue cell viability assay of RPE1 cells treated with 8 hr nocodazole, then released for times indicated.
(F) RPE1 cells stably expressing H2B-RFP were filmed following release from 8 hr nocodazole. Cell death rates were quantified from two independent movies.
(G and H) ImageStream analysis of RPE1 cells untreated (G) or treated with nocodazole washout (H). Dots represent independent experiments. Red dots and
open circles mark chromosomes with aneuploidy rates significantly higher and lower than expected, respectively, using chi-square analysis. Dashed lines
indicate mean aneuploidy rates. Number of cells analyzed (3103) per chromosome is indicated in lower box. Chromosome 15 is marked by an asterisk because it
was identified as significantly more aneuploid than expected by chance in both conditions. Therefore we cannot exclude possible low-level stable aneuploidy for
this chromosome.
(I) Percentage cells exhibiting whole aneuploidy events were collated from SCS data analyzed using AneuFinder (four independent experiments; 44 control and
144 nocodazole washout treated cells in total).
See also Figures S1–S3.

3368 Cell Reports 23, 3366–3380, June 12, 2018
A B C
D
E F G
H
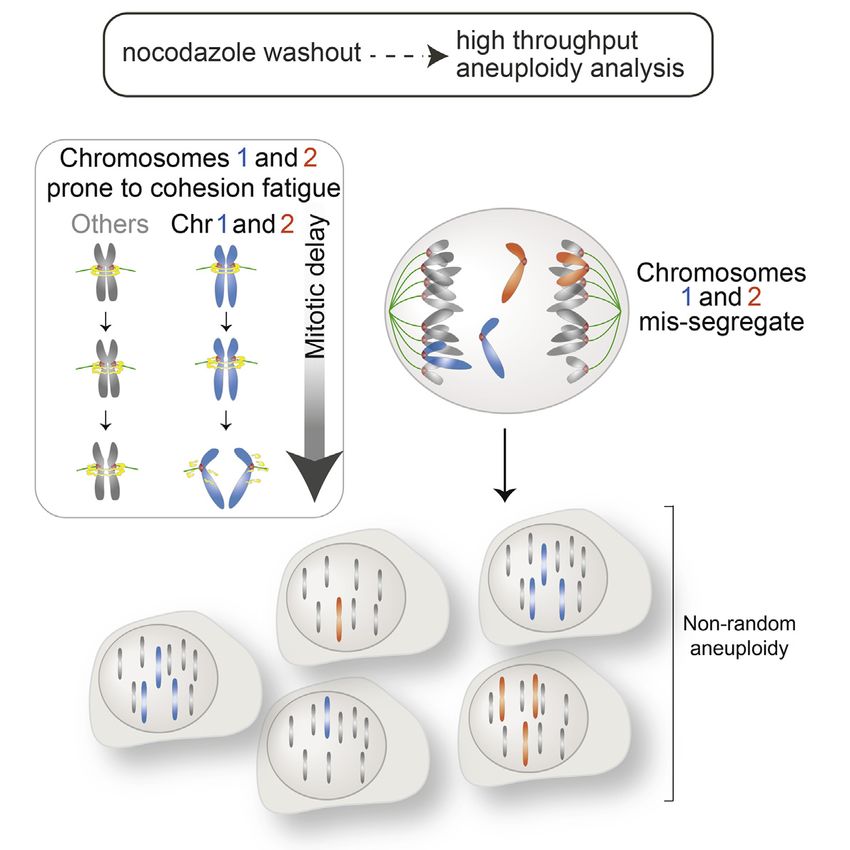
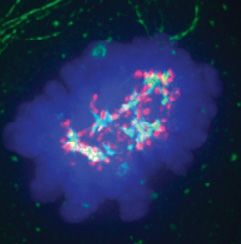
Figure 2. Chromosomes 1 and 2 Are Highly Prone to Lagging After Nocodazole Washout
(A) RPE1 cells were treated with 8 hr nocodazole, then released for 1 hr before FISH with specific centromere enumeration probes as indicated.
(B) Segregation error rates and average number of lagging chromosomes (errors) per erroneous anaphase.
(C) Percentage erroneous RPE1 anaphases (one or more lagging chromosomes) exhibiting lagging of chromosomes indicated.
(D) Quantification of percentage of lagging chromatids that are the chromosome indicated from erroneous anaphases. Total lagging chromatids were scored using
DAPI-positive chromatid counting. Expected frequency is calculated using 1/23, assuming a random distribution among the 23 human chromosomes. (C) and (D)
show mean ± SD of three independent experiments (except chromosome 17; two experiments), 268–481 lagging chromosomes analyzed per chromosome.
(E) FISH of BJ cells after nocodazole treatment as in (A).
(F) Segregation error rates and average number of errors per erroneous anaphase.
(G) Percentage erroneous BJ anaphases exhibiting lagging of chromosomes indicated.
(H) Quantification of percentage of lagging chromatids that are the chromosome indicated from erroneous anaphases (144–307 lagging chromosomes analyzed
per chromosome).
All experiments show mean ± SD of at least three independent experiments unless otherwise stated. **p < 0.005 and ****p < 0.00005 (chi-square test; see
Supplemental Experimental Procedures).
cell types. Importantly, these data further establish the existence and SCS, was prone to lagging in BJ cells but not RPE1 cells.
of biased chromosome mis-segregation by directly analyzing This could be due to this chromosome’s becoming aneuploid
mitotic events before any selection effects can manifest. Chro- through a mechanism other than lagging at anaphase or that
mosome 3, although detected as aneuploid in ImageStream we could not detect lagging of this chromosome at the time point
Cell Reports 23, 3366–3380, June 12, 2018 3369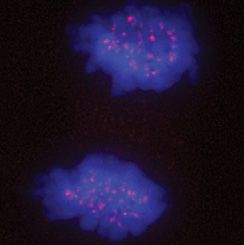
A

                                                                                                                                B

C                                                                                        D                          E

F

                                                                                     G                              H

Figure 3. Biased Mis-segregation of Chromosomes 1 and 2 Is Not Dependent on Kinetochore Expansion
(A) Immunofluorescence images of RPE1 cells treated with monastrol or nocodazole for 8 hr as indicated, stained with antibodies to mark centromeres (CREST
serum, red) and outer kinetochores (CENP-E, green).
(B) Kinetochore size quantification.
(C) RPE1 cells were treated with 8 hr monastrol, then released for 1.5 hr before FISH with specific centromere enumeration probes as indicated.
(D) Segregation error rates and average number of lagging chromosomes per erroneous anaphase.

                                                                                                                        (legend continued on next page)

3370 Cell Reports 23, 3366–3380, June 12, 2018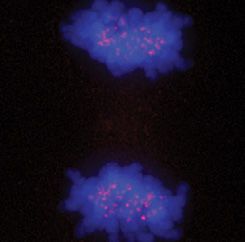
analyzed in these cells. We therefore concentrated on under-                 chromosomes to allow accurate analysis of biased mis-segrega-
standing the molecular mechanism underlying the sensitivity of               tion. In fact, we noticed a linear relationship between time spent
chromosomes 1 and 2 to mis-segregation following nocodazole                  in nocodazole-induced prometaphase and total lagging chromo-
washout.                                                                     some rates (Figure 4B). This was not due to incomplete MT
                                                                             depolymerization, as mitotic cells displayed efficient loss of
Chromosome 1 and 2 Lagging Is Not Dependent upon                             MTs after all nocodazole treatment times (Figures 4A and
Kinetochore Expansion during Nocodazole Treatment                            S6B). This was also not due to fewer cells affected by nocoda-
Nocodazole treatment abolishes microtubule (MT)-kinetochore                  zole, as live-cell imaging of prometaphase cells released from
attachments and leads to kinetochore expansion, the enlarge-                 nocodazole-induced mitotic arrest exhibited the same relation-
ment of the outer layer of the kinetochore (Hoffman et al.,                  ship between length of nocodazole treatment and rate of
2001; Thrower et al., 1996; Wynne and Funabiki, 2015). To test               segregation errors (Figures S6C and S6D). A similar phenome-
whether this phenomenon could explain biased mis-segrega-                    non was also observed following Eg5 inhibition and release
tion, we induced chromosome mis-segregation in the absence                   (Figures S6E and S6G). These findings suggested that mitotic
of MT depolymerization. For this we inhibited Eg5 kinesis using              delay during nocodazole or monastrol treatment is an important
monastrol, which prevents centrosome separation at prophase                  cause of chromosome mis-segregation. To test this, we induced
and thus leads to monopolar spindles. Upon drug washout,                     mitotic delay in the absence of spindle defects by treating cells
spindles reform in a manner that promotes merotelic attachment               with the proteasome inhibitor MG132 to prevent anaphase
(Kapoor et al., 2000). Compared with nocodazole treatment,                   onset. Prolonged treatment with MG132 can lead to multipolar
monastrol-treated cells displayed significantly lower kinetochore            spindles and premature sister chromatid separation that irre-
expansion as measured by CENP-E-marked outer kinetochore                     versibly activates the mitotic checkpoint (Daum et al., 2011;
size (Figures 3A and 3B), in agreement with previous studies                 Lara-Gonzalez and Taylor, 2012). To circumvent this, we limited
demonstrating that the majority of kinetochores remain attached              MG132 treatment to 5 hr before washout and only analyzed
syntelically to MTs upon Eg5 inhibition (Kapoor et al., 2000) and            lagging chromosomes from bipolar anaphases. Interestingly,
that expansion is not observed in Xenopus (Wynne and Funabiki,               this treatment significantly elevated chromosome segregation
2016) or human cells under these conditions (Sacristan et al.,               errors compared with control cells (from 1.3 ± 1.5% to 22.5 ±
2018). Monastrol washout treatment induced similar total lag-                2.4%; Figures 4C and 4D). The addition of a brief treatment
ging chromosome rates and also significantly enriched lagging                with nocodazole before MG132 washout slightly increased the
of chromosomes 1 and 2 (Figures 3C–3E), suggesting that                      error rate (from 22.5 ± 2.4% to 29.75 ± 3.4%; Figure 4D). This
this bias is independent of extensive kinetochore expansion                  suggests that both abnormal spindle formation and mitotic delay
associated with nocodazole treatment. Furthermore, expanded                  contribute to promote anaphase lagging. We then analyzed
kinetochores did not differ in size or intensity at chromosome 1             chromosome-specific lagging rates and observed that MG132-
compared with other chromosomes after nocodazole treatment                   induced mitotic delay was sufficient to significantly enrich
(Figures 3F–3H and S5). These data suggest that the enrichment               lagging of chromosomes 1 and 2 (Figures 4E and 4F). Taken
of chromosome 1 and 2 lagging is unlikely to be due to chromo-               together, these data suggest that mitotic delay is a major
some-specific differences in kinetochore expansion.                          contributor to mis-segregation induced by nocodazole or Eg5
                                                                             inhibitor washout treatments and that this delay itself introduces
Chromosomes 1 and 2 Are Prone to Lagging following                           the bias for chromosome 1 and 2 lagging.
Mitotic Delay
We then asked which aspect of nocodazole or monastrol treat-                 Cohesion Fatigue Contributes to Mitotic Delay-Induced
ment was responsible for elevated lagging of chromosomes 1                   Chromosome Mis-segregation
and 2. Both treatments include passage through abnormal spin-                A known consequence of delay in mitosis is gradual failure of the
dle geometry intermediates and a period of mitotic delay,                    cohesive force holding sister chromatids together, ‘‘cohesion
commonly used to elevate the number of anaphase cells avail-                 fatigue,’’ that can lead to premature sister chromatid separation
able for analysis. To dissect the relative contributions of mitotic          (PSCS) (Daum et al., 2011; Manning et al., 2010; Stevens et al.,
delay and abnormal spindle geometry, we set out to analyze spe-              2011; van Harn et al., 2010). These studies suggested that MT
cific chromosome lagging rates after abnormal spindle formation              pulling forces are required for cohesion fatigue. However, it
but in the absence of mitotic delay. We treated cells with the               has also been shown that increasing prometaphase delay in
minimum nocodazole treatment period required to fully disas-                 the absence of bipolar kinetochore attachment in INCENP-
semble all MTs (30 min; Figure S6A) before washout. Interest-                variant cells can increase rates of subsequent PSCS following
ingly segregation error rates increased only slightly (from 1.9 ±            re-establishment of a bipolar spindle (Hengeveld et al., 2017).
3% to 8.1 ± 6%; Figures 4A and 4B), resulting in too few lagging             To test whether our nocodazole treatment conditions could

(E) Quantification of percentage of lagging chromatids that are the chromosome indicated from erroneous anaphases (77–299 lagging chromosomes analyzed
per chromosome).
(F) Immunofluorescence-FISH images of cells treated with nocodazole for 8 hr and stained with CREST sera, anti-CENP-E, and FISH using CEP1.
(G and H) Quantification of outer kinetochore intensity (G) or expanded kinetochore size (H) at chromosome 1 compared with other chromosomes after 8 hr
nocodazole.
All experiments show mean ± SD of at least three independent experiments. **p < 0.005 and ****p < 0.00005. See also Figure S5.

                                                                                                Cell Reports 23, 3366–3380, June 12, 2018 3371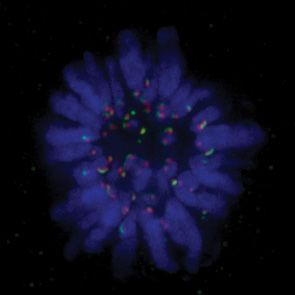
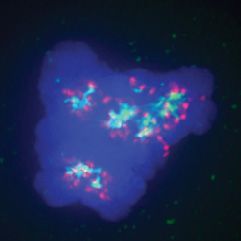
A                                                                 B                         C                                          D

E                                                        F

Figure 4. Chromosomes 1 and 2 Are Prone to Lagging following Mitotic Delay
(A) Immunofluorescence of RPE1 cells treated with nocodazole for times indicated before fixing (top) or releasing for 1 hr, then fixing (bottom).
(B) Quantification of anaphase lagging rates from (A).
(C) Immunofluorescence images of cells treated as indicated.
(D) Quantification of anaphase lagging rates from (C).
(E) Cells were treated as in (C) and (D) before FISH with centromere enumeration probes as indicated.
(F) Quantification of percentage lagging chromosomes (113–298 total lagging chromosomes analyzed) that are chromosomes 1 and 2.
All experiments show mean ± SD of at least three independent experiments. ***p < 0.0005 and ****p < 0.00005 (chi-square test).

prime chromosomes for subsequent cohesion fatigue, we                             tances caused by 8 hr nocodazole treatment at centromeres
treated cells with nocodazole for increasing time before washout                  generally and at chromosomes 1 and 2 (Figures 5D and 5E).
into MG132, to allow chromosome-MT attachments to form but                        Wapl depletion also significantly reduced rates of anaphase
prevent anaphase onset. Pre-treatment with 8 hr of nocodazole                     lagging caused by nocodazole washout both globally and of
led to a significant increase in metaphases with scattered                        chromosomes 1 and 2 (Figures 5F and 5G). Wapl depletion did
chromosomes indicating PSCS (Daum et al., 2011; Stevens                           not fully rescue lagging rates, potentially because of MT pulling
et al., 2011) (Figures 5A and 5B). Scattering was increased                       forces counteracting the protection from siWapl. It is also
further in cells treated with MG132 alone for 8 hr, in agreement                  possible that additional mechanisms operate alongside cohe-
with previous studies demonstrating that dynamic MTs during                       sion fatigue to drive biased mis-segregation of chromosomes 1
the arrest period are required for maximal PSCS (Daum et al.,                     and 2. Mitotic delay induced by nocodazole, Eg5 inhibitors, or
2011; Stevens et al., 2011). We next tested whether cohesion fa-                  MG132 therefore leads to a deterioration of centromeric
tigue was a factor in mitotic delay-induced chromosome mis-                       cohesion and a concomitant increase in chromosome lagging
segregation. We depleted the negative regulator of cohesion                       that can be partially counteracted by increasing the stability of
Wapl (Gandhi et al., 2006; Kueng et al., 2006) using RNAi (Fig-                   cohesion on DNA.
ure 5C) to enhance the stability of cohesion on DNA. This was
shown previously to reduce rates of chromosome scattering at                      Chromosomes 1 and 2 Are Particularly Prone to
metaphase (Daum et al., 2011; Lara-Gonzalez and Taylor,                           Cohesion Fatigue
2012; Stevens et al., 2011). Increased inter-centromere distance                  Next, we tested the predisposition of individual chromosomes
is a marker for reduced cohesion (Manning et al., 2010). Accord-                  to cohesion fatigue following nocodazole treatment by
ingly Wapl depletion rescued elevated inter-centromere dis-                       analyzing chromosome-specific rates of PSCS in metaphases

3372 Cell Reports 23, 3366–3380, June 12, 2018
A               B

    C   D

E

    F       G

                                            (legend on next page)

                Cell Reports 23, 3366–3380, June 12, 2018 3373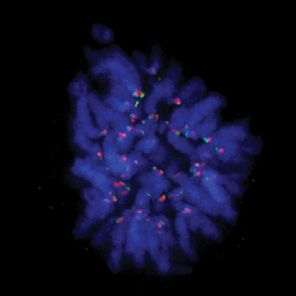
that displayed chromosome scattering. Strikingly, chromo-                         DISCUSSION
somes 1 and 2 were particularly prone to PSCS after 8 hr
nocodazole pre-treatment compared with other chromosomes                          We demonstrate that chromosome mis-segregation and aneu-
(Figures 6A and 6B). Additionally metaphase spreads revealed                      ploidy are non-randomly distributed among human chromo-
greater inter-centromere distance at chromosome 1 compared                        somes following induction of aneuploidy using drug-induced
with chromosome 6, which increased with longer treatment                          mitotic delay and Mps1 inhibition. Treatments that induce mitotic
with nocodazole, and a higher incidence of separated chromo-                      delay lead to cohesion fatigue and anaphase lagging and a bias
some 1 sister chromatids following 8 hr nocodazole (Figures                       for chromosomes 1 and 2, even in the absence of spindle
S7A and S7B). Cohesion fatigue has been observed after                            defects. We also show that chromosomes 1 and 2 are particu-
only short periods of mitotic arrest (Daum et al., 2011;                          larly vulnerable to cohesion fatigue, suggesting that an inherent
Stevens et al., 2011). Accordingly, despite lower absolute                        susceptibility to cohesion fatigue may contribute to biased
rates of chromosome scattering and lagging (Figures 4B                            mis-segregation and aneuploidy observed following nocodazole
and 5B), bias toward chromosomes 1 and 2 was evident                              washout. This insight into the mechanisms and bias of chromo-
in both PSCS and anaphase lagging after only 2 hr nocoda-                         some mis-segregation caused by mitotic delay is particularly
zole washout (Figures 6C and 6D). Importantly, this demon-                        relevant for studies using nocodazole or monastrol washouts
strates that enriched lagging of chromosomes 1 and 2 is                           to induce chromosome mis-segregation and also has clinical
promoted by even brief periods of mitotic arrest that could                       relevance because of the widespread use of common cancer
be relevant in cancer cells (Potapova and Gorbsky, 2017).                         chemotherapeutics such as vincristine and paclitaxel, which
Taken together, these data suggest that mitotic delay leads                       arrest cells in mitosis for prolonged periods.
to weakened cohesion that (1) cannot resist MT pulling forces
upon subsequent metaphase delay, (2) promotes incorrect                           Cohesion Fatigue Induced by Mitotic Delay Promotes
kinetochore-MT attachment and anaphase lagging, and (3)                           Chromosome Mis-segregation and Specifically Affects
particularly affects chromosomes 1 and 2 (see model in                            Chromosomes 1 and 2
Figure 6E).                                                                       The mechanisms linking mitotic delay, cohesion fatigue, and
                                                                                  anaphase lagging are poorly understood. Cohesion fatigue could
Different Mechanisms Promoting Mis-segregation                                    elevate chromosome mis-segregation because of effects on
Induce Distinct Biases                                                            centromeric geometry or flexibility that might increase merotelic
Finally, we assessed whether inducing chromosome mis-                             attachment rate (Sakuno et al., 2009). It has also been suggested
segregation by a different means would also lead to biased                        that stretched inter-kinetochore distance seen in mild cohesion
mis-segregation. We treated cells with reversine, a small-mole-                   fatigue (i.e., before complete PSCS) could displace high inner
cule inhibitor of the mitotic checkpoint kinase Mps1 that                         centromeric aurora B, leading to increased incidence of mero-
promotes chromosome mis-segregation through impairing cor-                        telic attachment (Sapkota et al., 2017). Alternatively, because
rect outer kinetochore regulation and simultaneously disrupting                   multiple studies have demonstrated an intricate interplay
mitotic checkpoint signaling (Santaguida et al., 2010). This                      between chromosome cohesion factors and regulation of the
treatment induced similar overall lagging chromosome rates                        chromosomal passenger complex (CPC), responsible for error
compared with nocodazole washout (Figures 7A and 7B), but                         correction (reviewed in Trivedi and Stukenberg, 2016; Mirkovic
the pattern of bias was different from that observed following                    and Oliveira, 2017; Kleyman et al., 2014), it is possible that
nocodazole or monastrol washout; Chromosome 1 lagging                             cohesion fatigue might prevent efficient correction of mal-
was significantly reduced (Figures 7C and 7D), and chromo-                        attachments by improper regulation of the CPC. A key remaining
somes 17 and 18 were now significantly enriched (Figure 7C).                      question is what features of centromeres at chromosomes 1 and
These data suggest that different methods to induce chromo-                       2 explain their propensity to undergo cohesion fatigue. It is
some mis-segregation generate different biases, which could                       possible that differences in centromeric composition underlie
reflect either differences in the nature of lagging chromosomes                   this sensitivity. Of note, large regions of pericentric heterochro-
produced (e.g., unattached or merotelic) or different mecha-                      matin have been identified at the q arms of chromosomes 1, 3,
nistic origins of kinetochore mal-attachment between these                        4, 9, 16, and 19 (Atkin and Brito-Babapulle, 1981; Craig-Holmes
conditions.                                                                       and Shaw, 1971) (Figure 1A), although it is not clear whether the

Figure 5. Cohesion Fatigue Contributes to Mitotic Delay-Induced Chromosome Mis-segregation
(A and B) Representative images (A) and quantification (B) of RPE cells that were treated with nocodazole as indicated then released into MG132 for 2 hr, or
treated with MG132 for 8 hr, before scoring percentage of cells with unaligned chromosomes.
(C) RPE1 cells were treated with small interfering RNA (siRNA) (non-targeting or against Wapl) for 48 hr before western blotting with Wapl antibody (alpha-tubulin
used as loading control).
(D and E) Representative images (D) and quantification (E) of RPE cells that were treated with siRNA (non-targeting or against Wapl) before treatment with 8 hr
nocodazole (48 hr siRNA in total), then FISH using PNA (peptide nucleic acid) centromere-targeted probes (red) and specific centromere probes as indicated in
green. Note that no PNA signal was visible at centromere 1, so these measurements were made using the centromere-specific probe signal.
(F) RPE1 cells were treated with siRNA (non-targeting or against Wapl) for 39 hr before 8 hr nocodazole, washout for 1 hr (48 hr siRNA in total), then FISH with
centromere probes as indicated.
(G) Percentage total anaphases with errors in any chromosome or specific chromosomes were analyzed as indicated.
All experiments show mean ± SD of at least three experiments. See also Figure S7.

3374 Cell Reports 23, 3366–3380, June 12, 2018
A B
C D
E
Figure 6. Chromosomes 1 and 2 Are Particularly Prone to Cohesion Fatigue
(A and B) Representative images (A) and quantification (B) of RPE cells that were treated with 8 hr nocodazole, then 2 hr MG132 before FISH with specific
centromere enumeration probes (CEPs) and quantification of PSCS for each chromosome indicated. Erroneous metaphases (one or more unaligned chromo-
somes) exhibiting PSCS of a panel of chromosomes was quantified.
(C) RPE1 cells were treated with 2 hr nocodazole, then 2 hr MG132 before FISH with centromere-specific probes as indicated and quantification of PSCS for each
chromosome indicated.
(D) RPE1 cells were treated with 2 hr nocodazole, then released for 1 hr before FISH with specific centromere enumeration probes and scoring lagging
chromosomes as indicated. All experiments show mean ± SD of three independent experiments.
(E) Model to explain the behavior of chromosomes 1 and 2 during mitotic arrest. Chromosomes 1 and 2 are prone to cohesion fatigue that can manifest as (1)
propensity to lagging at anaphase and resulting aneuploidy in daughter cells or (2) premature sister chromatid separation (PSCS) leading to irreversible mitotic
arrest.
nature of chromosome 1 pericentric heterochromatin differs a ‘‘stronger’’ centromere and that centromere length or size may
qualitatively and how this might render chromosomes prone to need to scale functionally with chromosome length. However, it
cohesion fatigue. has been suggested that drag produced by chromosomes is
negligible in comparison with spindle forces (Civelekoglu-Scho-
Features Underlying Bias in Mis-segregation Rates ley and Scholey, 2010; Nicklas, 1983), so larger chromosomes
Our data suggest that the propensity of chromosomes 1 and 2 to do not necessarily possess a requirement for a stronger
undergo cohesion fatigue contributes to their biased mis-segre- centromere. Indeed, centromere size does not scale with chro-
gation, but other mechanisms could also contribute. Chromo- mosome length in humans (Table S1). Moreover we did not
somes 1 and 2 are the largest chromosomes in humans observe any differences in outer kinetochore structure measured
(Figure 1A). One idea is that longer chromosomes might require by CENP-E intensity between chromosome 1 and other
Cell Reports 23, 3366–3380, June 12, 2018 3375A
B C
D
Figure 7. Reversine Treatment Induces Different Biases
(A) RPE1 cells were treated with 250 nM reversine for 5 hr to induce lagging chromosomes before FISH with centromeric probes as indicated.
(B) Percentage anaphases with lagging chromosomes was quantified.
(C) Quantification of percentage of lagging chromatids (122–612 errors per chromosome analyzed) that are the chromosome indicated from erroneous
anaphases. All experiments show mean ± SD of three experiments.
(D) Summary graph of conditions collated from Figures 2, 4, and 7. *p < 0.05.
chromosomes following nocodazole treatment and associated Potential Role of Non-random Chromosome
kinetochore expansion (Figure 3). Nevertheless a correlation Mis-segregation in the Development of Cancer
has been observed between chromosome size and levels of Aneuploidy Landscapes
the inner centromeric protein CENP-A in human cells (Irvine Merotelic attachment and cohesion defects have both been
et al., 2004), suggesting that kinetochore size or function may proposed to contribute to cancer CIN (Bakhoum et al., 2009;
vary between chromosomes. In this regard, it is also interesting Brownlee et al., 2014; Ertych et al., 2014; Kawasumi et al.,
that chromosome 18, with the longest alpha satellite length 2017; Manning et al., 2014; Solomon et al., 2014). However, con-
(5.4 Mb; Table S1) was significantly enriched in lagging firming whether specific chromosomes are prone to mis-segre-
chromosomes following reversine treatment and exhibited gation during tumorigenesis is non-trivial. The bulk of available
moderate but consistent effects in response to nocodazole tumor genomic information lacks single cell resolution and is
washout both in terms of ImageStream aneuploidy and heavily shaped by evolutionary selection processes (Greaves
anaphase lagging analyses, despite falling short of statistical sig- and Maley, 2012; McGranahan and Swanton, 2017) that might
nificance. This suggests that centromere size could in fact obscure signatures of non-random mis-segregation. Neverthe-
contribute to biased mis-segregation under certain conditions. less, this phenomenon could influence early events during
Accordingly, it has recently been shown in Indian Muntjak cells tumorigenesis. For example, lagging chromosomes can be
that increased centromere size predisposes to merotelic attach- subject to downstream DNA damage events such as
ment (Drpic et al., 2018). An alternative possibility is that larger breakage-fusion-bridge events and chromothripsis that could
chromosomes may be prone to mis-segregation because of their fuel subsequent structural aneuploidy events (Crasta et al.,
tendency to occupy peripheral positions that might predispose 2012; Janssen et al., 2011; Zhang et al., 2015). In this regard,
to merotelic attachment (Cimini et al., 2004; Khodjakov and it is interesting that chromosomes 1 and 2 are among the
Rieder, 1996). three chromosomes most frequently affected by copy number
3376 Cell Reports 23, 3366–3380, June 12, 2018alteration in primary retinoblastomas (Kooi et al., 2016), and are pended in freshly prepared 3:1 methanol-glacial acetic acid, then dropped
frequently affected by incorporation into MN and resulting chro- onto slides.
mothripsis following nocodazole washout (Zhang et al., 2015).
Fluorescence In Situ Hybridization
Given links between dysfunction of the retinoblastoma protein Cells were grown on glass slides, fixed in methanol/acetic acid, then put
pRB, cohesion defects and chromosome lagging (Manning through an ethanol dehydration series. Cells were incubated overnight at
et al., 2010, 2014), and the propensity for chromosomes 1 and 37 C with specific centromere enumeration probes (CEP) (Cytocell) or
2 to lag under conditions of mal-attachment and cohesion pan-centromere probes (Cambio), then washed the following day with 0.253
fatigue, it is possible that non-random mis-segregation could saline sodium citrate (SSC) at 72 C followed by 23 SSC and 0.05% Tween.
act in concert with evolutionary selection to drive these recurrent When measuring cohesion fatigue, PSCS was defined as either one or both
centromere signals of one sister chromatid pair completely separated from
SCNA patterns in retinoblastomas and could potentially act
the metaphase plate.
more broadly across additional cancer types.
FISH with PNA Centromere Probe
EXPERIMENTAL PROCEDURES Metaphase spreads were prepared as above, and peptide nucleic acid (PNA)
staining was achieved following the manufacturer’s instructions (Eurogentec).
Cell Culture and RNAi In brief, slides were washed in PBS at 37 C and fixed in 4% formaldehyde in
All cell lines were maintained at 37 C with 5% CO2 (see Supplemental Exper- PBS. After fixation, cells were dehydrated with an ethanol series and air-dried.
imental Procedures for details of origin and media). hTERT-RPE-1 H2B-RFP Cells and PNA centromere probe were denatured for 15 min at 85 C, incu-
stable cell lines were generated after transfection with lentiviral construct bated for 1 hr at room temperature, then washed with 23 SSC and 0.01%
H2B-RFP (26001; Addgene). RNAi was achieved by transfection of cells for Tween at 60 C.
48 hr with 30 nM small interfering RNA (siControl [D-001210-02] and siWAPL
SMART pool [M-026287-01]; Dharmacon) using Lipofectamine RNAiMAX IF-FISH
(Invitrogen) and Optimem (Gibco). Drug concentrations used were 10 mM Mitotic cells were collected and re-suspended in 75 mM KCl hypotonic
MG132, 100 ng/mL nocodazole, 10 mM S-trityl-L-cysteine (STLC), 100 mM solution for 30 min on ice. Then cells were pelleted, re-suspended in freshly
monastrol, and 250 nM reversine (all from Sigma-Aldrich). Release from mitotic prepared PTEMF solution, and dropped onto slides. Immunofluorescence
arrest was achieved by washing drug out of cells with prewarmed media three (IF) and FISH were performed as above, with the addition of washes with
to five times, then leaving in incubator for 1 hr (nocodazole), 1.5 hr (STLC and 100 mM Tris-HCl, 150 mM NaCl, and 0.5% BSA between primary and second-
monastrol), or 2.5 hr (MG132). ary antibodies in the IF procedure.
Apoptosis Assay, Trypan Blue Viability, and Cell Cycle Analysis ImageStream FISH and Analysis
Cells were re-plated after either only trypsinization or after 8 hr nocodazole ImageStream FISH was performed in suspension: cells in log phase growth
treatment followed by mitotic shake-off. After 12 hr, cells were collected and were treated with 100 ng/mL nocodazole for 8 hr and released following
then either (1) stained with annexin V Alexa Fluor 647 antibody (A23204; mitotic shake-off into fresh medium for 12 hr. Cells were fixed by adding
Thermo Fisher Scientific) and DAPI, fixed in 1% formaldehyde and analyzed freshly prepared 3:1 methanol-glacial acetic acid dropwise to a pellet of
using BD FACS Diva 8.2, or (2) fixed in 4% formaldehyde for 7 min, then per- PBS-washed cells. For hybridization, cells were washed with 13 PBS with
meabilized with 0.2% Triton X-100 for 2 min, stained with DAPI, and analyzed 3% BSA twice for 5 min, pelleted, and resuspended in 0.05% Tween 20
using BD FACS Diva 8.2. Cell cycle profiles were quantified using FlowJo. For and 23 SSC in PBS. One million cells were pelleted and resuspended in
viability assay, re-plated cells at indicated time points were stained with trypan complete hybridization mixture: 28 mL hybridization buffer, 10 mL nuclease-
blue (Gibco), and percentage cell death was calculated using TC20 Automated free H2O, and 2 mL CEP probe. Denaturing and probe hybridization were per-
Cell Counter (Bio-Rad). formed in a thermocycler under the following conditions: 80 C (5 min), 42 C
(9–16 hr), and an optional storage step of 4 C. Following hybridization,
200 mL of 23 SSC and 0.05% Tween was added to each reaction mixture.
Immunoblotting
Cells were pelleted and resuspended in 50–100 mL of 13 PBS before anal-
Cell lysates were prepared by a lysis buffer (20 mM Tris-HCl [pH 7.4], 135 mM
ysis (optional: DAPI, 1 mg/mL). See Supplemental Experimental Procedures
NaCl, 1.5 mM MgCl2, Triton 1%, glycerol 10%, and 13 protease inhibitor
for details of ImageStream analysis.
[Roche]). Immunoblots were probed with antibodies against Wapl (Sc-
365189; Santa Cruz) and alpha-tubulin (T0674; Sigma-Aldrich) and developed
Microscopy
using goat anti-mouse IgG horseradish peroxidase (HRP) conjugated antibody
Images were acquired using an Olympus DeltaVision RT microscope (Applied
(Sc-2005; Santa Cruz) in a Chemidoc (GE Healthcare).
Precision) equipped with a Coolsnap HQ camera. Three-dimensional image
stacks were acquired in 0.2 mm steps, using Olympus 1003 (1.4 numerical
Immunofluorescence aperture), 603, or 403 UPlanSApo oil immersion objectives. Deconvolution
Cells grown on glass slides or coverslips were fixed with PTEMF (0.2% Triton of image stacks and quantitative measurements was performed with SoftWorx
X-100, 0.02 M PIPES [pH 6.8], 0.01 M EGTA, 1 mM MgCl2, and 4% formalde- Explorer (Applied Precision). H2B-RFP-labeled cells were live imaged in a
hyde). After blocking with 3% BSA, cells were incubated with primary anti- four-well imaging dish (Greiner Bio-one). Twenty micrometer z stacks (10 im-
bodies according to suppliers’ instructions: beta-tubulin (ab6046; Abcam), ages) were acquired using an Olympus 403 1.3 numerical aperture
Centrin 3 (ab54531; Abcam), CREST (15-234-0001; Antibodies Incorporated), UPlanSApo oil immersion objective every 3 min for 8 hr using a DeltaVision
and CENP-E (ab5093; Abcam). Secondary antibodies used were goat microscope in a temperature and CO2-controlled chamber. Analysis was
anti-mouse Alexa Fluor 488 (A11017; Invitrogen), goat anti-rabbit AF594 performed using Softworx Explorer. To observe cell death after nocodazole
and AF488 (A11012 and A11008; Invitrogen), and goat anti-human AF647 washout, cells were imaged every 3 min for the first 4 hr and then every
(109-606-088-JIR [Stratech] or A21445 [Invitrogen]). DNA was stained with 15 min for another 8 hr.
DAPI (Roche), and coverslips were mounted in Vectashield (Vector H-1000;
Vector Laboratories). Kinetochore Intensity and Size Measurements
Outer-kinetochore size measurement was performed with SoftWorx
Metaphase Spreads Explorer (Applied Precision), using the measure tool to measure the
Cells collected from mitotic shake-off were re-suspended in 75 mM maximum outer distance between CENP-E signals at centromeres as
KCl hypotonic solution for 30 min at 37 C. Cells were pelleted and re-sus- determined by CREST signal. CENP-E fluorescence mean intensity was
Cell Reports 23, 3366–3380, June 12, 2018 3377measured within 1 mm spheres centered around CREST-marked centro- REFERENCES
meres, using IMARIS (BITPLANE). Measurements were obtained from ten
kinetochores per cell using projections of ten 0.2 mm z stacks and ten cells Atkin, N.B., and Brito-Babapulle, V. (1981). Heterochromatin polymorphism
per condition. and human cancer. Cancer Genet. Cytogenet. 3, 261–272.
Bakhoum, S.F., Genovese, G., and Compton, D.A. (2009). Deviant kinetochore
Single-Cell Sequencing microtubule dynamics underlie chromosomal instability. Curr. Biol. 19,
Samples from control and experimentally induced aneuploid cells were sorted 1937–1942.
by FACS prior to next-generation sequencing library preparation and data Bakker, B., van den Bos, H., Lansdorp, P.M., and Foijer, F. (2015). How to
analysis using AneuFinder as previously reported (Bakker et al., 2016; van count chromosomes in a cell: An overview of current and novel technologies.
den Bos et al., 2016). See Supplemental Experimental Procedures for further BioEssays 37, 570–577.
details.
Bakker, B., Taudt, A., Belderbos, M.E., Porubsky, D., Spierings, D.C., de Jong,
T.V., Halsema, N., Kazemier, H.G., Hoekstra-Wakker, K., Bradley, A., et al.
Statistical Analysis (2016). Single-cell sequencing reveals karyotype heterogeneity in murine
Unpaired t test, one-way ANOVA with post hoc Tukey’s comparison, or and human malignancies. Genome Biol. 17, 115.
chi-square tests were used to test for levels of significance using either Excel
Ben-David, U., Ha, G., Khadka, P., Jin, X., Wong, B., Franke, L., and Golub,
(Microsoft), Prism (GraphPad), or MATLAB (R2016B; The MathWorks) (see
T.R. (2016). The landscape of chromosomal aberrations in breast cancer
Supplemental Experimental Procedures).
mouse models reveals driver-specific routes to tumorigenesis. Nat. Commun.
7, 12160.
DATA AND SOFTWARE AVAILABILITY Brown, T., Fox, D.P., Robertson, F.W., and Bullock, I. (1983). Non-random
chromosome loss in PHA-stimulated lymphocytes from normal individuals.
The accession number for the raw single-cell sequencing reads is European Mutat. Res. 122, 403–406.
Nucleotide Archive: PRJEB25738.
Brownlee, P.M., Chambers, A.L., Cloney, R., Bianchi, A., and Downs, J.A.
(2014). BAF180 promotes cohesion and prevents genome instability and
SUPPLEMENTAL INFORMATION aneuploidy. Cell Rep. 6, 973–981.
Cimini, D., Howell, B., Maddox, P., Khodjakov, A., Degrassi, F., and Salmon,
Supplemental Information includes Supplemental Experimental Procedures, E.D. (2001). Merotelic kinetochore orientation is a major mechanism of aneu-
seven figures, two tables, and one video and can be found with this article on- ploidy in mitotic mammalian tissue cells. J. Cell Biol. 153, 517–527.
line at https://doi.org/10.1016/j.celrep.2018.05.047.
Cimini, D., Cameron, L.A., and Salmon, E.D. (2004). Anaphase spindle
mechanics prevent mis-segregation of merotelically oriented chromosomes.
ACKNOWLEDGMENTS Curr. Biol. 14, 2149–2155.
Civelekoglu-Scholey, G., and Scholey, J.M. (2010). Mitotic force generators
We would like to thank Susana Godinho (hTERT-RPE-1 and BJ cells, H2B-RFP
and chromosome segregation. Cell. Mol. Life Sci. 67, 2231–2250.
plasmid) and Tom Nightingale (HUVECs) for kind gifts of reagents. We thank
Sarah Clare Johnson for help with illustrations. We also thank Elsa Logarinho, Craig-Holmes, A.P., and Shaw, M.W. (1971). Polymorphism of human
Patrick Meraldi, Daniele Fachinetti, Raquel Oliveira, Susana Godinho, and constitutive heterochromatin. Science 174, 702–704.
Andrew McAinsh for helpful discussions and Helder Maiato for sharing Crasta, K., Ganem, N.J., Dagher, R., Lantermann, A.B., Ivanova, E.V., Pan, Y.,
unpublished data. J.T.W. was funded by a Medical Research Council (MRC) Nezi, L., Protopopov, A., Chowdhury, D., and Pellman, D. (2012). DNA breaks
studentship, N.T. was funded by Barts and the London Charity (487/2133) and chromosome pulverization from errors in mitosis. Nature 482, 53–58.
and the Wellbeing of Women (RG2040), N.S. was funded by the Pancreatic
Cremer, T., and Cremer, M. (2010). Chromosome territories. Cold Spring Harb.
Cancer Research Fund (PCRF), A.M. was funded by the Kay Kendall
Perspect. Biol. 2, a003889.
Leukaemia Fund (KKLF) (KKL1073), and T.v.L. was funded by an ERASMUS
studentship. F.F. and B.B. were funded by Dutch Cancer Society grant Daum, J.R., Potapova, T.A., Sivakumar, S., Daniel, J.J., Flynn, J.N., Rankin, S.,
2012-RUG-5549. We thank the CRUK Flow Cytometry Core Service at Barts and Gorbsky, G.J. (2011). Cohesion fatigue induces chromatid separation in
Cancer Institute (Core Award C16420/A18066) and the Wellcome Trust for cells delayed at metaphase. Curr. Biol. 21, 1018–1024.
funding for the ImageStream (grant 101604/Z/13/Z). Drpic, D., Almeida, A.C., Aguiar, P., Renda, F., Damas, J., Lewin, H.A., Larkin,
D.M., Khodjakov, A., and Maiato, H. (2018). Chromosome segregation is
biased by kinetochore size. Curr. Biol. 28, 1344–1356.e5.
AUTHOR CONTRIBUTIONS
Duijf, P.H., Schultz, N., and Benezra, R. (2013). Cancer cells preferentially lose
Experimental Design, J.T.W., N.T., A.M., N.S., and S.E.M.; ImageStream Anal- small chromosomes. Int. J. Cancer 132, 2316–2326.
ysis, J.T.W.; Immunofluorescence and FISH, J.T.W., N.T., A.M., N.S., T.v.L., Ertych, N., Stolz, A., Stenzinger, A., Weichert, W., Kaulfuß, S., Burfeind, P.,
and S.E.M; Live-Cell Imaging and FACS, N.T.; Single-Cell Sequencing and Aigner, A., Wordeman, L., and Bastians, H. (2014). Increased microtubule as-
Analysis, D.C.J.S. and B.B.; Statistical Analyses of ImageStream Data sembly rates influence chromosomal instability in colorectal cancer cells. Nat.
and of Lagging Chromosome Rates, E.V. E.V and F.F. provided resources Cell Biol. 16, 779–791.
and input on the project. S.M. wrote the paper with contributions from all
Evans, E., and Wise, D. (2011). Variation in missegregation rates among human
authors.
chromosomes in hybrid cells. Cytogenet. Genome Res. 134, 165–173.
Faggioli, F., Wang, T., Vijg, J., and Montagna, C. (2012). Chromosome-specific
DECLARATION OF INTERESTS
accumulation of aneuploidy in the aging mouse brain. Hum. Mol. Genet. 21,
5246–5253.
The authors declare no competing interests.
Fauth, E., Scherthan, H., and Zankl, H. (1998). Frequencies of occurrence of all
Received: November 2, 2017 human chromosomes in micronuclei from normal and 5-azacytidine-treated
Revised: April 25, 2018 lymphocytes as revealed by chromosome painting. Mutagenesis 13, 235–241.
Accepted: May 14, 2018 Fenech, M. (2007). Cytokinesis-block micronucleus cytome assay. Nat. Pro-
Published: June 12, 2018 toc. 2, 1084–1104.
3378 Cell Reports 23, 3366–3380, June 12, 2018Gandhi, R., Gillespie, P.J., and Hirano, T. (2006). Human Wapl is a cohesin- Minderman, H., Humphrey, K., Arcadi, J.K., Wierzbicki, A., Maguire, O., Wang,
binding protein that promotes sister-chromatid resolution in mitotic prophase. E.S., Block, A.W., Sait, S.N., George, T.C., and Wallace, P.K. (2012). Image cy-
Curr. Biol. 16, 2406–2417. tometry-based detection of aneuploidy by fluorescence in situ hybridization in
Gao, R., Davis, A., McDonald, T.O., Sei, E., Shi, X., Wang, Y., Tsai, P.C., suspension. Cytometry A 81, 776–784.
Casasent, A., Waters, J., Zhang, H., et al. (2016). Punctuated copy number Mirkovic, M., and Oliveira, R.A. (2017). Centromeric cohesin: molecular glue
evolution and clonal stasis in triple-negative breast cancer. Nat. Genet. 48, and much more. Prog. Mol. Subcell. Biol. 56, 485–513.
1119–1130. Nagaoka, S.I., Hassold, T.J., and Hunt, P.A. (2012). Human aneuploidy: mech-
Greaves, M., and Maley, C.C. (2012). Clonal evolution in cancer. Nature 481, anisms and new insights into an age-old problem. Nat. Rev. Genet. 13,
306–313. 493–504.
Hengeveld, R.C.C., Vromans, M.J.M., Vleugel, M., Hadders, M.A., and Nicklas, R.B. (1983). Measurements of the force produced by the mitotic spin-
Lens, S.M.A. (2017). Inner centromere localization of the CPC maintains dle in anaphase. J. Cell Biol. 97, 542–548.
centromere cohesion and allows mitotic checkpoint silencing. Nat. Com- Potapova, T., and Gorbsky, G.J. (2017). The consequences of chromosome
mun. 8, 15542. segregation errors in mitosis and meiosis. Biology (Basel) 6, 6.
Hoffman, D.B., Pearson, C.G., Yen, T.J., Howell, B.J., and Salmon, E.D. (2001). Sacristan, C., Ahmad, M., Keller, J., Fermie, J., Groenewold, V., Tromer, E.,
Microtubule-dependent changes in assembly of microtubule motor proteins Fish, A., Melero, R., Carazo, J.M., Klumperman, J., et al. (2018). Dynamic
and mitotic spindle checkpoint proteins at PtK1 kinetochores. Mol. Biol. Cell kinetochore size regulation promotes microtubule capture and chromosome
12, 1995–2009. biorientation in mitosis. bioRxiv. https://doi.org/10.1101/279398.
Hovhannisyan, G., Aroutiounian, R., Babayan, N., Harutyunyan, T., and Liehr, Sakuno, T., Tada, K., and Watanabe, Y. (2009). Kinetochore geometry defined
T. (2016). Comparative analysis of individual chromosome involvement in by cohesion within the centromere. Nature 458, 852–858.
micronuclei induced by mitomycin C and bleomycin in human leukocytes.
Santaguida, S., Tighe, A., D’Alise, A.M., Taylor, S.S., and Musacchio, A. (2010).
Mol. Cytogenet. 9, 49.
Dissecting the role of MPS1 in chromosome biorientation and the spindle
Irvine, D.V., Amor, D.J., Perry, J., Sirvent, N., Pedeutour, F., Choo, K.H., and checkpoint through the small molecule inhibitor reversine. J. Cell Biol. 190,
Saffery, R. (2004). Chromosome size and origin as determinants of the level 73–87.
of CENP-A incorporation into human centromeres. Chromosome Res. 12,
Sapkota, H., Wasiak, E., and Gorbsky, G.J. (2017). Multiple determinants and
805–815.
consequences of cohesion fatigue in mammalian cells. bioRxiv. https://doi.
Janssen, A., van der Burg, M., Szuhai, K., Kops, G.J., and Medema, R.H. org/10.1101/240630.
(2011). Chromosome segregation errors as a cause of DNA damage and struc-
Solomon, D.A., Kim, J.S., and Waldman, T. (2014). Cohesin gene mutations in
tural chromosome aberrations. Science 333, 1895–1898.
tumorigenesis: from discovery to clinical significance. BMB Rep. 47, 299–310.
Kapoor, T.M., Mayer, T.U., Coughlin, M.L., and Mitchison, T.J. (2000). Probing
Spence, J.M., Mills, W., Mann, K., Huxley, C., and Farr, C.J. (2006). Increased
spindle assembly mechanisms with monastrol, a small molecule inhibitor of
missegregation and chromosome loss with decreasing chromosome size in
the mitotic kinesin, Eg5. J. Cell Biol. 150, 975–988.
vertebrate cells. Chromosoma 115, 60–74.
Kawasumi, R., Abe, T., Arakawa, H., Garre, M., Hirota, K., and Branzei, D.
Stevens, D., Gassmann, R., Oegema, K., and Desai, A. (2011). Uncoordinated
(2017). ESCO1/2’s roles in chromosome structure and interphase chromatin
loss of chromatid cohesion is a common outcome of extended metaphase ar-
organization. Genes Dev. 31, 2136–2150.
rest. PLoS ONE 6, e22969.
Khodjakov, A., and Rieder, C.L. (1996). Kinetochores moving away from their
Taylor, A.M., Shih, J., Ha, G., Gao, G.F., Zhang, X., Berger, A.C., Schumacher,
associated pole do not exert a significant pushing force on the chromosome.
S.E., Wang, C., Hu, H., Liu, J., et al. (2018). Genomic and functional
J. Cell Biol. 135, 315–327.
approaches to understanding cancer aneuploidy. Cancer Cell 33, 676–
Kleyman, M., Kabeche, L., and Compton, D.A. (2014). STAG2 promotes error 689.e3.
correction in mitosis by regulating kinetochore-microtubule attachments.
Thompson, S.L., and Compton, D.A. (2011). Chromosome missegregation in
J. Cell Sci. 127, 4225–4233.
human cells arises through specific types of kinetochore-microtubule attach-
Knouse, K.A., Wu, J., Whittaker, C.A., and Amon, A. (2014). Single cell ment errors. Proc. Natl. Acad. Sci. U S A 108, 17974–17978.
sequencing reveals low levels of aneuploidy across mammalian tissues. Thrower, D.A., Jordan, M.A., and Wilson, L. (1996). Modulation of CENP-E
Proc. Natl. Acad. Sci. U S A 111, 13409–13414. organization at kinetochores by spindle microtubule attachment. Cell Motil.
Kooi, I.E., Mol, B.M., Massink, M.P., de Jong, M.C., de Graaf, P., van der Cytoskeleton 35, 121–133.
Valk, P., Meijers-Heijboer, H., Kaspers, G.J., Moll, A.C., Te Riele, H., Torosantucci, L., De Santis Puzzonia, M., Cenciarelli, C., Rens, W., and
et al. (2016). A meta-analysis of retinoblastoma copy numbers refines the Degrassi, F. (2009). Aneuploidy in mitosis of PtK1 cells is generated by random
list of possible driver genes involved in tumor progression. PLoS ONE 11, loss and nondisjunction of individual chromosomes. J. Cell Sci. 122, 3455–
e0153323. 3461.
Kueng, S., Hegemann, B., Peters, B.H., Lipp, J.J., Schleiffer, A., Mechtler, K., Trivedi, P., and Stukenberg, P.T. (2016). A centromere-signaling network
and Peters, J.M. (2006). Wapl controls the dynamic association of cohesin with underlies the coordination among mitotic events. Trends Biochem. Sci. 41,
chromatin. Cell 127, 955–967. 160–174.
Lara-Gonzalez, P., and Taylor, S.S. (2012). Cohesion fatigue explains why Valind, A., Jin, Y., Baldetorp, B., and Gisselsson, D. (2013). Whole chromo-
pharmacological inhibition of the APC/C induces a spindle checkpoint-depen- some gain does not in itself confer cancer-like chromosomal instability.
dent mitotic arrest. PLoS ONE 7, e49041. Proc. Natl. Acad. Sci. U S A 110, 21119–21123.
Manning, A.L., Longworth, M.S., and Dyson, N.J. (2010). Loss of pRB causes van den Bos, H., Spierings, D.C., Taudt, A.S., Bakker, B., Porubský, D.,
centromere dysfunction and chromosomal instability. Genes Dev. 24, 1364– Falconer, E., Novoa, C., Halsema, N., Kazemier, H.G., Hoekstra-Wakker, K.,
1376. et al. (2016). Single-cell whole genome sequencing reveals no evidence for
Manning, A.L., Yazinski, S.A., Nicolay, B., Bryll, A., Zou, L., and Dyson, N.J. common aneuploidy in normal and Alzheimer’s disease neurons. Genome
(2014). Suppression of genome instability in pRB-deficient cells by enhance- Biol. 17, 116.
ment of chromosome cohesion. Mol. Cell 53, 993–1004. van Harn, T., Foijer, F., van Vugt, M., Banerjee, R., Yang, F., Oostra, A., Joenje,
McGranahan, N., and Swanton, C. (2017). Clonal heterogeneity and tumor H., and te Riele, H. (2010). Loss of Rb proteins causes genomic instability in the
evolution: past, present, and the future. Cell 168, 613–628. absence of mitogenic signaling. Genes Dev. 24, 1377–1388.
Cell Reports 23, 3366–3380, June 12, 2018 3379You can also read