Epigenetic Regulation of Claudin-1 in the Development of Ovarian Cancer Recurrence and Drug Resistance - Frontiers
←
→
Page content transcription
If your browser does not render page correctly, please read the page content below
ORIGINAL RESEARCH
                                                                                                                                              published: 22 March 2021
                                                                                                                                        doi: 10.3389/fonc.2021.620873

                                              Epigenetic Regulation of Claudin-1 in
                                              the Development of Ovarian Cancer
                                              Recurrence and Drug Resistance
                                              Zachary R. Visco 1, Gregory Sfakianos 1, Carole Grenier 1,2, Marie-Helene Boudreau 1,
                                              Sabrina Simpson 1, Isabel Rodriguez 1, Regina Whitaker 1, Derek Y. Yao 2,
                            Edited by:        Andrew Berchuck 1, Susan K. Murphy 1,2* and Zhiqing Huang 1,2*
                      Chunxiao Zhou,
University of North Carolina at Chapel        1Division of Gynecologic Oncology, Department of Obstetrics and Gynecology, Duke University Medical Center, Durham,
                    Hill, United States       NC, United States, 2 Division of Reproductive Sciences, Department of Obstetrics and Gynecology, Duke University Medical
                                              Center, Durham, NC, United States
                      Reviewed by:
                         Chen Wang,
           Mayo Clinic, United States
                                              Over 21,000 women are diagnosed with ovarian cancer (OC) in the United States each
                      Pietro Taverna,
              Sunesis, United States          year and over half that number succumb to this disease annually, often due to recurrent
                 *Correspondence:             disease. A deeper understanding of the molecular events associated with recurrent
                      Zhiqing Huang           disease is needed to identify potential targets. Using genome-scale DNA methylation
            zhiqing.huang@duke.edu
                    Susan K. Murphy
                                              and gene expression data for 16 matched primary-recurrent advanced stage serous
            susan.murphy@duke.edu             epithelial OCs, we discovered that Claudin-1 (CLDN1), a tight junction protein, shows a
                                              stronger correlation between expression and methylation in recurrent versus primary OC
                   Specialty section:
                                              at multiple CpG sites (R= –0.47 to −0.64 versus R= -0.32 to −0.57, respectively). An
         This article was submitted to
                     Women’s Cancer,          independent dataset showed that this correlation is stronger in tumors from short-term
               a section of the journal       (7y) survivors (R= −0.41 to −0.46 versus
                 Frontiers in Oncology
                                              R= 0.06 to −0.19, respectively). The presence of this inverse correlation in short-term
        Received: 24 October 2020
        Accepted: 06 January 2021             survivors and recurrent tumors suggests an important role for this relationship and
         Published: 22 March 2021             potential predictive value for disease prognosis. CLDN1 expression increased following
                            Citation:         pharmacologic inhibition of DNA methyltransferase activity (p< 0.001), thus validating the
   Visco ZR, Sfakianos G, Grenier C,
                                              role of methylation in CLDN1 gene inhibition. CLDN1 knockdown enhanced
          Boudreau M-H, Simpson S,
    Rodriguez I, Whitaker R, Yao DY,          chemosensitivity and suppressed cell proliferation, migration, and wound healing (p<
Berchuck A, Murphy SK and Huang Z             0.05). Stable CLDN1 knockdown in vivo resulted in reduced xenograft tumor growth but
      (2021) Epigenetic Regulation of
     Claudin-1 in the Development of          did not reach significance. Our results indicate that the relationship between CLDN1
          Ovarian Cancer Recurrence           methylation and expression plays an important role in OC aggressiveness and recurrence.
                and Drug Resistance.
            Front. Oncol. 11:620873.          Keywords: ovarian cancer, DNA methylation, epigenetic, chemosensitivity, tumor xenograft, recurrent
     doi: 10.3389/fonc.2021.620873            ovarian cancer

Frontiers in Oncology | www.frontiersin.org                                         1                                        March 2021 | Volume 11 | Article 620873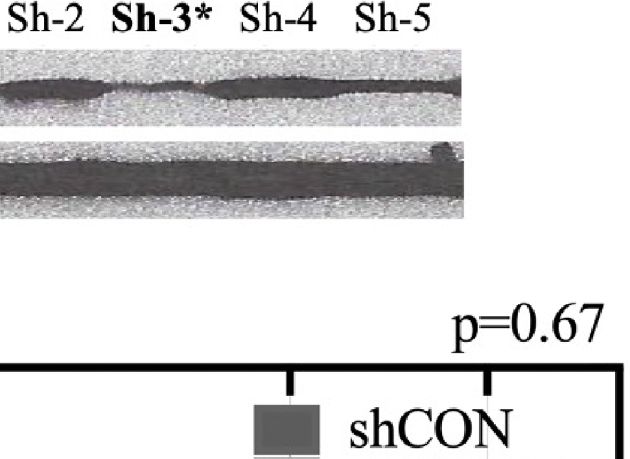
Visco et al.                                                                                     Epigenetic Regulation of CLDN1 in Ovarian Cancer

IMPLICATION                                                              peritoneal cavity of advanced OC patients (13). Furthermore,
                                                                         spheroid formation and adhesion to the omentum play
CLDN1 gene expression and methylation play an important role             significant roles in OC recurrence and chemo-resistance (14).
in ovarian cancer aggressiveness and this relationship may               In patients treated for OC, spheroid formation allows cells to
provide a new therapeutic target.                                        resist the effects of chemotherapy, which contributes to eventual
                                                                         recurrence (14).
                                                                             Tight junction complexes are formed by three gene families:
INTRODUCTION                                                             occludins, claudins (CLDNs), and junctional adhesion molecules.
                                                                         CLDNs contribute both structural and functional factors in these
Epithelial ovarian cancer (EOC) is the fifth leading cause of             tight junctions. CLDN1 is expressed in almost all known types of
cancer deaths in women. The American Cancer Society estimates            epithelial cells and it plays a major role in the regulation of
that 21,410 women in the United States will be diagnosed with            intercellular permeability (15). Studies have shown the
ovarian cancer (OC) and 13,770 women will die of the disease in          importance of CLDN family members in epithelial cell derived
the year 2021. The high mortality rate in OC is largely due to           cancers, including breast and gastric cancers (16, 17), by
late-stage diagnoses as a result of non-specific early symptoms           examining cancer development, tumor progression, and
(1). Despite a strong initial response to treatment, most patients       chemosensitivity. However, tight junctions have not been
will develop recurrent tumors that are often drug resistant (2),         studied extensively in OC, even though epithelial cells from the
resulting in high mortality due to a lack of effective treatments        fallopian tube have been implicated as the source of high-grade
(3). With the development of “omics” technologies, we have               serous carcinoma, the most common and aggressive OC (18).
gained a deeper understanding of cancer mechanisms, which has            We therefore undertook a deeper investigation of CLDNs in vivo
led to development of some individualized treatments. However,           and in vitro, with a particular focus on recurrent and aggressive
the mechanisms that drive OC relapse and therapies to effectively        OC phenotypes.
delay and ultimately prevent this relapse are still unknown.
    Whole genome and transcriptome sequencing technologies
have enabled the correlation of individual genomic information           MATERIALS AND METHODS
with disease risk factors and treatment prognoses. Numerous
prior studies have demonstrated that there are gene expression           Tumor Samples
and methylation profiles that correlate with OC aggressiveness            We used 16 matched primary and recurrent OC tissue sets from
and outcome (4), as well as a large number of genes that exhibit         patients (mean age at diagnosis, 57.4 years) with stage III/IV
altered DNA methylation in this disease (5). However, few                serous epithelial OC from the Duke Gynecologic Oncology
studies have utilized matched primary and recurrent OCs.                 Tissue Bank. The primary tumor specimens were collected at
Surgical resection is no longer the standard of care for                 the time of initial debulking surgery. Recurrent tumor samples
recurrent OC (6), so the “omics” technologies that hold                  were obtained from the same patients during “second-look”
promise for breakthroughs in the design of individualized                surgeries. The time to recurrence ranged from 2 to 65 months
treatments are limited due to poor access to recurrent OC                (mean, 24 months). Survival ranged from 11 to 105 months
tumor samples. The availability of an archived set of primary-           (mean, 44 months). Samples were obtained after patients
recurrent OC paired tumors allowed us to better understand how           provided written informed consent under protocols approved
epigenetic-transcriptomic relationships change as the disease            by the Duke University Institutional Review Board. Patient
progresses from initial diagnosis to eventual recurrence.                clinical information is listed in Table 1.
    The vast majority of malignant ovarian tumors are epithelial
(7). Growing evidence has demonstrated that epithelial-to-               The Cancer Genome Atlas (TCGA, https://
mesenchymal transition (EMT) can promote tumor metastasis,               www.cbioportal.org)
invasion, as well as chemotherapy resistance in OC (8). EMT is           CLDN1 mutations and expression changes in OC were assessed
the process whereby epithelial cells become mesenchymal                  using a publicly available dataset that included 489 patients with
through loss of their cell–cell adhesion resulting in acquisition        Stage II-IV ovarian serous cystadenocarcinoma with their
of enhanced migration/invasion capabilities (8). Loss of cell-cell       respective copy number variants, survival data, mRNA
adhesion is a fundamental mechanistic component in the                   expression, and HM27 BeadChip methylation data compared
progression of primary EOC to metastatic disease and eventual            with matched normal variants (19). Data was analyzed using
recurrence (9). Tight junctions are multiprotein complexes and           cBioPortal’s online analysis tool. Methylation and expression
they function to regulate cell-cell adhesion in epithelial and           values were compared using Pearson correlation.
endothelial cells (10). Suh et al., showed that CLDN1 is
overexpressed in human hepatocellular carcinoma cells and is             DNA and RNA Extraction
capable of promoting the EMT process, suggesting a close                 DNA and RNA were simultaneously extracted from each of the
relationship between CLDN1 and EMT (11). There is also                   fresh-frozen tissue samples using the AllPrep DNA/RNA Mini
evidence that tight junctions are involved in the development            Kit according to the manufacturer’s protocol (Qiagen;
of OC spheroids (12). OC cells tend to form spheroids in the             Germantown, MD; Cat#80204). Nucleic acid concentration

Frontiers in Oncology | www.frontiersin.org                          2                                  March 2021 | Volume 11 | Article 620873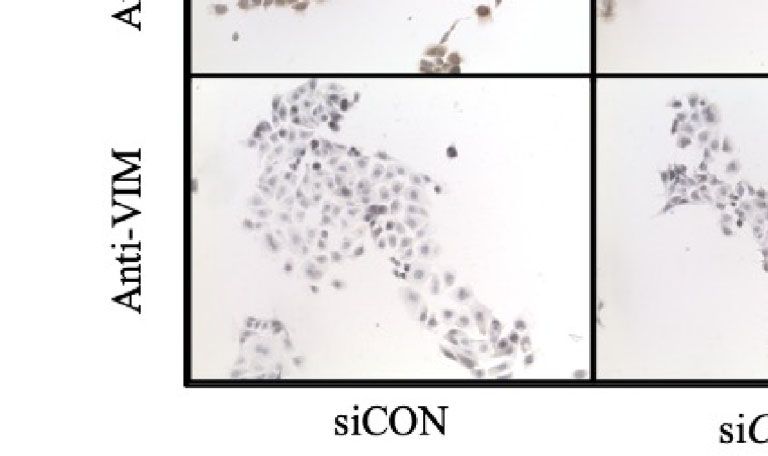
Visco et al.                                                                                                        Epigenetic Regulation of CLDN1 in Ovarian Cancer

TABLE 1 | Patient clinical information for matched primary and recurrent ovarian cancers. All tumor pairs showed papillary serous histology on pathology exam.

Tumor ID (Primary/        Final Pathology        CA125 at End of Primary         Platinum Sensitivity/Resistance            Months to Recurrence             Survival
Recurrent)                  FIGO Grade                  Therapy                        (Primary/Recurrent)                   Following Surgery              (Months)

1P/1R                             2              >10                             S/S                                                   >6                        >36
2P/R                              1              >10                             R/R                                                   >6                        >36
3P/3R                             3              Not detected                    S/S                                                   >6                        >36
4P/4R                             3              >10                             R/R                                                   >6                        ≤36
5P/5R                             2              ≤10                             R/R                                                   >6                        >36
6P/6R                             3              ≤10                             R/Unknown (Pt. died of disease)                       >6                        ≤36
7P/7R                             2              ≤10                             S/S                                                   >6                        >36
8P/8R                             2              Unknown                         R/S                                                   ≤6                        ≤36
9P/9R                             3              >10                             R/R                                                   ≤6                        ≤36
10P/10R                           2              >10                             R/R                                                   >6                        ≤36
11P/11R                           3              >10                             S/R                                                   >6                        ≤36
12P/12R                           2              >10                             R/S                                                   >6                        >36
13P/13R                           3              ≤10                             S/R                                                   >6                        >36
14P/14R                           2              Unknown                         Unknown/Unknown                                       >6                        ≤36
15P/15R                           2              Unknown                         Unknown/Unknown                                       >6                        ≤36
16P/16R                           2              Not detected                    S/S                                                   >6                        >36

and purity were assessed using a NanoDrop ™ 2000                                      default probe normalization method, BMIQ, described by
spectrophotometer (Thermo Fisher Scientific; Waltham, MA).                             Teschendorff et al. (25). Based on the criteria outline by Morris
                                                                                      et al., probes were excluded for having p-values above 0.01 and
Bisulfite Conversion of DNA                                                            for having fewer than three bead measurements in at least 5% of
The Zymo EZ DNA Methylation Kit (Irvine, CA; # D5001) was                             samples (24, 26). Probes were excluded for not being true CpG
used to perform bisulfite (BS) conversion with 500 ng of genomic                       sites and for proximity to known SNPs, as identified by Zhou
DNA according to the manufacturer’s protocol.                                         et al. (27). Additionally, probes were excluded for non-specific
                                                                                      hybridization to DNA segments and if they were located on the X
DNA Methylation                                                                       chromosome to avoid sex-chromosome methylation patterns
The Illumina Infinium HumanMethylation450 BeadChip was                                 (28). Probes were stratified by location relative to CpG islands,
used to generate quantitative DNA methylation data using                              including “open sea” regions, “CpG shelves”, “CpG shores”, and
bisulfite modified genomic DNA from the 16 paired primary-                              “CpG islands as annotated by Illumina. The dataset was analyzed
recurrent OC specimens by Expression Analysis (Research                               to identify differentially methylated probes between the primary
Triangle Park, NC). This data is publicly available through the                       and recurrent data sets, as detailed in the ChAMP pipeline
Duke Digital Data Repository (20). Existing data (GSE51820)                           documentation (23). A Bonferroni correction was used with an
(21) was used for independent validation.                                             original alpha level of 0.05 (29). The resulting probe list was
                                                                                      annotated with the hg19 genome build using a publicly available
Gene Expression                                                                       R package (30). CpG sites with Illumina-designated gene
Affymetrix Human Genome U133A arrays were used to quantify                            annotations were retained for analysis.
gene expression by the Duke DNA Microarray Facility using total                           The 16 paired primary-recurrent samples were also analyzed
RNA isolated from 16 paired primary-recurrent frozen ovarian                          for RNA expression using the Affymetrix Human Genome U133
tumor samples. This data is publicly available through the Duke                       Plus 2.0 microarray, which included 22,277 probes. This gene
Digital Data Repository (22). An independent Affymetrix U133A                         expression data was normalized using the robust multiarray
gene expression dataset from tumors of women who lived 7 years (n= 21) post-diagnosis was used for validation                    data were analyzed by comparing values for primary and
and derived from previously published data (GSE51820) (21).                           recurrent tumors using a paired student’s t-test (alpha= 0.05),
Gene expression for 26 OC cell lines treated for 72 h with 5 μM 5’-                   with a Bonferroni correction.
aza-2’-deoxycytidine (Decitabine; Sigma-Aldrich; St. Louis, MO;                           The RMA normalized Affymetrix gene expression data was
#A3656) was quantified using the Affymetrix HT Human Genome                            integrated with the Illumina 450k data based on gene name using
U133A Array and is available from the NCBI GEO web site,                              Excel. CpG sites from the 450k data and expression data from the
accession GSE25428. This data was analyzed using a paired                             RMA normalized gene expression data set were retained for
student’s t-test.                                                                     further analysis if the associated gene was present in both data
                                                                                      sets. The methylation-expression relationship between the 450k
Genome Analysis                                                                       beta values and normalized gene expression was analyzed using
The HumanMethylation450 BeadChip data includes 485,512                                Pearson’s correlation. Methylation-expression relationships were
CpG sites and was analyzed using ChAMP, an integrated 450k                            quantified independently in the primary and recurrent samples.
analytical platform developed by Morris et al. and maintained by                      This produced a set of methylation-expression correlation
Tian et al. (23, 24). The raw data was normalized based on the                        coefficients and p-values for both primary and recurrent data

Frontiers in Oncology | www.frontiersin.org                                       3                                         March 2021 | Volume 11 | Article 620873
Visco et al.                                                                                      Epigenetic Regulation of CLDN1 in Ovarian Cancer

sets. The list of genes with significant correlation was compared          inserts were gently removed after 24 h when the cells were
between the primary and the recurrent data sets. The resulting list       90-95% confluent. The cells were washed twice with cold PBS
of genes with differential expression-methylation relationships           in order to remove any floating cells. Micrographs were
between the primary and recurrent tumors were analyzed using              taken after the gaps were created. Digital micrographs (40×
GATHER, a web-based tool for analyzing gene pathway                       magnification) were taken at 0, 4, 24, and 48-h after gap
enrichment (32).                                                          generation. The pixel width of the gap was measured three
                                                                          times at six distinct locations across the gap of each well using
Cell Culture, Transfection, and Treatment                                 ImageJ, producing 18 measurements for gap width in each cell
OC cell lines were chosen for their ability to undergo stable             line at each time point. The data was normalized using the
siRNA CLDN1 knockdown (Supplementary Figure 1) unless                     width of the gap at the initial time point. The measured widths
otherwise indicated. Cells were maintained in RPMI 1640                   were compared between siCON and siCLDN1 at each time point
medium (Sigma-Aldrich; St. Louis, MO) with 10% Fetal Bovine               using a paired student’s t-test.
Serum (Thermo Fisher Scientific; Waltham, MA) and 1×
Penicillin/Streptomycin (Sigma-Aldrich; St. Louis, MO) at 37°C            Stem Cell Selective Culture and Spheroid
in a humidified incubator with 5% CO2. Cell lines were genetically         Formation
authenticated with each expansion at the Duke University DNA              Monolayer cells were harvested with TrypLE Express Enzyme
Analysis Facility to confirm identity of newly prepared freezer            (Thermo Fisher Scientific; Waltham, MA; #12604013) 24 h after
stocks. For genetic testing, samples were analyzed at polymorphic         siRNA transfection when cells were approximately 75%
short tandem repeat markers using the GenePrint 10 kit                    confluent. HEYA8 and DOV13 OC cells were cultured in stem
(Promega; Madison, WI). Allele sizes were determined using an             cell selective media consisting of DMEM/F-12 supplemented
ABI 3130xl automated capillary DNA sequencer. Cell lines were             with 0.4% bovine serum albumin, 10 ng/ml b-FGF, 20 ng/ml
also tested for mycoplasma at each expansion by the Duke Cell             EGF, and 5 mg/ml insulin (Sigma-Aldrich, St. Louis, MO)
Culture Facility.                                                         (35–37). Cells were cultured on Corning ultralow attachment
    Cells were grown to 70% to 80% confluence prior to                     plates (Corning, NY) and imaged at 0, 4, and 24-h time points
transfection or treatment. Cells were treated with 300 nm or              following treatment with DMSO mock control or YM201636
900 nm PIKfyve Inhibitor YM201636 (Selleckchem; Houston,                  (dissolved in DMSO at 10 mM, SelleckChem; Houston, TX).
TX; #S1219) for 24 h followed by assays for proliferation,                DMSO was used as a mock treatment control. Micrographs were
migration and spheroid formation. Methodology for treatment               taken at 40× magnification for spheroid formation using the
of cells with decitabine, a cytosine analog that inhibits DNA             AxioVision system (Zeiss; Dublin, CA) at 0, 4, and 24 h following
methyltransferase (DNMT) activity, was previously published               culture in stem cell selective media.
(33, 34). For CLDN1 knockdown, cells were transfected with
HiPerFect non-silencing control siRNA (siCON) (Qiagen                     Quantitative Real-Time PCR and
#1022076; Valencia, CA) or CLDN1-specific siRNAs                           Immunoblotting
(siCLDN1) (siCLDN1-6 and siCLDN1-8; Qiagen #SI04136083                    Quantitative real-time PCR (qRT-PCR) was performed with 100
and #SI04279114, respectively) according to the manufacturer’s            ng of total RNA isolated from cell lines transfected with siCLDN1
protocol (Qiagen). siCLDN1-8 was used for all experiments                 using the TaqMan RNA-to-CT One Step Kit (Thermo Fisher
unless otherwise specified given its superior knockdown                    Scientific; Waltham, MA; #4392938). Relative expression levels
efficiency (Supplementary Figure 2). For chemosensitivity                  of CLDN1 (Hs00221623_m1), CD133 (Hs01009241_m1) and
testing, cells were seeded into 96-well plates and grown to               CD44 (Hs01075862_m1; Thermo Fisher Scientific) were
~70% confluence prior to treatment. Carboplatin and paclitaxel             measured using beta-2-microglobulin as an internal loading
(both from Hospira; Lake Forest, IL) were diluted with 1X                 control (Hs00187842_m1; Thermo Fisher Scientific). qRT-PCR
phosphate-buffered saline (Sigma-Aldrich; St. Louis, MO) to 10            was performed using the 7500 Fast Real-Time PCR System
mg/ml and 6 mg/ml, respectively.                                          (ThermoFisher Scientific, Grand Island, NY. Cat# 4351106)
                                                                          and data was analyzed using Microsoft Excel (Microsoft
Proliferation, Migration, and Wound                                       Corporation, Redmond, WA).
Healing Assays
Following siRNA transfection or YM201636 treatment, cells                 Western Blotting
were analyzed for proliferation with a MTT assay (Promega;                CAOV2, OVCA429, OVCAR5, and SKOV8 OC cells were
Madison, WI), for migration with an invasion/migration assay              transfected with siCON or siCLDN1 24 h after they were plated
(Cell BioLabs; San Diego, CA; #CBA-110), and for wound                    in 10 cm petri-dishes and reached 70% confluence. The cells were
healing using a gap closure assay (Cell BioLabs; San Diego,               harvested 72 h post transfection using TrypLE Express Enzyme
CA; #CBA-120) per manufacturer protocols. For the wound                   (Thermo Fisher Scientific; Waltham, MA; #12604013). The whole
healing assay, the siCON and siCLDN1 cells (SKOV8 and                     cell lysate was prepared using RIPA Lysis and Extraction Buffer
IGROV1) were seeded onto a 24-well plate with specialized                 (Thermo Fisher Scientific; Waltham, MA; #PI89900). Western
inserts that create an even width gap in the cell monolayer               Blotting was performed using anti-human antibodies against
when removed (Cell BioLabs; San Diego, CA; #CBA-120). The                 CLDN1 (Sigma-Aldrich; St. Louis, MO, Cat# SAB4503545;

Frontiers in Oncology | www.frontiersin.org                           4                                  March 2021 | Volume 11 | Article 620873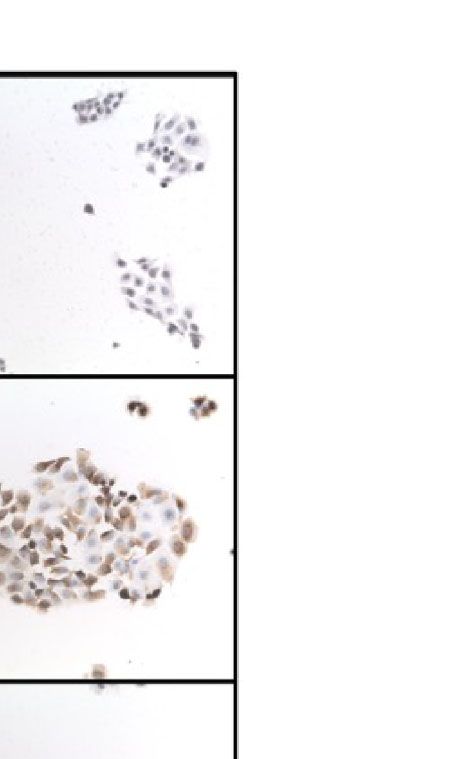
Visco et al.                                                                                    Epigenetic Regulation of CLDN1 in Ovarian Cancer

rabbit polyclonal), E-cadherin (CDH1), Clone#RM244 (Boster;            weekly on each individual mouse following injection to
Pleasanton, CA, Cat# M00063-3; rabbit monoclonal) and                  monitor tumor formation and growth using an IVIS Kinetic
Vimentin (Abcam; Cambridge, MA. Cat# ab92547 rabbit                    system at the Duke Optical Molecular Imaging and Analysis
monoclonal). GAPDH expression with anti-GAPDH antibody                 Shared Resource. Each mouse was treated with carboplatin (60
(Santa Cruz Biotechnology, Dallas, TX. Cat# sc-47724; mouse            mg/kg IP per mouse, once every 4 days) once its tumor(s)
monoclonal) was used as an internal control. Fifty micrograms of       reached a total photon flux signal of 1 × 10⁷ as measured on
cell lysate per sample were used for Western blotting. All             the IVIS system. Total photon flux was averaged for the group
antibodies were used at a 1:200 dilution. Western blotting was         and compared with Mann-Whitney testing. The mouse
carried out according to the protocol from Abcam and was imaged        experiments were repeated using the same parameters. All
using ECL Western Blotting reagents (Promega Corporation;              animal work was approved by the Duke Institutional Animal
Madison, WI; Cat# W1001) by chemiluminescence.                         Care and Use Committee.

Immunocytochemistry
OVCAR5 OC cells were transfected with siCON or siCLDN1 and
incubated for 72 h. Cells were harvested using TrypLE Express          RESULTS
Enzyme (Thermo Fisher Scientific; #12604013) and concentrated
onto slides using a cytospin centrifuge. Immunocytochemistry           CLDN1 Expression Is Regulated by DNA
was performed for CLDN1 protein (Sigma-Aldrich; St. Louis,             Methylation
MO, Cat#SAB4503545; rabbit polyclonal) and Vimentin                    Tight junctions have been previously implicated in epithelial cell
(Abcam; Cambridge, MA. Cat#ab92547; rabbit monoclonal),                derived cancers, but their role has not been clearly defined in
following previously described protocol (34).                          OCs, despite the fact that epithelial fallopian tube cells may lead
                                                                       to high-grade serious OCs (16–18). We sought to characterize
RT2 Profiler PCR Array                                                  the impact of CLDN1 gene regulation in OCs. While CLDN1
One microgram of RNA from siCON or siCLDN1-transfected                 gene amplification was noted in 14% of samples in the TCGA
HEYA8 cells was converted to cDNA using SuperScript™ IV First-         dataset, no mutations were noted. Further, there was no
Strand Synthesis System (ThermoFisher Scientific, Grand Island,         significant correlation between CLDN1 methylation and
NY. Cat# 18091200). The cDNA was used for measuring relative           mRNA expression in the primary OC TCGA dataset (Pearson
gene expression with the RT² Profiler™ PCR Array for Human              correlation, R= -0.03, p= 0.541).
Epithelial to Mesenchymal Transition (Qiagen, Germantown, MD;              CLDN1 is located on chromosome 3q28 and has one CpG
Cat# PAHS-090Z). The array data was generated on a 7500 Fast           island which is located at the promoter region. There are 13
Real-Time PCR System (ThermoFisher Scientific, Grand Island,            methylation probes associated with CLDN1 on the Illumina
NY. Cat# 4351106) and analyzed according to the manufacturer’s         Infinium HumanMethylation450 BeadChip assay including six
instructions (Qiagen, Germantown, MD).                                 in the promoter CpG island, two in the north shore, one in the
                                                                       south shore, and one in the north shelf (schematic showing
OC Xenografts                                                          relative positions in Figure 1A). There were no statistically
SKOV3 cells were stably transduced with non-target shRNA               significant differences for any of the CLDN1 CpG probes
Control (Sigma-Aldrich; St. Louis, MO. Cat# SHC016V) or                between the matched primary-recurrent OCs, although the
CLDN1-specific shRNA constructs (Sigma-Aldrich; St. Louis,              methylation levels changed between primary and recurrent OC
MO. Cat# HUTR11676) given their ability to produce                     from each individual patient (paired t-test, p= 0.05–0.99; data
intraperitoneal (IP) tumors (38). The SKOV3 cells were then            not shown). There was no difference in CLDN1 RNA expression
transduced with the pGreenFire Lenti-Reporter construct that           between the primary and recurrent OCs (paired t-test, p= 0.94;
encodes green fluorescent protein and luciferase under control of       Figure 1B). There was also no correlation between CLDN1 RMA
the EF1alpha promoter (System Biosciences; Mountain View,              expression and patient survival or time to tumor recurrence in 16
CA; Cat# TR010PA/VA-P). For both shRNAs and the                        primary OC patients (Pearson correlation, R= 0.031, p= 0.89,
pGreenFire Lenti-Reporter, the HEK293 cells and lentivector            and R= 0.041, p= 0.86, respectively; data not shown). We then
expression system were used according to methodology                   further focused on DNA methylation-expression relationships
previously reported (39). GFP-positive SKOV3 cells were                for CLDN1 in the matched primary-recurrent OC pairs. The
enriched using fluorescence-activated cell sorting (FACS) at            methylation of north shore CpG probe cg00804587 was
the Duke Flow Cytometry Shared Resource. The GFP + /                   significantly inversely correlated with CLDN1 expression in
shCLDN1 or GFP+/shControl (shCON) SKOV3 cells were                     both primary and recurrent OC (paired t-tests, primary OC:
injected into athymic 6-8-week female nude mice through IP             R= −0.57, p= 0.02; recurrent OC: R= −0.62, p= 0.009, Table 2,
injection (5 × 10⁴/per mouse). Mice were housed five per cage           Supplementary Figure 3). Intriguingly, the methylation status of
and fed ad libitum with standard PicoLab® Rodent Diet 20 (5053         CpG probes at the north shore (cg25330387), north shelf
lab diet, LabDiet) by the Duke Laboratory Animal Resource              (cg03601836), and south shore (cg03623835) were most
under the supervision of licensed veterinarians. Ten mice each         strongly inversely correlated with CLDN1 expression in
were injected with the non-silencing control (shCTL) or the            recurrent rather than primary OCs (Table 2, Supplementary
shCLDN1 GFP+ SKOV3 cells. Live imaging was performed                   Figure 3). Another CLDN family member, CLDN4, also showed

Frontiers in Oncology | www.frontiersin.org                        5                                   March 2021 | Volume 11 | Article 620873
Visco et al.                                                                                                             Epigenetic Regulation of CLDN1 in Ovarian Cancer

                                  A                                                            B

                                  C                                                    D

 FIGURE 1 | CLDN expression is regulated by DNA methylation in ovarian cancer. (A) Schematic of the CLDN1 locus as well as its relative position within a CLDN16
 intron. The positions of the four CpG HumanMethylation Infinium450 BeadChip probes used in this study are shown. Grey rectangle, CpG island; arrow, transcription
 start; short rectangles, untranslated regions; tall rectangles, coding exons. (B) Primary-recurrent robust multiarray average algorithm (RMA) normalized Affymetrix
 gene expression data for 16 paired primary-recurrent tumors; p = paired t-test. (C) CLDN1 expression in 26 ovarian cancer (OC) cell lines treated with 5 µM
 decitabine or vehicle for 72 h prior to measuring gene expression; p = paired t-test. (D) Quantitative real-time PCR (qRT-PCR) validation showing increased CLDN1
 expression following decitabine treatment; p = paired t-test.

TABLE 2 | Claudin-1 (CLDN1) methylation-expression relationships in matched primary-recurrent ovarian cancers and short (7 years) survivors.

CpG Probe                 Primary OC (n = 16)                     Recurrent OC (n = 16)                      Short-Term (n = 26)                    Long-Term (n = 21)

                       Pearson’s r               p             Pearson’s r                 p             Pearson’s r               p             Pearson’s r                p

cg00804587                −0.57               0.021                −0.63                  0.009              −0.19              0.421               −0.41               0.040
cg25330387                −0.40               0.123                −0.64                  0.008              −0.14              0.545               −0.41               0.037
cg03601836                −0.32               0.220                −0.62                  0.010              −0.01              0.969               −0.46               0.019
cg03623835                −0.45               0.081                −0.47                  0.063              0.06               0.799               −0.41               0.038

an inverse correlation between expression and methylation at its                           Figure 3). All of these CpG probes flank the CLDN1 promoter
sole intragenic CpG island in recurrent but not primary OC                                 CpG island in the 5’ shore (cg03623835), 3’ shore (cg25330387,
(cg06350432; Pearson correlation, R= –0.79, p= 0.0002 and R= –                             cg00804587) and 3’ shelf (cg03601836) suggesting that the
0.42, p= 0.11, respectively; data not shown). These data suggest                           surrounding regions of the promoter CpG island are potential
that at least two CLDN genes exhibit an enhanced methylation-                              “hotspots” for tumor control of transcription via altering
expression relationship in OC recurrence as compared to                                    epigenetic regulation. Given that CLDN1 is located in an
primary OCs.                                                                               intron region of CLDN16 (Figure 1A), we also assessed the
   In the short- and long-term survivor (GSE51820) (21) data                               methylation-expression correlation for CLDN16 at 10 CpG sites
analysis, CLDN1 expression was inversely correlated with DNA                               in both primary and recurrent tumors, but the results were not
methylation in short-term survivors, but not in long-term                                  significant (data not shown). Notably, the TCGA dataset showed
survivors, at the same probes identified in the matched                                     an inverse correlation between methylation and expression in
primary-recurrent data analysis (paired t-test, p= 0.02 to 0.04                            CLDN16 for primary OCs (Pearson correlation, R= -0.67,
versus p= 0.42 to 0.97, respectively; Table 2, Supplementary                               p=1.10e-65).

Frontiers in Oncology | www.frontiersin.org                                           6                                          March 2021 | Volume 11 | Article 620873
Visco et al. Epigenetic Regulation of CLDN1 in Ovarian Cancer
To further establish the relationship between methylation and treatment (paired t-test; p= 0.0545). Pharmacologic inhibition of
expression of CLDN1, we analyzed 26 OC cell lines that had been DNA methylation did not increase expression of other CLDN
treated with vehicle alone or with 5μM decitabine, a DNMT members (paired t-test, p= 0.08 to 0.91 for CLDN4, CLDN5,
inhibitor (Supplementary Table 1). Affymetrix Human Genome CLDN6, CLDN7, CLDN9, and CLDN10; data not shown).
U133A gene expression data showed that CLDN1 expression
increased in the majority of the decitabine treated cells (paired Chemical and Genetic Inhibition of CLDN1
t-test, p= 0.00027; Figure 1C). The microarray data was confirmed Suppresses Mobility and Invasion
by qRT-PCR using CLDN1-specific primers and probes Since tight junctions are important for spheroid formation (40),
(Figure 1D) with six of the seven tested cell lines showing up to we wanted to determine whether the expression of CLDN1 was
a 3-fold increase in CLDN1 expression following decitabine associated with spheroid formation and ovarian tumor
A
B
C
FIGURE 2 | CLDNs are functionally involved in cancer cell progression-related behaviors. (A, B) Ovarian cancer (OC) cell lines, HEYA8 and DOV13, were treated for
24 h with YM201636 (which blocks the recycling of the tight junction proteins, CLDN1/2) followed by migration (A) and proliferation (MTT) assays (B); p = two-sample
t-tests (*p < 0.05, **p < 0.01, ***p < 0.001). (C) OC cell lines (DOV13 and HEYA8) treated with 300 nM YM201636 under stem cell-selective culture conditions with
spheroid aggregation assessed at 2-h, 4-h, and 24-h time points after treatment.
Frontiers in Oncology | www.frontiersin.org 7 March 2021 | Volume 11 | Article 620873Visco et al. Epigenetic Regulation of CLDN1 in Ovarian Cancer
progression. Given that HEYA8 and DOV13 cells formed tight 24 h also led to significant inhibition of cell proliferation (two-
spheroids in culture (data not shown), these cell lines were sample t-tests, p< 0.01 for all doses and cell lines) and migration
cultured on low attachment plates in stem cell-selective (two-sample t-tests, p< 0.01 for all doses and cell lines) as
conditions (35). The cells were then treated with 300 nM compared to controls (Figures 2A, B).
PIKfyve Inhibitor YM201636, which blocks the continuous Given that YM201636 treatment is not specific to CLDN1
recycling of CLDN1/2 to the cellular membrane and is believed alone, we confirmed the role of CLDN1 by performing similar
to block their activity in cells (41). Spheroid formation was experiments using siRNA CLDN1 gene silencing. IGROV1 and
compared at 2-h, 4-h, and 24-h time points after YM201636 SKOV8 both showed significant CLDN1 knockdown efficiency
treatment (Figure 2C). While tight spheroid formation was (Supplementary Figure 1), so they were selected to analyze
observed in mock treated HEYA8 and DOV13 cells, CLDN1’s impact on migration and wound healing. The siRNA-
YM201636 treatment disrupted spheroid formation as early as mediated knockdown of CLDN1 expression in 2D culture
4 h after treatment as demonstrated by the looser cell aggregates (paired t-test; p= 0.039; Figure 3A) led to slower migration of
and the presence of single isolated cells and very small aggregates IGROV1 and SKOV8 (two-sample t-tests, p< 0.001 and p=
as compared to the controls. Incubating cells with YM201636 for 0.046, respectively) cells (Figure 3B). Wound healing assays
A B C
D
E
F G
FIGURE 3 | Claudins (CLDNs) are functionally involved in cancer cell progression-related behaviors. (A) Knockdown CLDN1 expression in ovarian cancer (OC) cell
lines, SKOV8 and IGROV1. Real-time PCR (RT-PCR) demonstrated the knockdown efficiency with CLDN1-specific siRNAs (siCLDN1) versus control siRNA (siCON);
p = paired t-test. (B) Cell migration assays with CLDN1 knockdown and control cells; p= two-sample t-test (*p < 0.05, ***p < 0.001). (C) Wound healing assay
showing a significant decrease in wound healing in siCLDN1 cells as compared to siCON. (D) CLDN1 knockdown in SKOV8 and IGROV1 OC cells lead to a
significant decrease in wound healing capabilities; p = paired t-test. (E) Western blot showed significant knockdown of CLDN1 in OVCA429 and OVCAR5 cell lines
used for spheroid formation assay. (F) Micrographs taken under 40× magnification to assess spheroid formation at 0, 4, and 24 h following culture in stem cell
selective media for siCON and siCLDN1 treated OVCA429 and OVCAR5 cells. (G) Control siRNA (siCON) and CLDN1-specific siRNAs (siCLDN1) transfected SKOV8
and CAOV2 cells were treated with carboplatin or paclitaxel and IC50 values were calculated, showing significant IC50 reduction in CLDN1 knockdown cells;
p = paired t-test.
Frontiers in Oncology | www.frontiersin.org 8 March 2021 | Volume 11 | Article 620873Visco et al. Epigenetic Regulation of CLDN1 in Ovarian Cancer
for IGROV1 and SKOV8 indicated that CLDN1 knockdown primary EMT-associated genes, CDH1, SNAI1, BMP1 and VIM,
resulted in delayed gap closure (paired t-test, p= 0.046 and p= showed no significant changes in expression. The lack of primary
0.043, respectively; Figures 3C, D), supporting an important role EMT-associated gene changes in a CLDN1 knockdown model
for CLDN1 in cancer cell migration. This impact on cell-cell suggests that CLDN1 is not a primary mediator in OC
interactions was verified in two additional cell lines, OVCA429 EMT progression.
and OVCAR5, which had significant CLDN1 knockdown
efficiency (Figure 3E, Supplementary Figure 1). Spheroid CLDN1 Knockdown Is Associated With
formation was less efficient following CLDN1 knockdown in Repression of CD44 and CD133
both OVCA429 and OVCAR5 OC cells (Figure 3F). We have shown that CLDN1 is important for spheroid formation
using CLDN1/2 trafficking inhibition by YM201636 (Figure 2C)
CLDN1 Knockdown Increases Drug and CLDN1 knockdown (Figure 3F). Increased expression of
Sensitivity Cluster of Differentiation 44 (CD44) occurs in OC during the
Since chemoresistance is a very prevalent feature in recurrent development of metastasis, recurrence and drug resistance (42).
OCs, we analyzed chemosensitivity in cells following repression Spheroid formation is an important feature of cancer-initiating
of CLDN1. SKOV8 and CAOV2 were chosen given their cells (CIC) and a number of cell surface molecules have been
significant CLDN1 knockdown efficiency (Supplementary associated with ovarian CICs, including CD44 and CD133 (43).
Figure 1). siRNA-mediated knockdown led to enhanced We therefore investigated associations between CLDN1 and
sensitivity to carboplatin and paclitaxel treatment in SKOV8 these CIC cell markers. CAOV2, OVCAR5, and SKOV8 cells
and CAOV2 cells (Figure 3G). The IC50 values for both drugs were chosen for their significant response to CLDN1 knockdown
were significantly decreased in the SKOV8 CLDN1 knockdown (Supplementary Figure 1). Real-time RT-PCR of CD44 and
cells as compared to the same cell lines that received the non- CD133 expression in CAOV2, OVCAR5, and SKOV8 cells with
silencing control siRNA (paired t-test, p< 0.01), as well as for CLDN1 knockdown versus control cells showed CD44 and
paclitaxel in the CAOV2 CLDN1 knockdown cells (paired t-test, CD133 transcription products were both repressed (Figure
p 2-fold in CLDN1 down- via live imaging and received chemotherapeutic treatment with
regulated HEYA8 cells as compared to controls. However, the carboplatin. After three treatments, all six mice in the shCON
Frontiers in Oncology | www.frontiersin.org 9 March 2021 | Volume 11 | Article 620873Visco et al. Epigenetic Regulation of CLDN1 in Ovarian Cancer
A
B
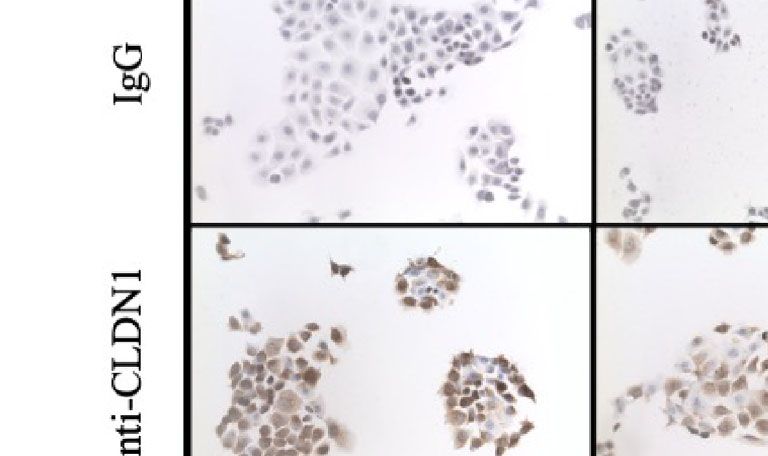
FIGURE 4 | Claudin-1 (CLDN1) is not involved in epithelial-to-mesenchymal transition (EMT). (A) Four cell lines were transfected with control siRNA (siCON) or
CLDN1-specific siRNAs (siCLDN1) constructs. The cells were harvested 72 h post transfection. Western blotting was performed with antibodies against CLDN1,
CDH1, Vimentin (VIM) and GAPDH. (B) Cytospins of siCON and siCLDN1 OVCAR5 knockdown cells were evaluated with antibodies against CLDN1 and VIM with
IgG used as a negative control.
group still had detectable tumors, but only two mice in the DISCUSSION
shCLDN1 group had detectable tumors upon. The mice were
dissected following the experiment to confirm tumor formation. The aim of this study was to evaluate the functional significance
A repeat test with the same experimental parameters showed of CLDN1 expression by using data from matched primary-
greater average tumor size reduction in the shCLDN1 group recurrent OC tumor samples along with in vitro and in vivo
versus the shCON group following treatment (39.1% versus studies. OC has a high mortality rate largely due to the fact that
21.6%, respectively; Figure 6B), but the result was not 75% of patients are diagnosed with advanced stage disease that
statistically significant (Mann-Whitney test, p= 0.67). Taken has metastasized throughout the peritoneal cavity (44), and
together, these results support that repression of CLDN1 therefore an understanding of the mechanisms of metastasis is
expression in OC cells increases chemosensitivity in vivo. critical. OC metastasis occurs mainly through direct seeding of
Frontiers in Oncology | www.frontiersin.org 10 March 2021 | Volume 11 | Article 620873Visco et al. Epigenetic Regulation of CLDN1 in Ovarian Cancer
A
B
FIGURE 5 | The role of Claudins (CLDNs) in OC progression may involve cancer initiating cells. (A) Real-time PCR (RT-PCR) was performed for expression of
CLDN1, CD44, and CD133 in siCLDN1 cells in three cell lines; p = two-sample t-test (*p < 0.05, **p < 0.01, ***p < 0.001). (B) The microarray dataset from paired
primary-recurrent ovarian cancer (OC) was analyzed for co-expression of CD44 and CLDN1, CD44 and CLDN4, and CD44 and CLDN7 [x-axis, robust multiarray
average algorithm (RMA) normalized expression values of CD44; y-axis, RMA normalized expression values of CLDNs]. Pearson correlation and p-values are shown.
adjacent organs and tissues with cancer cells that have epigenetic mechanisms. Indeed, we found that the expression of
dissociated from the primary site (45). The role of tight CLDN1 was inversely correlated with DNA methylation in OC
junctions in cancer metastasis and recurrence is largely cells using both RT-PCR and microarray analysis. The results
attributable to their function in cell-cell adhesion. CLDNs have indicate that increased DNA methylation is associated with
emerged as a primary mediator in these cell-cell interactions and decreased CLDN1 expression and this association seems to be
thus, cancer metastasis and recurrence (46). CLDN1 has been important for OC recurrence (Table 2). Furthermore, this
studied in cancer progression (47) and an association between relationship was also observed in tumors from patients with
CLDN1 expression and poor prognosis or survival was reported short-term survival but not in tumors from patients with long-
in colon (48) and breast cancers (49). In the short- and long-term term survival. Additionally, patient survival was not associated
survivor (GSE51820) dataset (21) from patients with post- with CLDN1 expression in the matched primary-recurrent data.
chemotherapy ovarian carcinoma effusions, higher CLDN1 This suggests that methylation may regulate CLDN1 expression
expression was correlated with shorter overall survival (50). in tumors from specific patients, and that it may play an
However, the molecular mechanisms by which CLDN1 affects important role in OC progression and prognosis. These data
tumorigenesis and tumor progression in OC remain largely also show that epigenetic regulation of CLDN1 expression is
unstudied. Thus, the question of whether CLDN1 functions as more pronounced in aggressive OCs, with stronger methylation-
a tumor promoter or tumor suppressor has not been established expression relationships potentially predictive of poorer
in cancers, including OC. patient prognosis.
An inverse association between DNA hypermethylation and Given that CLDN1 is located in an intron of CLDN16, we
gene expression of CLDNs has been identified in gastric cancer hypothesized that there may be a similar relationship with
(16) and breast cancer cells (17). Di Cello et al. reported a CLDN16 gene expression and methylation in aggressive OCs.
negative correlation between CLDN1 expression and promoter The TCGA dataset showed a significant inverse correlation
methylation in estrogen receptor-positive breast cancer (51). between methylation and expression of CLDN16, but this
These data suggest that epigenetic regulation is involved in relationship was not detected in our primary-recurrent dataset.
CLDN gene expression. The lack of mutations and wide range Interestingly, the sole intragenic CLDN4 CpG site on this assay
of gene expression levels in OCs from the TCGA data analysis showed a significant inverse correlation in the recurrent tumors,
further support our hypothesis that CLDN1 may be regulated by yet DNMT inhibition of CLDN4 showed no significant change in
Frontiers in Oncology | www.frontiersin.org 11 March 2021 | Volume 11 | Article 620873Visco et al. Epigenetic Regulation of CLDN1 in Ovarian Cancer
A
B
FIGURE 6 | Claudin-1 (CLDN1) knockdown inhibits xenograft tumor formation in nude mice. (A) SKOV3 cells were stably transduced with shRNA for CLDN1 or an
off-target shRNA control using lentivirus infection. CLDN1 protein expression was tested by Western blotting. Clone #3 was selected for use in the xenograft
experiment, due to superior knockdown efficiency. Ten mice each were included in the control and CLDN1 knockdown arms. SKOV3 cells (5×10⁴ per mouse) were
injected intraperitoneally. (B) Tumor signal was monitored using the IVIS Kinetic Living Image System indicated as total photon flux. Bar graph shows relative signal
strength for shCON and shCLDN1 tumors pre and post-treatment with carboplatin. After three treatments, 21.6% tumor size reduction in the control group and
39.1% tumor size reduction in the shCLDN1 group have been observed (Mann-Whitney test, p = 0.67).
expression levels. Meanwhile, the CLDN1 CpGs analyzed here positive correlation between CD44 and CLDN1 expression in
showed significant inverse methylation-expression relationships recurrent OC (Figure 5B) was supported by the decrease in
in recurrent tumors, and DNMT treatment showed increased CD44 and CD133 expression in CLDN1 knockdown cells Figure
CLDN1 expression levels. This may indicate that CpG islands are 5A). This suggests a functional relationship between tight
more resistant to the effects of DNMT inhibitors than CpG sites junction proteins and CICs, which lead to more aggressive and
located in shore and shelf regions. recurrent OCs.
Our functional assessment of CLDN1 in cancer cell Epithelial mesenchymal transition (EMT) and the reverse
proliferation, migration, spheroid formation, and wound process, mesenchymal epithelial transition (MET), have been
healing also suggests that elevated CLDN1 expression is identified as important steps in cancer metastasis. Suh et al.,
associated with a more aggressive phenotype. Spheroid showed that CLDN1 is overexpressed in human hepatocellular
formation in ascites fluid is a fundamental feature of CICs (52) carcinoma cells and is capable of promoting the EMT process,
that is believed to allow cancer cells to embed themselves in suggesting a close relationship between CLDN1 and EMT (11).
surrounding tissues of the peritoneal cavity, which may seed However, we did not find strong associations between CLDN1 and
metastases and may serve as precursors of recurrent disease. EMT factors using Western Blotting and immunohistochemistry.
YM201636 and CLDN1-specific siRNAs both impede spheroid Similarly, the EMT RT2 Profiler PCR Arrays did not show
formation and suggest a potential role for targeting spheroids in significant changes for any primary EMT-related factors in
order to limit OC spread and recurrence (Figures 2C and 3D). CLDN1 knockdown cells. This indicates that the role of CLDN1
Disrupting the ability of OC cells to aggregate may prevent spheroids in tumor metastasis and in the enhanced presence of CIC markers
from embedding into other tissues in the peritoneal cavity and could CD44 and CD133 is not due to EMT pathway induction.
also enhance sensitivity to chemotherapeutic agents. Increased sensitivity to common chemotherapeutic agents for
We showed that CLDN1 transcription is positively correlated serous OC was observed in CLDN1 knockdown OC cells,
with the expression of CIC marker CD44 in primary OC, but suggesting an association between CLDN1 expression and
negatively correlated in recurrent OC (Figure 5B). Notably, the chemosensitivity. Our in vivo study demonstrated that CLDN1
Frontiers in Oncology | www.frontiersin.org 12 March 2021 | Volume 11 | Article 620873Visco et al. Epigenetic Regulation of CLDN1 in Ovarian Cancer
expression is associated with greater tumor burden and a p p r o v e d b y D u k e I n s t i t u t i o n a l A n i m a l Ca re a n d
resistance to treatment, though this result was not statistically Use Committee.
significant. This was consistent with our in vitro model which
showed greater chemoresistance in cells that expressed CLDN1.
These preclinical results indicate CLDN1 suppression may be a
viable strategy for reducing the onset of aggressive OC
AUTHOR CONTRIBUTIONS
phenotypes and recurrent disease. Our use of YM201636, ZV, AB, SM, and ZH performed project development and
which blocks recycling of tight junction proteins, demonstrates experimental design. ZV, GS, CG, M-HB, SS, IR, RW, DY, and
its efficacy in limiting CLDN1 function and provides a potential ZH performed data collection. ZV and ZH performed data
treatment strategy for more advanced OC. analysis and SM original manuscript drafting. AB, SM, and GS
Our findings may provide new targets for OC treatment, provided funding support. ZV, IR, AB, SM, and ZH performed
specifically with the aim of extending survival by preventing manuscript editing and revision. All authors contributed to the
recurrent OC. For example, new technology like that provided by article and approved the submitted version.
using a deactivated dCas9 (53) that can specifically methylate the
CLDN1 promoter sequence and inhibit transcriptional activity of
CLDN1 presents an exciting opportunity. Thus, CLDN1 targeting
may be an effective treatment option for recurrent OC, particularly FUNDING
in patients with high basal CLDN1 expression levels. The idea to
reduce expression of CLDN1 should also be considered in the This study was supported by the Foundation for Women’s
context of the use of general DNA hypomethylating agents that are Cancer (GS and SM) and the Gail Parkins Ovarian Cancer
being used to reactivate tumor suppressor and pro-apoptotic genes Awareness Fund.
and potentiate response to other cytotoxic chemotherapeutic agents,
including in solid tumors. Such treatment could also inadvertently
reactivate expression of genes like CLDN1 for which increasing
expression may be detrimental. In this regard, the development of ACKNOWLEDGMENTS
highly targeted, individualized approaches to reactivate as well as We are incredibly grateful to the women and their families whose
repress particular genes based on their status will be optimal but lives are affected by ovarian cancer for their generosity and
must await further technological advances that allow for such a willingness to participate in research.
strategy to be clinically implemented.
This study’s strengths include the use of paired primary-
recurrent tumors and ‘omics technologies to identify
methylation/expression relationships that are divergent between SUPPLEMENTARY MATERIAL
these two phases of the disease. This study is also strengthened by
the use of both in vitro and in vivo studies to validate the role of The Supplementary Material for this article can be found online
CLDN1 in OC. This study’s limitations include a relatively small at: https://www.frontiersin.org/articles/10.3389/fonc.2021.
sample size and the retrospective nature of the analysis. 620873/full#supplementary-material
Taken together, our results support that CLDN1 plays a critical
Supplementary Figure 1 | CLDN1 knockdown efficiency in seven OC cell lines
role in the development of recurrent OC and resistance to current 72 hours post-transfection with beta-2-microglobulin as an internal control. HEYA8
chemotherapeutic regimens that are standard of care. Developing had the greatest knockdown efficiency at approximately 88%.
strategies to target CLDN1 may lead to enhanced chemosensitivity
and hinder tumor metastasis and OC recurrence. Supplementary Figure 2 | Two siRNA variants, siCLDN1-6 and siCLDN1-8
were transfected into IGROV1 and CAOV2 cells to identify which variant produced
a more effective CLDN1 knockdown compared to siCON (p = two-sample t-test;
*p < 0.05, **p < 0.01).
DATA AVAILABILITY STATEMENT Supplementary Figure 3 | (A) CLDN1 methylation-expression relationships in
16 matched primary-recurrent ovarian cancer tumor pairs at four CpG sites. The
The raw data supporting the conclusions of this article is positions of the CpG probes on the Illumina Infinium HumanMethylation450
available, without undue reservation from the Duke Digital BeadChip CLDN1 locus are shown in the schematic in Figure 1. (B) CLDN1
Data Repository. methylation-expression relationships in 21 long-term survival (>7 years) and 26
short-term survival (Visco et al. Epigenetic Regulation of CLDN1 in Ovarian Cancer
21. Berchuck A, Iversen ES, Lancaster JM, Pittman J, Luo J, Lee P, et al. Patterns of
REFERENCES gene expression that characterize long-term survival in advanced stage serous
ovarian cancers. Clin Cancer Res (2005) 11(10):3686–96. doi: 10.1158/1078-
1. Torre LA, Trabert B, DeSantis CE, Miller KD, Samimi G, Runowicz CD, et al. 0432.CCR-04-2398
Ovarian cancer statistics, 2018. CA Cancer J Clin (2018) 68(4):284–96. 22. Murphy S, Berchuck A, Whitaker A, Sfakianos G, Huang Z. Gene Expression
doi: 10.3322/caac.21456 using Affymetrix Human Genome U133 Plus 2 Arrays from 16 Primary and
2. Grabowski JP, Sehouli J. Current management of ovarian cancer. Minerva Recurrent Serous Epithelial Ovarian Cancers. Duke Research Data Repository
Med (2015) 106(3):151–6. (2021). doi: 10.7924/r43f4sx2k
3. Armstrong DK, Bundy B, Wenzel L, Huang HQ, Baergen R, Lele S, et al. 23. Tian Y, Morris TJ, Webster AP, Yang Z, Beck S, Feber A, et al. ChAMP:
Intraperitoneal cisplatin and paclitaxel in ovarian cancer. N Engl J Med (2006) updated methylation analysis pipeline for Illumina BeadChips. Bioinformatics
354(1):34–43. doi: 10.1056/NEJMoa052985 (2017) 33(24):3982–4. doi: 10.1093/bioinformatics/btx513
4. Hentze JL, Hogdall CK, Hogdall EV. Methylation and ovarian cancer: Can 24. Morris TJ, Butcher LM, Feber A, Teschendorff AE, Chakravarthy AR,
DNA methylation be of diagnostic use? Mol Clin Oncol (2019) 10(3):323–30. Wojdacz TK, et al. ChAMP: 450k Chip Analysis Methylation Pipeline.
doi: 10.3892/mco.2019.1800 Bioinformatics (2014) 30(3):428–30. doi: 10.1093/bioinformatics/btt684
5. Dong A, Lu Y, Lu B. Genomic/Epigenomic Alterations in Ovarian 25. Teschendorff AE, Marabita F, Lechner M, Bartlett T, Tegner J, Gomez-
Carcinoma: Translational Insight into Clinical Practice. J Cancer (2016) 7 Cabrero D, et al. A beta-mixture quantile normalization method for
(11):1441–51. doi: 10.7150/jca.15556 correcting probe design bias in Illumina Infinium 450 k DNA methylation
6. Coleman RL, Spirtos NM, Enserro D, Herzog TJ, Sabbatini P, Armstrong DK, data. Bioinformatics (2013) 29(2):189–96. doi: 10.1093/bioinformatics/bts680
et al. Secondary Surgical Cytoreduction for Recurrent Ovarian Cancer. N Engl 26. Morris TJ, Beck S. Analysis pipelines and packages for Infinium
J Med (2019) 381(20):1929–39. doi: 10.1056/NEJMoa1902626 HumanMethylation450 BeadChip (450k) data. Methods (2015) 72:3–8.
7. Desai A, Xu J, Aysola K, Qin Y, Okoli C, Hariprasad R, et al. Epithelial ovarian doi: 10.1016/j.ymeth.2014.08.011
cancer: An overview. World J Transl Med (2014) 3(1):1–8. doi: 10.5528/ 27. Zhou W, Laird PW, Shen H. Comprehensive characterization, annotation and
wjtm.v3.i1.1 innovative use of Infinium DNA methylation BeadChip probes. Nucleic Acids
8. Loret N, Denys H, Tummers P, Berx G. The Role of Epithelial-to- Res (2017) 45(4):e22. doi: 10.1093/nar/gkw967
Mesenchymal Plasticity in Ovarian Cancer Progression and Therapy 28. Nordlund J, Backlin CL, Wahlberg P, Busche S, Berglund EC, Eloranta ML,
Resistance. Cancers (Basel) (2019) 11(6):838–60. doi: 10.3390/ et al. Genome-wide signatures of differential DNA methylation in pediatric
cancers11060838 acute lymphoblastic leukemia. Genome Biol (2013) 14(9):r105–20.
9. Moh MC, Shen S. The roles of cell adhesion molecules in tumor suppression doi: 10.1186/gb-2013-14-9-r105
and cell migration: a new paradox. Cell Adh Migr (2009) 3(4):334–6. 29. Mansell G, Gorrie-Stone TJ, Bao Y, Kumari M, Schalkwyk LS, Mill J, et al.
doi: 10.4161/cam.3.4.9246 Guidance for DNA methylation studies: statistical insights from the Illumina
10. Zihni C, Mills C, Matter K, Balda MS. Tight junctions: from simple barriers to EPIC array. BMC Genomics (2019) 20(1):366. doi: 10.1186/s12864-019-5761-7
multifunctional molecular gates. Nat Rev Mol Cell Biol (2016) 17(9):564–80. 30. Hansen KD. IlluminaHumanMethylation450kanno.ilmn12.hg19: Annotation
doi: 10.1038/nrm.2016.80 for Illumina"s 450k methylation arrays. R package version. (2013). doi:
11. Suh Y, Yoon CH, Kim RK, Lim EJ, Oh YS, Hwang SG, et al. Claudin-1 induces 10.18129/B9.bioc.IlluminaHumanMethylation450kanno.ilmn12.hg19
epithelial-mesenchymal transition through activation of the c-Abl-ERK 31. Irizarry RA, Hobbs B, Collin F, Beazer-Barclay YD, Antonellis KJ, Scherf U,
signaling pathway in human liver cells. Oncogene (2013) 32(41):4873–82. et al. Exploration, normalization, and summaries of high density
doi: 10.1038/onc.2012.505 oligonucleotide array probe level data. Biostatistics (2003) 4(2):249–64.
12. Boylan KL, Misemer B, De Rycke MS, Andersen JD, Harrington KM, Kalloger doi: 10.1093/biostatistics/4.2.249
SE, et al. Claudin 4 Is differentially expressed between ovarian cancer subtypes 32. Chang JT, Nevins JR. GATHER: a systems approach to interpreting genomic
and plays a role in spheroid formation. Int J Mol Sci (2011) 12(2):1334–58. signatures. Bioinformatics (2006) 22(23):2926–33. doi: 10.1093/
doi: 10.3390/ijms12021334 bioinformatics/btl483
13. Burleson KM, Casey RC, Skubitz KM, Pambuccian SE, Oegema TR Jr, Skubitz 33. Matsumura N, Huang Z, Mori S, Baba T, Fujii S, Konishi I, et al. Epigenetic
AP. Ovarian carcinoma ascites spheroids adhere to extracellular matrix suppression of the TGF-beta pathway revealed by transcriptome profiling in
components and mesothelial cell monolayers. Gynecol Oncol (2004) 93 ovarian cancer. Genome Res (2011) 21(1):74–82. doi: 10.1101/gr.108803.110
(1):170–81. doi: 10.1016/j.ygyno.2003.12.034 34. Baba T, Convery PA, Matsumura N, Whitaker RS, Kondoh E, Perry T, et al.
14. Weidle UH, Birzele F, Kollmorgen G, Rueger R. Mechanisms and Targets Epigenetic regulation of CD133 and tumorigenicity of CD133+ ovarian cancer
Involved in Dissemination of Ovarian Cancer. Cancer Genomics Proteomics cells. Oncogene (2009) 28(2):209–18. doi: 10.1038/onc.2008.374
(2016) 13(6):407–23. doi: 10.21873/cgp.20004 35. Ponti D, Costa A, Zaffaroni N, Pratesi G, Petrangolini G, Coradini D, et al.
15. Stache C, Holsken A, Fahlbusch R, Flitsch J, Schlaffer SM, Buchfelder M, et al. Isolation and in vitro propagation of tumorigenic breast cancer cells with
Tight junction protein claudin-1 is differentially expressed in stem/progenitor cell properties. Cancer Res (2005) 65(13):5506–11.
craniopharyngioma subtypes and indicates invasive tumor growth. Neuro doi: 10.1158/0008-5472.CAN-05-0626
Oncol (2014) 16(2):256–64. doi: 10.1093/neuonc/not195 36. Visvader JE, Lindeman GJ. Cancer stem cells in solid tumours: accumulating
16. Agarwal R, Mori Y, Cheng Y, Jin Z, Olaru AV, Hamilton JP, et al. Silencing of evidence and unresolved questions. Nat Rev Cancer (2008) 8(10):755–68.
claudin-11 is associated with increased invasiveness of gastric cancer cells. doi: 10.1038/nrc2499
PloS One (2009) 4(11):e8002. doi: 10.1371/journal.pone.0008002 37. Zhang S, Balch C, Chan MW, Lai HC, Matei D, Schilder JM, et al.
17. Kominsky SL, Argani P, Korz D, Evron E, Raman V, Garrett E, et al. Loss of Identification and characterization of ovarian cancer-initiating cells from
the tight junction protein claudin-7 correlates with histological grade in both primary human tumors. Cancer Res (2008) 68(11):4311–20. doi: 10.1158/
ductal carcinoma in situ and invasive ductal carcinoma of the breast. 0008-5472.CAN-08-0364
Oncogene (2003) 22(13):2021–33. doi: 10.1038/sj.onc.1206199 38. De Vlieghere E, Carlier C, Ceelen W, Bracke M, De Wever O. Data on in vivo
18. George SH, Garcia R, Slomovitz BM. Ovarian Cancer: The Fallopian Tube as selection of SK-OV-3 Luc ovarian cancer cells and intraperitoneal tumor
the Site of Origin and Opportunities for Prevention. Front Oncol (2016) 6:108. formation with low inoculation numbers. Data Brief (2016) 6:542–9.
doi: 10.3389/fonc.2016.00108 doi: 10.1016/j.dib.2015.12.037
19. Cancer Genome Atlas Research N. Integrated genomic analyses of ovarian 39. Mendenhall A, Lesnik J, Mukherjee C, Antes T, Sengupta R. Packaging HIV-
carcinoma. Nature (2011) 474(7353):609–15. doi: 10.1038/nature10166 or FIV-based lentivector expression constructs and transduction of
20. Murphy SK, Berchuk A, Whitaker R, Sfakianos G, Huang Z. Primary and VSV-G pseudotyped viral particles. J Vis Exp (2012) 62):e3171.
recurrent (second-look surgery) serous epithelial ovarian cancers Illumina doi: 10.3791/3171
Infinium HumanMethylation450 BeadChip data. Duke Research Data 40. Yeh HY, Liu BH, Hsu SH. The calcium-dependent regulation of spheroid
Repository (2021). doi: 10.7924/r4765hq5 formation and cardiomyogenic differentiation for MSCs on chitosan
Frontiers in Oncology | www.frontiersin.org 14 March 2021 | Volume 11 | Article 620873You can also read