Lung Cancer - Universitat de Barcelona
←
→
Page content transcription
If your browser does not render page correctly, please read the page content below
Lung Cancer 135 (2019) 151–160

                                                                     Contents lists available at ScienceDirect

                                                                                 Lung Cancer
                                                       journal homepage: www.elsevier.com/locate/lungcan

Stromal markers of activated tumor associated fibroblasts predict poor                                                                                       T
survival and are associated with necrosis in non-small cell lung cancer
                                ⁎
Jordi Alcaraza,b,c,d, , Josep Lluís Carrascoe, Laura Millaresb,c,f, Iuliana-Cristiana Luisa,
Francisco J. Fernández-Porrasa, Anabel Martínez-Romerob,g, Natalia Diaz-Valdiviaa,
Julio Sánchez De Cosb,c,h, Ramon Rami-Portab,c,i, Luis Seijoc,j, Josep Ramírezk,
María José Pajaresc,l, Noemí Reguartm, Esther Barreirob,c,g, Eduard Monsób,c,f,n
a
  Unit of Biophysics and Bioengineering, Department of Biomedicine, School of Medicine and Health Sciences, Universitat de Barcelona, Barcelona, Spain
b
  CIBER de Enfermedades Respiratorias — CIBERES, Instituto de Salud Carlos III, Madrid, Spain
c
  Grupo Colaborativo en Cáncer de Pulmón CIBERES-CIBERONC-SEPAR-Plataforma Biobanco Pulmonar, Spain
d
  Institute for Bioengineering of Catalonia (IBEC), The Barcelona Institute for Science and Technology (BIST), Barcelona, Spain
e
  Unit of Biostatistics, Department of Basic Clinical Practice, School of Medicine and Health Sciences, Universitat de Barcelona, Barcelona, Spain
f
  Respiratory Medicine, Hospital Universitari Parc Taulí, Sabadell, Spain
g
  Muscle Wasting and Cachexia in Chronic Respiratory Diseases and Lung Cancer, IMIM-Hospital del Mar, CEXS, UPF, PRBB, Barcelona, Spain
h
  Hospital San Pedro de Alcántara, Cáceres, Spain
i
  Hospital Universitari Mutua Terrassa, Terrassa, Spain
j
  Fundación Jímenez Díaz, Madrid, Spain
k
  Anatomopathology Department, Hospital Clínic de Barcelona, Barcelona, Spain
l
  Program in Solid Tumors and Biomarkers, Center for Applied Medical Research (CIMA) and CIBERONC, Pamplona, Spain
m
   Medical Oncology Department, Hospital Clínic de Barcelona, IDIBAPS, Barcelona, Spain
n
  Department of Medicine, Universitat Autònoma de Barcelona (UAB), Barcelona, Spain

A R T I C LE I N FO                                         A B S T R A C T

Keywords:                                                   Objectives: Tumor associated fibroblasts (TAFs) are essential contributors of the progression of non-small cell
Lung cancer                                                 lung cancer (NSCLC). Most lung TAFs exhibit an activated phenotype characterized by the expression of α-SMA
Collagen                                                    and fibrillar collagens. However, the prognostic value of these activation markers in NSCLC remains unclear.
α-SMA                                                       Material and Methods: We conducted a quantitative image analysis of α-SMA immunostaining and picrosirius red
Cancer associated fibroblast
                                                            staining of fibrillar collagens imaged by bright-field and polarized microscopy, respectively, using tissue mi-
Survival
                                                            croarrays with samples from 220 surgical patients, which elicited a percentage of positive staining area for each
Necrosis
                                                            marker and patient.
                                                            Results: Kaplan-Meier curves showed that all TAF activation markers were significantly associated with poor
                                                            survival, and their prognostic value was independent of TNM staging as revealed by multivariate analysis, which
                                                            elicited an adjusted increased risk of death after 3 years of 129% and 94% for fibrillar collagens imaged with
                                                            bright-field (p = 0.004) and polarized light (p = 0.003), respectively, and of 89% for α-SMA (p = 0.009). We
                                                            also found a significant association between all TAF activation markers and tumor necrosis, which is often
                                                            indicative of hypoxia, supporting a pathologic link between tumor desmoplasia and necrosis/hypoxia.
                                                            Conclusions: Our findings identify patients with large histologic coverage of fibrillar collagens and α-
                                                            SMA + TAFs to be at higher risk of recurrence and death, supporting that they could be considered for adjuvant
                                                            therapy.

  Abbreviations: ADC, adenocarcinoma; α-SMA, alpha smooth muscle actin; BF, brightfield; HR, hazard ratio; LCC, large cell carcinoma; OS, overall survival; PL,
polarized light; PSR, picrosirius red; SCC, squamous cell carcinoma; TAF, tumor-associated fibroblast; TMA, tissue microarray
  ⁎
    Corresponding author at: Unit of Biophysics and Bioengineering, Department of Biomedicine, School of Medicine and Health Sciences, Universitat de Barcelona,
Barcelona, Spain.
    E-mail address: jalcaraz@ub.edu (J. Alcaraz).

https://doi.org/10.1016/j.lungcan.2019.07.020
Received 11 October 2018; Received in revised form 18 June 2019; Accepted 22 July 2019
0169-5002/ © 2019 The Authors. Published by Elsevier B.V. This is an open access article under the CC BY-NC-ND license
(http://creativecommons.org/licenses/BY-NC-ND/4.0/).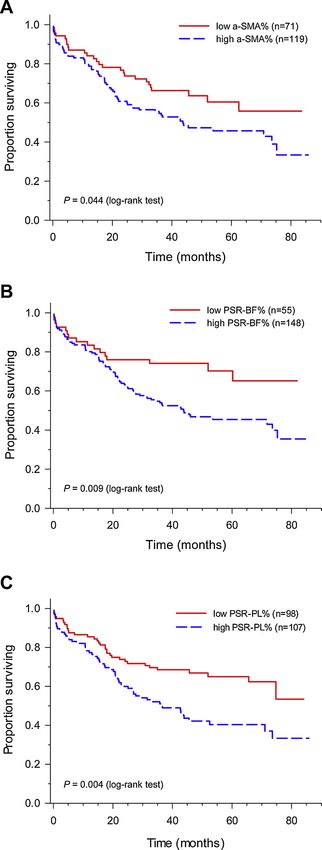
J. Alcaraz, et al.                                                                                                                 Lung Cancer 135 (2019) 151–160

1. Introduction                                                                      pathological diagnosis and PET imaging. Survival was assessed yearly.
                                                                                     The experimental protocol was approved by the Ethics Committee of
    Lung cancer is the leading cause of cancer-related death in both men             the study (Fundació Parc Taulí, PI12/02040) and by the Ethics Com-
and women worldwide, with an overall 5 year survival rate of 18%                     mittees of all participating centers. Written informed consent was ob-
[1,2]. This leading position is partly associated with the fact that most            tained from all patients.
lung cancer patients remain undiagnosed until the disease is sympto-
matic and has reached an advanced stage [3]. Surgically-treated pa-                  2.2. Tissue microarray construction
tients tend to exhibit better prognosis, particularly when diagnosed at
early stages, but still have a suboptimal potential cure of only ˜30-50%                 Formalin-fixed paraffin embedded tissue samples were obtained
[1].                                                                                 from participating hospitals and stored at the CIBERES Pulmonary
    Histologically, non-small cell lung cancer (NSCLC) is diagnosed in               Biobank Platform (PBP). Three expert pathologists evaluated the sam-
up to 90% of lung cancer patients, and adenocarcinoma (ADC) and                      ples, confirmed the histologic diagnosis and selected a representative
squamous cell carcinoma (SCC) are the major subtypes [1]. Because                    tumor area for core extraction and subsequent Tissue Microarray (TMA)
these lung cancer subtypes are epithelial in origin, most previous stu-              analysis. TMAs were prepared at the Morphology Core Facility at the
dies have focused on the pathologic features of lung carcinoma cells.                Center for Applied Medical Research (CIMA) of the University of
However, it is increasingly acknowledged the prominent role of the stiff              Navarra (Pamplona, Spain). TMAs were constructed using a manual
desmoplastic tumor stroma that surrounds carcinoma cells in the pro-                 tissue arrayer (MTA-1, Beecher Instruments). Three cylinders of 1 mm
gression of lung cancer and other solid tumors [4]. This desmoplastic                in diameter were obtained within a representative tumor region for
stroma is rich in activated fibroblasts (referred to as cancer- or tumor-             each tumor sample, cut in 3 μm sections with a microtome (Microm,
associated fibroblasts (TAFs)), infiltrated immune cells and other less                HM350S), and distributed as 3 sections per sample. Each TMA included
frequent cell types, in the background of an abundant deposition of                  samples from either ADC, SCC or other histologic subtypes, and were
fibrillar collagens and other fibrotic extracellular matrix components                 stored in paraffin until use.
[4,5]. Of note, TAFs are largely responsible for the aberrant stromal
deposition of fibrillar collagens within the tumor stroma [6], and are                2.3. Histology
receiving increasing interest as a therapeutic target [7], as illustrated by
the recent approval of the antiangiogenic and antifibrotic drug ninte-                    Fibrillar collagens were stained with PSR, whereas α-SMA and Ki-67
danib to treat lung ADC patients in combination with docetaxel [8,9].                were stained by immunohistochemistry. α-SMA and PSR stainings were
    In addition to their therapeutic relevance, studies in vitro have re-            conducted with the Bond automated system (Leica Microsystems) as
ported the prognostic value of epigenetic and transcriptional signatures             described [19,20]. Nuclei were counterstained with hematoxylin. α-
associated with pulmonary TAFs [10,11]. In contrast, little is known on              SMA, PSR and Ki-67 were visualized with bright field illumination with
the clinical relevance of standard markers of activated fibroblasts in                an upright microscope (BX43, Olympus) coupled to a digital camera
histologic samples from NSCLC patients. Thus very few studies have                   (DP72, Olympus) using a 10× objective (Olympus). PSR staining was
examined the prognostic value of stromal alpha-smooth muscle actin                   also imaged with an upright microscope (DMRB, Leica) equipped with
(α-SMA) in lung cancer, which is the gold standard marker of fibroblast               polarized filters coupled to a digital camera (DFC450, Leica) using a
activation [12]; moreover these studies have reported contradictory                  10×/0.25 NPlan objective (Leica). Vascular invasion (arterial or ve-
results [13,14], underscoring that the prognostic value of α-SMA in                  nous) was assessed by examining morphological infiltration of vein
NSCLC remains unclear. In addition to α-SMA, the deposition of fibrillar              walls in H&E stainings.
(type I and III) collagens is another common marker of activated fi-
broblasts; however, to our knowledge their prognostic value in NSCLC                 2.4. Image analysis
has not been determined. To address this gap of knowledge we con-
ducted a retrospective multicenter study of the prognostic value of                      All image processing was carried out with Image J [21] under the
standard markers of activated fibroblasts in using tissue microarrays                 guidance of one of our pathologists (JR). Large void regions were
(TMAs) containing samples from a cohort of early stage surgically-                   manually removed to prevent overestimating the total area. For bright
treated NSCLC patients gathered from multiple hospitals in Spain [15].               field images, each raw file was color deconvoluted ―using either H-
For this purpose we performed a quantitative image analysis of both α-               DAB (for α-SMA) or FastRed FastBlue DAB (for PSR)― and the suitable
SMA immunostaining and picrosirius red (PSR) staining of fibrillar                    color channel was binarized and used to calculate the positive area
collagens imaged with bright field and polarized microscopy, respec-                  fraction (%) over the total sample area (Suppl. Fig. S1). Area fraction
tively, and combined these data with clinical information including                  was averaged for all images per patient (n = 3) to elicit the final patient
survival gathered within a 3 year follow-up.                                         percentage as α-SMA% or PSR-BF% (for PSR imaged with bright field).
                                                                                     α-SMA images were also used to assess the percentage of necrotic area
2. Materials and methods                                                             for each patient by manually outlining the necrotic regions and com-
                                                                                     puting the corresponding area fraction. Similarly, images of PSR
2.1. Patients and tissue samples                                                     staining visualized with polarized light (PSR-PL) were converted into
                                                                                     greyscale, inverted, binarized and used to compute the percentage (%)
    This study involved the retrospective analysis of tissue samples from            of positive area, which was averaged for each patient to elicit the final
surgical patients collected by multiple Spanish hospitals belonging to               percentage as PSR-PL%. The number of positively stained nuclei for Ki-
the Bronchogenic Carcinoma Cooperative Group of the Spanish Society                  67 was counted and expressed as a percentage (Ki-67%) as described
of Pneumology and Thoracic Surgery (GCCB-S) [15], as part of their                   [20].
contribution to the 8th edition of the IASLC staging project [16]. The
initial cohort included 220 patients that were observed during a                     2.5. Statistical analysis
minimum of 3 years. Eighty-three patients died within the three years
after surgery (39.7%). Histologic diagnosis and staging was conducted                   All statistical analyses were performed with the widely-used com-
in accordance with the 8th edition of the IASLC staging project [17].                puting environment R-software, using computing functions of the base,
The initially gathered clinicopathologic variables are described else-               survival, survivalROC and coin packages. Overall survival functions
where [18], and included smoking status, comorbidities, blood ana-                   were assessed using the Kaplan-Meier estimator. Survival curves were
lyses, tumor location, staging, lung function, surgical treatment,                   compared by applying the Tarone-Ware test. Association between

                                                                               152
J. Alcaraz, et al.                                                                                                                    Lung Cancer 135 (2019) 151–160

quantitative variables was assessed by the Pearson’s or Spearman cor-                   at the day of surgery was 66.2 years, with a range of 31.5–85.0 years,
relation coefficient as required. Association between qualititative                       and the OS% was 60.3%. Most patients were male (85.6%) with a
variables was evaluated by the chi-square test. When the applicability                  history of smoking as former (48.6%) or current (41.8%) smokers. Very
conditions were not met, Fisher’s exact test was used. Comparisons of                   few patients had a weight loss in the previous 6 months greater than
means were performed by Student’s t-test. For each marker, optimum                      5 kg (8.7%); in contrast, nearly half (43.3%) had a cardiac comorbidity.
thresholds were computed by maximising the Youden’s index J, which                      The histological distribution was 50.2% ADC, 44.0% SCC and 5.7%
is defined as J = Sensitivity + Specificity – 1 [22,23]. Adjusted hazard                  large cell carcinoma (including both large cell carcinomas (2.4%) and
ratios were estimated by fitting the Cox’s proportional hazards regres-                  large cell neuroendocrine carcinomas (3.3%)). Most patients exhibited
sion model as described in the main text. P-values were determined by                   a well or moderately well-differentiated histologic grade (74.8%), and
likelihood ratio test and score test. Statistical significance was assumed               their clinical TNM stage distribution declined with increasing stage
at p < 0.05, whereas p < 0.1 was interpreted as marginally sig-                         (50.9% stage I, 34.5% stage II, 14.1% stage III and 0.5% stage IV).
nificant.                                                                                Histologic analysis revealed that vascular invasion was not observed in
                                                                                        most patients (69.8%). As expected, the association between OS% (as-
                                                                                        sessed 3 years after surgery here and thereafter) and the TNM stage was
3. Results                                                                              statistically significant (p < 0.001) [17]. In addition OS% was asso-
                                                                                        ciated with cardiac comorbidity, although with marginal significance (p
3.1. Description of clinicopathologic data                                              = 0.07).

    We analyzed retrospectively TMAs containing samples from a co-                      3.2. Expression of fibroblast activation markers and their correlations
hort of 220 surgical patients gathered from multiple hospitals in Spain,
which were observed during a minimum of 3 years. TMAs included                              Even though collagen can be visualized with different histologic
samples from 3 representative tumor regions for each patient. The                       stainings, picrosirius red (PSR) has been pointed as the most specific for
clinicopathologic features of our cohort and their overall survival (OS                 fibrillar collagens, for it enhances selectively the birefringence of col-
%) 3 years after surgery are shown in Table 1. The median patient age                   lagen fibers, thereby rendering them visible with polarized microscopy
                                                                                        [24,25]. Representative images of α-SMA and PSR stainings illustrating
Table 1                                                                                 different coverage levels are shown in Fig. 1 and Suppl. Fig. S2. PSR
Cumulative OS% rates (36 months) of clinicopathologic variables.
                                                                                        revealed that stromal fibrillar collagens were often organized into thick
  Clinical variable                    n (%)            OS (%)      p-value             layers surrounding groups of carcinoma cells. In agreement with the
                                                                                        unique optical features of PSR, the fibrillar nature of collagen was more
  Age (y.o.)
     < 65                              90 (43.3%)       65.0        0.12
                                                                                        readily observable using polarized light than bright field illumination as
    ≥65                                118 (56.7%)      56.3                            shown in Fig. 1. Images of α-SMA staining revealed that it was localized
  Gender                                                                                in the cytoplasm and was largely restricted to stromal regions, as in-
    Female                             30 (14.4%)       70.0        0.38                dicated by the visual overlap with PSR staining (Fig. 1 and Suppl. Fig.
    Male                               178 (85.6%)      58.3
                                                                                        S2). Subsequent image processing enabled computing the percentage of
  Race
    Caucasian                          208 (100%)       60.3        n.a.                positive area per image collected for each patient for either α-SMA (α-
    Other                              0                n.a.                            SMA%) or PSR imaged with bright field or polarized light ― referred to
  Smoking history                                                                       as PSR-BF% and PSR-PL%, respectively― (Suppl. Fig. S1.). This image
    Never                              20 (9.6%)        55.0        0.40                processing revealed that the positive area of PSR staining was generally
    Former                             101 (48.6%)      57.9
    Current                            87 (41.8%)       63.7
                                                                                        larger with bright field than polarized light (Suppl. Fig. S1), which il-
  Weight loss                                                                           lustrates the known fact that linearly polarized light captures only a
    absent (≤5 Kg)                     190 (91.3%)      61.2        0.15                fraction of the total content of fibrillar collagens [24,25]. In addition, a
    present (> 5 Kg)                   18 (8.7%)        47.2                            strong positive correlation between PSR-BF% and PSR-PL% (r = 0.79,
  Cardiovascular comorbidity
                                                                                        p < 0.001, Pearson´s correlation coefficient) was observed, in agree-
    No                                 118 (56.7%)      64.7        0.066
    Yes                                90 (43.3%)       54.0                            ment with previous observations [25]. Likewise we found a highly
  Histologic subtype                                                                    significant positive correlation between α-SMA% and either PSR-BF%
    Adenocarcinoma                     105 (50.2%)      62.9        0.34                (r = 0.40, p < 0.001) or PSR-PL% (r = 0.26, p < 0.001) (Suppl. Fig.
    Squamous cell carcinoma            92 (44.0%)       55.6                            S3), which is consistent with the common use of both α-SMA and fi-
    Large cell carcinoma               12 (5.7%)        74.1
  Differentiation grade
                                                                                        brillar collagens as markers of activated fibroblasts.
    Well/mod. differentiated (G1,G2)    151 (74.8%)      58.9        0.91
    Poorly differentiated (G3)          51 (25.2%)       62.9                            3.3. Association of fibroblast activation markers with clinicopathologic
  Tumor stage (TNM)a                                                                    variables
                                                                              *
    IA1                                6 (2.9%)         50.0        < 0.001
    IA2                                21 (10.2%)       71.4
    IA3                                31 (15.0%)       71.0                                To analyze the association of α-SMA% and PSR% (which refers to
    IB                                 47 (22.8%)       82.4                            both PSR-BF% and PSR-PL% here and thereafter) with clin-
    IIA                                15 (7.3%)        60.0                            icopathologic variables, we first identified a suitable threshold for each
    IIB                                56 (27.2%)       55.7                            marker by maximising the Youden´s index, which gives equal weight to
    IIIA                               29 (14.1%)       14.9
    IVA                                1 (0.5%)         0.0
                                                                                        both the marker´s sensitivity and specificity [22,23]. This method is
  Vascular invasion                                                                     widely used in the diagnostic biomarker field, and is equivalent to the
    No (V0)                            118 (69.8%)      60.4        0.23                minimization of the sum of false negative and false positive rates, which
    Yes microscopic (V1)               49 (29.0%)       57.7                            is clinically appealing because it maximizes the overall correct diag-
    Yes macroscopic (V2)               2 (1.2%)         0.0
                                                                                        nosis rate while minimizing the overall erroneous diagnosis rate [26].
NOTE:                                                                                   This approach elicited two threshold candidates for α-SMA% and PSR-
n.a.: not available.                                                                    BF% that corresponded to two separate maximum in the Youden´s
Bold p-values indicate marginal significance (p < 0.1).                                  index for these markers (i.e. 10.5% and 15.2% for α-SMA%, and 7.9%
  * p < 0.05 (log-rank test).                                                           and 16.80% for PSR-BF%) and one threshold for PSR-PL% (3.29%)
  a
     According to 8th edition of the IASLC staging classification.                       (Suppl. Fig. S4). The lower thresholds for α-SMA% and PSR-BF%

                                                                                  153
J. Alcaraz, et al. Lung Cancer 135 (2019) 151–160
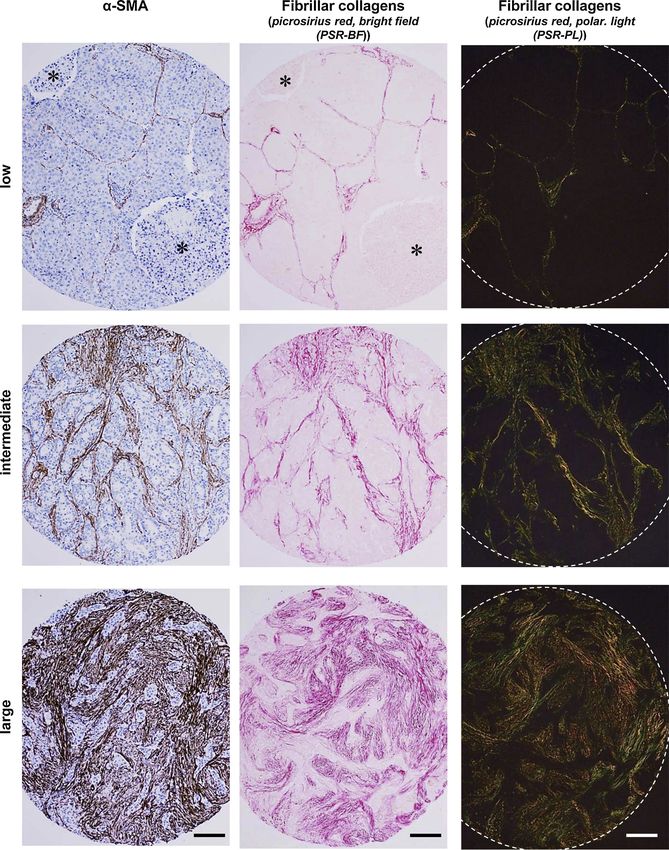
Fig. 1. Histologic images of standard fibroblast activation markers in NSCLC.
Representative images of histologic samples within TMAs of patients exhibiting either low, intermediate or large coverage of the stainings of TAF activation markers
α-SMA and fibrillar collagens. The latter were stained with picrosirius red (PSR). α-SMA and PSR were imaged with bright-field microscopy (left and middle
columns). PSR was further imaged with polarized microscopy (right column). Stars indicate necrotic areas used for subsequent analyses. Scale bars, 100 μm.
exhibited the highest sensitivity, whereas the corresponding higher Suppl. Fig. S5-S6 and Suppl. Tables S1-S2.
thresholds exhibited the highest specificity (Suppl. Fig. S4). In agree- Clinicopathologic variables stratified by α-SMA%, PSR-BF% and
ment with previous work [27], we selected the lower thresholds (i.e. PSR-PL% according to the latter thresholds are shown in Table 2. We
10.5% for α-SMA%, 7.9% for PSR-BF% and 3.3% for PSR-PL%) for found a significant association between PSR-BF% and both smoking
subsequent analyses, and used them in the main figures, whereas those history (p = 0.01) and histologic classification (p < 0.001). Further-
analyses carried out with the alternative (higher) thresholds (i.e. 15.2% more, PSR-BF% was marginally associated with the maximum stan-
for α-SMA%, 16.8% for PSR-BF% and 3.3% for PSR-PL%) are shown in dardized uptake value (SUVmax) assessed by 18F-fluorodeoxyglucose
154
J. Alcaraz, et al.                                                                                                                 Lung Cancer 135 (2019) 151–160

Table 2
Association between TAF activation markers and clinicopathologic variables.
  clinical variable                         α-SMA% > 10.5%                              PSR-BF% > 8%                              PSR-PL% > 3.3%

                                            Percentage            p-value               Percentage           p-value              Percentage            p-value

  Age (y.o.)
     < 65                                   60.2%                 0.65                  74.7%                0.81                 50.0%                 0.64
    ≥65                                     64.5%                                       72.2%                                     54.3%
  Gender
    Female                                  62.1%                 1.00                  86.7%                0.12                 63.3%                 0.27
    Male                                    62.7%                                       70.9%                                     50.6%
  Smoking history
    No (never)                              57.9%                 0.84                  100.0%               0.010*               70.0%                 0.16
    Yes (former, current)                   63.2%                                       70.3%                                     50.5%
  Weight loss
    absent (≤5 Kg)                          62.9%                 1.00                  73.0%                1.0                  51.3%                 0.42
    present (> 5 Kg)                        60.0%                                       76.5%                                     64.7%
  Cardiovascular comorbidity
    No                                      66.4%                 0.27                  75.4%                0.53                 53.0%                 0.96
    Yes                                     57.5%                                       70.5%                                     51.7%
  Histologic subtype
    Adenocarcinoma                          60.0%                 0.52                  84.0%                < 0.001*             53.9%                 0.75
    Squamous cell carcinoma                 65.6%                                       64.8%                                     49.5%
    Large cell carcinoma                    n.a.                                        41.7%                                     58.3%
  Differentiation grade
    Well/mod. differentiated (G1,G2)         63.9%                 0.65                  75.3%                0.78                 54.1%                 0.41
    Poorly differentiated (G3)               58.7%                                       72.0%                                     46.0%
  Tumor stage (TNM)
    IA1                                     40.0%                 0.66                  80.0%                0.99                 80.0%                 0.83
    IA2                                     78.9%                                       76.2%                                     57.1%
    IA3                                     57.7%                                       77.4%                                     48.4%
    IB                                      63.6%                                       73.3%                                     47.8%
    IIA                                     66.7%                                       73.3%                                     60.0%
    IIB                                     56.6%                                       69.1%                                     49.1%
    IIIA                                    65.4%                                       74.1%                                     57.1%
    IVA                                     100.0%                                      100.0%                                    100.0%
  Vascular invasion
    No (V0)                                 67.3%                 0.40                  77.2%                0.39                 59.6%                 0.18
    Yes (V1, V2)                            58.7%                                       69.4%                                     47.1%

Bold p-values indicate marginal significance (p < 0.1).
  * p < 0.05 (χ2 test).

positron emission tomography, which is indicative of the regional                   Given the close relationship between OS% and cardiac comorbidity
glucose uptake in the primary tumor, yielding 11.0 ± 6.1 for PSR-BF                 reported in Table 1, we also included the latter variable in the analysis.
% > 8% and 9.1 ± 5.9 for PSR-BF% ≤ 8% (p = 0.069). In contrast,                     Of note, all TAF activation markers were independent prognostic fac-
no further associations were observed between other TAF activation                  tors, with the largest significance found in fibrillar collagens (PSR-BF%,
markers and any other clinicopathologic variable. Thus, despite the                 p = 0.008 (likelihood ratio test); PSR-PL%, p = 0.004) compared to α-
significant correlations between all activation markers, only PSR-BF%                SMA% (p = 0.049). The results of the multivariate analysis are shown
was significantly associated with selected clinicopathologic data,                   in Table 3, and revealed that patients with PSR-BF% above the cut-off
thereby supporting that distinct TAF activation markers may be in-                  (8%) had an adjusted 129% increased risk of death (HR = 2.29; 95%
dicative of somewhat distinct features of the desmoplastic tumor                    CI, 1.33–3.97; p = 0.004). Similarly, those patients with PSR-PL%
stroma.                                                                             larger than the cut-off (3.3%) had 94% increased risk of death (HR =
                                                                                    1.94; 95% CI, 1.26–2.99; p = 0.003), whereas patients with α-SMA%
                                                                                    larger than the 10.5% cut-off had 89% increased risk of death (HR =
3.4. Association of fibroblast activation markers with overall survival OS%          1.89; 95% CI, 1.17–3.04; p = 0.009). Cardiac comorbidity was also a
                                                                                    significant independent prognostic factor for all markers, in agreement
    The thresholds described in the previous section were used as cut-              with previous reports [28]. These results reveal that the adjusted in-
offs to assess the Kaplan-Meier survival curves for each fibroblast ac-               creased risk of death associated with the histologic coverage of either α-
tivation marker. Remarkably, the group of patients with high levels of              SMA or fibrillar collagens analyzed by PSR staining does not depend on
the activation markers (i.e. above the cut-off) consistently exhibited               a particular stage. In contrast, a multivariate analysis with an expanded
lower survival with statistical significance, including α-SMA% (p =                  list of clinicopathological variables (Age, Smoking history, Histologic
0.04, log-rank test), PSR-BF% (p = 0.009) and PSR-PL% (p = 0.004)                   subtype, and Vascular invasion) did not reveal additional independent
(Fig. 2). These findings reveal that the histologic coverage of both α-              prognostic factor consistently across the 3 stromal variables examined
SMA and fibrillar collagens within the desmoplastic stroma are asso-                 (Suppl. Table S3).
ciated with poor prognosis in NSCLC, and identify that PSR analyzed
through polarized light microscopy is particularly useful in terms of
predicting poor outcome.                                                            3.5. Association of fibrillar collagens with cancer-relevant
    To discern whether the prognostic value of TAF activation markers               pathophysiological processes
is already captured by the current gold standard of tumor staging based
on TNM, we introduced either α-SMA%, PSR-BF% or PSR-PL% and                            Once established the prognostic value of standard TAF activation
tumor stage in a Cox regression model for multivariate OS% analysis.                markers in NSCLC, we began to examine potential underlying

                                                                              155
J. Alcaraz, et al. Lung Cancer 135 (2019) 151–160
pathophysiological processes. Our observed association between PSR-
BF% and the regional glucose uptake (SUVT) prompted us to examine a
potential association with proliferation by analyzing Ki-67 staining. In
addition, we examined other tumor-promoting biological processes
previously associated with increased fibrillar collagens, including in-
vasion and hypoxia [5], by analyzing quantitatively vascular invasion
and tumor necrosis, respectively, for necrosis is frequently used as a
surrogate marker of hypoxia [29]. The information on vascular invasion
was initially gathered in our clinicopathologic dataset, whereas both Ki-
67 and necrosis were assessed as percentage of positive area by quan-
titative image analysis of α-SMA stainings as shown in Fig. 1, and were
referred to as Ki-67% and necrosis%, respectively. Of note, all TAF
activation markers consistently showed a significant positive associa-
tion with necrosis% as indicated in Fig. 3 (α-SMA%, p < 0.001; PSR-
BF%, p = 0.02; PSR-PL%, p = 0.03). In contrast no significant asso-
ciations were found between Ki-67% or vascular invasion and any of
the TAF activation markers. These results reveal a novel strong asso-
ciation between the extent of TAF activation, tumor necrosis and poor
survival in surgical NSCLC patients.
Finally we examined to what extent the observations reported here
were specific for the particular threshold selection that maximized the
Youden´s index by re-analyzing the data using the alternative thresh-
olds for α-SMA% (15.5%) and PSR-BF% (17%), which exhibit max-
imum specificity rather than sensitivity (Suppl. Fig. S4). In agreement
with our initial findings, stratifying patients for each TAF marker ac-
cording to the alternative thresholds elicited significant associations
with both poor survival (Suppl. Table S2 and Suppl. Fig. S5) and ne-
crosis (Suppl. Fig. S6), although the association between PSR-BF% and
survival was marginally significant. Indeed, we only found minor dif-
ferences in terms of fewer associations with clinicopathologic data
(Suppl. Table S1) when using the alternative cut-offs, thereby re-
assuring that all thresholds obtained through the maximization of
Youden´s index provided consistent results.
4. Discussion
A hallmark of NSCLC and other solid tumors is the presence of a stiff
desmoplastic stroma rich in activated TAFs in the background of an
excessive deposition of fibrillar collagens [5]. Stromal TAFs have been
implicated in virtually all steps of tumor progression [7]. Therefore it is
unsurprising that stromal proteins, including those related to TAFs, are
receiving increasing interest as biomarkers or therapeutic targets
[9,30]. However, the prognostic value of standard markers of activated
TAFs had remained ill defined in NSCLC. Thus, the prognostic value of
α-SMA had remained unclear due to conflicting observations [13,14],
whereas that of fibrillar collagens has not been assessed directly.
Using a cohort of 220 NSCLC patients, we found that stromal α-
SMA, assessed by quantitative image analysis, was significantly asso-
ciated with shorter survival 3 years after surgery, and that this prog-
nostic value was independent of TNM staging. In agreement with our
findings, a histologic α-SMA scoring study conducted in China on a
smaller cohort (n = 78) reported an association with adverse prognosis
[14]. In contrast, a lack of association between α-SMA scoring and
survival was reported in a study carried out in Norway with a larger
cohort (n = 536) [13]. The reasons underlying the discrepancy of the
Norwegian study compared to the Chinese study and ours are unclear.
However it is conceivable that this discrepancy may be associated with
the different methodologies used to analyze stromal α-SMA, since the
Norwegian study used a single semi-quantitative scoring based on the
percentage of positive stromal cells [13], whereas the Chinese study
Fig. 2. Survival analysis of NSCLC patients stratified according to standard fi- used the multiplication a percentage score and an intensity score [14].
broblast activation markers. In further agreement with our observations, positive correlations be-
Kaplan-Meier survival curves stratifying patients according to α-SMA% (A), tween higher stromal α-SMA and different markers of tumor progres-
PSR-BF% (B) and PSR-PL% (C). For each marker, the low and high expression sion have been reported in breast cancer [31] and gastric carcinoma
groups correspond to patients exhibiting a percentage of positive area below or [32]. In contrast, α-SMA expression was found not associated with
equal/greater than the threshold, respectively. survival in head and neck squamous cell carcinoma [33]. Collectively,
156J. Alcaraz, et al. Lung Cancer 135 (2019) 151–160
Table 3
Multivariate analysis for predictors of survival.
α-SMA% > 10.5% PSR-BF% > 8% PSR-PL% > 3.3%
HR (95% CI) p-value HR (95% CI) p-value HR (95% CI) p-value
TAF marker
Low (ref.)a 1.00 1.00 1.00
High 1.89 (1.18-3.04) 0.009* 2.29 (1.33-3.98) 0.003* 1.94 (1.26-2.99) 0.003*
Tumor stage
IA1 (ref.) 1.00 1.00 1.00
IA2 0.22 (0.06-0.90) 0.035* 0.40 (0.11-1.52) 0.18 0.46 (0.12-1.76) 0.26
IA3 0.20 (0.05-0.76) 0.018* 0.31 (0.08-1.13) 0.076 0.34 (0.09-1.23) 0.10
IB 0.17 (0.05-0.63) 0.008* 0.27 (0.08-0.98) 0.047* 0.29 (0.08-1.02) 0.055
IIA 0.41 (0.11-1.62) 0.21 0.64 (0.17-2.43) 0.51 0.66 (0.17-2.50) 0.54
IIB 0.51 (0.15-1.73) 0.28 0.81 (0.24-2.69) 0.73 0.88 (0.26-2.93) 0.83
IIIA 1.03 (0.30-3.58) 0.96 1.75 (0.52-5.95) 0.37 1.89 (0.56-6.42) 0.31
IVA 6.58 (0.63-68.97) 0.12 10.5 (1.02-108.22) 0.048* 10.28 (1.00-105.77) 0.050
Card. comor.
No (ref.) 1.00 1.00 1.00
Yes 1.86 (1.22-2.86) 0.004* 1.82 (1.20-2.75) 0.005* 1.76 (1.16-2.65) 0.008*
NOTE:
Bold p-values indicate marginal significance (p < 0.1).
* p < 0.05 (Cox hazard proportional model).
a
< 10.5% for α-SMA%, < 8% for PSR-BF%, < 3.3% for PSR-PL%.
our data and previous observations support that stromal α-SMA is as- NSCLC and other cancer types is still rather limited [19,39]. On the
sociated with poor outcome in NSCLC, and underline that a consensus other hand, PSR imaged with standard (non-polarized) bright-field
method for α-SMA scoring is needed to confirm its prognostic value in (PSR-BF%) reported more associations with clinicopathological vari-
other cancer types. ables than PSR-PL%, in agreement with previous observations [25],
To our knowledge our study reports for the first time that the his- thereby supporting that the combination of PSR visualization with both
tologic coverage of stromal fibrillar collagens ―assessed by image imaging methods provides complementary information.
analysis of PSR staining with bright-field or polarized light― is a risk The expression of genes coding for type I collagen has been con-
factor for increased death in resected NSCLC patients. Remarkably, the sistently reported in transcriptional signatures associated with metas-
prognostic value of PSR was independent of TNM staging, indicating tasis and shorter survival in lung ADC and other cancer types [40].
that PSR staining of fibrillar collagens is a novel independent prognostic These observations strongly suggest that fibrillar collagens may play an
biomarker in NSCLC. In support to our collagen analysis, a semi- active role in tumor progression in addition to being useful prognostic
quantitative scoring of tumor collagen content by van Gieson staining biomarkers. Indeed, defining tumor-promoting effects of fibrillar col-
in a large cohort of NSCLC patients (n = 533) reported a trend between lagens is a matter of increasing research [5]. To begin to identify which
high collagen and decreased progression-free survival that attained of the latter effects might be more relevant in NSCLC, we sought for
marginal significance [30]. Likewise, indirect assessments of the col- potential associations with three prevalent tumor-promoting biological
lagen content in NSCLC patients from H&E stainings reported an asso- processes: vascular invasion, proliferation and necrosis/hypoxia. The
ciation with poor survival in SCC (n = 220) [34] and ADC patients rationale for analyzing vascular invasion is based on previous studies
(n = 239) [35]. Altogether these observations indicate that the asso- using intravital imaging that showed how cancer cells migrate more
ciation between stromal collagen and adverse patient outcome is an rapidly in collagen-rich regions [41]. Likewise studies conducted in
emerging hallmark of NSCLC, and expand previous links between breast cancer revealed that high collagen amount, particularly when
stromal collagen and increased risk of cancer [36,37]. More im- deposited radially from groups of carcinoma cells, promoted cancer cell
portantly, our results reveal that the assessment of the fibrillar collagen migration [42]. In contrast, we did not find significant differences be-
coverage in histologic samples by PSR staining may be a new clinical tween histologic vascular invasion when stratifying patients according
tool to identify those resected patients that are at higher risk of pro- to their fibrillar collagen coverage. A possible interpretation of this
gression and death after surgery. Likewise, our data support that as- negative result is that it is the spatial organization of the collagen fibers
sessing the histologic coverage of fibrillar collagens may be a new rather than their total amount, which is related to the histologic cov-
suitable marker to help selecting which resected patients should be erage as assessed in our study, what might be more relevant in terms of
considered for adjuvant chemotherapy. vascular invasion in NSCLC, as suggested elsewhere [42].
Stromal collagens can be stained with different methods, yet PSR The rationale for examining proliferation was based on the in-
has been pointed as the most sensitive owing to its unique ability to creased proliferation and survival through β1 integrin/FAK signaling
detect thin fibers [24,38]. PSR is also unique in that it changes the reported in TAFs and cancer cells cultured on hydrogels exhibiting
optical properties of fibrillar collagens by enhancing their bi- tumor-like rigidities [19], which mimicked the matrix stiffening that
refringence, thereby allowing the direct visualization of fibers of type I arises from increased fibrillar collagen as reported in vivo and in vitro
and III collagens with polarized light [25]. However, it had remained [39,43]. However, we did not observe a significant correlation between
unknown what visualization method of PSR (bright field or polarized fibrillar collagens and the proliferation marker Ki-67. This negative
light) could be more useful in terms of prognosis. Of note, our quanti- result was somewhat unexpected, considering that we did find a mar-
fication of PSR imaged with polarized light (PSR-PL%) elicited the ginal association between PSR-BF% and the regional glucose uptake
lowest p-values when analyzing survival data, thereby underlining that marker SUVT, which is frequently used as a surrogate of cancer cell
this imaging technique is particularly useful when using PSR as a proliferation [44]. Yet it is worth considering that enhanced SUVT has
prognostic biomarker. However, even though the specificity of PSR been reported in fibrotic areas of idiopathic pulmonary fibrosis pa-
imaged with polarized light to detect fibrillar collagens has been ex- tients, which are rich in activated fibroblasts and fibrillar collagens but
tensively validated in organ fibrosis [38], the use of this method in void of cancer cells [45]. Therefore it is conceivable that the larger
157J. Alcaraz, et al. Lung Cancer 135 (2019) 151–160
Fig. 3. Association of fibroblast activation markers with cancer-relevant biological processes.
Percentage of Ki-67 (marker of proliferation, left column), and necrosis (right column) for patients exhibiting activation markers below (low) or equal/greater (high)
than the corresponding threshold for α-SMA% (A), PSR-BF% (B) and PSR-PL% (C). Middle column shows the percentage of patients with each TAF marker equal/
greater than the corresponding cut-off according to their vascular invasion status. *, p < 0.05; **, p < 0.01; ***, p < 0.005.
SUVT observed here in patients with high PSR-BF% may partly reflect that fibrotic tumors were also more hypoxic [48]. On the other hand,
the increased metabolic demands of collagen biosynthesis rather than hypoxia enhances collagen expression in vitro [49], suggesting that the
changes in cancer cell proliferation. higher fibrillar collagen content found in samples with larger necrosis
Unlike cancer cell proliferation and vascular invasion, we found a could be partly a direct consequence of hypoxia. In addition, increased
marked association between all TAF activation markers and necrosis. In fibrillar collagen has been also associated with collapsed microvessels
agreement with our observation, tumour necrosis was reported to be an and impaired drug delivery due interstitial pressure built up in solid
independent prognostic marker in NSCLC using a cohort of 178 surgi- tumors [50], thereby suggesting that a rise in stromal collagens could
cally resected cases [46]. Future studies are required to further validate enhance hypoxia per se. In support of this interpretation, the antifibrotic
our observed association between stromal desmoplasia and tumor ne- drug nintedanib was shown to reduce the expression of fibrillar col-
crosis as well as to elucidate the potential causes and consequences of lagens in activated TAFs in vitro [9], and to provide a survival benefit in
such association. However, it is worth noting that tumor necrosis is combination with the cytotoxic drug docetaxel in lung ADC [51]. Al-
commonly used as indicative of hypoxia [29], and that the link between together, these previous observations suggest that the increased histo-
tumor hypoxia and aggressive phenotypes has been extensively docu- logic coverage of fibrillar collagens could be both a cause and a con-
mented [47]. Likewise, in vivo models of mammary tumors reported sequence of necrosis/hypoxia, and support that antifibrotic drugs
158J. Alcaraz, et al. Lung Cancer 135 (2019) 151–160
aiming to downregulate collagen expression could help reducing also References
hypoxia in NSCLC.
[1] J.D. Minna, J.A. Roth, A.F. Gazdar, Focus on lung cancer, Cancer Cell 1 (1) (2002)
49–52.
5. Conclusions [2] N. Howlader, A.M. Noone, M. Krapcho, D. Miller, K. Bishop, C.L. Kosary, M. Yu,
J. Ruhl, Z. Tatalovich, A. Mariotto, D.R. Lewis, H.S. Chen, E.J. Feuer, K.A. Cronin,
In summary this study clarifies the prognostic value of α-SMA in SEER Cancer Statistics Review, 1975–2014, National Cancer Institute, Bethesda,
MD, 2017https://seer.cancer.gov/csr/1975_2014/.
NSCLC, and identifies the histologic coverage of fibrillar collagens as- [3] P. Boyle, C.J. Chapman, S. Holdenrieder, A. Murray, C. Robertson, W.C. Wood,
sessed through PSR staining, particularly when imaged with polarized P. Maddison, G. Healey, G.H. Fairley, A.C. Barnes, J.F.R. Robertson, Clinical vali-
microscopy, as a novel and independent stromal biomarker associated dation of an autoantibody test for lung cancer, Ann. Oncol. 22 (2) (2011) 383–389.
[4] R.M. Bremnes, T. Donnem, S. Al-Saad, K. Al-Shibli, S. Andersen, R. Sirera, C. Camps,
with adverse prognosis in resected patients. Our analysis also identifies
I. Marinez, L.T. Busund, The Role of Tumor Stroma in Cancer Progression and
patients with large fibrillar collagen content to exhibit higher risk of Prognosis Emphasis on Carcinoma-Associated Fibroblasts and Non-small Cell Lung
recurrence and death, and reveal that they may benefit from a closer Cancer, J. Thorac. Oncol. 6 (1) (2011) 209–217.
follow-up and should be considered for adjuvant chemotherapy. Our [5] M. Egeblad, M.G. Rasch, V.M. Weaver, Dynamic interplay between the collagen
scaffold and tumor evolution, Curr. Opin. Cell Biol. 22 (5) (2010) 697–706.
data also support a mechanistic relationship between collagen content [6] M. Gabasa, P. Duch, I. Jorba, A. Giménez, R. Lugo, I. Pavelescu, F. Rodríguez-
and necrosis/hypoxia. Pascual, M. Molina-Molina, A. Xaubet, J. Pereda, J. Alcaraz, Epithelial contribution
to the pro-fibrotic stiff microenvironment and myofibroblast population in lung
fibrosis, Mol. Biol. Cell 28 (2017) 3741–3755.
Declaration of competing interest [7] D. Ohlund, E. Elyada, D. Tuveson, Fibroblast heterogeneity in the cancer wound, J.
Exp. Med. 211 (8) (2014) 1503–1523.
[8] F. Hilberg, G.J. Roth, M. Krssak, S. Kautschitsch, W. Sommergruber, U. Tontsch-
None. Grunt, P. Garin-Chesa, G. Bader, A. Zoephel, J. Quant, A. Heckel, W.J. Rettig, BIBF
1120: triple angiokinase inhibitor with sustained receptor blockade and good an-
titumor efficacy, Cancer Res. 68 (12) (2008) 4774–4782.
Acknowledgements
[9] M. Gabasa, R. Ikemori, F. Hilberg, N. Reguart, J. Alcaraz, Nintedanib selectively
inhibits the activation and tumor-promoting effects of fibroblasts from lung ade-
We thank Adriana Velásquez, Concepción Fernández (UB) and nocarcinoma patients, Br. J. Cancer 117 (2017) 1128–1138.
Victoria Stanley (UCSD) for technical support, and Daniel Navajas and [10] R. Navab, D. Strumpf, B. Bandarchi, C.Q. Zhu, M. Pintilie, V.R. Ramnarine,
E. Ibrahimov, N. Radulovich, L. Leung, M. Barczyk, D. Panchal, C. To, J.J. Yun,
Ramon Farré (UB) for support. This work was further supported by S. Der, F.A. Shepherd, I. Jurisica, M.S. Tsao, Prognostic gene-expression signature of
grants from the Ministerio de Economía y Competitividad (MINECO/ carcinoma-associated fibroblasts in non-small cell lung cancer, Proceedings of the
FEDER, UE) (PI13/02368 and SAF2016-79527-R to JA, FIS 12/02040 National Academy of Sciences of the United States of America 108 (17) (2011)
7160–7165.
to EM and FIS 12/02534 to EB), Fundació Privada Cellex (to JA), [11] M. Vizoso, M. Puig, F.J. Carmona, M. Maqueda, A. Velásquez, A. Gómez,
Generalitat de Catalunya AGAUR (SGR 661 to JA, SGR 801 to EM), A. Labernadie, R. Lugo, M. Gabasa, L.G. Rigat de Brugarolas, X. Trepat, J. Ramírez,
Junta Provincial de Barcelona de l’Associació Espanyola Contra el N. Reguart, S. Morán, E. Vidal, A. Perera, M. Esteller, J. Alcaraz, Aberrant DNA
methylation in non small cell lung Cancer associated fibroblasts, Carcinogenesis 36
Càncer (AECC B16-917 to JA), Fundació Catalana de Pneumologia (to (2015) 1453–1463.
EM), Sociedad Española de Neumología y Cirugía Torácica – SEPAR (PII [12] V. Mittal, T. El Rayes, N. Narula, T.E. McGraw, N.K. Altorki, M.H. Barcellos-Hoff,
Oncología Torácica to EM, < /GN6 > SEPAR 437 < /GN6 > to NR), The microenvironment of lung cancer and therapeutic implications, in: A. Ahmad,
S.M. Gadgeel (Eds.), Lung Cancer and Personalized Medicine: Novel Therapies and
and beca CONICYT (to N.D-V.).
Clinical Management, 2016, pp. 75–110.
[13] T.K. Kilvaer, M.R. Khanehkenari, T. Hellevik, S. Al-Saad, E.-E. Paulsen,
Appendix A. Grupo Colaborativo en Cáncer de Pulmón CIBERES- R.M. Bremnes, L.-T. Busund, T. Donnem, I.Z. Martinez, Cancer associated fibro-
blasts in stage I-IIIA NSCLC: prognostic impact and their correlations with tumor
CIBERONC-SEPAR-Plataforma Biobanco Pulmonar molecular markers, PLoS One 10 (8) (2015).
[14] Y. Chen, L. Zou, Y. Zhang, Y. Chen, P. Xing, W. Yang, F. Li, X. Ji, F. Liu, X. Lu,
Hospital Virgen del Rocío (Sevilla): Mª Ángeles González Castro, Transforming growth factor-beta 1 and alpha-smooth muscle actin in stromal fi-
broblasts are associated with a poor prognosis in patients with clinical stage I-IIIA
Ana Blanco, Rosa María Sánchez Gil. Hospital Mútua de Terrassa nonsmall cell lung cancer after curative resection, Tumor Biol. 35 (7) (2014)
(Barcelona) and CIBERES (Madrid): Ramón Rami-Porta, Mireia Serra, 6707–6713.
Guadalupe González Pont. Hospital Son Espases (Palma de Mallorca), [15] G.C.e.Cd.P.C.-C.-S.-P.B. Pulmonar, E. Monsó, L. Montuenga, J. Sánchez de Cos,
C. Villena, Biological marker analysis as part of the CIBERES-RTIC Cancer-SEPAR
Institut d´investigació Sanitària de Palma (IdISPa) and CIBERES strategic project on lung cancer, Arch. Bronconeumol. 51 (2015) 462–467.
(Madrid): Jaume Sauleda and Sergio Scrimini. Hospital Germans Trias i [16] J. Sanchez de Cos Escuin, M. Serra Mitjans, J. Hernandez Hernandez, H. Hernandez
Pujol (Barcelona) and CIBERES (Madrid): Esther Fernández, Pedro Rodriguez, J. Abal Arca, I. Parente Lamelas, P. Leon Atance, A. Nunez Ares,
L. Miravet Sorribes, A.I. Blanco Orozco, R. Melchor lniguez, L. Garcia Aranguena,
López de Castro, Carlos Martínez-Barenys, Jose Luis Mate. Fundación
A. Arnau Obrer, R. Guijarro Jorge, J. Padilla Alarcon, J.C. Penalver Cuesta,
Jiménez Díaz-Universidad de Navarra (Madrid) and CIBERES (Madrid): M. Marinan Gorospe, E. Fernandez Araujo, G. Francisco Corral, S. Cerezo Gonzalez,
Rosario Melchor, Mª Jesús Fernández-Aceñero, Luis Seijo. Hospital G. Gonzalez Casaurran, S. Naranjo Gozalo, C. Alvarez de Arriba, M. Nunez Delgado,
M.T. Gonzalez Budino, R. Magaroles, L. de Esteban Julvez, M.J. Pavon Fernandez,
Joan XXIII (Tarragona): Leonardo de Esteban Júlvez, Ramon
J.A. Gullon Blanco, B. de Olaiz Navarro, I. Escobar Campuzano, I. Macia Vidueira,
Magarolas. Hospital San Pedro de Alcántara (Cáceres): Julio Sanchez de S. Garcia Barajas, J. Herrero Collantes, J. Freixenet Gilabert, A. Saura Vinuesa, The
Cos. Hospital Universitario Parc Taulí (Sabadell) and CIBERES spanish society of pulmonology and thoracic surgery lung Cancer cooperative
(Madrid): Laura Millares, Eduard Monsó. Plataforma Biobanco Group-II registry. A descriptive study, Arch. Bronconeumol. 49 (11) (2013)
462–467.
Pulmonar CIBERES (Madrid): Cristina Villena. Centro de Investigación [17] P. Goldstraw, K. Chansky, J. Crowley, R. Rami-Porta, H. Asamura,
Médica Aplicada (CIMA), Universidad de Navarra, IDISNA (Navarra) W.E.E. Eberhardt, A.G. Nicholson, P. Groome, A. Mitchell, V. Bolejack, S. Int Assoc
and CIBERONC (Madrid): Maria Jose Pajares, Luis M. Montuenga. Study Lung Canc, The IASLC lung Cancer Staging project: proposals for revision of
the TNM stage groupings in the forthcoming (Eighth) edition of the TNM classifi-
Universidad de Barcelona: Jordi Alcaraz. Hospital Clinic (Barcelona), cation for lung Cancer, J. Thorac. Oncol. 11 (1) (2016) 39–51.
Universidad de Barcelona, IDIBAPS and CIBERES (Madrid): Joan Albert [18] R. Rami-Porta, V. Bolejack, D.J. Giroux, K. Chansky, J. Crowley, H. Asamura,
Barberà. Universidad de Barcelona and IDIBAPS: Marta Cascante, P. Goldstraw, S. Int Assoc Study Lung Canc, M. Advisory Board, The IASLC lung
Cancer Staging project: the new database to inform the eighth edition of the TNM
Roldán Cortés, Cristina Balcells. IMIM Hospital del Mar (Barcelona) and classification of lung Cancer, J. Thorac. Oncol. 9 (11) (2014) 1618–1624.
CIBERES (Madrid): Esther Barreiro. [19] M. Puig, R. Lugo, M. Gabasa, A. Gimenez, A. Velasquez, R. Galgoczy, J. Ramirez,
A. Gomez-Caro, O. Busnadiego, F. Rodriguez-Pascual, P. Gascon, N. Reguart,
J. Alcaraz, Matrix stiffening and beta(1) integrin drive subtype-specific fibroblast
Appendix B. Supplementary data accumulation in lung Cancer, Mol. Cancer Res. 13 (1) (2015) 161–173.
[20] M. Mateu-Jimenez, C. Fermoselle, F. Rojo, J. Mateu, R. Pena, A.J. Urtreger,
Supplementary material related to this article can be found, in the M.J. Diament, E.D.Bd.K. Joffe, L. Pijuan, A.G. de Herreros, E. Barreiro,
Pharmacological approaches in an experimental model of non-small cell lung
online version, at doi:https://doi.org/10.1016/j.lungcan.2019.07.020.
159J. Alcaraz, et al. Lung Cancer 135 (2019) 151–160
Cancer: effects on tumor biology, Curr. Pharm. Des. 22 (34) (2016) 5300–5310. [35] A.M. Maeshima, T. Niki, A. Maeshima, T. Yamada, H. Kondo, Y. Matsuno, Modified
[21] M.D. Abramoff, P.J. Magelhaes, S.J. Ram, Image processing with ImageJ, scar grade — A prognostic indicator in small peripheral lung adenocarcinoma,
Biophotonics Int. 11 (7) (2004) 36–42. Cancer 95 (12) (2002) 2546–2554.
[22] E.F. Schisterman, N. Perkins, Confidence intervals for the Youden index and cor- [36] N.F. Boyd, L.J. Martin, M.J. Yaffe, S. Minkin, Mammographic density and breast
responding optimal cut-point, Communications in Statistics-Simulation and cancer risk: current understanding and future prospects, Breast Cancer Res. 13 (6)
Computation 36 (3) (2007) 549–563. (2011).
[23] K. Skaltsa, L. Jover, J. Lluis Carrasco, Estimation of the diagnostic threshold ac- [37] H.B. El-Serag, Current concepts Hepatocellular Carcinoma, N. Engl. J. Med. 365
counting for decision costs and sampling uncertainty, Biom. J. 52 (5) (2010) (12) (2011) 1118–1127.
676–697. [38] W. Malkusch, B. Rehn, J. Bruch, Advantages of sirius-red staining for quantitative
[24] L. Rich, P. Whittaker, Collagen and picrosirius red staining: a polarized light as- morphometric collagen measurements in lungs, Exp. Lung Res. 21 (1) (1995)
sessment of fibrillar hue and spatial distribution, Brazilian Journal of Morphological 67–77.
Sciences 22 (2) (2005) 97–104. [39] I. Acerbi, L. Cassereau, I. Dean, Q. Shi, A. Au, C. Park, Y.Y. Chen, J. Liphardt,
[25] M.M. Diaz, M.D. Griffin, J.M. Slezak, E.J. Bergstralh, M.D. Stegall, J.A. Velosa, E.S. Hwang, V.M. Weaver, Human breast cancer invasion and aggression correlates
J.P. Grande, Correlation of quantitative digital image analysis with the glomerular with ECM stiffening and immune cell infiltration, Integr. Biol. 7 (10) (2015)
filtration rate in chronic allograft nephropathy, Am. J. Transplant. 4 (2003) 1120–1134.
248–256. [40] S. Ramaswamy, K.N. Ross, E.S. Lander, T.R. Golub, A molecular signature of me-
[26] K. Kaivanto, Maximization of the sum of sensitivity and specificity as a diagnostic tastasis in primary solid tumors, Nature Genet. 33 (1) (2003) 49–54.
cutpoint criterion, J. Clin. Epidemiol. 61 (5) (2008) 517–518. [41] J. Condeelis, J.E. Segall, Intravital imaging of cell movement in tumours, Nat. Rev.
[27] J.D. Cohen, L. Li, Y. Wang, C. Thoburn, B. Afsari, L. Danilova, C. Douville, Cancer 3 (12) (2003) 921–930.
A.A. Javed, F. Wong, A. Mattox, R.H. Hruban, C.L. Wolfgang, M.G. Goggins, M. Dal [42] P.P. Provenzano, K.W. Eliceiri, J.M. Campbell, D.R. Inman, J.G. White, P.J. Keely,
Molin, T.-L. Wang, R. Roden, A.P. Klein, J. Ptak, L. Dobbyn, J. Schaefer, N. Silliman, Collagen reorganization at the tumor-stromal interface facilitates local invasion,
M. Popoli, J.T. Vogelstein, J.D. Browne, R.E. Schoen, R.E. Brand, J. Tie, P. Gibbs, BMC Med. 4 (1) (2006) 38.
H.-L. Wong, A.S. Mansfield, J. Jen, S.M. Hanash, M. Falconi, P.J. Allen, S. Zhou, [43] J. Alcaraz, H. Mori, C.M. Ghajar, D. Brownfield, R. Galgoczy, M.J. Bissell, Collective
C. Bettegowda, L.A. Diaz Jr, C. Tomasetti, K.W. Kinzler, B. Vogelstein, A.M. Lennon, epithelial cell invasion overcomes mechanical barriers of collagenous extracellular
N. Papadopoulos, Detection and localization of surgically resectable cancers with a matrix by a narrow tube-like geometry and MMP14-dependent local softening,
multi-analyte blood test, Science 359 (6378) (2018) 926-+. Integr. Biol. (Camb) 3 (12) (2011) 1153–1166.
[28] J. Kravchenko, M. Berry, K. Arbeev, H.K. Lyerly, A. Yashin, I. Akushevich, [44] S.-m. Deng, W. Zhang, B. Zhang, Y.-y. Chen, J.-h. Li, Y.-w. Wu, Correlation between
Cardiovascular comorbidities and survival of lung cancer patients: medicare data the Uptake of F-18-Fluorodeoxyglucose (F-18-FDG) and the Expression of
based analysis, Lung Cancer 88 (1) (2015) 85–93. Proliferation-Associated Antigen Ki-67 in Cancer Patients: A Meta-Analysis, PLoS
[29] G.G. Van den Eynden, C.G. Colpaert, A. Couvelard, F. Pezzella, L.Y. Dirix, One 10 (6) (2015).
P.B. Vermeulen, E.A. Van Marck, T. Hasebe, A fibrotic focus is a prognostic factor [45] A. Justet, A. Laurent-Bellue, G. Thabut, A. Dieudonne, M.-P. Debray, R. Borie,
and a surrogate marker for hypoxia and (lymph)angiogenesis in breast cancer: re- M. Aubier, R. Lebtahi, B. Crestani, F-18 FDG PET/CT predicts progression-free
view of the literature and proposal on the criteria of evaluation, Histopathology 51 survival in patients with idiopathic pulmonary fibrosis, Respir. Res. 18 (2017).
(4) (2007) 440–451. [46] D.E. Swinson, J.L. Jones, D. Richardson, G. Cox, J.G. Edwards, K.J. O’Byrne,
[30] A. Soltermann, V. Tischler, S. Arbogast, J. Braun, N. Probst-Hensch, W. Weder, Tumour necrosis is an independent prognostic marker in non-small cell lung cancer:
H. Moch, G. Kristiansen, Prognostic Significance of Epithelial-Mesenchymal and correlation with biological variables, Lung Cancer 37 (3) (2002) 235–240.
Mesenchymal-Epithelial Transition Protein Expression in Non-Small Cell Lung [47] B. Muz, P. de la Puente, F. Azab, A.K. Azab, The role of hypoxia in cancer pro-
Cancer, Clin. Cancer Res. 14 (22) (2008) 7430–7437. gression, angiogenesis, metastasis, and resistance to therapy, Hypoxia 3 (2015)
[31] M. Yamashita, T. Ogawa, X.H. Zhang, N. Hanamura, Y. Kashikura, M. Takamura, 83–92.
M. Yoneda, T. Shiraishi, Role of stromal myofibroblasts in invasive breast cancer: [48] L.D. McPhail, S.P. Robinson, Intrinsic susceptibility MR imaging of chemically in-
stromal expression of alpha-smooth muscle actin correlates with worse clinical duced rat mammary tumors: relationship to histologic assessment of hypoxia and
outcome, Breast Cancer 19 (2) (2012) 170–176. fibrosis, Radiology 254 (1) (2010) 110–118.
[32] Y. Fuyuhiro, M. Yashiro, S. Noda, S. Kashiwagi, J. Matsuoka, Y. Doi, Y. Kato, [49] V. Falanga, L. Zhou, T. Yufit, Low oxygen tension stimulates collagen synthesis and
K. Muguruma, T. Sawada, K. Hirakawa, Myofibroblasts are associated with the COL1A1 transcription through the action of TGF-beta 1, J. Cell. Physiol. 191 (1)
progression of scirrhous gastric carcinoma, Exp. Ther. Med. 1 (4) (2010) 547–551. (2002) 42–50.
[33] J. Valach, Z. Fik, H. Strnad, M. Chovanec, J. Plzak, Z. Cada, P. Szabo, J. Sachova, [50] R.K. Jain, J.D. Martin, T. Stylianopoulos, The Role of Mechanical Forces in Tumor
M. Hroudova, M. Urbanova, M. Steffl, J. Paces, J. Mazanek, C. Vlcek, J. Betka, Growth and Therapy, M.L. Yarmush Annual Review of Biomedical Engineering, Vol.
H. Kaltner, S. Andre, H.J. Gabius, R. Kodet, K. Smetana, P. Gal, M. Kolar, Smooth 162014, 321-346.
muscle actin-expressing stromal fibroblasts in head and neck squamous cell carci- [51] M. Reck, R. Kaiser, A. Mellemgaard, J.-Y. Douillard, S. Orlov, M. Krzakowski, J. von
noma: increased expression of galectin-1 and induction of poor prognosis factors, Pawel, M. Gottfried, I. Bondarenko, M. Liao, C.-N. Gann, J. Barrueco, B. Gaschler-
Int. J. Cancer 131 (11) (2012) 2499–2508. Markefski, S. Novello, L.U.-L.S. Grp, Docetaxel plus nintedanib versus docetaxel
[34] Y. Takahashi, G. Ishii, T. Taira, S. Fujii, S. Yanagi, T. Hishida, J. Yoshida, plus placebo in patients with previously treated non-small-cell lung cancer (LUME-
M. Nishimura, H. Nomori, K. Nagai, A. Ochiai, Fibrous stroma is associated with Lung 1): a phase 3, double-blind, randomised controlled trial, Lancet Oncol. 15 (2)
poorer prognosis in lung squamous cell carcinoma patients, J. Thorac. Oncol. 6 (9) (2014) 143–155.
(2011) 1460–1467.
160You can also read