A 3D CNN model with CT based parametric response mapping for classifying COPD subjects - Nature
←
→
Page content transcription
If your browser does not render page correctly, please read the page content below
www.nature.com/scientificreports
OPEN A 3D‑CNN model with CT‑based
parametric response mapping
for classifying COPD subjects
Thao Thi Ho1, Taewoo Kim1, Woo Jin Kim2, Chang Hyun Lee3,4, Kum Ju Chae5, So Hyeon Bak6,
Sung Ok Kwon2, Gong Yong Jin5, Eun‑Kee Park7 & Sanghun Choi1*
Chronic obstructive pulmonary disease (COPD) is a respiratory disorder involving abnormalities of
lung parenchymal morphology with different severities. COPD is assessed by pulmonary-function
tests and computed tomography-based approaches. We introduce a new classification method for
COPD grouping based on deep learning and a parametric-response mapping (PRM) method. We
extracted parenchymal functional variables of functional small airway disease percentage (fSAD%)
and emphysema percentage (Emph%) with an image registration technique, being provided as input
parameters of 3D convolutional neural network (CNN). The integrated 3D-CNN and PRM (3D-cPRM)
achieved a classification accuracy of 89.3% and a sensitivity of 88.3% in five-fold cross-validation.
The prediction accuracy of the proposed 3D-cPRM exceeded those of the 2D model and traditional
3D CNNs with the same neural network, and was comparable to that of 2D pretrained PRM models.
We then applied a gradient-weighted class activation mapping (Grad-CAM) that highlights the key
features in the CNN learning process. Most of the class-discriminative regions appeared in the upper
and middle lobes of the lung, consistent with the regions of elevated fSAD% and Emph% in COPD
subjects. The 3D-cPRM successfully represented the parenchymal abnormalities in COPD and matched
the CT-based diagnosis of COPD.
Instances of chronic obstructive pulmonary disease (COPD), a respiratory disease related to pulmonary airflow
obstruction, are rising g lobally1. COPD causes several dangerous lung phenotypes, such as emphysema, chronic
bronchitis, and even lung cancer. According to the 2020 chronic obstructive lung disease report, COPD has
been the fourth leading cause of death, killing more than three million people (6% of the deaths worldwide) in
20122. Quantitative analyses based on computed tomographic (CT) images have explored the airway trees, lung
parenchyma abnormalities, and other features related to COPD3–5. These CT findings are useful for clarifying
the lung anatomical features, enabling the prevention, early diagnosis, and management of COPD.
In regards to CT-based imaging findings, COPD is characterized by emphysematous lung, airway narrow-
ing, functional small-airway disease, and reduced lung d eformation5. In clinics, forced expiratory volume in 1 s
(FEV1) and percentage of predicted value along with FEV1/forced vital capacity (FVC) have been used as criteria
to identify the severity of C OPD6. Such pulmonary function tests (PFTs) are convenient and inexpensive, but are
not always recommended for treatment decisions due to poor s tratification2,7. COPD risk can be more accurately
stratified from visual CT d ata5. Specific features extracted from visual CT scans, such as lung parenchyma, air-
ways, and pulmonary vessels, are effective screens for COPD. However, the visual assessment of COPD from large
CT volumes is subjective, and accurately detecting COPD across large populations without manual extraction
or without reviewing the specific clinical or radiographic features is burdensome to p hysicians8,9.
An accurate computer-aided detection system is essential for an efficient and cost effective COPD screening
workflow. Recently, deep-learning-based methods have gained popularity in medicine, owing to their power and
1
School of Mechanical Engineering, Kyungpook National University, 80 Daehak‑ro, Buk‑gu, Daegu 41566, Republic
of Korea. 2Department of Internal Medicine and Environmental Health Center, School of Medicine, Kangwon
National University Hospital, Kangwon National University, Chuncheon, Republic of Korea. 3Department of
Radiology, College of Medicine, Seoul National University, Seoul National University Hospital, Seoul, Republic of
Korea. 4Department of Radiology, College of Medicine, The University of Iowa, Iowa City, Iowa, USA. 5Department
of Radiology, Research Institute of Clinical Medicine of Jeonbuk National University–Biomedical Research
Institute of Jeonbuk National University Hospital, Jeonju, Republic of Korea. 6Department of Radiology,
Kangwon National University Hospital, Kangwon National University School of Medicine, Chuncheon, Republic
of Korea. 7Department of Medical Humanities and Social Medicine, College of Medicine, Kosin University, Busan,
Republic of Korea. *email: s‑choi@knu.ac.kr
Scientific Reports | (2021) 11:34 | https://doi.org/10.1038/s41598-020-79336-5 1
Vol.:(0123456789)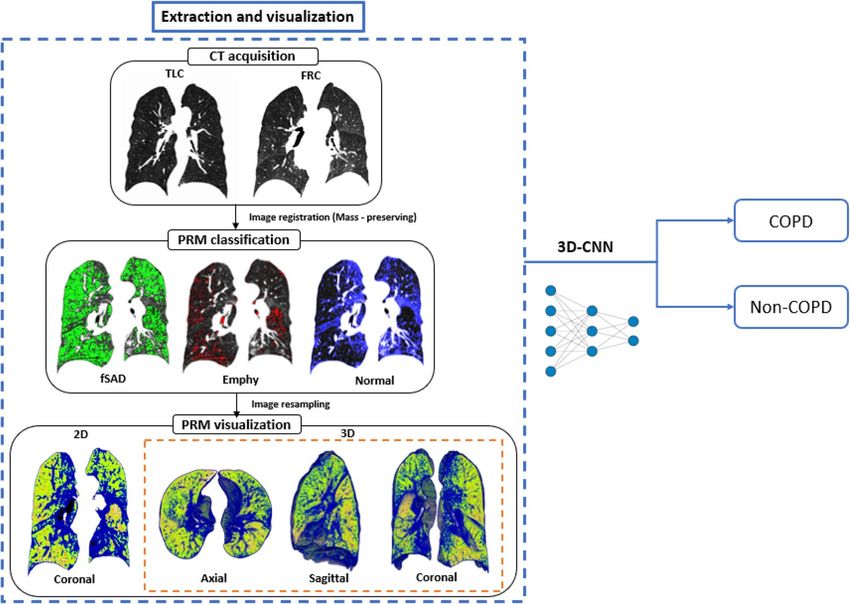
www.nature.com/scientificreports/
ata5. A deep convolutional neural network (CNN) is a deep-learning approach that
flexible use of the available d
automatically extracts features from data. Advances in CNNs have greatly improved the performance of image
classification and detection10–13. A CNN can learn representative features from the data with multiple levels
of abstraction and thus the design, extraction, and selection of handcrafted features are unnecessary14. CNN
techniques can potentially improve COPD risk modeling in the absence of pulmonary function tests (PFTs) or
visual assessment of lung parenchyma. Some existing machine learning algorithms can recognize or distinguish
COPD in CT images, but have not been studied in detail. Unfortunately, the image feature layers trained for
classification by a deep neural network remain unknown15. This problem might be resolved by gradient-weighted
class activation mapping (Grad-CAM), which produces visual explanations from a CNN, allowing visualization
of the areas focused by the CNN15,16.
Recently, the classification, detection, and segmentation performances of CNNs in COPD detection have
significantly improved. Using CNN models and four canonical CT slices at predefined anatomic landmarks in
the COPDGene and ECLIPSE testing cohorts, González et al.17 achieved a COPD detection accuracy of 0.773.
Du et al.18 applied a CNN on 2D multi-view snapshots of a 3D lung-airway tree, and classified COPD and non-
COPD cases. They reported an accuracy of 88.6% on grayscale snapshots. Feragen et al.19 applied a support
vector machine (SVM) to the airway tree information of 1996 subjects, including 893 with COPD. Their highest
accuracy was 64.9% in COPD classification tasks. Bodduluri et al.20 evaluated the ability of supervised learning
to distinguish COPD patients from non-COPD subjects, applying image registration metrics to biomechanical,
density, and texture feature sets. The best area under the curve (AUC) was 0.89 on texture feature sets.
In COPD subjects, airway structure and parenchymal function have been assessed with structural and func-
tional variables obtained from quantitative computed tomography (QCT) of lung, such as luminal diameter, wall
thickness, air trapping (or functional small-airway disease), and emphysema21. Air trapping in COPD at expira-
tion can characterize small-airway narrowing/closure at the parenchymal level, but may contain some portion of
emphysema at i nspiration6. Accordingly, Galban et al.4 introduced parametric-response mapping (PRM), which
dissociates the air-trapping effects of mixed air trapping and emphysema. Using this approach, we can character-
ize three features at the voxel level: emphysema (Emph), functional small-airway disease (fSAD), and normal
lungs. Using expiration and inspiration CT scans and a voxel-wise image analysis technique, we can accurately
distinguish COPD imaging phenotypes by visually assessing the PRMs of fSAD and E mph6.
We hypothesize that a 3D-CNN with a PRM input (3D-cPRM) can represent the abnormalities of lung
parenchyma and predict clinically relevant outcomes in COPD subjects without pre-specifying the features of
interest. To test this hypothesis, we investigate whether the newly trained PRM imaging features can identify
COPD. We also evaluate the potential correlations between PRM and 3D-CNN in patients with COPD. Our
proposed approach was implemented as follows. First, we visualized the 3D PRM model combining fSAD, Emph,
and normal portions in the lung by a mass-preserving image registration method. This visualization step is of
major clinical significance, as clinicians can easily observe disease alterations in the lung parenchyma captured
in one frame. Second, we input the CT-based imaging variables to a 3D fully convolutional architecture, thus
realizing volume-to-volume learning and inference. The specially designed 3D-CNN model with PRM was hyper-
parametrized for filter-size, batch size, learning rate, and others, and further optimized for COPD identification
by the Adam algorithm. Applying Grad-CAM, we finally highlighted the important regions in the images for
predicting healthy control (non-COPD) or COPD. To our knowledge, our work is the first to use deep 3D-CNN
and CT-based PRM to COPD classification.
Results
The lobar variables were computed from the CT images of 596 subjects with a 512 × 512 matrix and image reg-
istration, and the imaging metrics were derived from PRM. The lobar variables included the determinant of the
Jacobian (J, a measure of volume change), the anisotropic deformation index (ADI, the magnitude of directional
preference in the volume change), the slab rod index (SRI, the directional preference in the volume change), total
lung capacity (TLC), functional residual capacity (FRC), change in air-volume fraction difference (ΔVairf, i.e., air-
volume difference/voxel size). Imaging metrics obtained from lobar variables, raw 3D CT images [IN (inspiration)
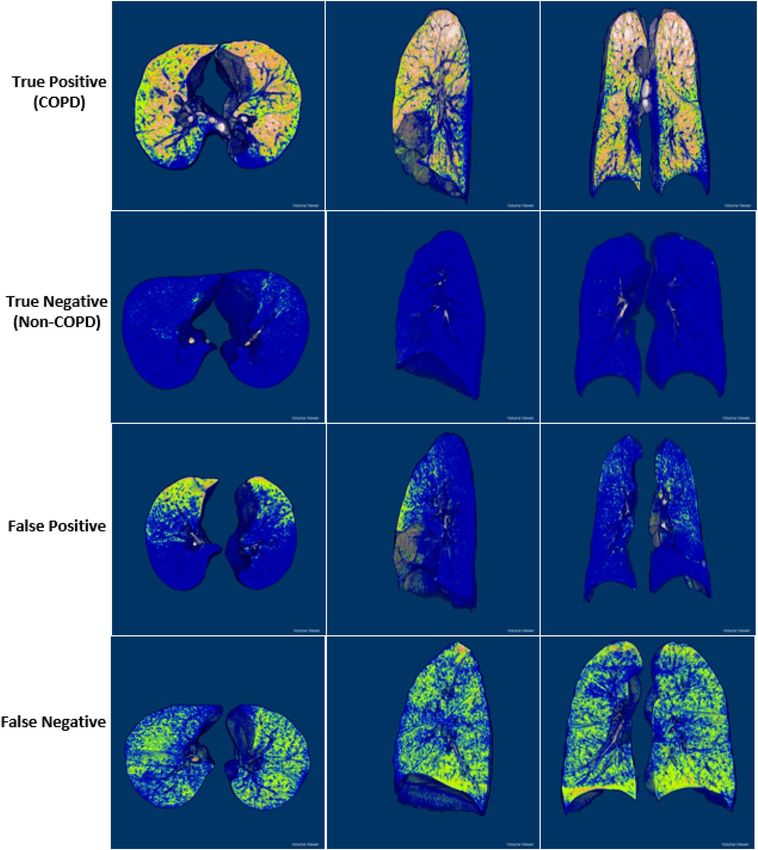
and EX (expiration)], and a concatenate of IN and EX were used for classification by CNN. As shown in Fig. 1, our
procedure consists of two main steps: CT image processing and COPD/non-COPD classification by 3D-CNN.
Demographics and lung functions. Demographic, PFTs, and QCT-based lung functions were acquired
from COPD and non-COPD subjects (Table 1). The COPD subjects included 84.8% males (average age
72.9 years) with significantly reduced FEV1 and FVC, percentage predicted values, and FEV1/FVC. The percent-
ages of Stage I, II, III and IV subjects on the global initiative for chronic obstructive lung disease (GOLD) scale
were 43.1%, 42.7%, 13.2%, and 1.0%, respectively. Meanwhile, the non-COPD subjects were younger females
with normal pulmonary functions. The weights were significantly different between the two groups (p < 0.001).
The mean (SD) radiation dose during the entire CT scanning (scout, IN, and EX imaging) was 9.15 (2.34) mSv
per subject. Regarding the QCT-based air volumes, both TLC and FRC were lower in the COPD subjects than
in the non-COPD subjects. The percent emphysema lung (Emph%) and functional small-airway disease lung
(fSAD%) were significantly larger in the COPD subjects than in the non-COPD subjects (p < 0.001). The COPD
patients also exhibited a significantly reduced Jacobian, indicating the degree of local d eformation22, and an
increased SRI, indicating the preferential deformation direction22.
3D parametric‑response mapping. Figure 1 also shows the spatial PRM distributions in a stage III
COPD subject. The total fSAD% was much higher in COPD than in non-COPD subjects (p < 0.001) (Table 1).
Scientific Reports | (2021) 11:34 | https://doi.org/10.1038/s41598-020-79336-5 2
Vol:.(1234567890)
www.nature.com/scientificreports/
Figure 1. Study design and main experimental produces of 3D-cPRM, operating on a subject with stage III
COPD. This figure was generated with ImageJ (version 1.53a, https://imagej.net/) and Microsoft PowerPoint
2010 (version 13328.20292; https://www.microsoft.com).
Non-COPD subjects COPD subjects
(n = 392) (n = 204) P value
Demographics
Male/females, n (%) 190/202 (48.5%/51.5%) 173/31 (84.8%/15.2%) < 0.001
Age, years 55.9 (16.3) 72.9 (7.4) < 0.001
Height, cm 161.3 (10.2) 161.3 (7.5) 0.992
Weight, kg 63.2 (12.0) 59.8 (9.8) < 0.001
Never/former/current 262/54/76 50/53/101
< 0.001
smokers, n (%) (66.8%/13.8%/19.4%) (24.5%/26.0%/49.5%)
COPD stages (I, II, III, IV), 88/87/27/2
0
n (%) (43.1%/42.7%/13.2%/1.0%)
PFT-based lung functions
FEV1, %predicted 100.0 (14.1) 75.0(20.0) < 0.001
FVC, %predicted 98.2 (13.6) 93.1(20.0) < 0.001
FEV1/FVC × 100 80.4 (6.0) 58.9 (8.0) < 0.001
QCT-based lung functions
TLC, litre 4.7 (1.3) 4.3 (1.0) < 0.001
FRC, litre 3.0 (1.0) 2.8 (0.9) 0.005
Emph% 1.7 (2.5) 8.5 (7.5) < 0.001
fSAD% 11.2 (13.4) 23.7 (13.6) < 0.001
ADI 0.4 (0.1) 0.3 (0.1) 0.074
SRI 0.5 (0.03) 0.6 (0.03) < 0.001
J 1.7 (0.4) 1.5 (0.3) < 0.001
Table 1. Demographics and lung functions derived from the PFTs and QCTs of COPD and non-COPD
subjects. Values are presented as mean (SD). QCT, quantitative computed tomography; PFT, pulmonary
function test; FVC, forced vital capacity; FEV1, forced expiratory volume in 1 s; FRC, functional residual
volume; TLC, total lung capacity; Emph%, percent emphysema; fSAD%, percent functional small-airway
disease; ADI, anisotropic deformation index; SRI, slab rod index; J, Jacobian.
Scientific Reports | (2021) 11:34 | https://doi.org/10.1038/s41598-020-79336-5 3
Vol.:(0123456789)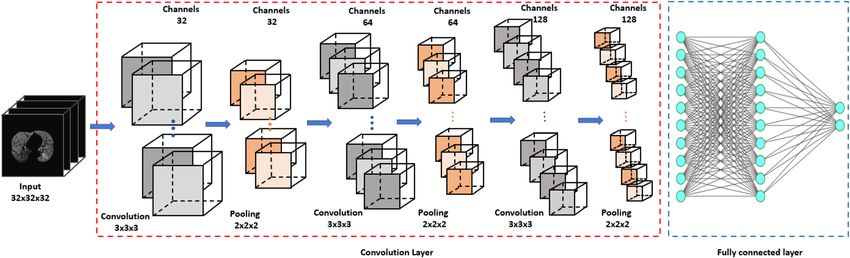
www.nature.com/scientificreports/
Accuracy Precision Sensitivity F1 Specificity AUC score
Different 3D networks with PRM dataset
3D-CNN—Naive model 89.3 82.6 88.3 85.1 93.6 0.937
3D-CNN—DenseNet121 86.9 78.1 85.8 81.2 92.3 0.904
3D-CNN—VGG16 77.4 69.8 58.5 57.4 84.0 0.827
3D-CNN—Resnet50 87.2 79.8 85.8 82.4 92.2 0.906
3D-CNN—InceptionV3 83.9 76.0 72.7 72.8 88.5 0.861
3D-CNN with different input datasets
IN 85.1 80.6 71.8 74.8 88.2 0.900
EX 86.5 75.5 86.9 80.3 93.7 0.907
ΔVairf 86.6 80.0 80.4 79.9 90.1 0.897
J 85.2 76.4 83.3 79.4 91.1 0.895
ADI 83.0 74.1 78.0 75.2 88.8 0.862
SRI 84.9 76.8 80.4 77.7 90.2 0.886
Concatenate of IN and EX CT images 87.2 76.1 95.1 84.0 97.2 0.923
Different 2D networks with PRM dataset
2D-CNN—Naive model 84.8 78.6 71.0 74.6 87.3 0.861
Pretrained—DenseNet121 86.7 77.8 85.4 81.4 92.0 0.899
Pretrained—VGG16 87.5 74.1 97.6 84.2 98.5 0.938
Pretrained—Resnet50 88.3 84.6 80.5 82.5 90.1 0.901
Pretrained—InceptionV3 88.3 80.0 87.8 83.7 93.3 0.923
Table 2. Performances of different 3D networks on the PRM dataset, the same 3D-CNN on different input
datasets, and different 2D networks on the PRM dataset.
Figure 2. Architecture of the 3D-CNN model. This figure was generated with Microsoft PowerPoint 2010
(version 13328.20292; https://www.microsoft.com).
The PRM components were spatially distributed. Quantitative measurements on a PRM spatial model provide
physicians with important insights into COPD progression levels (Fig. 1).
Training and testing results. Figure 2 illustrates the architecture of our nine-layer 3D-cPRM method
(the 3D-CNN model is described in the “Methods” section). The accuracies, sensitivities, and specificities of the
lung functional variables are presented in Table 2. Both ΔVairf, concatenate of IN and EX, and PRM were better
predicted than the other functional variables such as J, ADI, and SRI, the raw 3D CT images (IN and EX). The
sensitivity was higher for concatenate of IN and EX (95.1%) than for PRM (88.3%) and ΔVairf (80.4%), and far
beyond that of the original IN image (71.8%).
Figure 3 shows the accuracies and losses on the training and validation datasets of 3D-cPRM model as the
iterations proceeded. The training loss decreased continuously, reaching approximately zero after 500 iterations;
meanwhile, the training accuracy increased gradually to more than 0.95 after 500 iterations. Overall, the accuracy
of the validation dataset reached ~ 90% and the corresponding loss was close to zero. When the IN, EX, ΔVairf, J,
ADI, SRI, concatenate of IN and EX, and PRM were input to the CNN, the prediction accuracy reached 85.1%,
86.5%, 86.6%, 85.2%, 83.0%, 84.9%, 87.2% and 89.3%, respectively (Table 2). The CNN with PRM outperformed
the CNNs with the other functional variables, suggesting that 3D images from PRM present more visual dif-
ferences between COPD and non-COPD lungs than other images. The concatenate of IN and EX and ΔVairf
also achieved relatively high accuracy (87.2% and 86.6%, respectively). Figure 4 shows the receiver operating
characteristic (ROC) curves and AUCs of PRM, ΔVairf, and IN. Consistent with the prediction accuracies, the
Scientific Reports | (2021) 11:34 | https://doi.org/10.1038/s41598-020-79336-5 4
Vol:.(1234567890)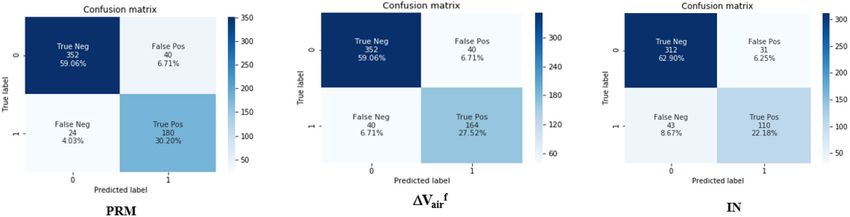
www.nature.com/scientificreports/

                                  Related work           Data                                          Methods                                  Accuracy (%)
                                                    17   Original CT slices of COPDGene testing
                                  González et al.                                                      2D-CNN                                   77.3
                                                         cohort (n = 1000)
                                                         Multi-view snapshots of 3D lung-airway tree
                                  Ran Du et al.18                                                    2D-CNN                                     88.6
                                                         (190 COPD—90 Non-COPD)
                                                         3D airway trees (190 COPD—90 Non-
                                  Ran Du et al.18                                                      3D-CNN                                   78.6
                                                         COPD)
                                                         Airway trees (980 COPD and 986 Non-
                                  Feragen et al.19                                                     SVM                                      64.9
                                                         COPD subjects)
                                                         1/6 of the total height (z) of the original
                                                                                                       Deep CNN transferred multiple instance
                                  Xu et al.27            CT sequences (190 COPD and 90 healthy                                                  99.3
                                                                                                       learning (DCT-MIL)
                                                         control subjects)
                                  Our work               3D PRM                                        3D-CNN                                   89.3

                                 Table 3.  Previously published classification results of COPD versus non-COPD datasets.

                                 Figure 3.  The loss and accuracy of the PRM training and validation datasets.

                                 AUC was highest for PRM (0.937), followed by IN and ΔVairf (with AUCs of 0.900 and 0.897, respectively). The
                                 confusion matrix of PRM (Fig. 5) reveals 40 false positives (FP, meaning that non-COPD was wrongly predicted
                                 as COPD) and 24 false negatives (FN, meaning that COPD was wrongly predicted as non-COPD). Therefore,
                                 the sensitivity of the model on the PRM dataset was 88.3%. The FP:FN ratios of ΔVairf and IN were 40:40 and
                                 31:43, respectively, implying sensitivities of 80.4% and 71.8%, respectively.

                                 3D gradient‑weighted class activation mapping (3D Grad‑CAM). Figure 6 presents some 3D PRM
                                 views of TP, TN, FP, and FN samples in three representative planes (axial, sagittal and coronal) (Fig. 6), obtained
                                 by ImageJ open-source software (version 1.53a, National Institute of Health). The four cases show different char-
                                 acteristics of PRM structure: clearly dispersed disease with significant distributions of fSAD and emphysema
                                 (TP), unnoticeable disease (TN), clustered disease dominated by fSAD (FP), and dispersed disease with substan-
                                 tial fSAD and negligible Emph (FN). The correctly predicted COPD subjects (first row of Fig. 6) presented more
                                 significant fSAD% and Emph% in their lobes than non-COPD subjects (second row of Fig. 6). The appearance
                                 differences between FP and FN were very difficult to represent, even by computer vision techniques.
                                     To overcome the lack of transparency in CNN classification and the drawing of simple conclusions in human
                                 diagnosis, we applied Grad-CAM to the trained CNN. The Grad-CAM algorithm visualizes the feature extrac-
                                 tion during the learning process of CNN as heatmaps. From the altered images of COPD versus non-COPD,
                                 we can extract the useful discriminative features. Different images from the axial, sagittal and coronal views
                                 corresponded to different maps in both groups. Abnormal regions in the lung manifested as increased values
                                 in the Grad-CAM results, implying that zero values in the heatmap correspond to normal regions in the lung.
                                 The heatmaps highlighted the PRM features that discriminated between COPD and non-COPD (Fig. 7). Most
                                 of the regions in the non-COPD lung were blue (Fig. 7A), whereas many hot colors appeared in the COPD lung
                                 (Fig. 7B). The class-discriminative regions were mainly observed in the upper and middle lobes in the COPD
                                 subjects (where the fSAD% and Emph% were also elevated), and at the local parenchyma near the airways in
                                 non-COPD subjects. Visualization of the learning process by Grad-CAM revealed that PRM became more
                                 focused by CNN as the training progressed.

Scientific Reports |   (2021) 11:34 |                      https://doi.org/10.1038/s41598-020-79336-5                                                               5

                                                                                                                                                               Vol.:(0123456789)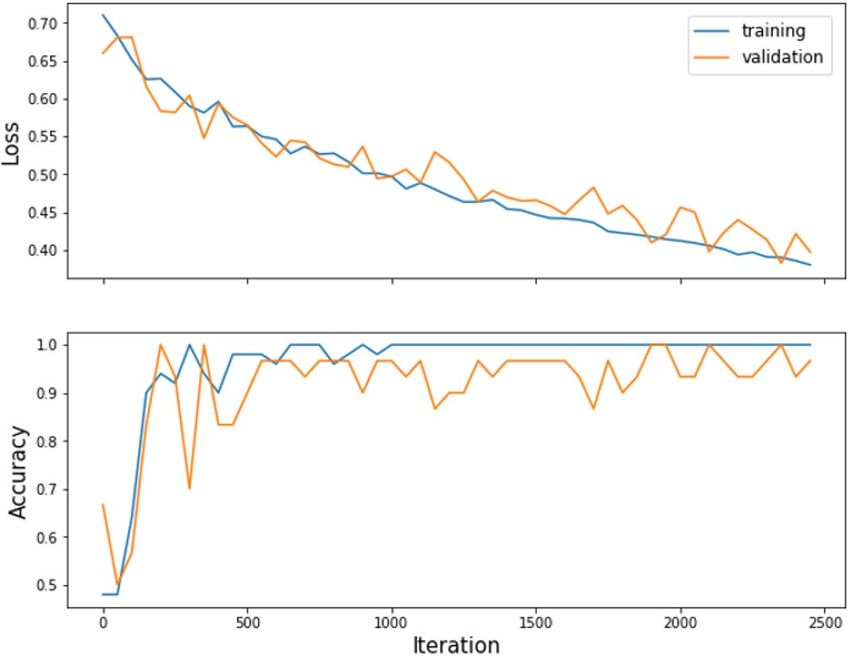
www.nature.com/scientificreports/
Figure 4. ROC curves of the COPD indices PRM, ΔVairf, and IN.
Figure 5. Confusion matrices of PRM, ΔVairf, and IN.
Comparing CNN models. The classification performance of our 3D-CNN was compared with those of four
successful CNN models: DenseNet12123, VGG1624, ResNet5025 and InceptionV326. For a fair comparison, we
converted these 2D models into the 3D domain and trained them on the same input dataset. The DenseNet121,
VGG16, ResNet50, and InceptionV3 models consist of many deep convolutional layers, and involve significantly
more network parameters than our model. The accuracies of DenseNet121, VGG16, ResNet50, and InceptionV3
in PRM classification were 86.9%, 77.4%, 87.2%, and 83.9%, respectively, confirming that our 3D-CNN model
outperforms other typical CNN networks.
Although 2D-CNN with multi-slice representation has been a popular choice in medical image analyses, it
unavoidably loses information. Here, we compared the performances of the proposed model to an alternative
2D-CNN model. The accuracy of our 2D-CNN model was 84.8%, versus 86.7%, 87.5%, 88.3%, and 88.3% for
pretrained DenseNet121, VGG16, ResNet50, and InceptionV3, respectively. In a natural CNN, the proposed 3D
approach significantly outperformed the 2D approach. Therefore, the 3D context is important for differentiating
between COPD and non-COPD structures, necessitating the development of 3D pretrained models.
Discussion
This study developed a deep 3D-CNN model that identifies COPD from CT imaging data of current, former
smokers and normal subjects. Among the lung functional variables, the PRM was especially useful for identi-
fying COPD. The PRMs extracted from CT images present distinct and abnormal morphological differences
between COPD and non-COPD lungs. A deep CNN better represents these abnormalities from 3D PRM images
than from 2D PRM images; in the former case, the classification accuracy of COPD versus non-COPD reached
89.3%. To our knowledge, our method identifies COPD patients at least as accurately as previous classification
approaches17–19,27. A strong positive correlation was found between some combinations of PRM phenotypes
and 3D CNNs.
As a COPD abnormality manifests in various forms and severity, it is not easily representable in the
complex 3D structure of a human lung. COPD-induced abnormalities in the lung functional variables are
multidimensional28 and vary with anatomical location. Furthermore, quantitative measurements of the lung
functional variables of COPD are non-standardized. The uncertainties and difficulties are enhanced by the
different acquisition and reconstruction protocols of different CT s canners29–31. Our 3D-cPRM method avoids
these difficulties by efficiently distinguishing PRM abnormalities in COPD. The developed CNN fully exploits
the available CT data, rather than pre-selecting 2D slices or snapshot images for 2D C NNs18, or directly input-
ting CT slices to a 2D-CNN17.
Scientific Reports | (2021) 11:34 | https://doi.org/10.1038/s41598-020-79336-5 6
Vol:.(1234567890)www.nature.com/scientificreports/
Figure 6. Classification samples of TP (first row), TN (second row), FP (third row), and FN (fourth row) in the
axial (left), sagittal (center), and coronal (right) views of 3D PRM images. This figure was generated with ImageJ
(version 1.53a, https://imagej.net/) and Microsoft PowerPoint 2010 (version 13328.20292; https://www.micro
soft.com).
Table 3 overviews the datasets, methods, and classification results of some recent deep-learning studies that
distinguish COPD from non-COPD subjects. The use of different datasets and methods precludes a fair com-
parison, but all models yielded satisfactory results. The advantage of the proposed 3D-cPRM approach, which
achieved a detection accuracy of 89.3%, was confirmed above. Our result is comparable to that of a previous CNN
study17 and far exceeded that of multi-view snapshots of a 3D lung-airway tree (24/596 FPs in our method, vs.
26/280 FPs and an accuracy of 88.6%18). Therefore, a 3D-CNN can effectively eliminate the false-positive results
generated by 2D-CNN. The 3D-cPRM method (with a sensitivity of 88.3%; see Fig. 5) reduced the number of FPs
from 43 in the 2D-CNN to 24. The accuracy of the pretrained models approached that of the 3D-CNN model,
and surpassed that of the natural 2D-CNN model. This implies that a pretrained 3D model can improves the
prediction accuracy of future COPD cases. This significant improvement again demonstrates that 3D-cPRM
can clinically distinguish between the PRM characteristics of COPD and non-COPD subjects. When inputted
with the combined 3D IN and EX images, our model achieved 95.1% sensitivity and 97.2% specificity, exceeding
that of the PRM input (88.3% sensitivity and 93.6% specificity; see Table 2). However, this input combination
slightly reduced the accuracy from that of PRM (87.2% vs. 89.3%), and doubled the computational cost from
that of PRM (42 min vs. 80 min).
Our model was supported by the Grad-CAM implementation, which distinguished between the COPD and
non-COPD imaging features in the PRM input. The heatmap images of Grad-CAM were of limited usefulness
when the highlighted class-discriminative regions were unclear. This can be explained by the low resolution of
our convolutional layer (32 × 32 × 32 voxels). Smaller kernels in Grad-CAM yield poor contrast and visualiza-
tion. Most of the regions in non-COPD lungs were blue, whereas hot-color regions were observed in the COPD
Scientific Reports | (2021) 11:34 | https://doi.org/10.1038/s41598-020-79336-5 7
Vol.:(0123456789)www.nature.com/scientificreports/
Figure 7. Axial (top), sagittal (center), and coronal (bottom) views of PRM images (gray) and their Grad-CAM
heatmap images (color), generated from non-COPD (A) and COPD (B) subjects. This figure was generated with
Microsoft PowerPoint 2010 (version 13328.20292; https://www.microsoft.com).
Institution (subjects, n) JNUH (296/596) KNUH (300/596)
Scanner manufactory Siemens definition flash 128 slices Siemens definition AS 64 slices
Scan type Spiral Spiral
Rotation time(s) 0.5 0.5
Detector configuration 128 × 0.6 mm 64 × 0.6 mm
Pitch 1 1
Peak kilo voltage, kVp 120 140
Exposure (mAs) 110, Effective for inspiration 50, Effective for expiration 100, Effective for both inspiration and expiration
Dose modulation Care dose OFF Care dose OFF
Reconstruction algorithm B35f. B30f.
Thickness (mm) 1 0.6
Table 4. Scanners and scanning protocols used on the COPD and non-COPD subjects. JNUH, Jeonbuk
National University Hospital; KNUH, Kangwon National University Hospital; mAs, milliampere-seconds.
subjects. This result reveals that (unlike humans) deep CNNs can memorize large volumes of CT image infor-
mation. Regardless of the classification method, the CNN identified the PRM as an important imaging feature
of COPD. The PRM was more significantly correlated with COPD than the other functional variables (ΔVairf,
SRI, ADI, and J), affirming that this variable both discriminated and predicted the clinical features of COPD.
The trained CNN automatically and objectively identified the PRM as an important feature during the COPD
versus non-COPD discrimination. By visualizing the classification target of the CNN, Grad-CAM overcame the
common drawback of deep-learning models, namely, the non-transparent interpretation. Unlike current image
processing methods that require the summary statistics on a feature of interest, deep learning uses all data avail-
able in the image, and predicts the clinical relevance at the large-population level.
Our study has several limitations. First, our datasets were sourced from two hospitals adopting similar imag-
ing protocols and the same image analysis. However, various restructured kernels are mainly responsible for
changes in Hounsfield (HU) values. These variations affect the PRM classification maps and the subsequent
Scientific Reports | (2021) 11:34 | https://doi.org/10.1038/s41598-020-79336-5 8
Vol:.(1234567890)www.nature.com/scientificreports/
calculation results. The scanners in our study used the same B3_f kernel, differing only in the 0th and 5th gen-
erations. If the reconstruction kernels and scanners are inconsistent (a common complication of multi-center
data), the input parameters must be normalized into a similar data range for accurate classification. Second, the
image noise and registration errors may also affect the accuracy of PRM map prediction. Errors in the registration
technique are a common problem for all CT-based quantitative methods32. Here we employed a mass-preserving
registration method that maintains the same tissue volume between two inflation levels. This approach has
been rigorously validated in lungs undergoing large deformations33. An image registration algorithm using this
approach achieved sub-voxel a ccuracy33. After downsampling our imaging data, the resampled voxel size was
much larger than the spatial accuracy, reducing the likely impact of the image registration accuracy on the pre-
diction accuracy of our deep-learning model. Finally, in a clinical setting, the classification of using CT-based
features may not be used directly, because we did not associate any implication of CT-based features with clinical
measures. This limitation should be supplemented with a well-designed prospective study that collect clinical
and therapeutic information, as well as CT images.
In this study, we demonstrated that 3D PRM is a versatile imaging biomarker of phenotypic COPD. In par-
ticular, 3D PRM localizes the COPD disease states (fSAD and emphysema) in high volume. Unlike other meth-
odologies, 3D PRM easily provides the detailed spatial information on the distribution and location of COPD
disease. By studying the unique structural and functional features between the two population groups, physicians
can tailor their therapeutic interventions to individual patients with COPD, complementing standard clinical
techniques. Especially when a PFT diagnosis is uncertain, COPD is commonly detected by QCT. Our diagnostic
3D-cPRM method is a useful initial tool for investigating COPD in a limited number of patients. However, a
good deep diagnostic model should be able to distinguish COPD from other lung diseases (such as asthma and
lung cancer), and assess the severity of COPD (GOLD stages I–IV). In the next phase of our study, we will enroll
more patients from different centers and update the dataset to achieve stable model performance. By adapting
more advanced methodological strategies based on CNN models, we could precisely distinguish COPD from
non-COPD in CT i mages34. Furthermore, the high extraction ability of 3D PRM imaging ensures good contrast.
In recent CNN studies, the accuracy has been enhanced by combining different imaging m odalities35,36. Although
the 3D-CNN inputted with PRM CT images performed comparably to previous findings, its accuracy might
be enhanced by combining ultrasound, X-ray, magnetic resonance imaging, single photon emission computed
tomography, or positron emission tomography. The effectiveness of these modality combinations should also
be considered in future work.
In conclusion, alongside the worldwide prevalence and impact of COPD, quantitative image visualization has
become a cornerstone of clinical investigation. We proposed a deep 3D CNN that automatically identifies COPD
from the lung functional variables, and visualizes the results. COPD manifests as abnormal appearances of the
lung parenchyma, which were well represented by the deep CNN. The proposed method will enable early-stage
identification of COPD, thereby reducing the missed-diagnosis rate. It can also elucidate the underlying disease
pathogenesis and improve the management of COPD, especially in a time-constrained clinical environment. Our
results clarified the potential of the PRM extraction features in COPD classification. The analysis of deep training
processes, combined with specific imaging characteristics, can facilitate the discovery of new medical features.
Methods
Dataset. All methods complied with the guidelines and regulations of the participating centers. Informed
consent was obtained from all participating subjects. All procedures were approved by the Institutional Review
Board of Kangwon National University Hospital (KNUH) and Jeonbuk National University Hospital (JNUH) at
the individual sites (KNUH 2019-06-007 and CUH 2016-03-020-005). The 596 subjects (204 COPD, 392 non-
COPD) were enlisted from subjects who underwent CT scans in KNU and JNU Hospitals. The KNUH subjects
had a clinically tested disease history of asthma, pneumonia, and abnormal pulmonary function. The acquisi-
tion and reconstruction parameters of the two CT scanners are given in Table 4. The KNUH subjects included
50/53/101 COPD subjects with never/former/current-smoker status accompanied by cement dust effects. Their
data were supported by a Korean research project called the Chronic Obstructive pulmonary disease in Dusty
Areas near cement plants (CODA), which monitored this cohort over 10 years. The JNUH subjects (control
group) included 262/54/76 non-COPD subjects with never/former/current-smoker history, and no or little
exposure to cement dust. Their data were collected by JNUH during 3 years37. Both CT scanners had similar
specifications and imaging protocols (see Table 1) and used the same filtered back-projection reconstruction
kernel (Siemens Definition Flash 128 slices B30f. and Siemens Definition AS 64 slices B35f.).
Registration. By registering the images of two or more lung CT images obtained at different static lung
volumes (typically, the inspiration volume and one or more expiratory lung volumes), we obtain the functional
variables of the images, such as the regional ventilation variable (distribution of the inspired air bolus). The pul-
monary registration technique calculates the optimal local-to-local correspondence between images captured
with different modalities or collected at different times38. The similarity measure of the sum of squared tissue
volume difference (SSTVD)38 has been demonstrated to successfully improve registration of lung images with
large deformation. This approach computes the changes in the reconstructed HUs caused by the inflationary
lung motions. For reference, the attenuation values of air, water, and tissue are − 1000, 0 HU, and 55 HU respec-
tively. Prior to registration, lung parenchyma, airway, and vessel analyses were automated using VIDA Pul-
monary Workstation and Apollo software (VIDA Diagnostics, Coralville, IA) for extracting their binary-mask
segmentation images. The binarized images were registered using a segmentation and registration toolkit ITK
(https://itk.org/) implemented in a homemade C++ program. In this paper, the paired CT data were registered
with SSTVD22,38–40. The parenchymal/global functional variables (ΔVairf, J, ADI, and SRI), were extracted by an
Scientific Reports | (2021) 11:34 | https://doi.org/10.1038/s41598-020-79336-5 9
Vol.:(0123456789)www.nature.com/scientificreports/
imaging registration technique applied between the inspiration and expiration images. The Emph%, fSAD%, and
ΔVairf of the lungs were assessed by a CT density-threshold method, whereas the ADI, J, and SRI were assessed by
the mechanical strains estimated in the image registration (Table 4). The PRM images were trained to compare
the raw inspiration and expiration CT images, and the ΔVairf, ADI, J, and SRI values were generated from the
lung function parameters.
Parametric response mapping. The COPD phenotypes were classified by their topological properties
obtained by PRM analysis of the inspiratory (reference)/expiratory (floating) lung CT images. The PRM created
from the paired CT lung images improves the COPD phenotype detection by allowing visualization and quanti-
fication of the fSAD and Emph components4. The registered image voxels (discrete 3D image units consisting of
the inspiratory and expiratory attenuations in HUs) within the segmented lung volume were classified into three
categories by imposing two thresholds: − 950 HU on the inspiratory CT and − 856 HU on the expiratory CT. The
PRM components were colored as follows: 32 (fSAD, color-coded green; > − 950 HU on IN and ≤ − 856 HU on
EX) for functional small-airway disease; 64 (Emph, color-coded red; ≤ − 950 HU on IN and ≤ − 856 HU on EX)
for emphysema clusters, and 8 (normal, color-coded blue; > − 950 HU on IN and > − 856 HU on EX) for healthy
lung parenchyma and unclassified voxels.
3D convolutional network model. When selecting a 3D-CNN for medical imaging classification prob-
lems, one must consider the high computation time, large size of the training datasets, and lack of pretrained
models. These difficulties have been ameliorated by different CNN architectures. Unlike 2D CNNs, a 3D-CNN
can encode representations of volumetric fields, and therefore extract more discriminative features via the 3D
spatial information. Our 3D-cPRM mainly consists of 3D convolutional layers, 3D pooling layers, and fully
connected layers, which are successively stacked into a hierarchical architecture. Each channel in a 3D-CNN is
a 3D feature volume rather than a 2D feature map. The convolutions and max-pooling layers of a 3D-CNN are
operated in a cubic manner. In a 3D max-pooling operation, the maximum value in the cubic neighborhood
is selected and input to the subsequent feature map. After the pooling operation, the resolution of the feature
volumes is reduced by an amount corresponding to the pooling kernel size. Theoretically, the pooled learned
rocessing41.
features are invariant to local translations in 3D space, which is eminently useful for image p
CNN architecture. Considering the three-dimensional processing, size of our training data, and available
GPU computational power, we constructed a simple architecture for computational efficiency without overly
compromising the accuracy. The network was built within the deep-learning framework Keras, and the input
images were read by SimpleITK, an open-source multi-dimensional image analysis program. Our 3D deep net-
work (see Fig. 2) consisted of 9 layers: 3 convolutional layers, 3 batch normalization layers, and 3 max-pooling
layers. The datasets were resampled to 32 × 32 × 32 voxels using the linear interpolation method, and the HU
of each pixel was normalized within the range [0, 1]. After each convolutional layer of kernel size 3 × 3 × 3, the
feature volumes were down-sampled by a max-pooling layer with a 2 × 2 × 2 voxels window. Finally, three fully
connected layers (two with 128 neurons and one with 2 neurons) preceded the classification layer. As the acti-
vation function, we employed a rectified linear unit (ReLU) in each fully connected and convolutional layer.
The model was trained from scratch with weights initialized from a normal distribution with mean μ = 0 and
standard deviation σ = 0.1. The number of filters was determined as 32, 64, and 128 according to experiences. The
COPD and non-COPD labels were then distinguished by a softmax function. The neural network was trained
with the binary cross-entropy between the predicted and true diagnoses as the loss function. The convolution
network structure was optimized by an Adam optimizer with the default learning rate (0.0001)14,42. Our CNNs
were trained over 2500 iterations on a batch size of 50 samples. The iterative accuracies and losses on the training
and testing datasets were plotted to validate the iteration number.
For comparison with other 3D-CNN models, we also implemented a 2D-CNN model by extracting one
slice per subject at the 50% location of all slices. The 2D images were augmented with randomly rotated, scaled,
sheared, and translated images within a defined range. The original size of the 2D CT image (512 × 512 pixels)
was down-sampled to the input size of the 2D-CNN model (256 × 256 pixels). The number of filters was imposed
as 32, 64, and 128, consistent with the 3D model, and the original HU value was normalized to between zero and
one. We also assessed the 2D pretrained CNN models on the imaging data. For predicting COPD cases among
our imaging data, we replaced the fully connected layer of the pretrained DenseNet121, VGG16, ResNet50, and
InceptionV3 CNNs with a new fully connected layer, which was trained only on our 2D imaging data.
3D gradient‑weighted class activation mapping (3D Grad‑CAM). The classification conclusions of
CNN models are non-transparent and cannot provide intuitive reasoning and explanations like human diagnos-
tic experts42. Here, we adopted a Grad-CAM approach for visualizing the CNN learning process. This method
creates a 2D spatial heatmap of the image indicating the focal points of the CNN predictions. The heatmap tracks
the spatial attention of the 3D-CNN when predicting COPD disease.
Training and performance evaluation methods. The performances of the CNNs were evaluated by
five-fold cross-validation. One-fold was reserved as the test dataset and the other four folds were used as the
training dataset. The CNNs were implemented on an Intel, Xeon, CPU E5-2640 v4 @ 2.40 GHz (20 CPUs) with
an NVIDIA GeForce RTX 2080Ti. The classification performance was assessed by the accuracy, precision, sensi-
tivity, F1 score, specificity, confusion matrix, ROC curve, and AUC. These metrics were computed from the true
positive (TP), true negative (TN), false negative (FN), and false positive (FP) r esults24. Statistical comparison of
the demographics and lung functions was performed by two-sample t-test.
Scientific Reports | (2021) 11:34 | https://doi.org/10.1038/s41598-020-79336-5 10
Vol:.(1234567890)www.nature.com/scientificreports/
Received: 25 June 2020; Accepted: 8 December 2020
References
1. Adeloye, D. et al. Global and regional estimates of COPD prevalence: systematic review and meta-analysis. J. Glob. Health 5,
186–202 (2015).
2. Agusti, A.G. Global strategy for the diagnosis, management, and prevention of COPD—2020 Report. 2020 Global Initiative for
COPD, 1–2 (2020).
3. Agusti, A. & Vestbo, J. Current controversies and future perspectives in chronic obstructive pulmonary disease. Am. J. Resp. Crit.
Care 184, 507–513 (2011).
4. Galban, C. J. et al. Computed tomography-based biomarker provides unique signature for diagnosis of COPD phenotypes and
disease progression. Nat. Med. 18, 1711–1715 (2012).
5. Labaki, W. W. & M.K.H. ,. Artificial Intelligence and chest imaging: Will deep learning make us smarter?. Am. J. Respir. Crit. Care
Med. 197, 193–203 (2018).
6. Coxson, H. O., Leipsic, J., Parraga, G. & Sin, D. D. Using pulmonary imaging to move chronic obstructive pulmonary disease
beyond FEV1. Am. J. Resp. Crit. Care 190, 135–144 (2014).
7. Kohansal, R., Soriano, J. B. & Agusti, A. Investigating the natural history of lung function: facts, pitfalls, and opportunities. Chest
135, 1330–1341 (2009).
8. Gorbunova, V. et al. Early detection of emphysema progression. Med. Image Comput. Comput. Assist. Interv. 13, 193–200 (2010).
9. Gorbunova, V. et al. Weight preserving image registration for monitoring disease progression in lung CT. Med. Image Comput.
Comput. Assist. Interv. 11, 863–870 (2008).
10. Shen, D., Wu, G. & Suk, H. I. Deep learning in medical image analysis. Annu. Rev. Biomed. Eng. 19, 221–248 (2017).
11. Litjens, G. et al. A survey on deep learning in medical image analysis. Med. Image Anal. 42, 60–88 (2017).
12. Hosny, A., Parmar, C., Quackenbush, J., Schwartz, L. H. & Aerts, H. Artificial intelligence in radiology. Nat. Rev. Cancer 18, 500–510
(2018).
13. Soffer, S. et al. Convolutional neural networks for radiologic images: a radiologist’s guide. Radiology 290, 590–606 (2019).
14. Yann LeCun, Y. B. G. H. Deep learning. Nature 521, 436–444 (2015).
15. Bolei, Z., et al. Learning deep features for discriminative localization. In 2016 IEEE Conference on Computer Vision and Pattern
Recognition, 2921–2929 (2016).
16. Zhou, B., Khosla, A., Lapedriza, A., Oliva, A., & Torralba, A. Learning deep features for discriminative localization. In 2016 IEEE
Conference on Computer Vision and Pattern Recognition (CVPR) (Las Vegas, NV, 2016).
17. Gonzalez, G. et al. Disease staging and prognosis in smokers using deep learning in chest computed tomography. Am. J. Respir.
Crit. Care Med. 197, 193–203 (2018).
18. Du, R. et al. Identification of COPD from multi-view snapshots of 3D lung airway tree via deep CNN. IEEE Access 8, 38907–38919
(2020).
19. Feragen, A. et al. Geometric tree kernels: classification of COPD from airway tree geometry. Inf. Process. Med. Imaging 23, 171–183
(2013).
20. Bodduluri, S., Newell, J. D. Jr., Hoffman, E. A. & Reinhardt, J. M. Registration-based lung mechanical analysis of chronic obstruc-
tive pulmonary disease (COPD) using a supervised machine learning framework. Acad. Radiol. 20, 527–536 (2013).
21. Choi, S. et al. Differentiation of quantitative CT imaging phenotypes in asthma versus COPD. BMJ Open Respir. Res. 4, e000252
(2017).
22. Choi, S. et al. Registration-based assessment of regional lung function via volumetric CT images of normal subjects vs. severe
asthmatics. J. Appl. Physiol. 115, 730–742 (2013).
23. Huang, G., Liu, Z., Maaten, L.V.D., & Weinberger, K.Q. Densely connected convolutional networks. In 2017 IEEE Conference on
Computer Vision and Pattern Recognition (CVPR) (Honolulu, HI, 2017).
24. Karen Simonyan, A. Z. Very deep convolutional networks for large-scale image recognition. Computer Vision and Pattern Recogni-
tion (2014).
25. He, K., Zhang, Z., Ren, S., & Sun, J. Deep residual learning for image recognition. In 2016 IEEE Conference on Computer Vision
and Pattern Recognition (CVPR) 770–778 (Las Vegas, NV, 2016).
26. Szegedy, C., Vanhoucke, V., Ioffe, S., Shlens, J., & Wojna, Z. Rethinking the inception architecture for computer vision. In 2016
IEEE Conference on Computer Vision and Pattern Recognition (CVPR) (Las Vegas, NV, 2016).
27. Xu, C. et al. DCT-MIL: deep CNN transferred multiple instance learning for COPD identification using CT images. Phys. Med.
Biol. 65, 145011 (2020).
28. Hackx, M., Bankier, A. A. & Gevenois, P. A. Chronic obstructive pulmonary disease: CT quantification of airways disease. Radiol-
ogy 265, 34–48 (2012).
29. Sheikh, K., Coxson, H. O. & Parraga, G. This is what COPD looks like. Respirology 21, 224–236 (2016).
30. Ostridge, K. & Wilkinson, T. M. A. Present and future utility of computed tomography scanning in the assessment and manage-
ment of COPD. Eur. Respir. J. 48, 216–228 (2016).
31. Pare, P. D., Nagano, T. & Coxson, H. O. Airway imaging in disease: Gimmick or useful tool?. J. Appl. Physiol. 113, 636–646 (2012).
32. Eppenhof, K. A. J. & Pluim, J. P. W. Error estimation of deformable image registration of pulmonary CT scans using convolutional
neural networks. J. Med. Imaging 5, 3 (2018).
33. Cao, K., Ding, D., Christense, G. E. & Reinhardt, J. M. Tissue volume and vesselness measure preserving nonrigid registration of
lung CT images. SPIE Med. Imaging 7623, 762309 (2010).
34. Monkam, P. et al. Detection and classification of pulmonary nodules using convolutional neural networks: a survey. IEEE Access
7, 78075–78091 (2019).
35. Karayama, M. et al. Respiratory impedance is correlated with morphological changes in the lungs on three-dimensional CT in
patients with COPD. Sci. Rep. UK 7, 1–8 (2017).
36. Smith, B. M. et al. Human airway branch variation and chronic obstructive pulmonary disease. Proc. Natl. Acad. Sci. USA 115,
E974–E981 (2018).
37. Kim, S. S., Jin, G. Y., Li, Y. Z., Lee, J. E. & Shin, H. S. CT quantification of lungs and airways in normal Korean subjects. Korean J.
Radiol. 18, 739–748 (2017).
38. Yin, Y., Hoffman, E. A. & Lin, C. L. Mass preserving nonrigid registration of CT lung images using cubic B-spline. Med. Phys. 36,
4213–4222 (2009).
39. Gevenois, P. A. et al. Micronodules and emphysema in coal mine dust or silica exposure: relation with lung function. Eur. Respir.
J. 12, 1020–1024 (1998).
40. Choi, S. et al. Quantitative computed tomographic imaging-based clustering differentiates asthmatic subgroups with distinctive
clinical phenotypes. J. Allergy Clin. Immunol. 140, 690–700 (2017).
41. Ian Goodfellow, Y. B. Aaron Courville. Deep learning (MIT Press, Cambridge, 2016).
42. Krizhevsky, A., Sutskever, I. & Hinton, G. E. ImageNet classification with deep convolutional neural networks. Commun. ACM
60, 84–90 (2017).
Scientific Reports | (2021) 11:34 | https://doi.org/10.1038/s41598-020-79336-5 11
Vol.:(0123456789)www.nature.com/scientificreports/
Acknowledgements
This work was supported by the Korea Ministry of Environment (MOE) as “The Environmental Health Action
Program” [2018001360004, and 2018001360001], and the National Research Foundation of Korea (NRF) Grant
funded by the Korea government (MSIT) [NRF-2020R1F1A1069853].
Author contributions
T.T.H., S.C. designed the experiments and interpreted the results. W.J.K., C.H.L, K.J.C., S.H.B, S.O.K., G.Y.J.,
E-K.P., S.C. collected experimental data. T.T.H., S.C., T.K. performed the experiments. T.T.H. and S.C. performed
the analyses and wrote the manuscript. All authors provided feedback on the manuscript.
Competing interests
The authors declare no competing interests.
Additional information
Correspondence and requests for materials should be addressed to S.C.
Reprints and permissions information is available at www.nature.com/reprints.
Publisher’s note Springer Nature remains neutral with regard to jurisdictional claims in published maps and
institutional affiliations.
Open Access This article is licensed under a Creative Commons Attribution 4.0 International
License, which permits use, sharing, adaptation, distribution and reproduction in any medium or
format, as long as you give appropriate credit to the original author(s) and the source, provide a link to the
Creative Commons licence, and indicate if changes were made. The images or other third party material in this
article are included in the article’s Creative Commons licence, unless indicated otherwise in a credit line to the
material. If material is not included in the article’s Creative Commons licence and your intended use is not
permitted by statutory regulation or exceeds the permitted use, you will need to obtain permission directly from
the copyright holder. To view a copy of this licence, visit http://creativecommons.org/licenses/by/4.0/.
© The Author(s) 2021
Scientific Reports | (2021) 11:34 | https://doi.org/10.1038/s41598-020-79336-5 12
Vol:.(1234567890)You can also read