Latent traits of lung tissue patterns in former smokers derived by dual channel deep learning in computed tomography images
←
→
Page content transcription
If your browser does not render page correctly, please read the page content below
www.nature.com/scientificreports

                OPEN             Latent traits of lung tissue patterns
                                 in former smokers derived by dual
                                 channel deep learning in computed
                                 tomography images
                                 Frank Li1,2, Jiwoong Choi3,4, Chunrui Zou2,3, John D. Newell Jr.5, Alejandro P. Comellas6,
                                 Chang Hyun Lee5,7, Hongseok Ko8, R. Graham Barr9, Eugene R. Bleecker10,
                                 Christopher B. Cooper11, Fereidoun Abtin12, Igor Barjaktarevic12, David Couper13,
                                 MeiLan Han14, Nadia N. Hansel15, Richard E. Kanner16, Robert Paine III16, Ella A. Kazerooni17,
                                 Fernando J. Martinez18, Wanda O’Neal19, Stephen I. Rennard20, Benjamin M. Smith21,22,
                                 Prescott G. Woodruff23, Eric A. Hoffman1,5,6 & Ching‑Long Lin1,2,3,5*

                                 Chronic obstructive pulmonary disease (COPD) is a heterogeneous disease and the traditional
                                 variables extracted from computed tomography (CT) images may not be sufficient to describe all
                                 the topological features of lung tissues in COPD patients. We employed an unsupervised three-
                                 dimensional (3D) convolutional autoencoder (CAE)-feature constructor (FC) deep learning network
                                 to learn from CT data and derive tissue pattern-clusters jointly. We then applied exploratory factor
                                 analysis (EFA) to discover the unobserved latent traits (factors) among pattern-clusters. CT images
                                 at total lung capacity (TLC) and residual volume (RV) of 541 former smokers and 59 healthy non-
                                 smokers from the cohort of the SubPopulations and Intermediate Outcome Measures in the COPD
                                 Study (SPIROMICS) were analyzed. TLC and RV images were registered to calculate the Jacobian
                                 (determinant) values for all the voxels in TLC images. 3D Regions of interest (ROIs) with two data
                                 channels of CT intensity and Jacobian value were randomly extracted from training images and were
                                 fed to the 3D CAE-FC model. 80 pattern-clusters and 7 factors were identified. Factor scores computed
                                 for individual subjects were able to predict spirometry-measured pulmonary functions. Two factors
                                 which correlated with various emphysema subtypes, parametric response mapping (PRM) metrics,
                                 airway variants, and airway tree to lung volume ratio were discriminants of patients across all severity
                                 stages. Our findings suggest the potential of developing factor-based surrogate markers for new COPD
                                 phenotypes.

                                 1
                                  Department of Biomedical Engineering, University of Iowa, Iowa City, IA, USA. 2IIHR‑Hydroscience and
                                 Engineering, 2406 Seamans Center for the Engineering Art and Science, University of Iowa, Iowa City, IA 52242,
                                 USA. 3Department of Mechanical Engineering, University of Iowa, Iowa City, IA, USA. 4Department of Internal
                                 Medicine, School of Medicine, University of Kansas, Kansas City, KS, USA. 5Department of Radiology, University
                                 of Iowa, Iowa City, IA, USA. 6Department of Internal Medicine, University of Iowa, Iowa City, IA, USA. 7Department
                                 of Radiology, Seoul National University, Seoul, Republic of Korea. 8Department of Radiology, Chungnam National
                                 University Sejong Hospital, Sejong, Republic of Korea. 9Mailman School of Public Health, Columbia University,
                                 New York, NY, USA. 10Department of Medicine, University of Arizona, Tucson, AZ, USA. 11Department of
                                 Physiology, UCLA, Los Angeles, CA, USA. 12Department of Medicine, UCLA, Los Angeles, CA, USA. 13Department
                                 of Biostatistics, University of North Carolina, Chapel Hill, NC, USA. 14Department of Internal Medicine, University
                                 of Michigan, Ann Arbor, MI, USA. 15School of Medicine, Johns Hopkins, Baltimore, MD, USA. 16School of Medicine,
                                 University of Utah, Salt Lake City, UT, USA. 17Department of Radiology, University of Michigan, Ann Arbor, MI,
                                 USA. 18Weill Cornell Medicine, Cornell University, New York, NY, USA. 19School of Medicine, University of North
                                 Carolina, Chapel Hill, NC, USA. 20Department of Internal Medicine, University of Nebraska College of Medicine,
                                 Omaha, NE, USA. 21Department of Medicine, Columbia University, New York, NY, USA. 22Research Institute,
                                 McGill University Health Center, Montreal, Canada. 23School of Medicine, UCSF, San Francisco, CA, USA. *email:
                                 ching-long-lin@uiowa.edu

Scientific Reports |   (2021) 11:4916                | https://doi.org/10.1038/s41598-021-84547-5                                                 1

                                                                                                                                             Vol.:(0123456789)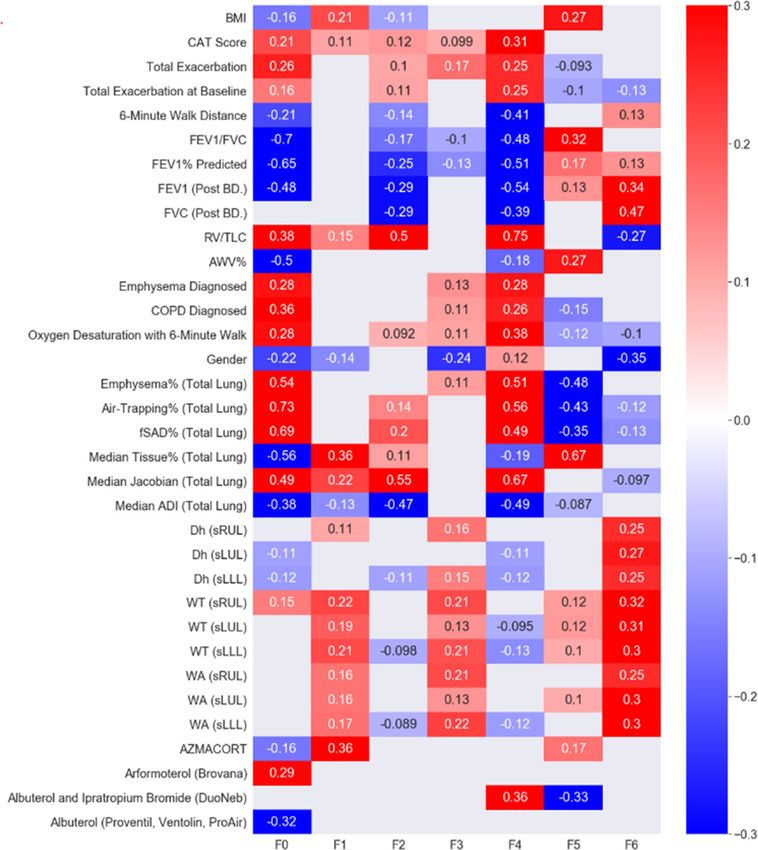
www.nature.com/scientificreports/
Stratum 1 Stratum 2 Stratum 3 Stratum 4
N = 59 N = 255 N = 156 N = 130
Demographics
53.83 66.07 68.76 65.75
Age, years
(9.54) (7.37) (6.24) (6.98)
28.87 29.86 28.82 27.38
BMI, kg/m2
(5.60) (5.02) (5.09) (4.96)
Sex (male %) 27 42 60 47
Race, Caucasian/African American/Other (%) 62.71/30.51/6.78 83.97/9.61/6.42 87.45/9.02/3.53 86.92/11.54/1.54
GOLD 0/1/2/3/4 (%) NA 96.15/1.92/1.92/0/0 0.39/38.43/61.18/0/0 0/0/0/70.77/29.23
Maximal lung function
100 95 76 35
FEV1% predicted
(13) (14) (16) (9)
81 77 58 37
FEV1/FVC × 100%
(5) (5) (8) (9)
Table 1. Demographic data and PFT measures for COPD patients in each stratum. Entries are mean (SD)
unless otherwise specified.
Chronic obstructive pulmonary disease (COPD) is a complex and heterogeneous condition characterized by
airflow limitation and was the fourth leading cause of death in the United States in 2016 and 20171,2. Pulmonary
function tests (PFTs) are commonly used to measure forced expiratory volume in one second ( FEV1) and forced
vital capacity (FVC) for the diagnosis of COPD, but spirometry is known to be poorly correlated with s ymptoms3.
Furthermore, these measures cannot detect local structural and functional alterations in early stages of COPD.
Thus, several studies have utilized imaging-based variables extracted from computed tomography (CT) lung
images to identify COPD phenotypes. For example, since the introduction of the parametric response map
(PRM)4 that matches CT images at inspiration and expiration to identify voxels of functional small airway dis-
ease (fSAD; i.e. non-emphysematous air-trapping region where CT intensity is less than − 856 HU on RV image)
and emphysema (Emph; i.e. emphysematous region where CT intensity is less than − 950 HU on TLC image), a
number of studies have focused on small airways using this voxel-wise imaging analysis t echnique5. To account
for the topological features of PRM’s metrics, topological fSAD and Emph measures have been developed based
on Minkowski functionals6. Haghighi et al. employed CT imaging-based structural and functional variables at
both local and global scales to identify clinically relevant clusters for current and former smokers, respectively7,8.
Subjective selections of imaging-based variables may not be inclusive enough to describe all the features of
COPD lungs9 because they are based on known physiology and pathophysiology. On the other hand, machine
learning allows for identification of unknown disease phenotypes from CT images. In recent years, machine
learning techniques, including traditional machine learning and contemporary deep learning techniques,
have been used to discover new COPD phenotypes in order to provide reliable guidance in diagnoses and
treatments10–15. However, these techniques are either labor intensive in image labeling, subjective in image labe-
ling, or difficult in interpretation of how the machine learning models make decisions.
In medicine, syndromes are sets of symptoms that often occur together and can be modeled as latent traits
(unobserved underlying disorders)16. It is hypothesized that there exist some latent traits behind the observed
imaging features (detected by human and/or artificial intelligence), which are able to explain the heterogenei-
ties of COPD. Therefore, in this study, we proposed an unsupervised three-dimensional (3D) convolutional
autoencoder (CAE) model integrated with a feature constructor (FC) as a classifier (a CAE-FC model) to identify
lung tissue pattern-clusters from one-dimensional (1D) representations (embeddings) of 3D regions of interests
(ROIs) extracted from CT images of former smokers. We then applied an exploratory factor analysis (EFA) to
explore the latent traits (factors) among these pattern-clusters and further assessed the capability of factors in
predicting or diagnosing major clinical characteristics of COPD patients. Furthermore, these factors could be
employed for unbiased sensitive subtyping of COPD progression without using human pre-defined features in
the future.
Results
A total of 541 former smokers and 59 healthy non-smokers (Stratum 1) from the SPIROMICS participants were
analyzed. The demographic data and PFT measures for each stratum are shown in Table 1.
Prediction of pulmonary function using factors. We first trained the CAE-FC model by increasing the
number of embeddings (which is the same as the number of pattern-clusters) from 16 to 112 with an increment
of 16. Then the optimal CAE-FC model was used to generate a pattern-cluster histogram for each subject and
EFA was employed to extract factors from all of the histograms (Fig. 1). Finally, a multivariable regression model
was developed to explore the relationship between the derived factor scores and associated PFT measures for
all the subjects. The optimal number of pattern-clusters was chosen based on its ability to predict pulmonary
Scientific Reports | (2021) 11:4916 | https://doi.org/10.1038/s41598-021-84547-5 2
Vol:.(1234567890)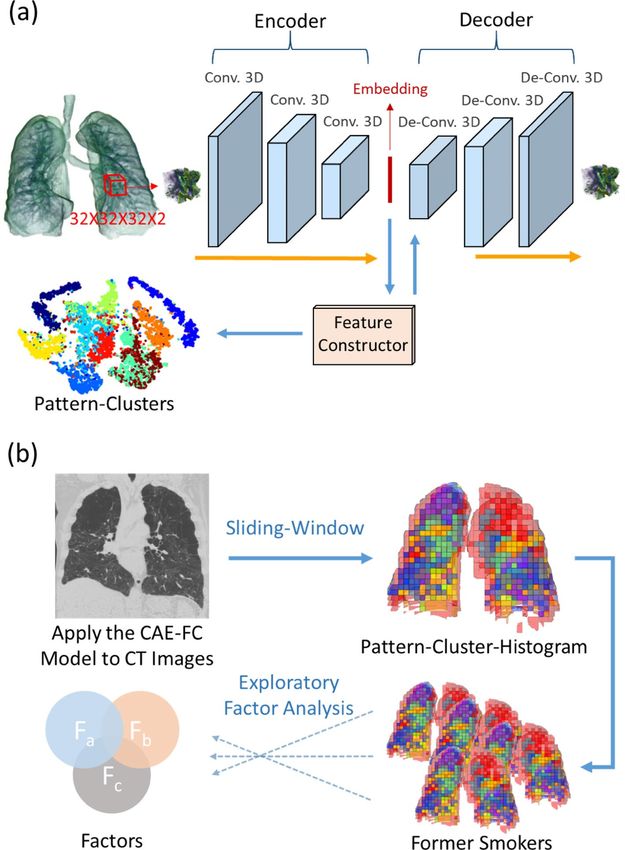
www.nature.com/scientificreports/
Figure 1. (a) 3D ROIs are randomly extracted from the 3D CT lung image and fed into the 3D convolutional
autoencoder (CAE) to learn the 1D representations (embedding) of the ROIs. A feature constructor (FC) uses
the embedding to generate pattern-clusters. (b) The CAE-FC model is applied to the ROIs extracted by the
sliding-window technique to classify lung tissue patterns and construct a pattern-cluster-histogram for each
subject. Exploratory factor analysis (EFA) is then used to extract the latent traits from the pattern-cluster-
histograms of the subjects.
function. We calculated the Akaike Information Criterion (AIC) values for different models set up by different
numbers of embeddings.
The optimal model consisted of 80 embeddings and seven factors (F0–F6), which yielded the lowest AICs for
both FEV1% predicted (− 476.02) and FEV1/FVC (− 590.98) (Table E3). The results demonstrated the capability
of factors in predicting pulmonary function. On the test dataset with 135 subjects, the coefficient of determina-
tion (R2) between the true values and predicted values at the baseline visit reached 0.66 and 0.71 for F EV1%
predicted and FEV1/FVC, respectively (Figure E4). To evaluate the effect of adding Jacobian as the second data
channel, another CAE-FC model with 80 pattern-clusters was trained using TLC ROIs with CT intensity only.
The 3-factors predictive models with the 80 pattern-clusters yielded AICs of − 417.69 and − 531.25 for F EV1%
predicted (R2 = 0.42) and FEV1/FVC (R2 = 0.50), respectively (Table E3 and Figure E4).
Welch’s ANOVA was used in comparing the mean factor scores among the seven factors. The results demon-
strated significant differences between healthy non-smokers and subjects with different severities classified by
Scientific Reports | (2021) 11:4916 | https://doi.org/10.1038/s41598-021-84547-5 3
Vol.:(0123456789)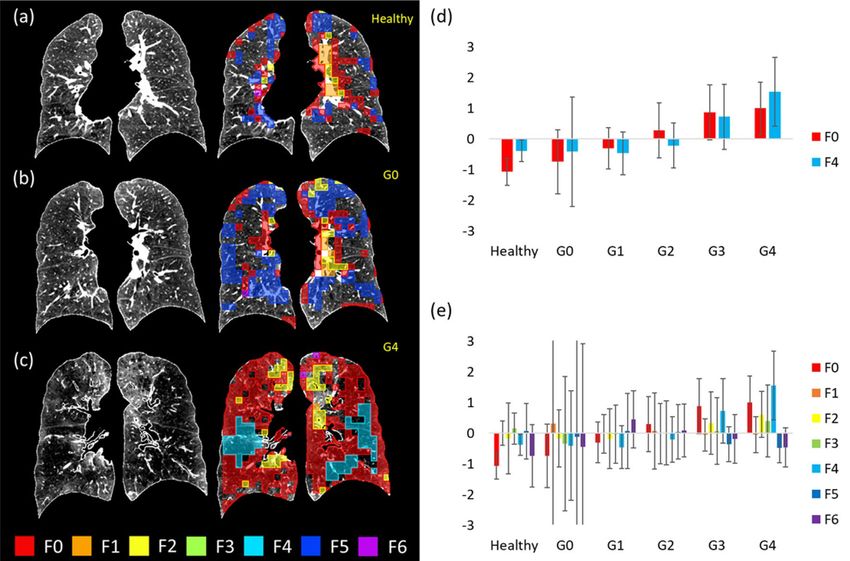
www.nature.com/scientificreports/
the criteria of Global Initiative for Chronic Obstructive Lung Disease (GOLD 0–4)17 for F0, F2, F4, F5, and F6
(Table E4). However, the post-hoc pairwise comparisons were conducted only on F0 and F4 since their effect sizes
were deemed to be a close-to-medium effect or a large effect by Cohen’s d criteria18,19 (Table E12). For F0, the only
pairwise comparison that did not demonstrate a significant difference was from the pair of GOLD 3 subjects and
GOLD 4 subjects (Table E5). As for F4, the comparison pairs that did not demonstrate significant differences were
from the pair of GOLD 0 subjects and healthy non-smokers, the pair of GOLD 0 subjects and GOLD 1 subjects,
the pair of GOLD 0 subjects and GOLD 2 subjects, the pair of GOLD 1 subjects and healthy non-smokers, the
pair of GOLD 1 subjects and GOLD 2 subjects, and the pair of GOLD 2 and healthy non-smokers (Table E6).
Comparison of predictabilities of factors, pattern‑clusters, and imaging‑based variables. Sev-
eral multivariable regression models were built to examine the relationships between the predictors (factors,
pattern-clusters, or imaging-based metrics) and the criterion variables ( FEV1% predicted and F
EV1/FVC). AIC
was used to assess the relative efficacy of the models. The results demonstrated that the multiple regression
models based on factors and imaging metrics had lower AICs than those of pattern-clusters. Furthermore, the
factor-based model (AIC = − 469.65) was a better predictor of F
EV1% predicted than the imaging-metric-based
model (AIC = − 462.73). On the other hand, the imaging-metric-based model (AIC = − 605.79) outperformed
the factor-model (AIC = − 588.12) in predicting FEV1/FVC.
Regression models based on F0, F4, Emph%8 (the percentage of Emph voxels on TLC image), and fSAD%8
(the percentage of fSAD voxels on TLC image) were then built with forward feature selection applied. F0, F4,
Emph%, and fSAD% were all preserved in the forward feature selection process. The combination models based
on F0, F4, Emph%, and fSAD% were the best models to predict F EV1% predicted (AIC = − 481.14) and F
EV1/
FVC (AIC = − 624.50). The R2 values, the AIC values, and the numbers of predictors chosen by the forward fea-
ture selection method for various models are shown in Figure E5. The predictors chosen by the forward feature
selection method for various models are listed in Table E7.
Comparison of averaged CT intensities and Jacobians for factors. Significant differences (p < 0.001)
between factors were found in both the averaged CT intensity and the averaged Jacobian of the ROIs belonging
to each factor by Welch’s ANOVA (Fig. 2). The pairwise Games–Howell post-hoc tests demonstrated that all
the pairs were significantly different except for the pair of F5 and F6 (Table E8). Generally, F0 and F4 had lower
intensities whereas F1 and F3 had relatively higher intensities. As for the Jacobian, F4 had the least deformation
whereas F5 and F6 had the largest deformation. Figure 2c displays the samples of pattern-clusters having large
contribution to the factors. Figure 3 shows representative subjects for each factor along with the color-coded
Jacobian values of the lungs.
Emphysema subtypes and airway variants. Experienced thoracic radiologists have carefully exam-
ined 1000 subjects in the SPIROMICS cohort and labeled them with three emphysema subtypes: centrilobular
emphysema (CLE), panlobular emphysema (PLE) and paraseptal emphysema (PSE). Within those subjects, 253
of them overlapped with the former smokers used in this study. Bi-serial correlation was used to test the cor-
relations between the factors and the emphysema subtypes (Fig. 4a). F4 was moderately correlated with PLE
(r = 0.34). F0 and F2 were weakly correlated with PLE (r = 0.13 and 0.17, respectively), whereas F5 and F6 were
negatively and weakly correlated with PLE. F0 was the only factor which had an association with CLE while F6
was the only factor which had an association with PSE.
The associations between the factors and the airway variants (central airway branch variation, a genetic risk
factor for COPD; Figure E3) are shown in Fig. 4b. The percentages of standard anatomy and airway variants can
be found in Table E9. F0 was weakly correlated with an accessory sub-superior branch in the right lower lobe
(RLL; r = 0.12), a left medial basal LB7 branch in the left lower lobe (LLL; r = 0.14), and an absent right medial-
basal RB7 branch (r = 0.088). F4 was also correlated with an accessory branch in the RLL (r = 0.16).
Correlations of factors with clinical data, imaging‑based variables, and medication use. The
correlation heat-map in Fig. 5 summarizes the correlations of seven factors with clinical data, imaging-based
variables, and medication use. Only variables with moderate–high significant correlations with the factors are
displayed in the heat-map. Significant and relevant variables for each factor are described below and more results
can be found in Table E10.
F0 was negatively correlated with F EV1 (r = − 0.48), FEV1/FVC (r = − 0.7), and FEV1% predicted (r = − 0.65).
However, it was not significantly correlated with FVC (r = − 0.048). Clinically, it showed moderate correlations
with the diagnosis of COPD (r = 0.36), the diagnosis of emphysema (r = 0.28), and the total number of exacerba-
tions (r = 0.26). As for imaging-based variables, it displayed strong correlations with Emph% (r = 0.54), fSAD%
(r = 0.69) and AirT% (the percentage of air-trapped voxels in a RV CT scan; r = 0.73), Tissue %, (the median
tissue fraction of the total lung; r = − 0.56), and AWV% (the airway tree to lung volume ratio; r = − 0.50) of the
total lung. F0 also had moderate correlations with RV/TLC (CT-measured RV to TLC volume ratio; r = 0.38), the
median Jacobian of the total lung (r = 0.49), and the median of a strain-based metric of the median anisotropic
deformation index (ADI) of the total lung (r = − 0.38). Lastly, it was correlated negatively with the use of albuterol
(r = − 0.32) and positively with the use of arformoterol (r = 0.29).
F1, F2, and F3 had few significant correlations with either of the PFT measures, clinical data, or medication
use. F1 was correlated only with the median tissue% (r = 0.36). F2 had a moderately negative correlation with
FEV1 (r = − 0.29), FEV1% predicted (r = − 0.25), and FVC (r = − 0.29). It was also correlated with the median Jaco-
bian of the total lung (r = − 0.55), the median ADI of the total lung (r = − 0.47), and RV/TLC (r = 0.50). Female
patients tended to have lower F3 (r = − 0.24).
Scientific Reports | (2021) 11:4916 | https://doi.org/10.1038/s41598-021-84547-5 4
Vol:.(1234567890)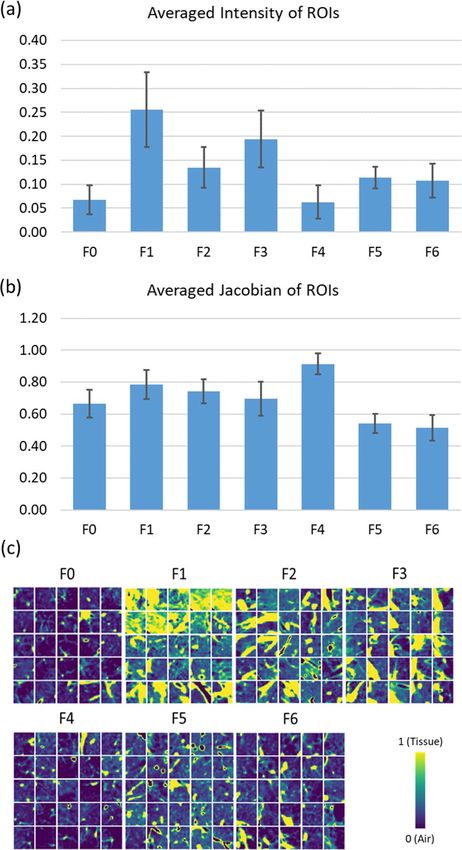
www.nature.com/scientificreports/
Figure 2. Bar charts showing (a) the averaged intensity of ROIs with large contribution to each factor and (b)
the averaged Jacobian of ROIs with large contribution to each factor. Significant differences (p < 0.001) between
factors were found in both the averaged intensity and the averaged Jacobian by Welch’s ANOVA. The pairwise
Games–Howell post-hoc tests showed that all the pairs were significantly different except for the pair of F5
and F6 that was not significantly different for either the averaged intensity (p = 0.718) or the averaged Jacobian
(p = 0.118). (c) Samples of the ROIs taken from the pattern-clusters with strong contribution to each factor.
F4 was negatively correlated with FEV1 (r = − 0.54), FVC (r = − 0.39), FEV1/FVC (r = − 0.48), and FEV1% pre-
dicted (r = − 0.54). Clinically, it had moderate correlations with the diagnosis of COPD (r = 0.26), the diagnosis of
emphysema (r = 0.28), the total number of exacerbations (r = 0.25), the CAT score (r = 0.31), and the 6-min walk
distance (r = − 0.41). As for imaging-based metrics, it was positively correlated with Emph% (r = 0.51), AirT%
(r = 0.56), fSAD% (r = 0.49), and the median Jacobian of the total lung (r = 0.67), and negatively correlated with
the median ADI of the total lung (r = − 0.49), and RV/TLC (r = − 0.75). In addition, it was correlated positively
with the use of albuterol and ipratropium bromide (r = 0.36).
F5 had a moderate correlation with F EV1/FVC (r = 0.32) and BMI (r = 0.27). It was negatively correlated with
Emph% (r = − 0.48), AirT% (r = − 0.43) and fSAD% (r = − 0.35), and positively correlated with median Tissue%
(r = 0.67) and AWV% (r = 0.27). Furthermore, it was negatively correlated with the use of albuterol and ipratro-
pium bromide (r = − 0.33).
F6 exhibited a moderate correlation with F EV1 (r = 0.34), FVC (r = 0.47), and RV/TLC (r = − 0.27). Female
patients tended to have lower F6 (r = − 0.35). Moreover, F6 was associated with increased airway diameter, wall
thickness, and airway wall area located in the LLL, left upper lobe (LUL), and right upper lobe (RUL).
Scientific Reports | (2021) 11:4916 | https://doi.org/10.1038/s41598-021-84547-5 5
Vol.:(0123456789)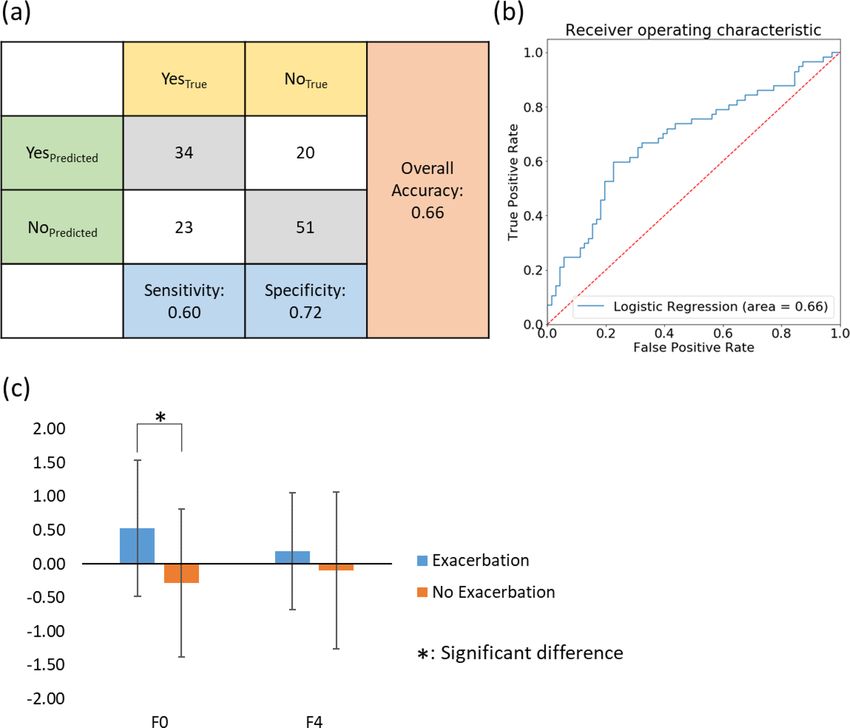
www.nature.com/scientificreports/
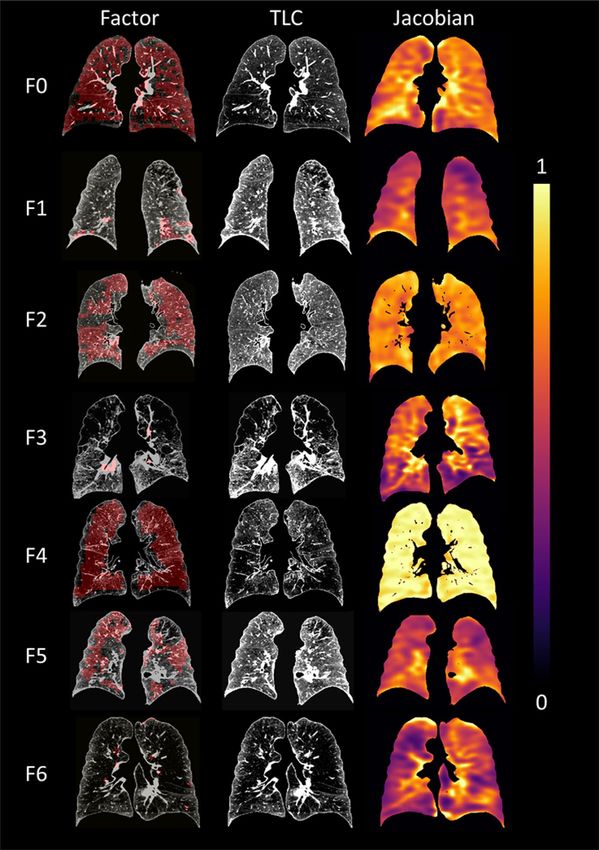
Figure 3. Factor-representative subjects (i.e. 99th percentile of the factor score among the subjects), shown in a
coronal view (posterior–anterior). The pattern-clusters with strong contribution to each factor, ranging from F0
to F6, are shaded with red on the images in the left column. TLC images with CT intensities are displayed in the
middle. Jacobian images are shown in the right column.
Factor‑coded ROIs and Factor‑based Histograms. Figure 6a–c compare the factor maps of a healthy
non-smoker, a GOLD 0 subject, and a GOLD 4 subject to illustrate the capability of factors in characterizing
local tissue patterns. Figure 6d shows the histogram of F0 and F4 for healthy non-smokers and COPD subjects.
F0 was able to differentiate healthy non-smokers and GOLD 0 patients as well as any pair of subjects at different
levels of COPD severity except for GOLD 3 subjects and GOLD 4 subjects, whereas F4 could differentiate GOLD
3 subjects and GOLD 4 subjects. Figure 6e displays the histogram of all seven factors, showing that GOLD 0
subjects had the largest variation among all subjects.
Scientific Reports | (2021) 11:4916 | https://doi.org/10.1038/s41598-021-84547-5 6
Vol:.(1234567890)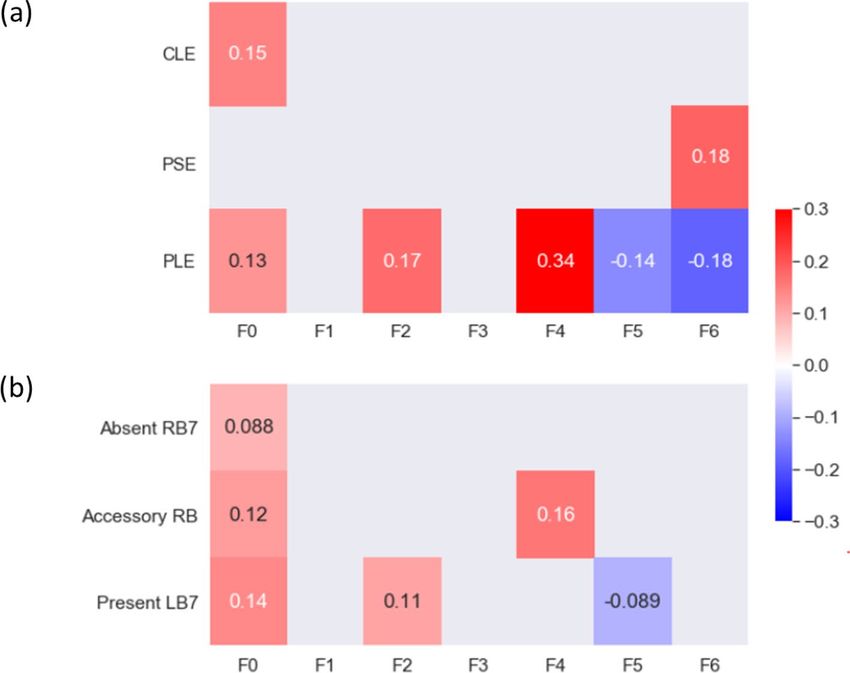
www.nature.com/scientificreports/
Figure 4. (a) The correlations between the factors and the emphysema subtypes. The subtypes are CLE, PLE,
and PSE. (b) The correlations between the factors and the airway variants. The three variants are: (1) absence of
a right medial-basal RB7 branch in RLL (Absent RB7), (2) presence of an accessory sub-superior RB branch in
the RLL (Accessory RB), and (3) presence of an accessory LB7 branch in the LLL (Present LB7; see Figure E3).
Only correlations with p value less than 0.05 are shown in the figure.
Discussion
Unsupervised machine learning of CT images has been applied to improve accuracy, efficiency, and reliability
of emphysema subtype detection, thus alleviating the workload of radiologists. These studies relied on human-
defined imaging filters or textons to extract features of images10–12. On the other hand, deep learning has the
capability to detect features from images without human intervention. Using four slices of CT images in different
directions as inputs, Gonzalez et al.15 trained a supervised convolutional neural network (CNN) deep learning
model to predict COPD disease stage, lung function, mortality and exacerbation. Humphries et al.13 proposed a
deep learning model with two-dimensional CNN and long short-term memory architectures (LSTM) combined
together to classify Fleischner grade of emphysema. Deep learning is an effective approach to train a model
for prediction, but the interpretability of the detected features is relatively low. The mechanism of how deep
learning models form decisions is not straightforward. This is due in large part to the problem of subjective or
incomprehensive imaging-based metrics and the difficulty to interpret deep learning-detected features. Singla
et al.14 proposed a 3D CAE with attention mechanism that aggregated local image features to a subject-level
representation for predicting COPD severity. The attention mechanism quantified the relevance of a region to
the disease and thus enhanced the interpretability of the results. However, the attention mechanism was only
allowed to provide interpretations associated with the severity and did not consider other features that may also
contribute to the disease’s variability.
To address the issues above, this study aimed to develop an unsupervised deep-learning CNN model, which
could identify latent traits (factors) from CT lung images of former smokers. Then, identified factors were corre-
lated with existing known criterion variables. We identified seven salient factors that contributed substantially to
the prediction of pulmonary functions and correlated significantly with the imaging-based and clinical variables,
showing the feasibility and usefulness of the proposed CAE-FC and EFA framework. The factors are derived
purely from CT images without human bias and could serve as features in subtyping of COPD progression in
the future.
Prediction of pulmonary function using factors. While models based on pattern-clusters, factors
and imaging-based metrics were all comparable in predicting pulmonary function measured by spirometry, the
number of predictors based on pattern-clusters was excessive compared to those of factors and imaging-based
metrics. Furthermore, the combination models based on F0, F4, Emph%, and fSAD% outperformed the imag-
ing-metric-based models. Given that F0, F4, Emph%, and fSAD% were all chosen by the forward feature selec-
tion method, the factors could explain additional variations of PFT measures besides those already explained by
Emph% and fSAD%.
Scientific Reports | (2021) 11:4916 | https://doi.org/10.1038/s41598-021-84547-5 7
Vol.:(0123456789)www.nature.com/scientificreports/
Figure 5. Correlations between each of the seven factors and related clinical data, imaging-based variables, and
use of drugs. Only correlations with p value less than 0.05 are shown in the figure.
Previous studies have used four slices in three different directions per CT image as an input to train a convo-
lutional deep learning model on 9983 smokers, which was able to achieve a strong coefficient of determination
(R2 = 0.54) between true FEV1 and predicted FEV115. The 3D CAE-FC model showed its prediction efficacy for
lung function (R2 = 0.57 for FEV1; R2 = 0.66 for FEV1% predicted). Moreover, we demonstrated that the addition
of Jacobian to the second channel of ROIs improved the explained variance by 23.9% and 20.7% for FEV1%
predicted and FEV1/FVC, respectively. With Jacobian, we were able to account for lung deformation without
explicitly learning using expiration images. While a network that learns directly from inspiration and expiration
images could be constructed, the voxel-to-voxel correspondence between them (local lung deformation infor-
mation) would be missing. As a result, the two important COPD phenotypes, PRM’s fSAD and Emph, would
be not accounted for in learning, rendering the network ineffective. Additionally, PRM’s fSAD and Emph are
two mutually exclusive voxel-wise scalar fields. The current CNN model does not rule out the possibility of new
phenotypes such as those potentially associated with mixed fSAD/Emph 3D topological patterns to assess COPD.
Since the model was trained on CT images of GOLD 0–4 subjects, the fact that F0 identified the healthy
control group as a distinct cohort from COPD patients not only validated our method, but also suggested the
potential of F0 as a surrogate marker in detecting local abnormalities in susceptible subjects progressing from
heathy to at risk. On the other hand, F4 was able to differentiate GOLD 3 subjects from GOLD 4 subjects,
Scientific Reports | (2021) 11:4916 | https://doi.org/10.1038/s41598-021-84547-5 8
Vol:.(1234567890)www.nature.com/scientificreports/
Figure 6. (a) The original TLC image (left) and the color-coded image (right) of a healthy non-smoker ( FEV1/
FVC = 79.02%, FEV1% predicted = 81.47%) whose factor scores of F0 and F4 are the closest to the means of the
healthy non-smoker cohort. (b) The original TLC image (left) and the color-coded image (right) of a GOLD 0
subject (FEV1/FVC = 56%, FEV1% predicted = 97.88%) whose factor scores of F0 and F4 are the closest to the
means of the GOLD 0 subjects. (c) The original TLC image (left) and the color-coded image (right) of a GOLD
4 subject (FEV1/FVC = 29.21%, FEV1% predicted = 20.05%) whose factor scores of F0 and F4 are the closest to
the means of the GOLD 4 subjects. The images are plotted in a posterior–anterior view. (d) The averaged factor
scores of F0 and F4 for the healthy non-smokers, and GOLD 0–GOLD 4 subjects. (e) The variations of the factor
scores for the GOLD 0 subjects are the largest among all subgroups, implying the heterogeneous nature of the
subjects at risk.
suggesting the potential of F4 as a surrogate marker in detecting the worsening of lung function (the rate of
functional decline) in severe COPD subjects. While a total of seven factors were identified, two of them, F0 and
F4, were sufficient to distinguish between the spirometric stages of COPD.
Correlations of factors with clinical data, imaging‑based variables and medication use. Female
patients were found to have negative correlations with the factor scores in F3 and F6. Studies have shown that
females may be more susceptible to developing COPD, probably because the airways of females are relatively
smaller than those of males at the same lung volume, leading to greater concentration of tobacco smoke per unit
area of small airway s urface20. Our results also demonstrated that female patients tended to have smaller factor
scores in F6 and they had smaller airways. Furthermore, F3 had a similar trend but not as strong as F6. This sug-
gested that sex might contribute to COPD tissue phenotypes.
Moreover, we speculated that F6 was related to bronchodilator responsiveness (BDR). It has been reported
that COPD patients with BDR had thicker airways on CT i mages21 and that FVC is more sensitive in BDR than
FEV1 for patients with severe airflow o bstruction22. These observations resemble our results that F6 was positively
related to larger airway dimensions (including airway diameter, airway wall thickness, and airway wall area)
and more correlated with FVC than F EV1. F6 also had some positive correlation with the use of short-acting
bronchodilator (nebulized albuterol) (Table E10), which can relieve air-trapping. Since BDR is associated with
a faster rate of lung function d ecline23, F6 may potentially serve as a surrogate marker of BDR to signify a risk
of lung function decline.
Our findings also indicated that the use of inhaled bronchodilator medications might be related to the iden-
tified factors. F0 was correlated negatively with the use of a short-acting β-agonist (nebulized albuterol) in last
3 months, and positively with the use of a longer-acting β-agonist (arformoterol) in last 3 months. Short-acting
β-agonists are used by patients with relatively few symptoms and low risk of COPD exacerbations in order to
reathlessness24. Long-acting bronchodilators are generally recommended for more severe p
relieve acute b atients24.
This would explain why F0 was positively related to the use of a long-acting bronchodilator. On the other hand,
F4 was positively correlated with albuterol combined with ipratropium bromide, suggesting that patients with
higher F4 might need combination bronchodilators to control their symptoms25. The findings coincided with
Scientific Reports | (2021) 11:4916 | https://doi.org/10.1038/s41598-021-84547-5 9
Vol.:(0123456789)www.nature.com/scientificreports/
F0 F4
Tissue % ↓*6
AWV % ↓*5
Long-acting Bronchodilator ↑*3
FEV1/FVC ↓*7 ↓*4
fSAD % ↑*7 ↑*4
FEV1% predicted ↓*7 ↓*5
COPD ↑*4 ↑*3
Emphysema % ↑*5 ↑*5
FEV1 ↓*5 ↓*5
CAT Score ↑*2 ↑*3
6 Min. Walk Distance ↓*2 ↓*4
Jacobian ↑*5 ↑*7
RV/TLC ↑*4 ↑*8
FVC ↓*4
Combination of more than one bronchodilator ↑*4
Table 2. Comparisons of the associations with known variables between F0 and F4. The numbers in the table
represent the strength of correlation with the factors. An increment of the number represent a 0.1 difference of
r.
the higher correlations of F4 with the CAT score and the total number of exacerbations. The refined 2020 GOLD
ABCD assessment tool comprises three steps: diagnosis (post-bronchodilator FEV1/FVC < 0.7), assessment of
airflow limitation (GOLD 1–4) and assessment of symptoms/risk of exacerbations (group A–D). F4 seems to
associate with GOLD 4, group D and recommended initial pharmacological treatment.
Interpretations of factors. Lower intensities of the ROIs were found in both F0 and F4, suggesting more
emphysema. F4 had greater Jacobian, suggesting less contractive lungs. While both F0 and F4 were highly corre-
lated with emphysema (↑) and air-trapping (↑), the characteristics of F0 were AWV% (↓), tissue% (↓), diagnosis
of COPD (↑), CLE (↑), and fSAD% (↑), and those of F4 were FVC (↓), six minute walk distance (↓), CAT score
(↑), PLE (↑), Jacobian (↑) and RV/TLC (↑) (Table 2), where ↑(or↓) denotes an increase (or decrease). Due to the
distinct characteristics between F0 and F4, it is speculated that they are two COPD subtypes which contribute
significantly to the impairment of pulmonary function.
F0 might be related to air-trapping due to small airway diseases because of its correlations with fSAD% (↑) and
AWV% (↓). From the perspective of pulmonary function, F0 represents the classic feature of COPD: FEV1/FVC
(↓) and F EV1% predicted (↓). It has been reported that functional small airway diseases and airway tree caliber
to lung size ratio (a host factor) are associated with rate of F EV1 decline and COPD r isk5,26. Additionally, F0 is
able to differentiate between healthy non-smokers and former smokers at risk of COPD. Thus, F0 is potentially
a latent trait that is associated with COPD risk and lung function decline.
As for F4, it is likely to capture air-trapping of a less contractive lung (Jacobian ↑) associated with decreased
diaphragm mobility because of its correlations with FVC (↓) and RV/TLC (↑). Diaphragm mobility has been
shown to have impact on dyspnea and exercise tolerance27, which explains why patients with greater F4 have
more symptoms (CAT score ↑) and shorter six minute walk distance (↓). Recent studies have suggested that FVC
is an important clinical marker which can differentiate clinical outcomes in COPD p opulations28,29, and RV/TLC
is a predictor of rate of lung function d ecline30. Therefore, F4 is potentially a latent trait that is associated with
symptoms and worsening of lung function.
According to the radiologists’ reading of emphysema subtypes, F0 was correlated with CLE, a subtype which
could lead to respiratory b ronchitis31, while F4 was correlated with PLE, a subtype which might cause a more
inflated lung32. Therefore, F0 and F4 may represent two phenotypes which are dominated by airway disease and
parenchymal disease, r espectively32. In 2015, the Fleischner classification has replaced the terms “panlobular
emphysema” with “confluent emphysema” and “advanced destructive emphysema (ADE)” for patients without
alpha-1 antitrypsin deficiency (A1AD)33. Since patients with A1AD are rare (1.53%) in the current dataset, two
experienced radiologists carefully reviewed the CT images of F0 and F4 from representative subjects (Fig. 3) and
characterized their emphysema patterns following the statement of the Fleischner Society33,34. The major pattern-
cluster masks of F0 were located relatively near central airways and might include vessels and small airways
(Figure E6). Overall, no advanced lung parenchymal destruction is observed in F0 masks. On the other hand,
the major pattern-cluster masks of F4 were found in peripheral lung regions and were more likely to include ves-
sels rather than small airways (Figure E6). Advanced parenchymal destructions were observed in these regions,
resembling the advanced emphysema patterns shown in the study by Lynch et al.34. That is, the patterns of F0
appear to be associated with airway diseases and early stages of emphysema. This is consistent with the observed
association of F0 with obstruction characteristics such as decreased F EV1%, FEV1/FVC, and AWV%. In contrast,
F4 appears to be associated with panlobular CT patterns for more advanced emphysema, being consistent with
the observed negative correlation between F4 and FVC. A previous study suggested that CLE is associated with
Scientific Reports | (2021) 11:4916 | https://doi.org/10.1038/s41598-021-84547-5 10
Vol:.(1234567890)www.nature.com/scientificreports/
Figure 7. (a) A confusion matrix of the logistic regression model fitted for the incident of exacerbation,
showing the numbers of correctly and wrongly predicted cases. (b) The ROC curve for the logistic regression
model. (c) Subjects who experienced exacerbation were significantly different than those who did not in terms
of F0.
worse small airways remodeling and narrowing, having a different inflammatory process from P LE35. Thus, the
radiologists’ reading confirmed that F0 and F4 could capture the major characteristics of different phenotypes.
Smith et al. reported that an accessory airway branch is associated with higher risks of COPD and bronchitis
and an absent right medial-basal airway is associated with higher risks of COPD and dyspnea36. Our result
demonstrated that airway variants were correlated with F0 and F4. This is particularly true for F0, which had a
weak but significant association with airway variants of Accessory RB, Present LB7, and Absent RB7. Overall, our
result suggested that the factors are able to detect the COPD susceptibility associated with genetically-determined
airway branch variation (a genetic risk factor).
A post hoc study. Due to the fact that F0 was able to differentiate healthy non-smokers from mild COPD
subjects and F4 was able to differentiate severe subjects from very severe subjects, we hypothesized that F0 and
F4 could serve as predictors for exacerbation. To test this hypothesis, we developed a logistic regression model
using F0 and F4 as the independent variables and the incident of exacerbation as the dependent variable. On the
test dataset, an overall accuracy of 0.66, a sensitivity of 0.60, and a specificity of 0.72 were achieved for the logistic
regression (Fig. 7a). The Receiver Operating Characteristic (ROC) curve with area under the curve (AUC) of
0.66 demonstrated the performance of the predictive model (Fig. 7b). In comparison, the AUC values of predic-
tive models for exacerbation outcomes developed in previous studies varied from 0.58 to 0.8137. However, those
models were trained based on pre-defined variables. This demonstrated the ability of our CAE-FC framework to
discover meaningful latent traits purely from images without subjective feature selection. In addition, we con-
ducted Welch’s ANOVA for comparison of subjects with and without exacerbation(s) in terms of F0 and F4. The
results showed a significant difference between subjects with exacerbation(s) and those without exacerbation on
F0 scores (Fig. 7c), suggesting that F0 is likely to be an indicator of lung function decline in early stages of COPD.
There are several limitations in this study. First, factors other than F0 and F4 would need further investiga-
tion since they might represent latent traits among COPD patients that have yet to be defined. For example, the
representative subject of F1 shows features of combined pulmonary fibrosis and emphysema (CPFE), which is
Scientific Reports | (2021) 11:4916 | https://doi.org/10.1038/s41598-021-84547-5 11
Vol.:(0123456789)www.nature.com/scientificreports/
characterized by upper-lobe emphysema and lower-lobe fibrosis (Figure E6). Second, this is a cross-sectional
study demonstrating the feasibility of the proposed CAE-FC and EFA framework. To confirm the relationship
of cause and effect between the factors and the clinical outcomes, a longitudinal study would be required.
In this study, a CAE-FC model which automatically constructs imaging features using full 3D CT images
was developed and seven factors were identified. The seven factors were significantly correlated with clinical
characteristics and imaging-based variables. Two of these factors were sufficient to identify healthy non-smokers
from all the subjects and differentiate COPD patients at all levels of spirometry-staged severity. Since these fac-
tors could detect abnormal tissue patterns, they could potentially serve as surrogate markers for new COPD
phenotypes in detecting early abnormalities in susceptible subjects at risk and in assessing rates of lung function
decline in severe patients. We hope that the recognition and interpretation of these phenotypes could eventu-
ally provide a guidance to personalized and effective care for COPD patients and improve their quality of life.
Methods
Ethics statement. All experiments were conducted according to relevant guidelines and regulations. The
study protocols were approved by the individual institutional review boards (IRBs) of all participating institu-
tions (Columbia University IRB 2, University of Iowa IRB-01, Johns Hopkins IRB-5, University of California Los
Angeles Medical IRB 1, University of Michigan IRBMED B1 Board, National Jewish Health IRB, University of
California San Francisco IRB Parnassus Panel, Temple University IRB A2, University of Alabama at Birmingham
IRB #2, University of Illinois IRB #3, University of Utah IRB Panel Review Board 5, Wake Forest University IRB
#5, and University of North Carolina at Chapel Hill Non-Biomedical IRB). All participants understood the pur-
pose of the study and provided informed consent before any research activities were performed.
Human subject data and image processing. A total of 541 former smokers and 59 healthy non-smok-
ers (Stratum 1) were randomly selected from the SPIROMICS participants for cross-sectional analysis (Table 1).
Stratum 2 represents former smokers with post-bronchodilator FEV1/FVC > 0.7, stratum 3 indicates those
smokers with post-bronchodilator F EV1/FVC < 0.7 and FEV1% predicted > 50%, and stratum 4 indicates those
smokers with FEV1/FVC < 0.7 and FEV1% predicted < 50%38. CT scans at both TLC and RV were acquired from
multiple imaging c enters39. All CT scans were obtained after the administration of a short-acting beta agonist
bronchodilator. The former smokers were randomly split into a training dataset (containing 406 subjects) and
a testing dataset (containing 135 subjects). Haghighi et al. addressed that smoking status is a confounding fac-
tor which may increase the CT density and cause the underestimation of fSAD% and Emph%8. Thus, this study
focused on former smokers with the healthy non-smokers as a contrast group.
We registered TLC and RV images by a mass-preserving symmetric registration method40,41 to calculate
the determinant of the Jacobian matrix for each voxel in TLC images to measure local volume change. The
Jacobian accounts for the deformation of the lung from TLC to RV and allows the deep learning model to learn
the expiration CT images implicitly. The Jacobian values were added as the second color channel of the TLC
images. As a result, all of the imaging-based functional variables, such as PRM’s metrics, are implicitly included
in the model input data. We next resampled the TLC images so that the spacing of voxels was 0.625 mm in each
direction and then rescaled the CT intensities with a range from a minimum value of zero (air) to a maximum
value of one (tissue) to account for the inter-site scanner d ifference42,43. The intensity of air was determined by
the median (50th percentile) intensity of the trachea, and the intensity of tissue was determined by the median
(50th percentile) intensity of the descending aorta. The same range of rescaled CT intensity as Jacobian in the
second data channel would also make the gradient-based optimization process more efficient and stable. In addi-
tion, the PRM’s metrics were calculated with rescaled CT intensity, also known as fraction-based measures as
opposed to density threshold-based m easures7,8,42. Subsequently, lung segmentations were performed to remove
the background and central airways (i.e. trachea, main bronchi) from the images. In total, 290,466 3D ROIs of
32 voxels in each direction (a total of 323 voxels per ROI) were randomly extracted from all the TLC images in
the training dataset. Use of random extraction instead of a sliding window approach was to prevent the model
from learning the sequence of sampling the ROIs. The size of the ROI was chosen to approximate the size of a
secondary lobule ( 203 mm3) since the secondary pulmonary lobule is a fundamental unit of lung s tructure44. The
lung and airway segmentations were processed by Apollo software (VIDA Diagnostics, Coralville, Iowa). All the
image processing was done using Insight Toolkit (ITK, version 5.0).
Convolutional autoencoder and feature constructor. Each voxel in the extracted ROIs consisted of
two input channels: rescaled CT intensity and Jacobian. The ROIs were fed into a 3D CAE-FC model to learn
their 1D representations. The 3D CAE-FC model contained an encoder, an embedding layer, a decoder and a
FC (Fig. 1a). The encoder consisted of 3D convolutional layers, which down-sampled a 3D ROI to its 1D repre-
sentation (embedding). The decoder consisted of 3D de-convolutional layers, which up-sampled the output of
the FC to the original ROI. The FC comprised the six layers (Figure E1), which input the embeddings from the
encoder and output the activation-regulated embeddings to the decoder. The role of the FC is to group the ROIs
with similar patterns and assign a cluster number to each ROI. The FC suppressed the small activations in the
embeddings and forced the decoder to reconstruct the ROIs using only important activations. That is, the ROIs
were grouped based on the greatest activations among the highest-level feature maps (embeddings). Thus, the
goal of training our 3D CAE-FC model is not only extracting 1D representations of the ROIs, but also group-
ing the 1D representations. To evaluate the efficacy of the FC to differentiate the pattern-clusters, we tested the
CAE-FC model with the MNIST dataset (Figure E2, and Table E1) and compared its performance with that of
k-means clustering technique (Table E2).
Scientific Reports | (2021) 11:4916 | https://doi.org/10.1038/s41598-021-84547-5 12
Vol:.(1234567890)www.nature.com/scientificreports/
After model training, a sliding window technique with overlapping of 16 voxels in each direction was applied
to extract ROIs, feed them to the model for cluster assignment, quantify the frequency of each pattern-cluster
within the whole lung and construct a pattern-cluster histogram for each subject (Fig. 1b). We further used
EFA45–47, a data-reduction technique, to extract factors from these pattern-clusters so that strongly correlated
pattern-clusters could be grouped together into the same factor due to a similar latent trait. The number of fac-
tors were determined by parallel analysis45, which selects as many factors as possible as long as its eigenvalue
is larger than that of random data. In addition, the optimal number of pattern-clusters was determined by the
accuracy of PFT measures by using the corresponding factors while preventing redundancy. The AIC was used
to select the most parsimonious model.
To demonstrate the usefulness of the factors identified, we tested their capability to predict F
EV1% predicted
and FEV1/FVC by constructing multivariable regression models, and compared them with those of pattern-
clusters and imaging-based v ariables7,8. We used four imaging-based metrics including Emph%8, fSAD%8, the
median Jacobian of the total lung, and ADI of the total lung48. These imaging-based variables were shown to asso-
ciate with pulmonary function decline in COPD p atients49. Moreover, to illustrate the importance and unique-
ness of the factors, multivariable regression models based on factors, Emph%, and fSAD% were built and their
ability in predicting pulmonary function was examined. The forward feature selection method was conducted
to determine the number of predictors needed to explain sufficient variation of dependent variables in a multi-
variable regression model. The F-test was used to test if R 2 changed significantly as the number of independent
variables increased . The process of feature selection would stop if the change of R2 was not significant (p > 0.05).
50
To show the distinctions of factor scores among subgroups of different spirometry-staged severities, the mean
factor scores between the healthy non-smokers and GOLD 0–4 subjects were compared using Welch’s ANOVA
and the Games–Howell method for post-hoc pairwise comparisons with the significance level (α) set at 0.05.
Exploratory factor analysis and factor interpretation. It is common to observe various forms of
imaging features, but they all may be closely associated with an underlying trait. For instance, emphysema sub-
types exhibit distinct texture features on CT images, but they are all associated with the latent trait of reduced
lung function. In this study, EFA was applied to reduce a large number of deep-learning-based observed vari-
ables (pattern-clusters) to a lower number of latent traits (factors), aiming to model the interrelationships among
pattern-clusters with factors. EFA consists of three steps: factor extraction, factor rotation, and factor Interpre-
tation. Detailed information of factor extraction and factor rotation are addressed in supplementary material.
Based on pattern matrix coefficients which reflect the unique contribution of the pattern-clusters to the fac-
tors, the CAE-derived pattern-clusters with high factor loadings (i.e. greater than 0.5) were selected for analysis.
The means and standard deviations of the averaged intensities and the averaged Jacobians of the ROIs belonging
to each factor were compared Welch’s ANOVA with the Games–Howell method for post-hoc pairwise tests.
In addition, to facilitate the interpretation of the identified factors, we aimed to look for those factors that are
closely related to the existing known variables, such as clinical variables, imaging-based variables, biomarkers,
and medication use, which have been selected and measured by SPIROMICS and Haghighi et al.7,8. In addition
to those known variables, AWV%26,51, RV/TLC30, and airway variants (Figure E3) were also extracted from CT
images for analysis. AWV% is a measure of dysanapsis and is inversely correlated with RV/TLC51. Dysanapsis is a
OPD26. Genetically-determined central airway variation,
risk factor for accelerated decline of lung function in C
which alters distal lung structure, is also a susceptibility factor for C OPD36. Pearson’s correlation and bi-serial
correlation were used to examine the associations of the identified factors with the continuous variables and
binary variables, respectively. The statistical analyses were conducted using SciPy 1.4.1 and Pingouin 0.3.4 in
Python 3 packages.
Ethics approval consent to participate. Ethics and consent were approved by SPIROMICS committee.
Consent for publication. The paper was approved by SPIROMICS Publications and Presentation Com-
mittee.
Received: 1 August 2020; Accepted: 15 February 2021
References
1. Xu, J., Murphy, S. L., Kochanek, K. D., Bastian, B. & Arias, E. National Vital Statistics Reports Volume 67, Number 5 July 26, 2018,
Deaths: Final Data for 2016. https://www.cdc.gov/ (2018).
2. Kochanek, K. D., Murphy, S. L., Xu, J. & Arias, E. National Vital Statistics Reports Volume 68, Number 9 June 24, 2019 Deaths: Final
Data for 2017. https://www.cdc.gov/nchs/products/index.htm (2019).
3. Agusti, A. et al. Characterisation of COPD heterogeneity in the ECLIPSE cohort. Respir. Res. 11, 122 (2010).
4. Galbán, C. J. et al. Computed tomography-based biomarker provides unique signature for diagnosis of COPD phenotypes and
disease progression. Nat. Med. 18, 1711–1715 (2012).
5. Bhatt, S. P. et al. Association between functional small airway disease and FEV1 decline in chronic obstructive pulmonary disease.
Am. J. Respir. Crit. Care Med. 194, 178–184 (2016).
6. Hoff, B. A. et al. CT-based local distribution metric improves characterization of COPD. Sci. Rep. 7, 1–12 (2017).
7. Haghighi, B. et al. Imaging-based clusters in current smokers of the COPD cohort associate with clinical characteristics: The
SubPopulations and Intermediate Outcome Measures in COPD Study (SPIROMICS) 11 Medical and Health Sciences 1102 Car-
diorespiratory Medicine and Haemato. Respir. Res. 19 (2018).
Scientific Reports | (2021) 11:4916 | https://doi.org/10.1038/s41598-021-84547-5 13
Vol.:(0123456789)www.nature.com/scientificreports/
8. Haghighi, B. et al. Imaging-based clusters in former smokers of the COPD cohort associate with clinical characteristics: The
SubPopulations and intermediate outcome measures in COPD study (SPIROMICS). Respir. Res. 20 (2019).
9. Wedzicha, J. A. The heterogeneity of chronic obstructive pulmonary disease. Thorax 55, 631–632 (2000).
10. Schabdach, J., Wells, W. M., Cho, M. & Batmanghelich, K. N. A Likelihood-free approach for characterizing heterogeneous dis-
eases in large-scale studies. in International Conference on Information Processing in Medical Imaging 170–183 (2017). https://doi.
org/10.1007/978-3-319-59050-9_14.
11. Yang, J. et al. Explaining radiological emphysema subtypes with unsupervised texture prototypes: MESA COPD study. in Lecture
Notes in Computer Science (including subseries Lecture Notes in Artificial Intelligence and Lecture Notes in Bioinformatics) vol. 10081
LNCS, 69–80 (Springer, 2017).
12. Yang, J. et al. Unsupervised discovery of spatially-informed lung texture patterns for pulmonary emphysema: The MESA COPD
study. in Lecture Notes in Computer Science (including subseries Lecture Notes in Artificial Intelligence and Lecture Notes in Bioin-
formatics) vol. 10433 LNCS, 116–124 (Springer, 2017).
13. Humphries, S. M. et al. Deep learning enables automatic classification of emphysema pattern at CT. Radiology https://doi.
org/10.1148/radiol.2019191022 (2019).
14. Singla, S. et al. Subject2Vec: Generative-discriminative approach from a set of image patches to a vector. in Lecture Notes in
Computer Science (including subseries Lecture Notes in Artificial Intelligence and Lecture Notes in Bioinformatics) vol. 11070 LNCS,
502–510 (Springer, 2018).
15. Gonzalez, G. et al. Disease staging and prognosis in smokers using deep learning in chest computed tomography. Am. J. Respir.
Crit. Care Med. 197, 193–203 (2018).
16. The National Academies of Sciences, Engineering, Medicine. Chronic multisymptom illness in Gulf War Veterans (2014). https://
doi.org/10.17226/18623.
17. Global Initiative for Chronic Obstructive Lung Disease. Pocket guide to COPD diagnosis, management and prevention: A guide
for health care professionals. Glob. Initiat. Chron. Obstr. Lung Dis. Inc. https://doi.org/10.1164/rccm.201701-0218PP (2018).
18. Cohen, J. A power primer. Psychol. Bull. 112, 155–159 (1992).
19. Cohen, J. Statistical Power Analysis for the Behavioral Sciences (Academic Press, London, 2013).
20. Barnes, P. J. Sex differences in chronic obstructive pulmonary disease mechanisms. Am. J. Respir. Crit. Care Med. 193, 813–814
(2016).
21. Kim, V. et al. Airway wall thickness is increased in COPD patients with bronchodilator responsiveness. Respir. Res. 15, 84 (2014).
22. Quanjer, P. H. et al. Bronchodilator response in FVC is larger and more relevant than in FEV1 in severe airflow obstruction. Chest
151, 1088–1098 (2017).
23. Vestbo, J. et al. Changes in forced expiratory volume in 1 second over time in COPD. N. Engl. J. Med. 365, 1184–1192 (2011).
24. Tashkin, D. P. A review of nebulized drug delivery in COPD. Int. J. COPD 11, 2585–2596 (2016).
25. Ikeda, A., Nishimura, K., Koyama, H. & Izumi, T. Bronchodilating effects of combined therapy with clinical dosages of ipratropium
bromide and salbutamol for stable COPD: Comparison with ipratropium bromide alone. Chest 107, 401–405 (1995).
26. Smith, B. M. et al. Association of dysanapsis with chronic obstructive pulmonary disease among older adults. JAMA J. Am. Med.
Assoc. 323, 2268–2280 (2020).
27. Paulin, E. et al. Influence of diaphragmatic mobility on exercise tolerance and dyspnea in patients with COPD. Respir. Med. 101,
2113–2118 (2007).
28. Tai Joon, A., Wan, S., Chan Kwon, P. & Hyoung Kyu, Y. The better explanation of COPD: The clinical role of FVC grouping. Eur.
Respir. J. 54, PA2640 (2019).
29. Whittaker, H., Pimenta, J., Kiddle, S. & Quint, J. Rate of FVC decline in a primary care UK chronic obstructive pulmonary disease
(COPD) population. Eur. Respir. J. 54, OA1588 (2019).
30. Arjomandi, M. et al. Radiographic lung volumes predict progression to COPD in smokers with preserved spirometry in SPIRO-
MICS. Eur. Respir. J. 54, 1802214 (2019).
31. MacNee, W. & Murchison, J. T. Small airway disease or emphysema: Which is more important in lung function and FEV1 decline?
An old story with a new twist. Am. J. Respir. Crit. Care Med. 194, 129–130 (2016).
32. Takahashi, M. et al. Imaging of pulmonary emphysema: A pictorial review. Int. J. COPD 3, 193–204 (2008).
33. Lynch, D. A. et al. CT-definable subtypes of chronic obstructive pulmonary disease: A statement of the Fleischner Society1. Radiol-
ogy 277, 192–205 (2015).
34. Jennermann, T. et al. CT-based visual classification of emphysema: Association with mortality in the COPDGene study. Radiology
288, 859–866 (2018).
35. Ballarin, A. et al. Mast cell infiltration discriminates between histopathological phenotypes of chronic obstructive pulmonary
disease. Am. J. Respir. Crit. Care Med. 186, 233–239 (2012).
36. Smith, B. M. et al. Human airway branch variation and chronic obstructive pulmonary disease. Proc. Natl. Acad. Sci. U.S.A. 115,
E974–E981 (2018).
37. Guerra, B., Gaveikaite, V., Bianchi, C. & Puhan, M. A. Prediction models for exacerbations in patients with COPD. Eur. Respir.
Rev. 26, 160061 (2017).
38. Couper, D. et al. Design of the subpopulations and intermediate outcomes in COPD study (SPIROMICS). Thorax 69, 491–494
(2014).
39. Sieren, J. P. et al. SPIROMICS protocol for multicenter quantitative computed tomography to phenotype the lungs. Am. J. Respir.
Crit. Care Med. 194, 794–806 (2016).
40. Haghighi, B. D., Ellingwood, N., Yin, Y., Hoffman, E. A. & Lin, C. L. A GPU-based symmetric non-rigid image registration method
in human lung. Med. Biol. Eng. Comput. 56, 355–371 (2018).
41. Yin, Y., Hoffman, E. A. & Lin, C. L. Mass preserving nonrigid registration of CT lung images using cubic B-spline. Med. Phys. 36,
4213–4222 (2009).
42. Choi, S., Hoffman, E. A., Wenzel, S. E., Castro, M. & Lin, C. L. Improved CT-based estimate of pulmonary gas trapping accounting
for scanner and lung-volume variations in a multicenter asthmatic study. J. Appl. Physiol. 117, 593–603 (2014).
43. Kim, S. S. et al. Improved correlation between CT emphysema quantification and pulmonary function test by density correction
of volumetric CT data based on air and aortic density. Eur. J. Radiol. 83, 57–63 (2014).
44. Webb, W. R. Thin-section CT of the secondary pulmonary lobule: Anatomy and the image. Radiology 239, 322–338 (2006).
45. Horn, J. Factors in factor analysis. Psychometrika 30, 179–185 (1965).
46. Marsh, S. et al. Physiological associations of computerized tomography lung density: A factor analysis. Int. J. Chron. Obstruct.
Pulmon. Dis. 1, 181–187 (2006).
47. Costello, A. B. & Osborne, J. W. Best practices in exploratory factor analysis: Four recommendations for getting the most from
your analysis. Pract. Assess. Res. Eval. 10, 1–9 (2005).
48. Jahani, N. et al. Assessment of regional ventilation and deformation using 4D-CT imaging for healthy human lungs during tidal
breathing. J. Appl. Physiol. 119, 1064–1074 (2015).
49. Ostridge, K. et al. Relationship between pulmonary matrix metalloproteinases and quantitative CT markers of small airways disease
and emphysema in COPD. Thorax 71, 126–132 (2016).
50. Pope, P. T. & Webster, J. T. The use of an F-statistic in stepwise regression procedures. Technometrics 14, 327 (1972).
Scientific Reports | (2021) 11:4916 | https://doi.org/10.1038/s41598-021-84547-5 14
Vol:.(1234567890)You can also read