Explaining deep neural networks for knowledge discovery in electrocardiogram analysis
←
→
Page content transcription
If your browser does not render page correctly, please read the page content below
www.nature.com/scientificreports
OPEN Explaining deep neural networks
for knowledge discovery
in electrocardiogram analysis
Steven A. Hicks1,2,7*, Jonas L. Isaksen3,7, Vajira Thambawita1,2, Jonas Ghouse3,
Gustav Ahlberg3, Allan Linneberg3, Niels Grarup3,4, Inga Strümke1, Christina Ellervik3,
Morten Salling Olesen3, Torben Hansen3,4, Claus Graff5, Niels‑Henrik Holstein‑Rathlou3,
Pål Halvorsen1,2, Mary M. Maleckar6, Michael A. Riegler1,7 & Jørgen K. Kanters3,7
Deep learning-based tools may annotate and interpret medical data more quickly, consistently, and
accurately than medical doctors. However, as medical doctors are ultimately responsible for clinical
decision-making, any deep learning-based prediction should be accompanied by an explanation that
a human can understand. We present an approach called electrocardiogram gradient class activation
map (ECGradCAM), which is used to generate attention maps and explain the reasoning behind deep
learning-based decision-making in ECG analysis. Attention maps may be used in the clinic to aid
diagnosis, discover new medical knowledge, and identify novel features and characteristics of medical
tests. In this paper, we showcase how ECGradCAM attention maps can unmask how a novel deep
learning model measures both amplitudes and intervals in 12-lead electrocardiograms, and we show
an example of how attention maps may be used to develop novel ECG features.
Deep learning methods have the potential to become essential tools for diagnosis and analysis in medicine.
Automatic analysis of electrocardiograms (ECGs) is a field with a long history and many different a pproaches1–5,
but recent years have shown that deep learning works better than traditional m ethods6. However, this family of
machine learning algorithms may also bring much uncertainty and confusion among the medical practitioners
they aim to help because of lacking understanding of how these algorithms work. Despite the impressive results
in areas like radiology7, dermatology8, and cardiology9–11, deep neural networks are often criticized for being
difficult to explain and for providing little to no insight into why they produce a given result (the so-called "black-
box phenomenon")12. Since doctors are accountable for their diagnoses, a black-box approach is unacceptable13,14.
History has shown that doctors in practice prefer simpler, although inferior algorithms to their neural net-
work-based counterparts, primarily because the simple algorithms are more interpretable15. Lack of insight has
in some cases of machine learning led to obvious mistakes, which has been overlooked because the black-box
decision did not allow for interpretation of the neural network p redictions16,17. A classic example comes from
deep learning in radiology (X-ray of the thorax), where the neural networks effectively distinguished between
lung cancer and pneumonia simply by predicting the referring department from various labels in the image and
not the relevant parts of the X-ray images. When the network is presented with X-rays without similar depart-
ment labels, the network fails to distinguish between lung cancer and p neumonia7. This study is a good example
of a mistake rooted in the differences between training and test data distribution. The neural network learned
data-specific features that did not generalize to data from outside its domain. This simple but grave mistake
could have easily been discovered with an explanation of the predictions where one could easily have observed
what the network recognized as the most important feature for its predictions. Hence, it is clear that we need
to understand the decisions of the neural network. In this respect, recent developments in explainable artificial
intelligence (AI) have shown progress in shedding light on these black-boxes, which seems imperative if deep
learning is to be implemented in clinics18. Generally, explanations are produced for image data and classification.
In this work, we present a method that can obtain explanations for classification and prediction/regression tasks
on non-image data. Specifically, we look at ECG where AI has become an emerging topic, where interpretable and
explainable results of both classification and prediction will be crucial for clinical implementation and research.
1
SimulaMet, 0167 Oslo, Norway. 2Oslo Metropolitan University, 0167 Oslo, Norway. 3University of Copenhagen,
2200 Copenhagen N, Denmark. 4Novo Nordisk Foundation Center for Basic Metabolic Research, 2200 Copenhagen
N, Denmark. 5Aalborg University, 9220 Aalborg Ø, Denmark. 6Simula Research Laboratory, 1364 Fornebu,
Norway. 7These authors contributed equally: Steven A. Hicks, Jonas L. Isaksen, Michael A. Riegler, and Jørgen
K. Kanters. *email: steven@simula.no
Scientific Reports | (2021) 11:10949 | https://doi.org/10.1038/s41598-021-90285-5 1
Vol.:(0123456789)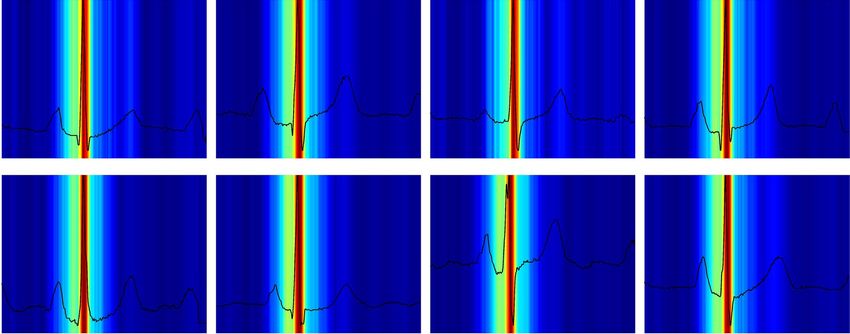
www.nature.com/scientificreports/
Figure 1. An annotated ECG representative beat and rhythm strip (top-right inset) with intervals (PR, QRS,
QT) and amplitudes (R peak, STJ, T peak). Amplitudes are measured with respect to the baseline. STJ denotes
J-point elevation. Heart rate is calculated as HR = 60,000/RR where RR is measured in ms.
In the field of electrocardiography, a 12-lead ECG is a recording of the electrical activity of the heart using ten
electrodes placed on the patient’s thorax and limbs. The ECG consists of a set of voltage time-series, with several
characteristic waves (see Fig. 1), which each carry clinical information about the state of the heart. The timing
and the amplitude of these waves contain essential information associated with morbidity and m ortality19–22. The
ECG is one of the cheapest and most commonly used medical procedures, and the availability of large training
data sets makes the ECG well-suited for neural network analysis. While automated analysis of ECGs has been
a topic of research since the early 1960s23, recently, we have seen an introduction of machine learning in ECG
analysis. Deep learning has shown to be successful in using features that may indicate cardiac arrhythmias or
other diseases10.
Incorporating explainability into medical decision-making has three potential advantages. First, for imple-
menting deep learning in the clinic, where medical decisions may be a matter of life and death, a deep learning
algorithm that explains how it arrived at a particular decision allows the prevention of rare but potentially fatal
mistakes. Such mistakes may be the result of shortcomings in the training of the algorithm (such as biased or
narrow training data) or noisy or faulty input data leading to unexpected and extreme decisions. Explainability
thus provides a higher level of trust and transparency in the clinical setting because a doctor can understand
what the algorithm bases its predictions on24,25. This may pave the way for the implementation of neural networks
in clinical practice and reduce human error, resulting in fewer fatalities. Second, more explainable models may
allow for the identification of novel features that may lead to a new understanding of the disease pathophysiology
and increased diagnostic capability, which in the end may save lives. Suppose a deep learning algorithm success-
fully predicts sudden cardiac death using ECGs from a given population. If the algorithm can explain where the
information is located in the ECG, we may combine medical knowledge of the ECG with that location making
it possible to identify novel mechanisms of sudden cardiac death. This would potentially make it possible to
identify an intervention or possible drug target to prevent untimely death. Third, making the algorithms more
interpretable may be important from a legal perspective because one would be able to explain why a model made
an incorrect decision and place responsibility accordingly.
The work presented in this paper has three primary contributions. First, we present the architecture of a
residual convoluted neural network (CNN) and show that it is able to quantify intervals and amplitudes in the
ECG more accurately than trained cardiologists are. Second, we present a modified version of the G radCAM26
algorithm called electrocardiogram gradient class activation map (ECGradCAM) and show how the resulting
attention maps can be utilized for ECG analysis to understand, interpret, and learn from neural network predic-
tions. Third, we show how network and attention maps may be combined to identify novel features in the ECG
by identifying a novel feature to determine the sex of a person based on an ECG.
Results
Automatic ECG analysis and data description. We define two case studies for model evaluation: a
regression study, measuring standard, clinically relevant intervals and amplitudes from the ECG, and a classifica-
tion study to predict the sex from the ECG. Numerous cardiovascular diseases are diagnosed by measuring key
intervals and amplitudes present in the ECG27,28, and we leverage this to predict these intervals directly instead
of categorizing ECGs into normal and abnormal groups. The predicted intervals and amplitudes include the PR
interval, QRS duration, heart rate, J-point elevation, QT interval, R-wave amplitude, and T-wave amplitude (see
Scientific Reports | (2021) 11:10949 | https://doi.org/10.1038/s41598-021-90285-5 2
Vol:.(1234567890)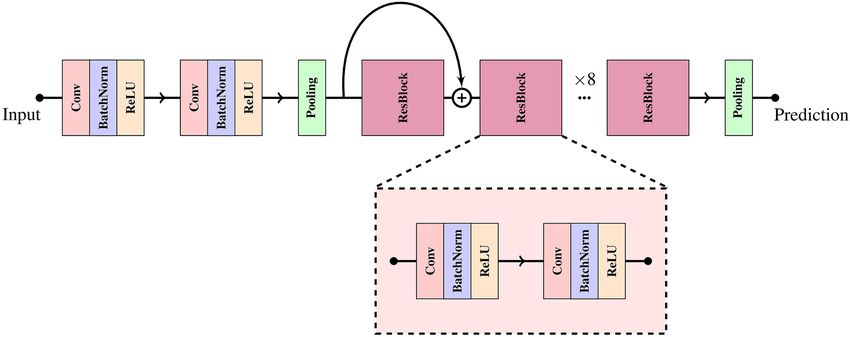
www.nature.com/scientificreports/
Variable GESUS (training) Inter99 (replication)
Number of samples (n) 8939 6667
Age (years) 56.6 [35.1; 78.4] 45.3 [34.5; 60.0]
Female sex 54.3% (4852) 51.2% (3412)
BMI (kg/m2) 26.1 [20.4; 35.3] 25.7 [20.2; 34.8]
Heart rate (bpm) 64 [48; 85] 66 [51; 86]
QT interval (ms) 408 [364; 460] 402 [362; 450]
PR interval (ms) 158 [126; 204] 156 [124; 196]
QRS duration (ms) 92 [76; 118] 90 [76; 110]
J-point elevation V5 (µV) − 5 [− 54; 48] 4 [− 35; 58]
R-peak amplitude V5 (µV) 1376 [698; 2,426] 1171 [600; 2,044]
T-wave amplitude V5 (µV) 346 [122; 698] 327 [122; 649]
Bundle branch block (QRS ≥ 120 ms) 4.4% (390) 1.6% (107)
1° AV block (PR > 220 ms) 2.0% (174) 0.9% (61)
Table 1. Characteristics of the participants in both population studies. Values are presented as median [fifth to
ninety-fifth percentiles] for continuous measures and % (n) for categorical variables.
Validation on GESUS Zero R on
(fivefold) Replication on Inter99 Inter99
Type Variables MAE RMSE MAE RMSE MAE RMSE
QT Interval (ms) 3.26 ± 0.80 5.08 ± 0.40 3.13 ± 0.19 4.89 ± 0.19 21.7 27.4
PR Interval (ms) 2.82 ± 0.15 4.52 ± 0.49 2.73 ± 0.06 4.70 ± 0.23 17.6 22.8
QRS duration (ms) 2.98 ± 0.15 4.10 ± 0.22 2.58 ± 0.07 3.43 ± 0.07 9.0 11.6
Median Heart Rate (beats per min) 1.54 ± 0.07 2.44 ± 0.09 1.57 ± 0.06 2.33 ± 0.07 8.6 11.1
J-point elevation (µV) 8.16 ± 0.40 11.20 ± 0.69 5.77 ± 0.10 8.09 ± 0.12 22.2 29.0
T-wave amplitude (µV) 5.63 ± 1.31 15.2 ± 6.83 5.80 ± 1.13 16.10 ± 0.53 129.0 167.0
R-peak amplitude (µV) 8.60 ± 1.05 16.00 ± 4.13 8.30 ± 0.98 21.70 ± 0.71 413.0 501.0
QT Interval (ms) 3.97 ± 0.03 6.05 ± 0.39 3.62 ± 0.03 5.82 ± 0.20 21.7 27.4
PR Interval (ms) 3.67 ± 0.21 5.60 ± 0.60 3.58 ± 0.60 5.80 ± 0.31 17.6 22.8
QRS duration (ms) 3.08 ± 0.12 4.33 ± 0.17 3.39 ± 0.06 4.49 ± 0.07 9.0 11.6
Rhythm Heart Rate (beats per min) 0.31 ± 0.01 0.40 ± 0.02 0.18 ± 0.01 0.6 ± 0.1 8.6 11.1
J-point elevation (µV) 10.50 ± 0.31 14.10 ± 0.50 7.90 ± 0.19 10.70 ± 0.24 22.2 29.0
T-wave amplitude (µV) 11.50 ± 0.43 25.00 ± 5.55 9.40 ± 0.41 19.40 ± 1.79 129.0 167.0
R-peak amplitude (µV) 20.10 ± 0.70 33.00 ± 4.54 17.4 ± 0.55 51.00 ± 13.21 413.0 501.0
Table 2. Training and validation error in GESUS25 and replication error in Inter992.
Fig. 1). By predicting these measurements directly, we allow for better interpretation of the results rather than
limiting it to a predefined set of categories. The second case study looks at differentiating between male and
female ECGs. This use case is motivated by the difficulty for humans to determine sex based on ECGs alone,
making it a good candidate for visualization as one may find certain features that correlate to sex that have previ-
ously gone unfound.
All models are trained and evaluated on either raw 10-s 12-lead ECGs or on the 12SL-generated median
beat from the GESUS dataset29. The performance of all GESUS generated models is replicated in the Inter99
dataset30. The demographics of the study populations are summarized in Table 1. To evaluate the effect of ECG
abnormalities on the prediction performance of our network, we tested the prediction errors on subgroups
with bundle branch blocks (QRS ≥ 120 ms) or first-degree AV block (PR > 220 ms). Furthermore, to study the
performance on ECG with strange, abnormal T waves, we used the existing T-wave Morphology Combination
Score31 to divide the ECGs into four different groups ranging from peaked to flattened T-waves. Supplementary
Table S1 shows that the network performed only slightly worse in subjects with bundle branch block, AV block,
and flattened T waves, respectively.
CNN results. The performance of our method for predicting ECG intervals and amplitudes is evaluated
using quantitative regression metrics, as seen in Table 2. The primary metrics used for evaluation are the mean
absolute error (MAE) as it is easily interpretable, and the root-mean-squared error (RMSE) as it is more sensitive
to outliers. In Table 2, we see that every model beats the ZeroR-estimate (predicting the mean) by a large margin.
This shows that the proposed architecture successfully analyzes the ECG, both in the voltage and time domains.
For interval measurements, the MAEs are close to two samples (4 ms) for both the median beat and rhythm strip
Scientific Reports | (2021) 11:10949 | https://doi.org/10.1038/s41598-021-90285-5 3
Vol.:(0123456789)www.nature.com/scientificreports/
Figure 2. The convolutional neural network-based architecture used for all experiments. Each red block
corresponds to a convolutional layer, the blue blocks represent a batch normalization layer, the yellow blocks are
ReLU activations, and the green block represents average pooling. Besides these base building blocks, the model
consists of eight residual modules (purple blocks) composed of two sequential blocks of convolution, batch
normalization, and ReLU activation.
(10 s) measurements. Amplitude measurements varied similarly (the least significant bit is 4.88 µV), indicating
that the network performed equally well with voltage and time-domain measurements.
Attention maps. To create meaningful and detailed visualizations, we modified the GradCAM approach so
that visualizations are generated for each lead of the ECG, where the final attention maps are produced by aver-
aging the importance values across all leads. We call this method ECGradCAM since it can give a more accurate
representation of what regions of the ECG are most important for the model. We focus our interpretation on
the last layer of the last residual module of the neural network (as shown in Fig. 2). This corresponds to the final
layer before prediction, meaning the visualizations show what areas of the ECG are deemed most important at
the moment of prediction. It can also be useful to interpret the intermediate layers of a n etwork32 as these layers
may offer insight into how the network’s perception changes and how it narrows down the analysis to the final
result (see Supplementary Figure S1). Here, we note that the initial residual block recognizes several features
in the ECG, which becomes more and more focused on the relevant wave as the ECG progresses through the
residual layers.
The attention maps often highlight the areas we expect when predicting a specific interval or amplitude.
Figure 3 presents a median ECG visualized for six of the predicted variables. For instance, the QRS complex is
highlighted when we predict QRS duration, and the end of the T-wave is delineated along with the beginning of
the QRS complex for QT interval measurement. For amplitude measurements, the corresponding wave top is
correctly pinpointed by the attention maps. One should note that for amplitude measurements, other parts of the
ECG are given minor importance, likely for the network to learn about the ECG voltage baseline. For intervals,
secondary activations are also observed, such as the T-wave being highlighted when measuring the PR-interval.
We hypothesize that these secondary activations may be happening because the network needs to appreciate the
whole ECG in order to narrow its search down and perform the actual measurements. This is further supported
by the PR interval attention maps generated for the intermediate layers (see Supplementary Figure S1), where
the network highlights the QT in the former layers but less so at the moment of prediction.
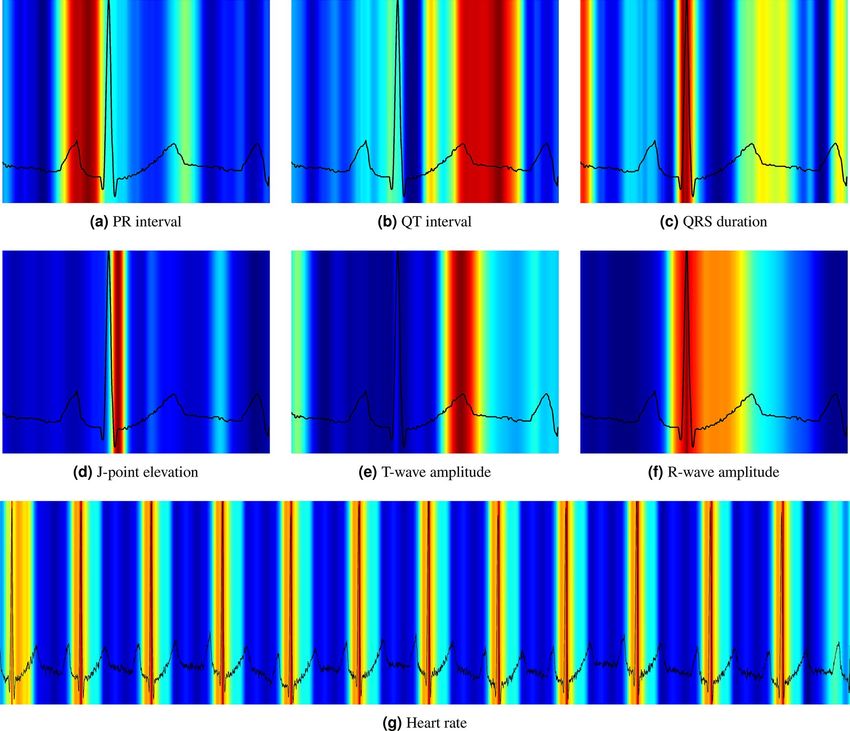
Sex prediction. For a cardiologist, the task of determining a subject’s sex from the ECG is nearly impos-
sible. However, our network is able to correctly identify the sex with an accuracy of 89% (Table 3). Here, we can
see the potential of attention maps, as the accuracy output from the network does not give any clue or insight
into how the network made its decision on sex classification. The attention maps (see Fig. 4) clearly show that
the ECG sex classification is mainly based on the QRS complex and more specifically on the downslope of the
R-wave, offering new insight into electrophysiology. Using findings from the attention maps, we did a post-hoc
analysis with logistic regression predicting sex using QRS duration, R- and S-amplitudes, and the timing of the
R- and S-waves. It revealed an accuracy of 73% (our CNN: 89% QRS duration alone: 69%) and an AUC of 0.80
(our CNN 0.96 QRS duration alone: 0.72). The wave blocking experiments (Table 3) verified this observation,
since removing the P-wave has almost no influence on the accuracy of the sex prediction, removing the T-wave
had only minor influence, whereas removing the QRS complex resulted in a drastic reduction in performance.
This shows that one can obtain new knowledge by using our ECGradCam method combined with the deep
neural network.
Human cardiologist vs neural network evaluation. To assess how the neural network compares to
standard clinical decision making, we further evaluate the performance of our model by comparing its predic-
tions to predictions made by cardiologists who have manually annotated a set of twenty randomly selected ECGs
Scientific Reports | (2021) 11:10949 | https://doi.org/10.1038/s41598-021-90285-5 4
Vol:.(1234567890)www.nature.com/scientificreports/
Figure 3. Visualization of the attention maps generated for the interval and amplitude prediction models. As
we can see from the plots, the model learns to inspect the waves and intervals that are related to the predicted
variable. Red color indicates high importance and blue color low importance of the ECG for the decision of the
neural network.
Variable Metric Median ECG Blanking P-wave Blanking QRS complex Blanking T-wave
QT interval (ms) MAE ↓ 3.13 ± 0.21 3.20 ± 0.22 31.76 ± 6.34 47.35 ± 12.38
PR interval (ms) MAE ↓ 2.73 ± 0.06 32.95 ± 10.31 40.55 ± 5.88 3.84 ± 0.71
QRS duration (ms) MAE ↓ 2.58 ± 0.08 3.99 ± 0.48 40.55 ± 5.88 3.50 ± 0.10
Heart Rate (bpm) MAE ↓ 1.57 ± 0.07 2.92 ± 0.19 3.62 ± 1.89 4.79 ± 1.10
J-point elevation (µV) MAE ↓ 5.77 ± 0.18 6.43 ± 0.56 23.07 ± 3.29 8.62 ± 0.42
T-wave amplitude (µV) MAE ↓ 5.80 ± 1.29 6.13 ± 1.45 8.70 ± 1.49 339.04 ± 8.0
R-wave amplitude (µV) MAE ↓ 8.35 ± 1.12 8.64 ± 1.11 927.38 ± 16.0 10.48 ± 3.56
Sex classification (%) ACC ↑ 88.80 ± 0.7 87.50 ± 1.0 62.40 ± 6.6 79.80 ± 2.5
Table 3. Mean absolute error (MAE) and accuracy (ACC) ± standard deviation measured on the replication
dataset when blanking specific waves of a median heartbeat. Prediction errors increased dramatically when the
feature in question is blanked out. Prediction errors also often increased slightly when other parts of the ECG
are blanked. In the metric column, the arrow signifies whether higher or lower values are better, i.e., an arrow
pointing downwards means that lower values are preferable.
from the Inter99 replication dataset. As seen in Table 4, the trained networks prove substantially more precise
and consistent than human expert assessments. Human bias-corrected MAE and RMSE are around 15–20 ms,
i.e., a factor 4 to 5× higher than the neural network. Errors in heart rate measurements are below one beat per
minute (BPM) for the network but about 3 BPM for the human operators with multiple errors above 10 BPM.
Amplitude measurements are much more difficult for humans, given the resolution of the digital ECG and the
Scientific Reports | (2021) 11:10949 | https://doi.org/10.1038/s41598-021-90285-5 5
Vol.:(0123456789)www.nature.com/scientificreports/
Figure 4. Visualizations of the attention maps from the sex classification model for eight different ECGs.
The plots suggest that the QRS-complex and especially the downslope of the R-wave is most important when
distinguishing between a male and female ECG. Red color indicates high importance and blue color low
importance of the ECG for the decision of the neural network.
Neural network Doctor A Doctor B
Variables Test set, mean ± SD Bias MAE* R Bias MAE* R Bias MAE* R
Heart rate (bpm) 71 ± 8 0.04 0.20 0.99 0.98 3.20 0.68 − 0.52 1,38 0.99
QT interval (ms) 392 ± 21 0.50 3.70 0.98 − 8.50 15.8 0.49 − 17.8 9.2 0.89
QRS duration (ms) 91 ± 10 − 3.30 3.00 0.98 − 7.80 11.9 0.39 − 7.6 8.22 0.55
PR interval (ms) 161 ± 16 − 2.50 4.70 0.99 5.90 8.00 0.87 6.45 9.01 0.82
R-peak amplitude (mm) 12 ± 4 0.02 0.16 0.99 0.57 0.42 0.98 0.06 0.50 0.95
J-point elevation (mm) − 0.04 ± 0.28 0.02 0.09 0.98 0.12 0.19 − 0.01 − 0.01 0.17 0.86
T-wave amplitude (mm) 3.00 ± 1.50 0.03 0.10 0.99 − 0.13 0.32 0.89 0.20 0.56 0.80
Table 4. Evaluation of twenty randomly selected ECGs by two experienced cardiologists. Bias is the average
difference between the ground truth and the doctor/network. Mean absolute error (MAE*) is the bias-
subtracted mean absolute error, to account for the fact that there is no universal correct measurement for
an ECG, ensuring that any personal bias does not contribute to the error (e.g., some doctors measure QT
consistently shorter or longer than others). R: Pearson’s correlation coefficient between the doctor’s two
measurements/the neural networks five folds. SD Standard deviation.
accuracy of the human eye. For the R-peak amplitude, the network operates at an MAE of twice the least signifi-
cant bit at 4.8 µV. In contrast, the human reviewer operates with an MAE in the magnitude of half a millimeter
(corresponding to 50 µV or 10 the times least significant bit).
Discussion
This paper identified three novel findings. First, we presented a residual CNN that reliably analyzes both ECG
intervals (time dimension) and amplitudes (voltage dimension) independent of whether the ECG presented is
a 10-s 12-lead ECG or a 1.2-s median representative beat. The architecture proved accurate for a variety of dif-
ferent ECG tasks. In all cases, CNN prediction outperformed the cardiologists by a large margin. Furthermore,
with repeated blinded measurements, the cardiologists had a large intra-observer variation, whereas the neural
network was very consistent in its predictions between folds. The MAE was between 3 and 4 ms correspond-
ing to two samples which is close to the physical obtainable lower limit (since the interval uncertainty consists
of two cumulative uncertainties of 2 ms at each the end of the interval). In general, measurements were more
accurate when using 1.2-s median beats compared to 10-s rhythm strips, except for heart rate. The generation of
the median beat reduces noise by averaging all beats during the 10-s ECG, stretching each complex to minimize
the influence of variations, making measurements more accurate. The exception of heart rate is not surprising
since several ECG complexes are needed to properly estimate heart rate, and these are only found in the rhythm
strip. More surprising is the finding that the neural network uses other features than the RR-interval to calculate
heart rate and obtains a relatively good estimate from the single ECG complex of the median beat. In fact, the
heart rate estimate from the median was only slightly worse than that based on the rhythm strip (see Table 2).
Similar to human overreaders, the network performed slightly worse in subjects with conduction blocks. How-
ever, the increase in prediction error was small compared to the human overreader error, showing a satisfactory
accuracy for clinical use. The QT interval is an important feature in the ECG because the interval is related to
Scientific Reports | (2021) 11:10949 | https://doi.org/10.1038/s41598-021-90285-5 6
Vol:.(1234567890)www.nature.com/scientificreports/
sudden death33. It is well known that abnormal T waves are difficult to measure correctly, which is important
because these abnormal T waves are associated with increased m ortality34. As seen in the supplementary (Sup-
plementary Table S1), the network accurately measured even the most flattened T waves only marginally worse
than the “easy-to-measure” peaked T waves with a sharp, well-defined end.
Second, we presented ECGradCAM attention maps for 12-lead ECG-analysis to explain how the network
made its decisions. In medical practice, explainability is crucial because medical doctors are concerned that
algorithms may produce erroneous results, either due to bias or trying to predict outcomes not appropriately
represented in the training data. For example, measurement of the PR interval in a case of ventricular tachy-
cardia would be unreliable if the training set only consisted of ECGs taken in sinus rhythm. Interpretation and
transparency should be at the forefront when developing new algorithms intended for medical use. Although the
results suggest that deep learning could be an essential tool for cardiologists for doing analysis and interpretation
of the ECG, it is doubtful that the neural network models without explanations of an estimate of uncertainty
would be accepted by doctors.
The attention maps showed nicely that all amplitude measurements focused on the proper ECG wave, and in
cases of interval measurements, both the beginning and the end of the specific interval are most often highlighted
by the algorithm. The obscurity tests confirmed the attention map results. When we removed ECG waves used
for the specific interval or amplitude measurement, the MAE increased dramatically, confirming the message
from the attention maps that our CNN focused on the same features as human cardiologists, just more accurately
and reliably. One may also notice that the network tries to extract information about the baseline from the ECG.
Since we use batch normalization (a standard feature in neural networks to avoid exploding gradients), the net-
work had to get an idea of the magnitude of normalization to restore the absolute values needed for amplitude
prediction. This may be why the network also focuses on more steady, constant parts of the ECG. By providing
these explanations with a predicted variable, we allow the users to interpret the results with confidence that
model had some notion of the traits that make up the variable in question.
Third, sex prediction is an excellent example of how neural networks combined with an explanation method
can be used to discover novel medical knowledge. It is well known that there are sex differences in the ECG.
Female ECGs, on average, have a longer QT interval, faster heart rate, and shorter QRS d uration35. However,
if one were to ask a cardiologist to determine the sex based on an ECG alone, they would not be able to make
a confident prediction. Recent studies using deep learning have shown that neural networks can differentiate
between the sexes from the ECG alone36, but the underlying reasoning is not provided. The attention maps
indicate that the physiological background seems to be differences in the R-wave downslope, which may provide
important mechanistic insight into the observed sex differences. We confirmed the findings by our neural net-
work that simple logistic regression with QRS duration, wave amplitudes, and timing (slopes can be inferred by
wave amplitudes and timings) significantly improved sex prediction compared to QRS duration alone. Although
adding the R-wave downslope to the QRS duration significantly increased sex prediction, the neural network still
performed better than the logistic regression, most likely because the R-wave downslope is not the sole source
of information. However, it is also possible that the R-wave downslope contains nonlinear information or that
only part of the downslope is relevant. This study constitutes a scholarly example that the use of attention maps
can assist scientists in discovering novel insights and identify hitherto unknown features for classification, which
may lead to important physiological understanding. Classifying an appropriate outcome in a suitable popula-
tion, one may identify novel prognostic markers in the ECG for that outcome, which may lead to a suggestion
for possible treatments.
Conclusions
This paper presented a study on interpreting deep learning models used for ECG analysis. We propose a neu-
ral network architecture that predicts multiple attributes of a standard median or 10-s rhythm ECG with low
error. The model was compared against real-world cardiologists, and our model outperformed the cardiologists
by a large margin. The predictions were interpreted using attention maps (ECGradCAM), which show how
the network operates and confirmed that the neural network analyzes ECGs similarly to trained cardiologists.
Furthermore, we show that the neural network can differentiate between male and female ECGs with over 90%
accuracy. Using the ECGradCAM attention maps, we find that the down-slope of the R wave is a crucial feature
of an ECG when determining sex. This emphasizes the need for more interpretable machine learning methods
as they can be used to find new insights in rather mature medical fields such as ECG analysis. We believe that
open and transparent systems are paramount for their adoption and use in medicine. Making high-risk decisions
based on the output of a black-box algorithm is irresponsible and could potentially have fatal consequences that
could easily be avoided. We hope this paper motivates a more thorough evaluation and interpretation of deep
learning-based models applied to all of medicine and not only to ECGs.
Methods
Data populations. We use digital ECGs from two population studies. (1) The Danish General Suburban
Population Study (GESUS)29 consisting of 8939 free-living subjects (age 56.5 ± 13.5, 54% females) at least 18
years old from the Naestved municipality, 90 km south of Copenhagen, the Capital of Denmark, randomly cho-
sen. The study was approved by the local ethics committee (SJ-113, SJ-114, SJ-147, SJ-278). (2) The Inter99 study
(CT00289237, ClinicalTrials.gov) consists of 6,667 free-living subjects (age 46.1 ± 7.9, 51% females) randomly
drawn from the Glostrup municipality with an age of 30–65 years30. This yields a collection of ECGs from people
with and without cardiac disease and an equal representation of men and women. Both studies are conducted in
accordance with the Declaration of Helsinki.
Scientific Reports | (2021) 11:10949 | https://doi.org/10.1038/s41598-021-90285-5 7
Vol.:(0123456789)www.nature.com/scientificreports/
Electrocardiography. All ECGs are digitally recorded as 10-s ECGs with 12 leads. All ECGs are transferred
to a MUSE Cardiology Information system (GE Healthcare, Wauwatosa, WI, USA) and ground truths are cal-
culated with version 21 of the Marquette 12 SL algorithm (GE Healthcare, Wauwatosa, WI, USA). The ECGs are
recorded with a sample rate of 500 Hz and a resolution of 4.88 µV per least significant bit.
Prediction model. Architecture. A digital electronic ECG can be represented as a two-dimensional matrix
of integers representing the voltage at a specific point in time. To analyze these measurements, we use a standard
convolutional neural network (CNN) consisting of eight residual modules (as introduced by He et al.37) to cap-
ture the complex features and relationships present in a standard ECG. The neural network architecture consists
of 1,652,993 parameters and is built to handle two different types of input, a single representative median heart-
beat of 1.2-s duration and a 10-s rhythm ECG. Both input types contain data from 12-lead ECGs. A detailed
view of the neural network architecture can be seen in Fig. 2. From the input layer, the ECG is passed through
two convolutional layers before being average pooled. The two convolutional layers generate 64 and 32 feature
maps with a kernel size of 8 and 3. After this initial convolution block, the output is sent through eight residual
blocks, each consisting of two convolutions. Each convolutional layer in the residual blocks generates 64 and 32
feature maps, respectively, and both layers use a kernel size of 50. We use a large kernel size to extend the recep-
tive field to include multiple parts of a typical ECG. This could, for example, capture both the P wave and the
QRS complex in a single convolution. We add batch normalization after each convolution and dropout after the
final convolution with a drop rate of 50%. After the eight residual blocks, the output is globally average pooled
before making the final prediction. The prediction layer consists of a single neuron with a linear activation that
predicts a single variable of the ECG.
Training. All models are trained for a maximum of 1000 epochs on a computer consisting of two Intel Xeon
Silver 4116 CPUs running at 2.1 GHz, four Nvidia RTX 2080Ti graphics cards, and 96 gigabytes of RAM. The
models are implemented using Keras version 2.1.0 with a TensorFlow backend on Ubuntu 18.04.2. Processing
one ECG takes about 0.06 s using the aforementioned hardware and Python libraries. To optimize the weights,
we used the gradient descent-based optimizer Nadam38 with a learning rate of 0.0005. The learning rate is
selected based on manual testing and prior experience from our previous works32. Otherwise, we used the Keras
defaults for all optimizer parameters. In total, we performed 14 different experiments, seven using the median
for prediction and seven using the rhythm. The variables predicted with regression parameters (include the
QT interval, PR interval, QRS duration, heart rate, ST-segment deviation from baseline at the junction (STJ),
T-wave amplitude, and R-peak amplitude). The three amplitudes are lead specific and lead V5 is used. Some of
these variables cater more to rhythm analyses (such as heart rate), while others are more appropriate for median
complexes (such as the R-peak). One problem with training on the median complexes is that they are all cen-
tered in a manufacturer-specific way, whereby each wave appears in nearly the same place in each of the ECG.
Thereby, the network can learn to predict a particular vicinity and guarantee a relatively low error. To circumvent
this problem, we time-shifted all median complexes by a random amount (− 40 to +40 ms) so that the network
learns to find the individual waves. This increases the likelihood that the model can be used on ECGs from other
manufactures with different temporal alignment. No alignment is performed for the rhythm ECGs; the start of
the recording is random with respect to the ECG. Furthermore, to test the network’s ability to classify in binary
outcomes, we classified the ECG for sex (male/female).
Attention maps. To obtain physiological insights from the neural network’s decisions, it is necessary to under-
stand how and why a decision is achieved. In this study, we used attention maps to visualize which parts of the
ECG have importance for each interval/amplitude prediction. To explain the predictions of our model, we use
gradient-based activation maps (attention maps) to visualize which parts of the ECG are the most important
when predicting a given variable or class. The technique used is a modified version of G radCAM26, commonly
used to interpret image classification models. As we show in our study, this approach works just as well for
regression tasks of quantitative measurements in the data. Visualizations are generated based on a given network
layer and output neuron, which produces a heat map that marks the most important areas as hot (red color) and
less important regions as cold (blue color). In this context, importance signifies how much weight a specific area
contributes to the overall prediction. We are not the first to use attention maps to interpret deep neural networks
CGs39,40. Most other works use these visualizations to confirm that their model does not deviate
applied to E
from the expectations of the medical doctors41. Our work goes one step further and expands the method of
explanations to find new insights into the unique properties of ECGs through a case study on sex classification.
Furthermore, even though the attention maps are generated on a per-lead basis, we average the explanations for
each lead to produce a visualization that contains more fine-grained details and thus is able to more accurately
represent what regions of the ECG are most important for the model when making a specific prediction.
Evaluation. To ensure a fair and robust evaluation, we trained each model with five-fold cross-validation for
1000 epochs on the GESUS dataset29, resulting in 7152 samples being used for training and 1787 for validation.
After training and internal cross-validation, the results of GESUS models are replicated in the Inter99 dataset30
to examine whether the models are generalizable or not. As seen in Table 1, GESUS and Inter99 datasets are
comparable regarding ECG measurements, although participants in the GESUS study are on average older than
participants in the Inter99 study. The neural network performance is evaluated by the MAEs (|predicted – actual
2
value|) and the RMSEs ( n1 predicted − actual value
) to evaluate the mistakes of the neural networks
Scientific Reports | (2021) 11:10949 | https://doi.org/10.1038/s41598-021-90285-5 8
Vol:.(1234567890)www.nature.com/scientificreports/
relative to the ground truth. To give an idea of the magnitude of uncertainty, we calculated the ZeroR-estimate,
defined as constantly guessing the population mean of the desired variable. If a model’s performance is not better
than ZeroR, the model has not learned anything except the population mean. Conversely, if the model perfor-
mance is better than the ZeroR, it follows that the model has succeeded in extracting and processing features
from the ECGs.
Furthermore, ECGs were evaluated manually by two skilled cardiologists. Whereas the neural network by
definition has a bias (i.e., average error) of zero (ignoring an eventual bias in the ground truth from the 12SL
algorithm), the human overreaders may exhibit substantial bias relative to the ground truth (i.e., the measure
consistently shorter or longer intervals), which originates from their own training and personal preference. Since
this bias is not an error, the human bias is subtracted from the errors before calculating human MAE and RMSE.
Wave blocking. To verify that the neural network model is focusing on relevant waves of the ECG, and as an
alternative to the attention maps, we remove specific parts of the ECG (either the P- QRS- or T-wave) from the
median ECGs of the replication set. Using the MUSE 12SL fiducial points, we blank out a wave by replacing it
from the start to the end with a lead-specific linear interpolation. This analysis represents an alternative measure
of explainability for representative beats of an ECG by analyzing the decrease in performance when different
waves of the ECG are blanked. Thus, we can test how dependent our model is on different parts of the ECG and
verify which waves the model is focusing on when making a prediction. The results in Table 3 show that the
model performance drop when the wave involved with a particular feature is removed. However, we also find
that removing non-involved waves typically decreases performance slightly, suggesting that the neural network
also includes other parts of the ECG to stabilize the model to ensure that it is analyzing the correct part of the
ECG.
Ethics. We confirm that all experiments were performed in accordance with Helsinki guidelines and regu-
lations of the Danish Regional Committees for Medical and Health Research Ethics. The data studies were
approved by the ethical committee of Region Zealand (SJ-113, SJ-114, SJ-191), ethical committee of Copenhagen
Amt (KA 98 155). Written informed consent was obtained from all study participants.
Data availability
The data is not available to the public.
Code availability
The code used to conduct the experiments and generated the related attention maps is available on GitHub at
https://github.com/stevenah/ecg-attention-maps.
Received: 7 January 2021; Accepted: 10 May 2021
References
1. Gupta, V. & Mittal, M. Arrhythmia detection in ECG signal using fractional wavelet transform with principal component analysis.
J. Inst. Eng. India Ser. B 101, 451–461 (2020).
2. Gupta, V., Mittal, M. & Mittal, V. An efficient low computational cost method of R-peak detection. Wirel. Pers. Commun. 118,
359–381 (2021).
3. Josko, A. Discrete Wavelet Transform In Automatic ECG Signal Analysis. in 2007 IEEE Instrumentation Measurement Technology
Conference IMTC 2007 1–3 (2007). doi:https://doi.org/10.1109/IMTC.2007.379244.
4. Silipo, R. & Marchesi, C. Artificial neural networks for automatic ECG analysis. IEEE Trans. Signal Process. 46, 1417–1425 (1998).
5. Schreier, G., Kastner, P. & Marko, W. An automatic ECG processing algorithm to identify patients prone to paroxysmal atrial
fibrillation. in Computers in Cardiology 2001. Vol.28 (Cat. No.01CH37287) 133–135 (2001). doi:https://doi.org/10.1109/CIC.2001.
977609.
6. N, S., P, W., T, S. & W, S. Deep Learning for ECG Analysis: Benchmarks and Insights from PTB-XL. IEEE J. Biomed. Health Inform.
PP, (2020).
7. Zech, J. R. et al. Variable generalization performance of a deep learning model to detect pneumonia in chest radiographs: A cross-
sectional study. PLoS Med 15, e1002683 (2018).
8. Esteva, A. et al. Dermatologist-level classification of skin cancer with deep neural networks. Nature 542, 115–118 (2017).
9. Acharya, U. R. et al. Automated detection of arrhythmias using different intervals of tachycardia ECG segments with convolutional
neural network. Inf. Sci. 405, 81–90 (2017).
10. Zihlmann, M., Perekrestenko, D. & Tschannen, M. Convolutional recurrent neural networks for electrocardiogram classification.
1710.06122v2, (2019).
11. Hannun, A. Y. et al. Cardiologist-level arrhythmia detection and classification in ambulatory electrocardiograms using a deep
neural network. Nat. Med. 25, 65–69 (2019).
12. Carvalho, D. V., Pereira, E. M. & Cardoso, J. S. Machine learning interpretability: A survey on methods and metrics. Electronics 8,
832 (2019).
13. Caruana, R. et al. Intelligible Models for HealthCare: Predicting Pneumonia Risk and Hospital 30-day Readmission. in Proceed-
ings of the 21th ACM SIGKDD International Conference on Knowledge Discovery and Data Mining 1721–1730 (Association for
Computing Machinery, 2015). doi:https://doi.org/10.1145/2783258.2788613.
14. Cooper, G. F. et al. An evaluation of machine-learning methods for predicting pneumonia mortality. Artif. Intell. Med. 9, 107–138
(1997).
15. Riegler, M. et al. Multimedia and Medicine: Teammates for Better Disease Detection and Survival. in Proceedings of the 24th ACM
international conference on Multimedia 968–977 (Association for Computing Machinery, 2016). doi:https://d oi.o
rg/1 0.1 145/2 9642
84.2976760.
16. Badgeley, M. A. et al. Deep learning predicts hip fracture using confounding patient and healthcare variables. NPJ Digit. Med. 2,
31 (2019).
Scientific Reports | (2021) 11:10949 | https://doi.org/10.1038/s41598-021-90285-5 9
Vol.:(0123456789)www.nature.com/scientificreports/
17. Kelly, C. J., Karthikesalingam, A., Suleyman, M., Corrado, G. & King, D. Key challenges for delivering clinical impact with artificial
intelligence. BMC Med. 17, 195 (2019).
18. Chen, D. et al. Deep learning and alternative learning strategies for retrospective real-world clinical data. NPJ Digit. Med. 2, 43
(2019).
19. Cullen, K., Stenhouse, N. S., Wearne, K. L. & Cumpston, G. N. Electrocardiograms and 13 year cardiovascular mortality in Bus-
selton study. Br. Heart J. 47, 209–212 (1982).
20. Goldberg, R. J. et al. Duration of the QT interval and total and cardiovascular mortality in healthy persons (The Framingham
Heart Study experience). Am. J. Cardiol. 67, 55–58 (1991).
21. Nielsen, J. B. et al. Risk prediction of cardiovascular death based on the QTc interval: evaluating age and gender differences in a
large primary care population. Eur. Heart J. 35, 1335–1344 (2014).
22. Nielsen, J. B. et al. J-shaped association between QTc interval duration and the risk of atrial fibrillation: results from the Copenhagen
ECG study. J. Am. Coll. Cardiol. 61, 2557–2564 (2013).
23. Stallmann, F. W. & Pipberger, H. V. Automatic recognition of electrocardiographic waves by digital computer. Circ. Res. 9, 1138–
1143 (1961).
24. Bussone, A., Stumpf, S. & O’Sullivan, D. The Role of Explanations on Trust and Reliance in Clinical Decision Support Systems. in
2015 International Conference on Healthcare Informatics 160–169 (IEEE, 2015). doi:https://doi.org/10.1109/ICHI.2015.26.
25. Cabitza, F., Rasoini, R. & Gensini, G. F. Unintended consequences of machine learning in medicine. JAMA 318, 517–518 (2017).
26. Selvaraju, R. R. et al. Grad-CAM: Visual explanations from deep networks via gradient-based localization. Int. J. Comput. Vis. 128,
336–359 (2020).
27. Macfarlane, P. W. et al. Comprehensive Electrocardiology. (Springer-Verlag, 2010).
28. GE Healthcare. MarquetteTM 12SLTM ECG analysis program physician’s guide 2056246-002 Revision C. (2015).
29. Juhl, C. R., Miller, I. M., Jemec, G. B., Kanters, J. K. & Ellervik, C. Hidradenitis suppurativa and electrocardiographic changes: A
cross-sectional population study. Br. J. Dermatol. 178, 222–228 (2018).
30. Ghouse, J. et al. Rare genetic variants previously associated with congenital forms of long QT syndrome have little or no effect on
the QT interval. Eur. Heart J. 36, 2523–2529 (2015).
31. Graff, C. et al. Quantitative analysis of T-wave morphology increases confidence in drug-induced cardiac repolarization abnor-
malities: Evidence from the investigational IKr inhibitor Lu 35–138. J. Clin. Pharmacol. 49, 1331–1342 (2009).
32. Hicks, S. et al. Dissecting Deep Neural Networks for Better Medical Image Classification and Classification Understanding. in
2018 IEEE 31st International Symposium on Computer-Based Medical Systems (CBMS) 363–368 (2018). doi:https://doi.org/10.
1109/CBMS.2018.00070.
33. Haarmark, C. et al. Reference values of electrocardiogram repolarization variables in a healthy population. J. Electrocardiol. 43,
31–39 (2010).
34. Isaksen, J. L. et al. Electrocardiographic T-wave morphology and risk of mortality. Int. J. Cardiol. 328, 199–205 (2021).
35. Sachin Khane, R. & Surdi, A. D. Gender differences in the prevalence of electrocardiogram abnormalities in the elderly: a popula-
tion survey in India. Iran. J. Med. Sci. 37, 92–99 (2012).
36. Zachi, I. et al. Age and sex estimation using artificial intelligence from standard 12-lead ECGs. Circ. Arrhythm. Electrophysiol.
12(9). https://doi.org/10.1161/CIRCEP.119.007284 (2019).
37. He, K., Zhang, X., Ren, S. & Sun, J. Deep Residual Learning for Image Recognition. in 2016 IEEE Conference on Computer Vision
and Pattern Recognition (CVPR) 770–778 (IEEE, 2016). doi:https://doi.org/10.1109/CVPR.2016.90.
38. Dozat, T. Incorporating Nesterov Momentum into ADAM. in ICLR 4 (2016).
39. van de Leur Rutger R. et al. Automatic Triage of 12‐Lead ECGs Using Deep Convolutional Neural Networks. J. Am. Heart Assoc.
9, e015138 (2020).
40. Strodthoff, N. & Strodthoff, C. Detecting and interpreting myocardial infarction using fully convolutional neural networks. Physiol.
Meas. 40, 015001 (2019).
41. Raghunath, S. et al. Prediction of mortality from 12-lead electrocardiogram voltage data using a deep neural network. Nat. Med.
26, 886–891 (2020).
Acknowledgements
This work is funded in part by Novo Nordisk Foundation project number NNF18CC0034900.
Author contributions
S.A.H., J.L.I., V.T., M.A.R., and J.K.K. conceived the experiment(s). S.A.H., J.L.I., and J.K.K. conducted the
experiment(s). S.A.H., J.L.I., V.T., M.A.R., and J.K.K. analyzed the results. All authors reviewed the manuscript.
Competing interests
The authors declare no competing interests.
Additional information
Supplementary Information The online version contains supplementary material available at https://doi.org/
10.1038/s41598-021-90285-5.
Correspondence and requests for materials should be addressed to S.A.H.
Reprints and permissions information is available at www.nature.com/reprints.
Publisher’s note Springer Nature remains neutral with regard to jurisdictional claims in published maps and
institutional affiliations.
Scientific Reports | (2021) 11:10949 | https://doi.org/10.1038/s41598-021-90285-5 10
Vol:.(1234567890)www.nature.com/scientificreports/
Open Access This article is licensed under a Creative Commons Attribution 4.0 International
License, which permits use, sharing, adaptation, distribution and reproduction in any medium or
format, as long as you give appropriate credit to the original author(s) and the source, provide a link to the
Creative Commons licence, and indicate if changes were made. The images or other third party material in this
article are included in the article’s Creative Commons licence, unless indicated otherwise in a credit line to the
material. If material is not included in the article’s Creative Commons licence and your intended use is not
permitted by statutory regulation or exceeds the permitted use, you will need to obtain permission directly from
the copyright holder. To view a copy of this licence, visit http://creativecommons.org/licenses/by/4.0/.
© The Author(s) 2021
Scientific Reports | (2021) 11:10949 | https://doi.org/10.1038/s41598-021-90285-5 11
Vol.:(0123456789)You can also read