The economic contribution of the European tower sector - A report for the European Wireless Infrastructure Association - Cellnex Trends
←
→
Page content transcription
If your browser does not render page correctly, please read the page content below
The economic
contribution of the
European tower
sector
A report for the European Wireless
Infrastructure Association

April 2019
Information in this publication is intended to provide only a general outline of the subjects covered. It
should neither be regarded as comprehensive nor sufficient for making decisions, nor should it be used
in place of professional advice.
Ernst & Young LLP accepts no responsibility for any loss arising from any action taken or not taken by
anyone using this material.
Context
EY and the European Wireless Infrastructure Association (EWIA) published a
report on the economic contribution of the European mobile tower sector in
March 2015. The study examined the important role of independent wholesale
wireless infrastructure providers (in short: independent TowerCos).
Since then, the sector has attracted further interest from policy makers and
investors, Mobile Network Operators (MNOs) have outsourced more towers and
5G network rollouts are now imminent. Hence EY and EWIA have refreshed the
study reflecting recent developments, while the overall objectives remain the
same:
Foster a better understanding of the benefits that independent TowerCos can
provide in generating investment and promoting efficient use of communication
infrastructure, and the role they can play in delivering the EU’s Gigabit Vision
2025 and other government targets, such as mobile coverage and 5G rollouts.
The report is based on a combination of publicly available data, information
that has been provided by EWIA members and interviews with market
participants, as well as on EY extensive experience in advising the wider
TowerCo sector.
In this report, Europe is defined as EU-28 (incl. UK) and EFTA, unless stated
otherwise.

About EY
EY is a provider of professional services to the telecom sector — EY teams serve
all of the top 20 telecom operators ranked by market capitalization. EY
transaction advisory services are based on deep tower infrastructure and
telecommunications sector experience. We have a large pool of tower
infrastructure knowledge emanating from the presence across the globe with
offices in over 90 countries and the extensive range of telecommunication
audit, advisory and transaction clients in the sector.

About the EWIA
The European Wireless Infrastructure Association (EWIA) is the European trade
association of independent wholesale wireless infrastructure providers. EWIA
has ten members operating in Germany, France, UK, Italy, Spain, Netherlands,
Ireland, Finland and Switzerland. They develop, acquire and operate
communication towers together with investment in the fiber-connected small
cell networks in buildings and on city streets needed for 5G.
                                    The economic contribution of the European tower sector | EY | Page 2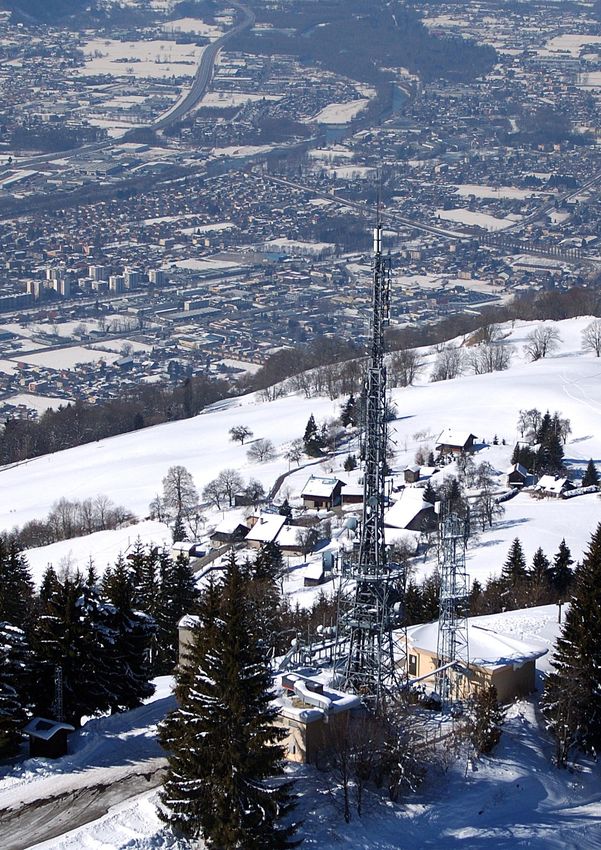
Contents
04 Executive summary
05 Introduction
11 Market analysis
19 Economic assessment
27 Outlook
Executive summary
Outsourcing of wireless infrastructure to independent TowerCos is a growing
trend in Europe that is in line with the model prevailing globally. It delivers a
number of benefits to MNOs, the wider wireless sector and, ultimately, the
consumer:

        Independent TowerCos specialize in operating neutral host, “passive”

  1     wireless network infrastructure such as mobile towers. Sharing of
        towers with multiple tenants reduces overall cost for mobile
        operators, helps improve coverage and reduces consumer prices

  2     Long-term international investors in European infrastructure value the
        benefits of the TowerCo model, resulting in an active M&A market
        The average number of wireless network operators sharing an

  3     independent tower is 2.4, compared to 1.3 for MNO-controlled
        towers. Independent TowerCos make it easier and cheaper to roll out
        new networks
        A typical location of a wireless network operator (also point of

  4     presence) managed by a TowerCo is circa 40% more efficient than one
        managed by an MNO, resulting in economic savings of €31b across
        Europe by 2029
        Greater outsourcing to independent TowerCos could release an
  5     estimated €28b of capital, which MNOs can reinvest in their networks,
        such as to improve coverage and accelerate 5G rollouts

  6     Independent TowerCos are playing a key role in enabling 5G rollouts
        and the continued expansion of mobile network coverage
        While the share of independent TowerCos in Europe has increased in
        recent years (from 13% to 17%), it remains low compared to other
  7     regions (e.g., 67% in USA and Canada and 42% in Latin America). A
        further increase in Europe would help deliver the benefits of cheaper
        and better mobile networks
        The new European Electronic Communications Code (EECC) reflects

  8     the pro-competitive nature of independent TowerCos and is expected
        to benefit independent TowerCos through increased certainty for the
        wholesale infrastructure sector
In summary, independent TowerCos will continue to play a significant role,
underpinning modern digital economies for the long-term.

                                     The economic contribution of the European tower sector | EY | Page 4
Introduction
Wireless infrastructure (short: towers) provides an important element for the operations of wireless network
services, including mobile networks, fixed wireless access broadband, emergency services, TV and radio
broadcast, Internet of Things (IoT), and Private Mobile Radio (PMR) networks. The largest user segment of
towers are the mobile network operators (MNOs).
Over the last couple of decades, tower ownership has increasingly been transferred from MNOs to separate
tower companies (TowerCos). These TowerCos can take the form of an internal division within an MNO, a
separate entity controlled by an MNO or a wholly independent entity.
TowerCos have developed robust business models around the building and management of ground-based
masts and rooftop sites, offering space on these infrastructures to multiple customers, most of which are
MNOs.
To understand the economic benefits TowerCos provide, it is important to understand the provisioning of
wireless networks. The value chain consists of three key segments: passive infrastructure, active networks
and retail services. Towers are part of the passive infrastructure and access to them is traded in the wholesale
wireless infrastructure market.
MNOs, for instance, install Radio Access Network (RAN) equipment such as antennae, radio and baseband
units on towers in order to transmit mobile signals. The active networks and passive infrastructure together
enable the MNO to provide voice and data services to their retail customers. This mobile network service value
chain is illustrated below.
Figure 1: Value chain for wireless network services

                                                                                        “
                               MNOs and Mobile Virtual Network
                               Operators (MVNOs) provide voice and data
                               services to retail customers, combined with               Our core business is to
     Retail services           handset sales. Other networks provide
                                                                                         find the land, finance,
                               wireless internet, police radios, TV signals,
                               IoT connectivity, etc.                                    build and maintain
                                                                                         infrastructure, and offer
                                                                                         multi-operator
                                                                                         infrastructure to MNOs
                               MNOs install and use active equipment to                  and other wireless
                               transmit data. MNOs also sell airtime to
                               MVNOs. Other wireless networks enable                     operators
    Active networks            fixed wireless access, emergency services,                Roland Chedlivili,
                               broadcast, IoT, etc.                                      Strategy, Development and M&A
                                                                                         Director, TDF

                               MNOs and TowerCos construct and manage
                               passive infrastructure, i.e., towers/sites for
          Passive              mobile and other wireless networks. These
                               include a large variety of other existing
      infrastructure
                               infrastructure such as electricity pylons,
                               water towers or motorway gantries.

In addition to towers, TowerCos also develop wholesale small cell platforms for high density urban and indoor
locations such as indoor distributed antenna solutions (DAS). In such cases, the wholesaler retains ownership
and responsibility for the operation of the active infrastructure and can facilitate multiple operators co-locating
on a single active infrastructure site. The TowerCo provides the design of the solution, develops and maintains
the network, and manages the relationship with the real estate owner and with any other site users. This report
primarily focuses on mobile telecoms towers.

                                                   The economic contribution of the European tower sector | EY | Page 5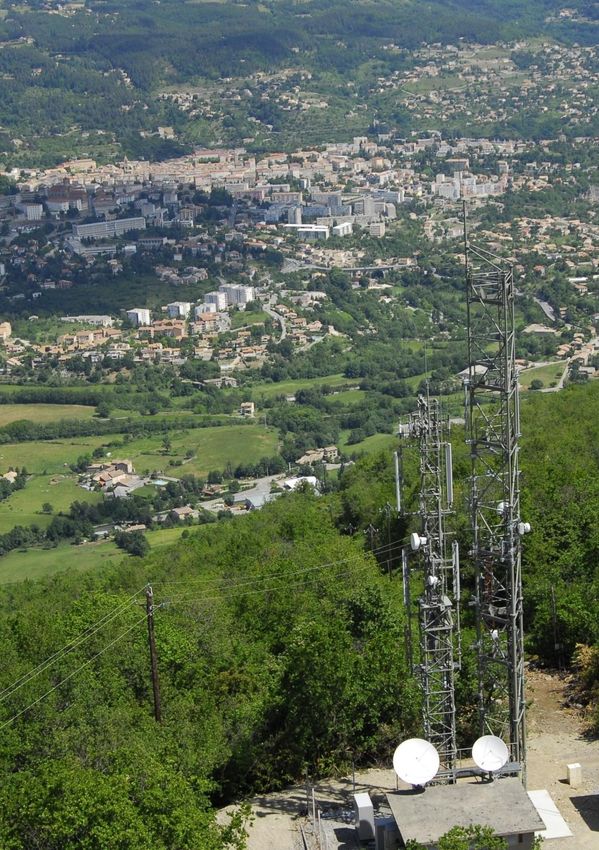
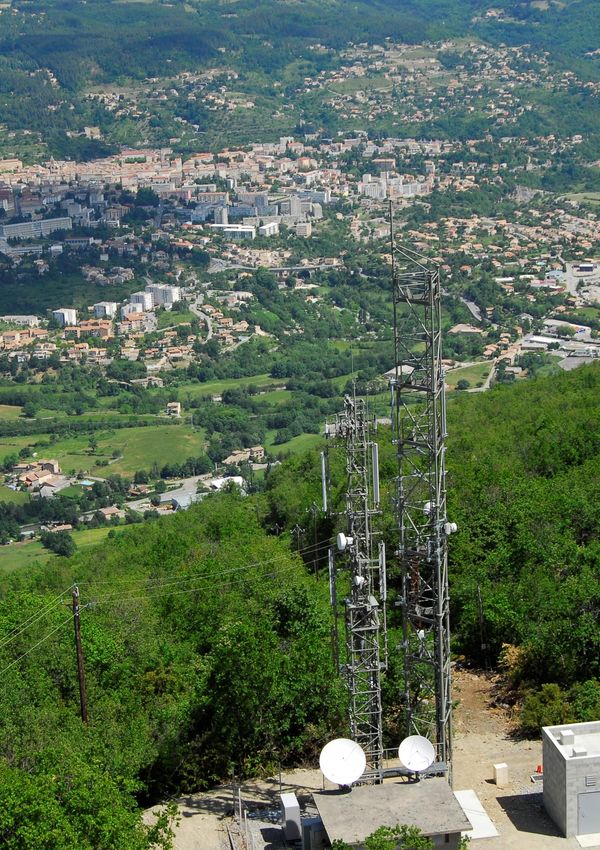
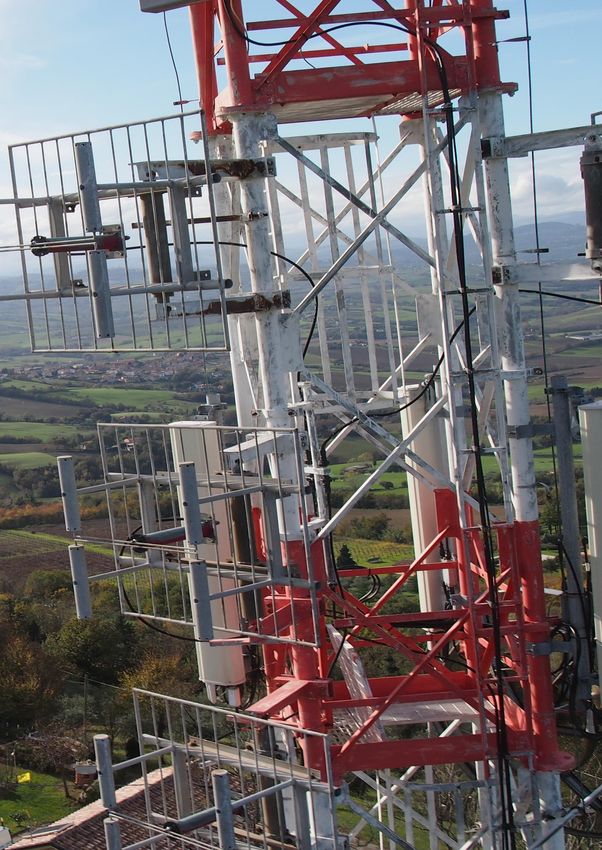
Towers can be split into two principal types — ground-based
towers and rooftop towers

There are two principal types of towers — ground-based towers and rooftop towers. Ground-based towers are
typically freestanding structures and are more prevalent in less densely populated areas. Rooftop towers are
(usually) set up on pre-existing buildings and are typically located on the roof, roofing pavement or high
windows (e.g., in the case of a church bell tower being used as a rooftop tower). All statements, numbers and
figures in this report refer to both tower types, unless stated otherwise.
Figure 2: Typical tower types
Ground-based towers

Rooftop towers

                                                 The economic contribution of the European tower sector | EY | Page 6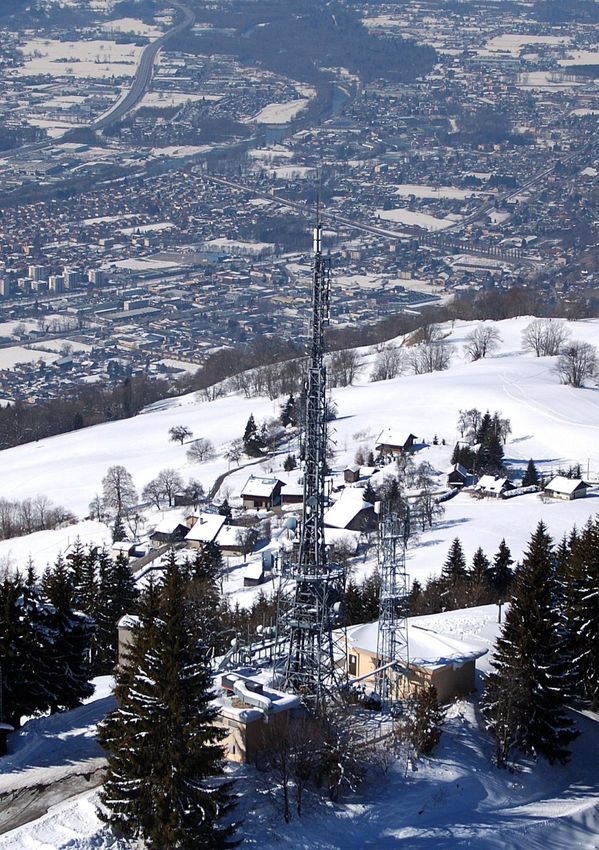
TowerCos operate “passive” infrastructure enabling wireless
networks to provide services

TowerCos develop, acquire and operate mobile network towers. They invest in mobile network towers, small
cell networks and associated utility and real estate rights for the purpose of providing wholesale access to
MNOs and other network operators on a shared basis. This provides an alternative to MNOs managing their
own passive infrastructure.
For MNOs, outsourcing passive wireless infrastructure to TowerCos helps to free up capital. The economic
benefits of outsourcing passive infrastructure to independent TowerCos are discussed in greater detail in the
“economic assessment” section of this report.
When offering passive infrastructure services to MNOs, TowerCos’ responsibilities typically include:
•     Provision of the physical site/rooftop and maintenance of related real estate contracts
•     Installation and management of the passive infrastructure, including tower structure, civil works, fences,
      shelters, and possibly power supply and cooling systems
•     Health and safety compliance at the site
•     Access to infrastructure space and provision of services to MNOs and other network operators
Meanwhile, MNOs and other network operators’ responsibilities include:
•     Rental of passive infrastructure from TowerCos to install active equipment, including radio units,
      baseband units and other equipment
•     Ownership of the feeder cables connecting antennas with radio equipment, and the fiber connection to the
      backhaul/core network
Figure 3: Illustration of active and passive equipment on a typical tower site

                                                   Antennas

                                                 Remote Radios                               Active (owned by MNO)
   Mounting
equipment (head                                                                              Passive (owned by TowerCo)
     frame)

         Tower                                   Microwave dish

         CCTV                                                                  Shelter
                                                 Feeder cables

                                                   Baseband                          Cooling systems

    Access facilities

Legal rights to occupy
 the area of the site          Foundation                Power equipment                            Fiber backhaul
    with passive
   infrastructure

                                                    The economic contribution of the European tower sector | EY | Page 7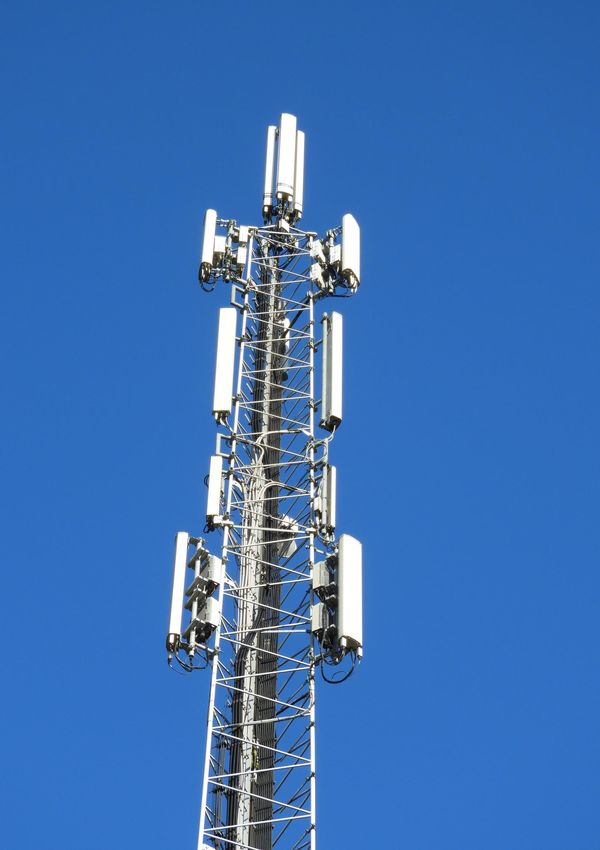
And add value by reducing the duplication of infrastructure

Where MNOs can share passive infrastructure, there is less need to build multiple towers at the same
geographical location. TowerCos operate the passive infrastructure and can accommodate multiple MNOs,
which then focus on operating the active equipment at the site.

Figure 4: TowerCo’s role in infrastructure sharing (conceptual)

                     Active                          Active                         Active                                 Active
                   equipment                       equipment                      equipment                              equipment
                     MNO 1                           MNO 2                          MNO 1                                  MNO 2

                   Passive                         Passive                                                        Passive
                    infra-                          infra-                                                         infra-
                  structure                       structure                                                      structure
                   MNO 1                           MNO 2                                                         owned by
                                                                                                                 TowerCo

          1 PoP                           1 PoP                                                       2 PoPs

A point of presence (PoP) is defined as a site where an MNO is “present” and provides a network signal. If an
MNO provides multiple networks (e.g., 2G, 3G and 4G) from the same site, this presence is still counted as one
PoP. The co-location (or tenancy) ratio for a single tower is defined as the number of PoPs hosted on that
tower.
For instance, in the left-hand part of the above figure, each MNO operates one site that hosts their own active
equipment. In this case, each tower is defined as having one PoP (and a co-location ratio of 1).
However, one tower can have multiple PoPs — e.g., in the right-hand part of the above figure, the TowerCo
hosts two MNOs on its infrastructure. In this case, the tower is defined as having two PoPs (and a co-location
ratio of 2). When looking at the overall portfolio of an MNO or a TowerCo, the co-location ratio is a key metric
that is tracked — e.g., if a TowerCo operates 1,000 towers and hosts a total of 2,100 PoPs, it has a co-location
ratio of 2.1.
Oftentimes independent TowerCos will also have a significant presence of “other” PoPs on their towers. These
other PoPs include PoPs of fixed wireless access providers, emergency services networks, IoT providers,
broadcast antennas on mobile network towers, etc.

 “
 We’re particularly well-positioned to support new technology entrants as we are neutral
 hosts. MNOs may lack incentives to share their infrastructure for operational and
 sometimes strategic reasons. With an established independent tower industry, it is much
 easier for wireless innovators to gain traction, build out networks and reach the market in a
 timely manner.
 Philipp Riederer von Paar
 CEO, American Tower Germany

                                                  The economic contribution of the European tower sector | EY | Page 8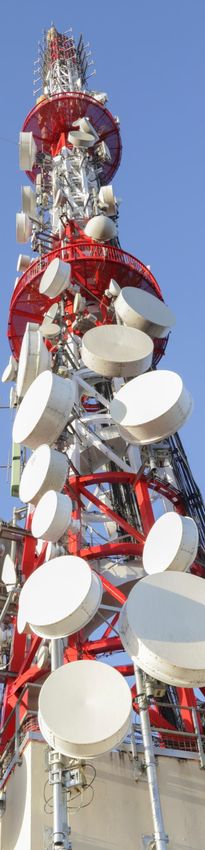
“
Industry participants are recognizing the value
independent TowerCos deliver. This includes the
economical value, which is widely described. There
are further elements though — this relates to the
ecological landscape, as people can benefit from
the coverage without too much impact on the
environment. We also have the financial capacity
to deploy infrastructure as fast as policy makers
and the population expect. Lastly we have deep
industrial knowledge and technical expertise
Alex Mestre
Global Business Director, Cellnex
Independent TowerCos are the most mature model of
wireless infrastructure sharing

The original TowerCos business model blueprint was first conceived in the US in the mid-’90s as an alternative
to captive MNO tower ownership. Since then, the tower industry has become both more diverse and mature.
Today, TowerCo business models differ by region but generally fall under three broad categories.

                            •   MNOs form JVs to pool their passive infrastructure, usually
                                into a third-party company that either manages or owns the
                                assets (e.g., CTIL between Vodafone and Telefonica UK)
 Joint venture              •   JVs offer an alternative model by which MNOs can increase
 TowerCo                        the utilization of their passive infrastructure
                            •   Challenges exist, such as disincentives to share
                                infrastructure with rival MNOs to maintain a competitive
                                advantage in network quality

                            •   TowerCos with 50%+ of equity owned by the parent MNO —
                                usually the result of MNOs carving out and retaining
                                ownership and control of their towers infrastructure (e.g.,
                                Inwit/Telecom Italia or Telxius/Telefonica)
 MNO-controlled
 TowerCo                    •   While more sharing with rival MNOs can be observed, the
                                parents tend to retain a veto right, in particular for strategic
                                sites

                            •   Independent TowerCos own passive infrastructure on a site
                                and lease space on it to MNOs to host their active
                                equipment
 Independent                •   They can either be “pure play” independent TowerCos with
 TowerCo                        no residual equity retained by MNO(s) (e.g., Cellnex,
                                American Tower) or have a minority stake held by an MNO
                            •   TowerCos typically either build the infrastructure, or acquire
                                it from an MNO in sale and lease back transactions

                                                The economic contribution of the European tower sector | EY | Page 10
Market Analysis
There are 421,000 tower sites in Europe today, including rooftops and other larger structures that are used
for wireless communication (but excluding small cells and DAS). This number has been broadly stable over the
past years, with the number of newly built towers offset by decommissioning of duplicate and older towers. In
countries such as France, the UK and Germany, MNOs are in the process of increasing coverage in rural areas,
which results in new tower build programs, often linked to coverage obligations in 5G licenses. 5G in urban
areas will generally require further densification, driving tower growth, estimated at ~1-3% annually for the
next 5 years.
Figure 5: European towers1, selected countries, 2018E (000s)
70
~60% of Europe’s Towers Expected
54
towers located in in Europe growth
47 these 5 countries
43
35
22
421k 1-3%
16
12 12 11 10 10 10
9 8 8 7 7 6 5
4 4 3
2 1 1 1 1 0 0 0 0
Ireland
Iceland
Switzerland
Finland
Sweden
Germany
Norway
Italy
Poland
Belgium
UK
Slovakia
Denmark
Cyprus
Greece
Slovenia
Luxembourg
Spain
Czechia
Hungary
Austria
Croatia
Portugal
Estonia
France
Netherlands
Romania
Lithuania
Latvia
Malta
Liechtenstein
Bulgaria
Table 1: Key players in the European tower sector, 2018E
Market Tower sites1 % sites controlled by Key independent Key MNO-controlled MNOs
independent TowerCos TowerCos and JVs
TowerCos
Altice SFR/KKR Altice, Bouygues, Iliad,
France ~54k 20% ATC, Cellnex, TDF
(Hivory) Orange
Deutsche Funkturm
Deutsche Telekom,
Germany ~70k 3% ATC (incl. Omega Towers),
Vodafone,Telefonica
Telxius
Hutchison, Vodafone,
Ireland ~5k 36% Towercom, WIG -
Eir
Cellnex, EI Towers, Hutchison, TIM,
Italy ~47k 27% INWIT
Rai Way Vodafone, Iliad
Deutsche Funkturm,
Vodafone, Deutsche
Netherlands ~10k 19% Cellnex, NOVEC, WIG Vodafone/Liberty
Telekom, KPN
Global
Axion, Cellnex, MasMovil, Orange,
Spain ~43k 17% Telxius
TelecomClm Vodafone, Telefonica
Swisscom, Sunrise,
Switzerland ~11k 20% Cellnex -
Salt Mobile
Telefonica, Vodafone,
UK ~35k 27% Arqiva, Cellnex, WIG CTIL, MBNL
Hutchison, EE
Europe ~421k 17%
Source: EWIA member companies, Analyst reports, TowerXchange, Ofcom, EY expert interviews, research and analysis
Note: (1) Includes both ground-based and rooftop towers
The economic contribution of the European tower sector | EY | Page 11The share of independent TowerCos has increased to 17%
Figure 6: Share of towers held by TowerCos, by country/region, 2014-2018 (%)
4% 3% 3% 4% 4% 4% 4% 2% 2% 3% 3%
7% 7%
41% 39% 47%
47%
Split not available
55%
62%
61% 61%
81% 87% 82%
15% 16%
24%
21% 25%
23% 47%
32%
28% 28% 27%
17% 20% 17%
13% 15% 11% 14%
3% 3%
Europe Europe Germany Germany France France UK UK Italy Italy Spain Spain
2014 2018 2014 2018 2014 2018 2014 2018 2014 2018 2014 2018
Other MNO captive JV MNO-controlled Independent
The past few years have seen the share of towers controlled by MNOs decline, whilst the share of towers
controlled by independent TowerCos has grown slightly. This has been driven in part by the following:
• MNOs carving out their tower portfolios in separate MNO-controlled TowerCos (e.g., TIM carving out Inwit
in Italy, Altice carving out SFR TowerCo in France)
• Consolidation of MNOs (e.g., the acquisition of E-Plus by Telefonica in Germany)
• MNOs setting up JVs to pool passive infrastructure resources (e.g., Bouygues/SFR JV in France)
• Tower portfolio divestments from MNOs to reduce debt and raise cash for investment in core business
activities, whilst independent TowerCos actively pursue in-organic growth strategies (e.g., Bouygues
selling towers to Cellnex in France)
• Independent TowerCos growing organically and/or building towers in Build-to-Suit programs for MNOs
(e.g., Cellnex building towers for Bouygues in France)
Case study: Bouygues Telecom tower sales
In 2016 Cellnex acquired its first towers portfolio in France from Bouygues
Telecom, a deal followed by other agreements in 2017 and 2018 involving
acquisitions and deployment of more than 5,000 locations until 2022. The deal
allowed Cellnex to keep the expansion of its footprint of towers in Europe. In the
last four years, the company has completed 14 transactions in six countries with
a committed investment of €4b. The transaction brought Bouygues Telecom's
total of divested towers between 2012 and 2017 to 4,466, and was seen as
another step toward streamlining its business and freeing up capital to support
future network rollouts.
Note: “MNO captive” refers to towers owned by MNOs. “Other” refers to tower sites used for wireless networks, but not owned by MNOs, JVs or MNO-
controlled or independent TowerCos (e.g., a water company with a portfolio of multiple water towers used for wireless networks); it excludes structures
which are not (yet) used for wireless networks.
Source: EWIA member companies, Analyst reports, TowerXchange, EY expert interviews, research and analysis
The economic contribution of the European tower sector | EY | Page 12Outsourcing to independent TowerCos in Europe is still low...
In Europe, outsourcing to TowerCos has traditionally been low. This has been due in part to:
• MNOs’ strategies to differentiate in network quality
• Early formation of MNOs sharing JVs, with varying degrees of active and passive sharing
• Limited policy incentives for infrastructure sharing (as compared to the REIT model in the US)
MNOs in Europe perceive network quality, and by extension access to proprietary passive infrastructure, as a
key competitive differentiator. As a result, many MNOs have been hesitant to outsource their entire passive
infrastructure to independent TowerCos. As an alternative, some MNOs have set up MNO-controlled TowerCos
and TowerCo JVs. This has been particularly prevalent in the UK and Scandinavia where the share of JV
owned towers is greater than 50%.
RAN sharing has also been a feature in many European markets. The first major wave of RAN sharing began
with the introduction of 3G, with 4G resulting in a second wave. In countries such as France, regulatory
intervention has compelled MNOs to share RAN and spectrum in rural areas to improve mobile coverage. This
might have reduced the initial need for tower infrastructure expansion, and in turn the growth of independent
TowerCos.
Figure 7: Share of towers held by TowerCos, by country/region, 2018 (%)
4% 3% 4% 4% 2% 3% 4% 4% 3%
7%
13%
41% 39%
47% 47%
55%
33% 61%
61% 76%
15% 16%
24%
32%
21% 25%
23% 47%
36%
28% 27%
20% 19% 20%
17% 17%
3%
Europe Germany France UK Italy Spain Nether- Switzer- Ireland
lands land
Other MNO captive JV MNO-controlled Independent
Note: “MNO captive” refers to towers owned by MNOs. “Other” refers to tower sites used for wireless networks, but not owned by MNOs, JVs or MNO-
controlled or independent TowerCos (e.g., a water company with a portfolio of multiple water towers used for wireless networks); it excludes structures
which are not (yet) used for wireless networks
Source: EWIA member companies, Analyst reports, TowerXchange, EY expert interviews, research and analysis
The economic contribution of the European tower sector | EY | Page 13… In particular when compared to other regions
Despite the share gain, there still remains a substantial gap in independent TowerCo ownership between
Europe and other parts of the world. Countries such as the US have a substantially higher share of towers
owned by independent TowerCos. The regulatory environments have also been broadly more favorable in the
US than in Europe.
Figure 8: Share of towers held by independent TowerCos, by region, 2017 (%)
67%
42%
34%
26%
19%
17%
Europe South and India Sub-Saharan Caribbean and USA and Canada
Southeast Asia Africa Latin America
“Europe still trails other global telecoms markets when it comes to the penetration of
independent infrastructure operators. This is changing rapidly as our more efficient
business model for many types of infrastructure unlocks increased investment and better
connectivity.
Scott Coates
CEO, Wireless Infrastructure Group
Source: EWIA member companies, Analyst reports, TowerXchange, EY expert interviews, research and analysis
The economic contribution of the European tower sector | EY | Page 14“ Neutral host or wholesale-only models could unlock new investment, address some of the 5G deployment challenges and reduce barriers to entry for service providers. UK department for Digital, Culture, Media and Sport Future Telecoms Infrastructure Review
Independent TowerCos achieve higher co-location ratios than
MNOs

Independent TowerCo co-location ratios, an indication for the efficiency of passive wireless infrastructure
utilization, have increased at circa 5% per annum, driven by both MNO PoPs and “other” PoPs — these other
PoPs include PoPs of emergency services networks (also known as public protection and disaster relief —
(PPDR)), fixed wireless access providers, IoT networks, broadcasters on mobile network towers, etc.
Independent TowerCos typically achieve higher co-location ratios than MNOs. The main reason is that the
TowerCo business model fully focuses on building and operating neutral infrastructure and then attracting as
many tenancies as possible. MNOs, in contrast, prioritize their active network and weigh sharing of towers
with their direct competitors against a potential decrease of network differentiation and increased operational
complexity.

Figure 9: Average co-location ratio, Europe, 2018E

                                                                                                                   2.4
               Other PoPs hosted by MNOs are
                estimated to account for less
                  than 0.1 co-location ratio                                                                       0.7           Other PoPs

                                                                           1.3
      Includes MNO captive towers,
          JVs and MNO-controlled
                                                                                                                   1.7           MNO PoPs
         TowerCos in the category                                          1.3
      “MNOs” for the calculation of
       the average co-location ratio

                                                                         MNOs                       Independent TowerCos

Another factor influencing the co-location ratio is the type of tower. Rooftop towers are typically less shared,
while ground-based towers host more operators on average. This is driven by factors such as structure size,
local legislation and the fact that ground-based towers are used more in rural areas, where infrastructure
sharing is an economic imperative.
On average, TowerCos have a co-location ratio of 2.8 on ground-based towers and 1.5 on rooftop towers, with
an overall co-location ratio of 2.4. In contrast, MNOs have an average co-location ratio of 1.5 on ground-based
towers and 1.1 on rooftop towers, with an overall co-location ratio of 1.3.
MNO tower portfolios tend to have more rooftops, while independent TowerCos typically own more ground-
based towers. The ratios vary by country. Due to their neutral host nature and focus on infrastructure sharing,
independent TowerCos still achieve significantly higher co-location ratios on rooftops compared to MNO
rooftops.

Source: EWIA member companies, Analyst reports, TowerXchange, Ofcom, EY expert interviews, research and analysis

                                                                 The economic contribution of the European tower sector | EY | Page 16
Investors value the benefits of the TowerCo model …
Recent tower deals continue to show strong M&A activity in the space, driven by both MNO tower carve-outs
such as Telefonica’s in Germany, and strong acquisition-led growth pursued by independent tower companies
such as Cellnex. In total, the targets of M&A activity since 2015 have had a combined portfolio in excess of
100,000 towers.
Table 2: Selected European TowerCo deals, 2015-2018
Date Seller Buyer/investor Entity/target Key country No. of Purchase Price per
(% share) towers price tower
(€m) (€k)
Publicly listed companies
2018 N/A N/A Cellnex Multiple 28,000 N/A 3111
2018 N/A N/A Inwit Italy 11,000 N/A 3981
Equity deals
Towers of
Morgan Stanley
2018 Altice Portugal Portugal 2,961 495 2233
& HE Partners
(75%)
SFR TowerCo
2018 Altice KKR France 10,198 1,7992 3533
(49.9%)
Telefonica
2017 Telxius KKR Multiple 16,000 1,275 1993
(40%)
Public offering Cellnex
2015 Abertis4 Spain and Italy 15,091 2,138 2153
(MCE) (66%)
Tower sale deals
Cellnex, Swiss
2017 Sunrise N/A Switzerland 2,339 430 184
Life and DTCP
2017 Bouygues Cellnex N/A France 3,000 854 285
2017 Bouygues Cellnex Bouygues France 1,800 4,500 278
2016 Telefonica Telxius Telefonica Germany 2,350 587 250
2016 FPS American Tower FPS France 2,400 607 253
Note: (1) EV/Tower (2) Estimated value (3) Implied price for 100% equity stake (4) Abertis sold 66% of its stake in Cellnex during Cellnex’s 2015 IPO
Source: MergerMarket, TowerXchange, Telecompaper, EY analysis
The economic contribution of the European tower sector | EY | Page 17… Enabling quicker rollouts of new networks, which ultimately
benefits end customers
Case study: Iliad enters Italy more than 10,000 towers owned Figure 10: Iliad potential
by independent tower Howcompanies
did they enter
History site acquisitions and sites
such as Cellnex (which Iliad
Iliad, a major French telecom already has an agreement with
covered by an optional
company, entered the Italian that covers an optional expansion) expansion agreement with
market in May 2018. It had been and EI Towers. Industry experts Cellnex
granted a telecom license by the indicate that Iliad would prefer to
regulator in the wake of the align with third-party towers
12.8k
merger of Wind Telecom and 3 rather than build and maintain its
Italia, which made it the fourth own assets.
Italian MNO.
Consumer impact
7.8k
Market entry
Iliad’s initial offer to consumers
Just four months after the launch has been 30GB of data, unlimited 5.0k
of its Italian mobile business, Iliad voice minutes and unlimited texts
had signed up 2.23m subscribers; for just €6 per month. This has
it has set a target of 25% market been a significant discount
share. Iliad currently relies on a compared to established players
network roaming agreement with such as TIM, which had charged Potential Cellnex Total
Wind-Tre to provide its mobile nearly double that price for similar acquisition agreement
services. However, as it aims to packages. As indicated by Iliad’s
increase its coverage its across rapid customer growth,
Italy, it has the option to acquire consumers in Italy have regarded
5,000 towers in rural and urban Iliad’s entry as a welcome change
areas made redundant by the from the offerings of established
Wind-Tre merger, and to access network providers.
“When a new MNO first started and entered the market, independent TowerCos were the
only ones who went to them and offered to share their infrastructure. There were no
barriers, limits or difficulties preventing them from hosting their equipment on our sites.
Oftentimes MNOs with existing infrastructure have no incentives to accommodate a second
partner.
Paolo Crocetti
Director of Institutional Affairs, EI Towers
Source: MergerMarket, TowerXchange, Telecompaper, EY analysis
The economic contribution of the European tower sector | EY | Page 18Economic
assessment
The market for towers has developed so that rural areas
tend to see less investment in high-quality communications
services. In this context, independent TowerCos play an
important role in enabling a more efficient use of
infrastructure.
There are high fixed costs As a result, the market has
associated with building developed in a way such that
towers, with the cost there are multiple
structure differing in rural overlapping communications
areas compared to urban networks, with multiple
areas. The revenue operators and networks
opportunities are also present in economic areas,
different in rural and urban and undersupply in
areas; the business case for uneconomic (usually rural)
a cell site can be more areas.
challenging in rural areas Rural areas therefore tend to
due to lower population see less investment in
density and potentially lower communications
average incomes. Revenue infrastructure, and can lack
projections for MNOs the coverage and service
indicate muted growth. quality seen in urban areas.
Most MNOs operate a mix of Independent TowerCos play
profitable and unprofitable an important role in enabling
cell sites to ensure they can the telecoms industry to
provide adequate coverage make most efficient use of
to their customers. However, its passive infrastructure.
there is still a link between The higher utilization rates
population density, the cost of independent TowerCos
of rollout and potential reduce the cost per user,
revenues for MNOs. lowering the threshold at
which it becomes profitable
to improve service coverage.
The economic contribution of the European tower sector | EY | Page 19“ Operators sometimes don’t have a viable business case for implementing sites in rural areas on their own. We can provide the infrastructure, and with multiple operators, we can develop a viable business case together. From that perspective, we help to expand the network in more remote areas where coverage obligations are hard to meet. We drive digital connectivity for people in those remote areas. Rosalie Weijers Director Business Development, NOVEC
Independent TowerCos deliver a range of economic
benefits …

Greater outsourcing to independent TowerCos lowers the costs of infrastructure, which
enables faster and cheaper rollout, delivering a range of socio-economic benefits for
consumers and the wider market. Outsourcing also benefits MNOs by freeing up more
capital for investment in coverage and capacity.

                                     Infrastructure can be
  More efficient market              delivered at a lower cost,
  structure                          and unnecessary duplication
                                     of infrastructure is reduced

                                     Sales of towers to
                                     independent TowerCos
  Capital released for MNOS          release capital for
                                     investment in existing
                                     network and new services

                                     Cheaper and faster rollout
  Investment in capacity
                                     to rural areas helps to
  and coverage
                                     address the digital divide

                                     Non-MNO tenants have
                                     more choice, lowering
  Facilitating market entry
                                     barriers to entry, and may
                                     benefit from a neutral host

                                     Due to co-location, fewer
                                     towers are needed to meet
  Environmental benefits
                                     demand — reducing the
                                     visual impact of new towers

                                        The economic contribution of the European tower sector | EY | Page 21
... As outsourcing is advantageous both for consumers and
the wider market
Outsourcing to independent TowerCos can improve coverage in rural areas and capacity in
congested areas. At the same time, the wider market benefits from diversity in tower
ownership and supply.
Bridging the digital divide Case study: Filling coverage gaps
The economics of network rollout mean In 2018, France had over 10,000 rural
that urban areas tend to benefit from the villages where 4G coverage was absent,
best coverage, while rural areas can be left whilst more than 500 villages had no
behind. This is particularly relevant to the network coverage at all. To support mobile
roll out of new technologies, which starts in network operators in filling this coverage
the most densely populated areas before gap, TDF built more than 200 towers along
extending to other parts of the country. transportation axes, in rural areas, and in
Without explicit rollout obligations imposed other network white spots in 2018. This
on MNOs, rural areas, at best, will be included setting up 50 new macro sites last
served later than those in urban areas, October along the Rennes Le Mans
with a poorer quality service or, at worst, trainline to allow the provision of 3G and
will not receive the service at all because it 4G service to commuters. These sites also
is not economic to serve the area. have the potential to be upgraded to
provide 5G coverage at a later date.
Independent TowerCos can reduce the cost
of delivering infrastructure, which enables
faster and cheaper rollout to areas and
households that otherwise could miss out.
Outsourcing can also release capital to
MNOs to invest in improving coverage.
Improving service quality Other wireless networks
Upgrading towers to provide more capacity Diversity of supply of communications
also involves high fixed costs. towers supports more use cases for other
wireless network operators, such as FWA
By lowering the costs of infrastructure,
and IoT providers, facilitating market entry.
outsourcing to independent TowerCos can
make upgrades more economic, improving In turn, this can drive innovation in the
service quality for consumers. services offered to consumers.
The economic contribution of the European tower sector | EY | Page 22Independent TowerCos can realize efficiencies that result in a
lower cost per point of presence
Opex efficiencies Cost of capital savings Higher rates of co-location
Independent TowerCos, for whom Independent TowerCos are Independent TowerCos tend to
the management of the passive typically able to attain finance at have a higher number of users
elements of towers is slightly lower cost of capital than sharing towers (co-location
their core business, typically MNOs — MNOs in the US and ratios).
have more expertise in Europe typically have a Weighted
On average, independent
identifying efficiencies and average cost of capital (WACC)
TowerCos have a co-location
reducing operating expenditure — that is 1.1% higher than that of
ratio of 2.8 on ground-based
for instance, in contract equivalent European TowerCos.
towers and 1.5 on rooftop
negotiations for the site and in
The difference in WACC could towers, with an overall co-
minimizing maintenance costs.
reflect a range of factors. location ratio of 2.4. In contrast,
EY assumes, based on our TowerCos may be seen as a lower MNOs have an average co-
experience of working with MNOs risk, given their greater location ratio of 1.5 on ground-
and TowerCos, the experience in operating towers. based towers and 1.1 on rooftop
opex efficiencies delivered While a tower may be a towers, with an overall co-
by independent TowerCos depreciating asset for an MNO, it location ratio of 1.3.
compared to MNOs to be 10%. is a potential source of long-term
Increased co-location has a major
The impact of this efficiency on revenue from multiple sources
impact on reducing the cost per
overall cost per user for for a TowerCo. Additionally,
user, as it means the significant
independent TowerCos compared TowerCos supply a higher
fixed costs per tower are shared
to MNOs is -3%, as illustrated in number of MNOs, so their returns
between multiple network
Figure 12. are less dependent on the
operators.
success of particular MNOs at the
retail level.
Figure 11: Weighted average cost of capital for MNOs and TowerCos
8.0% 8.0%
8.0%
7.7%
7.5% 7.4%
-19%
-23%
7.0%
6.5%
6.5%
6.2%
6.0%
Vodafone Telefonica Orange S.A. Deutsche Cellnex Inwit
Europe Telekom
Source: EY analysis of broker reports. WACC is nominal and post-tax, calculated using the CAPM approach
The economic contribution of the European tower sector | EY | Page 23A typical point of presence managed by an independent
TowerCo is 46% more efficient
The cost of tower use for a single network is The distribution of the cost savings from
referred to as the cost of providing a “point of independent TowerCos may depend on the pricing
presence.” strategies of the MNOs and the independent
TowerCos. Either the MNOs or the independent
Due to a combination of opex efficiencies, cost of TowerCos could benefit, depending on the level of
capital savings and higher rates of co-location, a mark-up that the independent TowerCos are able to
typical point of presence managed by an charge on their costs.
independent TowerCo is 46% more efficient than
one managed by an MNO. The ability of independent The scope for excessive mark-ups will be
TowerCos to achieve higher rates of co-location is constrained by continued competition between
the primary driver of the differences in efficiency TowerCos (MNO-controlled and independent), and
between independent TowerCos and MNOs, as seen the need for independent TowerCos to maintain a
in the chart below. price advantage compared to own-built
infrastructure. With continued retail competition
This analysis considers the cost of construction of a between MNOs, economic theory suggests that the
tower (including financing over a 10-year period), benefits from the use of TowerCos should
with the cost discounted back to a present value ultimately be passed through to retail consumers,
and shared between the users for a given tower. either through lower retail prices, or higher quality
services.
Figure 12: TowerCo cost saving as percentage of MNO cost per PoP (%)
100%
(3%) (1%)
42%
54%
MNO cost Opex efficiency Cost of capital Increased co- TowerCo cost
saving location
Note: Please note that we have included MNO captive towers, JVs and MNO-controlled TowerCos in the category “MNOs” for this calculation
Source: EY analysis
The economic contribution of the European tower sector | EY | Page 24Greater tower outsourcing could result in an economic saving
of €31b by 2029
Our analysis and assumptions
Our analysis assumes a 3% annual net growth in points of presence over the
next ten years. We have assessed the below two scenarios to understand the
economic savings of greater outsourcing to TowerCos.
MNO-led scenario TowerCo-led scenario
Proportion of towers owned by Proportion of towers owned by
independent TowerCos: 17% — independent TowerCos: 50% —
assumes that the proportion of assumes that a large proportion of
towers owned by independent towers that are controlled by MNOs1
TowerCos remains the same as today are outsourced to TowerCos,
today. but assumes that those towers that
New towers required to meet are part of a joint venture are more
predicted demand: circa 220,000. difficult for MNOs to outsource. Also
assumes that MNOs sell more of their
Total lifetime cost per new point of ground-based towers — 70% of the
presence: €106,567. towers acquired from the MNOs by
the independent TowerCos are
assumed to be ground-based.
New towers required to meet
predicted demand: circa 107,000.
Total lifetime cost per new point of
presence: €70,500.
Economic savings
Based on the above analysis and assumptions, the
aggregate benefit to the economy of the increase in
outsourcing to TowerCos has a present value of
€31b
€31b over the next decade.
Note: Please note that we have included MNO captive towers, JVs and MNO-controlled TowerCos in the category “MNOs” for this calculation
The economic contribution of the European tower sector | EY | Page 25Greater outsourcing would release significant levels of capital
to the MNOS for investment in new technologies like 5G
Capital release
€28b The amount of capital that could be released if
independent TowerCo ownership of towers in
Europe grew from 17% to 50%
In addition to the economic savings, the outsourcing of towers to independent TowerCos can also help MNOs
to release a significant amount of capital: an additional €28b of capital could be released if the rate of
outsourcing in Europe grew from 17% today to 50% in the future. We consider an outsourcing rate of 50% to
be an upper estimate of the level of outsourcing possible in Europe, recognizing that existing joint ventures
between MNOs limit the level of outsourcing to an extent.
MNOs could use this capital to invest in their networks to meet coverage obligations and to help address the
digital divide, and to invest in high-quality networks, as required by society and industry.
The capital released by increased outsourcing of towers could also help to drive forward increased investment
in the infrastructure needed to deliver new technologies. MNO capital expenditure is expected to have to
increase to support the roll out of 5G networks; costs will include upgrading the capacity of existing 4G
networks, investing in new small cell networks, and acquiring spectrum.
“By outsourcing, MNOs can release capital so they can invest in new technologies like fiber
deployment and 5G. It’s going to be very capital intense in the coming years, so they have a
greater interest to outsource the provision of infrastructure to independent TowerCos.
Patrick Boyeaux
CEO, American Tower France
The economic contribution of the European tower sector | EY | Page 26 26Outlook
Successive technological developments have driven mobile usage and data consumption. The roll out of 5G
(Fifth Generation Mobile Network) is expected to “supercharge” this growth by providing completely new
use cases for mobile services.
The main benefits of 5G include faster speeds, lower latency and higher network capacity.
Table 3: Main differences between 4G and 5G technology
Evolution of 4G to 5G
5G “ambition”
Metric 4G/LTE at launch 4G “LTE Advanced” today
(longer term)
Year 2010 2018/19 2020+
Downlink speed 100 Mbps 1,000 Mbps >10,000 Mbps
Latency 100 ms 10 ms 6 GHz,
Carrier bandwidth 20 MHz
(5x20 MHz) multiples)
However, the key differentiator for 5G (vs. 4G) is that it enables deployment of massively more spectrum for
mobile, while making mobile networks more adaptive thanks to a high degree of software and virtualization.
This allows completely new use cases:
Figure 13: Key uses cases of 5G mapped based on potential for ARPU uplift and
certainty of the business case for the use case
Higher data caps Fixed Wireless Access (FWA)
MNOs can offer consumers higher data caps as With 5G, MNOs can offer 5G based FWA
High
a 5G network can offer 10x speeds and data broadband with competing speeds and data
capacity (vs. 4G networks) limits as copper-based broadband products.
For example, Verizon has started offering 5G-
Business case
based FWA broadband service in limited areas
certainty
in the US
Massive IoT Vertical-focused solutions
5G has enhanced capabilities to support Network customizability drives vertical-
massive IoT at very low power as it supports focused use cases. For example, a 5G network
long device operational lifetime and a high can be used for autonomous cars, remote
Low
density of connections surgery, real-time process control,
holographic live call, immersive gaming, smart
cities, public safety, etc.,
Low ARPU increase potential High
Source: Ericsson, 3GPP, GSMA, Qorvo, EY expert interviews and analysis
The economic contribution of the European tower sector | EY | Page 275G rollout will require circa €56b of capital, while revenue is
stagnant
MNOs continue to face a high degree of competition, along with price erosion and broadly flat revenue
projections. This, in conjunction with other high priority investments (e.g., spectrum, network densification),
means MNOs are compelled to consider alternative approaches to 5G network investments.
Overall, MNOs revenue is forecast to remain under pressure, with analysts forecasting flat revenue growth for
MNOs in EU-28* between 2018 and 2023
Figure 14: Mobile service revenue, EU-28*, 2013-23F (€b)
-1% 0%
116 110 110
2013 2018 2023F
However, a study commissioned by the European Commission estimated that 5G deployment in the EU will
require circa. €56b in investments in the radio network and transmission links for MNOs.
Table 4: Main 5G rollout cost drivers and incremental 5G deployment costs, EU-28*
Cost drivers Explanation
MNOs need to upgrade their existing radio access networks
Network with 5G NR (new radio) equipment (in limited cases, MNOs
upgrade could software update the existing 4G LTE equipment if 5G is
deployed on the existing 4G spectrum)
Propagation characteristics of mmWave spectrum used in 5G €56b
Network
implies MNOs would need more tower capacity on macro sites
densification
and small cells in very dense areas
costs
However, MNOs need to upgrade their RAN equipment and
Network
invest in the digital transformation of network to make
virtualization
appropriate use of network virtualization capabilities
Investment in dark fiber based backhaul connectivity is
Fiber backhaul considered crucial due to high data throughput from 5G base
stations coupled with centralized RAN functionality
Note: *Excluding Cyprus, Malta and Luxembourg
Source: Analysys Mason, European Commission, EY analysis
The economic contribution of the European tower sector | EY | Page 28Independent TowerCos’ towers are well suited to
accommodate additional 5G active equipment
The impact of the transition to 5G will depend on the activity at a given site. In most cases MNOs will need to
install new 5G equipment, except where they deploy “light” 5G — independent TowerCos’ towers are better
suited than MNOs’ to accommodate this additional active equipment
• At low capacity sites (which are typically located in rural areas), an upgrade of RRUs to the 5G New Radio
standard may suffice, leading to limited increases in equipment. However, high capacity sites (which are
typically located in urban areas) already have a significantly higher density of active equipment hosted
(antennae and remote radio units); this density is expected to increase further going forward, as
additional 5G antennae and RRUs will need to be installed.
• Independent TowerCos’ towers are typically built to accommodate multiple MNOs with multiple antennae,
whereas MNOs’ towers are typically not built to host a large number of antennae and RRUs. Hence
independent TowerCos will be able speed up the roll out of 5G (and lower the rollout cost), particularly in
dense areas, as MNOs will likely not be able to deploy the number of additional antennae and RRUs needed
on their own towers without fortifying them.
Figure 15: Indicative 5G antennae upgrades, by site activity
Site activity
High case High case — “full” 5G
Typical setup: Typical setup:
• 6 antennas • Same as per
Very high capacity
4G context, with
• Up to 24 RRUs
the addition of 1
• Typically urban 5G antennae
with integrated
RRUs (to
address new
spectrum bands) 2
Low case Low case — “light” 5G
Typical setup: Typical setup:
• 3 antennas • Same antennae as
Minimal capacity
per 4G context
• 3 RRUS
(same spectrum),
• Typically rural upgrade of RRUs
• Typically rural
Today (2G/3G/4G) Future (2G/3G/4G+5G) Timeline
4G and 5G
2G-4G Microwave Remote Radio
antenna transmission dish 5G antenna Backhaul
Unit (RRU)
Note: (1) 3.5 GHz, active antennas, M-MIMO; (2) 26 GHz, active antennas, M-MIMO
Source: EY expert interviews and analysis
The economic contribution of the European tower sector | EY | Page 29Active sharing opens new opportunities for TowerCos to
operate active equipment
MNOs utilize two principal operating models for infrastructure sharing: passive and active. In passive sharing,
MNOs share “passive” infrastructure elements such as tower masts, civil works, fences, shelters, power
supply and cooling systems. In active sharing, MNOs share “active” elements such as RAN equipment.
TowerCos play a role on all of these sharing models.
Figure 16: Types of MNO infrastructure sharing (conceptual)
1 Fully integrated MNO
1 2 3 4
• In the "traditional“ fully integrated model,
each MNO owns and operates all
infrastructure and service layers in-house
Service provision
2 Passive infrastructure sharing
• The simplest form of infrastructure sharing
• Operators agree to share available
infrastructure, including sites and rooftops, Active deep
masts and antenna frames, power and air • Core network
conditioning
• Backbone
3 Active sharing
• In addition to sharing passive assets, • Billing platform
operators typically share all radio access • Value Added
network (RAN) equipment, which is Services systems
incorporated into a single network and then
split into separate core networks (MORAN —
Multi-Operator RAN)
• Further, operators can also share spectrum Spectrum
but not active RAN equipment (MOCN — Multi-
Operator Core Network)
• An even deeper level of active sharing
includes the sharing of core networks,
backbone, billing platforms and Value Added
Services (VAS) systems Active RAN
NetCo
• Outsourcing of active sharing networks is the • Antenna
opportunity for TowerCos to evolve into
NetCos and deliver further economic savings — • Radio equipment
DAS and Small Cells are a step towards this • Backhaul
4 Wholesale
• A single wholesale network involves a single
entity building and operating a network to sell
wireless access to mobile service providers
Passive
• The wholesaler owns the spectrum and
infrastructure, combining passive and active • Sites
TowerCo
TowerCo
TowerCo
network sharing and sells access capacity to • Rooftops
all market operators. All operators in the
market effectively act as Mobile Virtual • Masts and antenna
Network Operators (MVNOs) under this model frames
• This could be the ultimate target for TowerCos • Power
evolving into full NetCos, potentially in rural • Air conditioning
areas first, where economics are most
challenging
The economic contribution of the European tower sector | EY | Page 30Distributed Antenna Systems (DAS) and small cells are
opportunities for TowerCos to offer neutral host active networks
Small cells and DAS technologies are used by MNOs to supplement macro networks where additional macro
sites would be inadequate or cost-prohibitive to ensure reliable coverage in buildings, on campus-type settings
or dense urban areas.
In essence, small cells and DAS are smaller antennae used to augment and densify existing networks.
Figure 17: Typical geographies covered by small cells and DAS
Macro cells
Micro cells
Pico cells
Rural & suburban Urban & campus In-building
Small cells & DAS
Small cells differ from DAS in both the operating model and use case.
Small cells are independent, low power radio elements and typically serve a single MNO. The indoor variant is
typically used in small and middle-sized buildings — commercial venues with limited footfall but still significant
usage volume (e.g., branch offices, restaurants, retail stores).
DAS serve multiple MNOs and are typically suited to high-profile, multi-operator environments characterized
by high user density subscribed to a number of different operators (e.g., airports, stadiums, convention
centers, shopping malls).
DAS are provided by multiple players, including TowerCos, for which they are a logical next step towards
operating entire active neutral host networks.
The economic contribution of the European tower sector | EY | Page 31The European Electronic Communications Code (EECC) reflects
the pro-competitive nature of independent TowerCos
In 2010, as part of the Digital Single Market policy, the Digital Agenda for Europe
defined objectives for connectivity by 2020: basic broadband to all EU households
by 2013, 30 Mbps available to all households by 2020 and subscriptions of at
The European Union least 100 Mbps by at least 50% of households. In 2016, the EU revised the
has a vision for a strategic connectivity targets as part of the Gigabit Society Vision for 2025 to
Gigabit society include (a) Gigabit connectivity for all main socio-economic drivers, such as
schools, transport hubs and main providers of public services, and digitally
intensive enterprises, and (b) all urban areas and all major terrestrial transport
paths to have uninterrupted 5G coverage.
As an intermediate objective for 2020, 5G connectivity is to be available as a
commercial service in at least one major city in each Member State, building on
5G is a catalyst for commercial introduction in 2018. All European households, rural or urban, are to
fulfilling the Gigabit have access to Internet connectivity offering a downlink of at least 100 Mbps,
society aspiration upgradable to Gigabit speed. The required investment is estimated at circa.€500b
of the European over a decade, circa. €155b above the current run rate. Circa. €148b are
Union required for the necessary wireless infrastructure. A share of this additional
investment will flow to independent TowerCos in the form of demand for new
towers, additional PoPs, small cells and fiber-to-the-tower.
The European Union Recognizing the magnitude of the investment required and that the prevailing
established the new regulatory framework from 2002 is no longer appropriate, the EU set out to
EECC as a revise the entire European telecoms regulation, encapsulated in the new EECC. It
framework to adds access to and take-up of very high capacity connectivity as a regulatory
expedite access to objective (alongside existing ones such as promoting competition).
and take-up of high The benefits to the market brought by wholesale-only operators is recognized in
speed connectivity Article 80 EECC.
The EECC’s objectives include:
• Establish key principles for spectrum assignment in the Union, new Union-level
Other important instruments to establish assignment deadlines and license periods (minimum
objectives in the 25 years), and a peer review among national regulators to ensure consistent
EECC relevant for assignment practices — this would result in increased certainty regarding
TowerCos are spectrum licenses and cost for MNOs, enabling more investment in radio
spectrum access networks
harmonization, a
consistent approach • Promote a consistent approach to coverage obligations, to small cell
to coverage deployment and to network sharing, thereby stimulating 5G deployment and
obligations and the rural connectivity — enabling pan-European scale effects and driving demand
establishment of for PoPs, towers and small cells
predictable • Establish predictable regulatory conditions to promote co-investment, JVs and
regulatory wholesale-only business models, facilitating deployment of very high-capacity
conditions networks deeper into suburban and rural areas — increasing certainty for
independent TowerCos (and other independent infrastructure providers such
as open fiber networks) and enabling investments at more predictable returns
Source: European Commission, EY expert interviews and analysis
The economic contribution of the European tower sector | EY | Page 32You can also read