Assessment of trunk flexion in arm reaching tasks with electromyography and smartphone accelerometry in healthy human subjects - Nature
←
→
Page content transcription
If your browser does not render page correctly, please read the page content below
www.nature.com/scientificreports
OPEN Assessment of trunk flexion
in arm reaching tasks
with electromyography
and smartphone accelerometry
in healthy human subjects
Yolanda Castillo‑Escario1,2,3*, Hatice Kumru4,5,6*, Josep Valls‑Solé7, Loreto García‑Alen4,
Joan Vidal4,5,6 & Raimon Jané1,2,3
Trunk stability is essential to maintain upright posture and support functional movements. In this
study, we aimed to characterize the muscle activity and movement patterns of trunk flexion during
an arm reaching task in sitting healthy subjects and investigate whether trunk stability is affected by
a startling acoustic stimulus (SAS). For these purposes, we calculated the electromyographic (EMG)
onset latencies and amplitude parameters in 8 trunk, neck, and shoulder muscles, and the tilt angle
and movement features from smartphone accelerometer signals recorded during trunk bending in
33 healthy volunteers. Two-way repeated measures ANOVAs were applied to examine the effects of
SAS and target distance (15 cm vs 30 cm). We found that SAS markedly reduced the response time
and EMG onset latencies of all muscles, without changing neither movement duration nor muscle
recruitment pattern. Longer durations, higher tilt angles, and higher EMG amplitudes were observed
at 30 cm compared to 15 cm. The accelerometer signals had a higher frequency content in SAS
trials, suggesting reduced movement control. The proposed measures have helped to establish the
trunk flexion pattern in arm reaching in healthy subjects, which could be useful for future objective
assessment of trunk stability in patients with neurological affections.
Trunk stability, defined as the ability to control the position and motion of the trunk, is essential for maintenance
of body balance in the upright position under both static and dynamic conditions1. This requires control of neck,
shoulder, trunk, and pelvic muscles for compensation of external and internal perturbations during loading and
movement2. These control commands, which include anticipatory, accompanying, and compensatory postural
adjustments, are in most instances part of the motor plan, i.e., the package of instructions contained in the
descending volleys issued to perform a given a ction3. Sensorimotor integration in the central nervous system
(CNS) provides for the muscle recruitment patterns needed to achieve an effective task-specific postural control4.
The muscles involved in trunk stabilization during a voluntary movement must work cooperatively, with
different contributions depending on the task being performed. One such task, frequently performed in our
daily routines, is arm reaching for a relatively distant object, requiring some degree of body tilting, while sit-
ting. In these cases, trunk muscles may be activated with a double purpose: they contribute to task execution by
approaching the body to the target and to the postural adjustments needed to maintain the body balance and
prevent destabilization5,6. However, postural disorders and defective control of trunk muscles are frequently
observed in individuals with neurological injuries, such as s troke7–11 or spinal cord injury (SCI)12–14. In these
patients, impaired trunk stability is by itself a major cause of dependency and motor disability, as it limits not
1
Institute for Bioengineering of Catalonia, Barcelona Institute of Science and Technology, 08028 Barcelona,
Spain. 2Department of Automatic Control, Universitat Politècnica de Catalunya-Barcelona Tech (UPC),
08028 Barcelona, Spain. 3Centro de Investigación Biomédica en Red de Bioingeniería, Biomateriales y
Nanomedicina, 28029 Madrid, Spain. 4Fundación Institut Guttmann, Institut Universitari de Neurorehabilitació
Adscrit a la UAB, 08916 Badalona, Spain. 5Universitat Autònoma de Barcelona, Bellaterra, 08193 Barcelona,
Spain. 6Fundació Institut d’Investigació en Ciències de la Salut Germans Trias i Pujol, 08916 Badalona,
Spain. 7Institut d’Investigació August Pi i Sunyer (IDIBAPS), 08036 Barcelona, Spain. *email: ycastillo@
ibecbarcelona.eu; hkumru@guttmann.com
Scientific Reports | (2021) 11:5363 | https://doi.org/10.1038/s41598-021-84789-3 1
Vol.:(0123456789)
www.nature.com/scientificreports/
only the maintenance of static posture and trunk movements but also functional limb movements, such as
reaching tasks and gait15,16.
Numerous clinical tests have been proposed to assess sitting and standing balance after stroke or SCI, such as
the Trunk Control T est17,18, the Trunk Impairment S cale19, and the Modified Functional Reach T est20,21. A limita-
tion of these tests is their qualitative nature, which makes them prone to subjective bias. Quantitative measures
of trunk performance have also been described, which are obtained using biomedical instrumentation, including
force plates to measure changes in the centre of pressure and postural s way22–24, surface electromyography (EMG)
to record muscle activation p atterns25,26, dynamometers to measure trunk s trength14, inclinometers to measure
the lumbar range of motion10, and motion capture systems to obtain kinematic data27. Regarding movement
analysis, smartphone sensors, such as the gyroscope and accelerometer, have been proposed in other applica-
tions as simple cost-effective tools to analyse body movements. For instance, the accelerometer of a smartphone
fixed on the thorax may help to identify physical m ovements28, investigate f alls29, or monitor sleep position
30
overnight . In this study, we considered to use a smartphone accelerometer to monitor trunk tilting during an
arm reaching task while sitting.
The potentially destabilizing effect of the described task could be increased if a startling auditory stimulus
(SAS) is concomitantly applied. The startle response is a sudden involuntary defensive response to unexpected
or threatening stimuli. This basic physiological reaction, which is common to all mammals, has a protective
function against injury31. Nevertheless, it has been shown that when a SAS is applied together with the impera-
tive signal in a simple reaction time task experiment, i.e., when subjects are fully prepared for task execution,
reaction time is significantly shortened, a phenomenon known as StartReact32,33. The StartReact effect has been
described in simple tasks, such as reaching arm m ovements31,33, ballistic wrist flexion and e xtension32, finger
movements34, or head flexion and r otation35. It has also been reported in complex manoeuvres, such as sit-to-
stand36, step i nitiation37, obstacle avoidance during w alking38, self-induced f alls39, and others. In these manoeu-
vres, the latency shortening in the activation of muscles engaged in postural adjustments is proportional to the
shortening occurring in prime movers.
Although the StartReact phenomenon has long been studied in the literature, there are very few works on
trunk muscles or trunk m ovements36,40, and none on an arm reaching task requiring body tilting. In performing
such task, many trunk muscles would be engaged in postural adjustments to avoid trunk destabilization. There
is a possible conflict between the generation of a reflex response to SAS, which would lead to a protective pat-
tern of activation of trunk muscles, and the execution of the voluntary command, accelerated by the SAS, which
would lead to a recruitment in accordance with the motor program. Testing the addition of a SAS to our task
has a twofold purpose: to investigate the response of axial muscles engaged in postural control in a StartReact
paradigm, and to serve as an unexpected stimulus to unbalance the body and thus examine the compensatory
reaction of trunk muscles. Based on the previous literature, we hypothesize that a SAS will shorten the response
time, but it is unclear if this will also induce a change in the recruitment pattern of postural muscles with potential
consequences in trunk stabilization.
The main objectives of this study are to establish the patterns of trunk muscles activation during trunk flexion
in an arm reaching task in healthy subjects and to determine whether target distance and/or SAS application in
the context of a StartReact paradigm has any destabilizing effects. For these purposes, we analysed EMG and
smartphone accelerometer signals recorded during forward and backward trunk bending in sitting healthy
volunteers reaching for a switch button. This approach will contribute to characterize trunk movement patterns
in healthy subjects. The task we selected was in sitting position, so that the test could eventually be applied to
wheelchair-bound hemiplegic, paraplegic, and tetraplegic patients, in whom the disequilibrium related to body
tilting is a relevant handicap and an important goal of rehabilitation.
Methods
Participants. Thirty-three healthy subjects were enrolled in this study (17 males and 16 females, aged 20
to 61 years, mean age 38 years). All but one were self-reported right-handers, and all of them were free from
neurological and musculoskeletal disorders.
The study was conducted at the Institut Guttmann, Badalona, Spain. The protocol was approved by the Ethics
Committee of the Institut Guttmann, and written informed consent was obtained from all the participants prior
to the experiment. Research was carried out in accordance with the standards of the Declaration of Helsinki.
Experimental protocol. During the experiments, subjects were sitting in a wheelchair facing a wall. The
initial position was at rest, with the back straight and the arms relaxed and resting on the chair’s armrests. The
subjects’ task consisted of raising the left arm and, by tilting the trunk forward, touch a 2 cm diameter red circle
in the centre of a switch button attached to the wall and immediately return to their initial position (Fig. 1). They
were requested to do that as fast as possible in response to an imperative signal (IS), which was a low intensity
electrical stimulus (3.6 mA, 0.2 ms duration) applied to the subject’s right little finger. The IS was delivered a few
seconds (1–5 s) after a verbal forewarning to be ready. The chair was positioned and, then, fixed, in such a way
that the switch was centred on the subject’s midline and the distance between the switch and the subject’s index
fingertip when the left arm was fully extended horizontally was either 15 cm or 30 cm.
Each participant repeated the same manoeuvre 20 times (20 trials) at each distance (15 and 30 cm). In five
randomly selected trials, a startling auditory stimulus (SAS) was presented at the same time as the IS. The SAS
was produced by the discharge of a magnetic coil on top of a metallic platform at maximum stimulator output41
(sound intensity of 125 dB, 250 ms duration). Therefore, we had two different conditions: startling auditory
stimulus (‘SAS’, 5 trials per subject), and baseline movement (‘non-SAS’, 15 trials per subject). Subjects had
Scientific Reports | (2021) 11:5363 | https://doi.org/10.1038/s41598-021-84789-3 2
Vol:.(1234567890)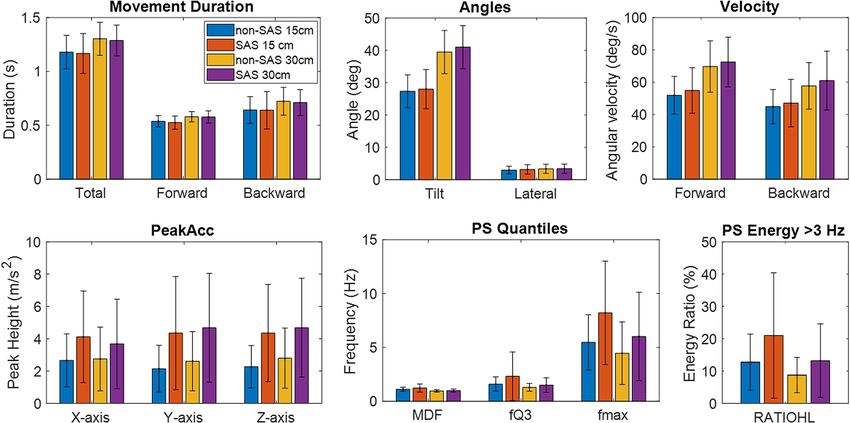
www.nature.com/scientificreports/
Figure 1. Schematic representation of the subject’s task. The subject is sitting in a wheelchair, and the initial
position is at rest, with the arms on the chair’s armrests (a), at a distance ‘d’ (15 cm or 30 cm) from the target
switch button (b). Following a go-signal, the subject raises the left arm and bends the trunk forward to press
the button (c). A smartphone is attached to the subject’s thorax to collect accelerometer data. The X, Y, and Z
directions of the accelerometer are shown.
already been warned that some trials could be accompanied by an additional stimulus that they should disregard,
but they were naïve to the hypothesis being tested.
Data acquisition. We recorded the EMG activity of eight shoulder, neck, and trunk muscles on the left
side of the body: sternocleidomastoid (SCM), middle deltoid (DEL), trapezius (TRA), pectoralis major (PECT),
upper abdominal Th6 (ABD), and paraspinal muscles at cervical C3 (PC), thoracic T6 (PT), and lumbar L2
(PL) levels. Disposable adhesive surface electrodes (outer diameter 20 mm; Technomed) were attached over the
muscle belly, and the EMG signals were collected using a ten-channel EMG system (Synergy, VIASYS Healthcare
UK Ltd., 2005) at a sampling rate of 10 kHz. The ground electrode was placed on the left forearm. In addition,
two extra channels were acquired synchronously with the same equipment: the EMG of the left orbicularis oculi
muscle (OOc), to detect the blink reflex, and the artifact coming from the wired switch button. This signal was
used to calculate the time to complete the task, i.e., the time from the IS to the button press, which we will refer
to as the response time. Recording epochs had a duration of 3 s, starting 600 ms before the IS to evaluate relaxa-
tion of all muscles before the experiment.
In addition to the EMG recordings, trunk acceleration was measured by the triaxial accelerometer of a
smartphone (Samsung Galaxy S5), which was attached to the subjects’ thorax with an elastic band, in the centre
of the chest over the sternum, at thoracic 3–4 level (Fig. 1). The accelerometer x-axis was in the medial–lateral
direction, the y-axis in the superior-inferior, and the z-axis in the anteroposterior direction. Accelerometer data
were sampled at 200 Hz and stored on the phone’s internal memory. Data from smartphone in one participant
were lost due to technical problems, so this subject had to be excluded from accelerometry analysis.
Data processing and analysis. We used the activity of the SCM as a startle indicator, as it has been
reported that the presence of short latency SCM activation is a more robust indicator of the effectiveness of
SAS activation of the reticulospinal system than the O Oc42. For this reason, we separated the SAS trials into
those where the SCM was activated within 120 ms of the SAS (SCM≤120 ms), or later than 120 ms (SCM>120 ms),
as suggested in previous works42,43. We compared the onset latencies of all muscles in non-SAS, SCM≤120 ms, and
SCM>120 ms trials, to check if this criterion applied to our task (see Statistical Analysis section below).
Data were processed and analysed using custom software in Matlab (r2018a, Mathworks Inc.) and R (version
3.6.2; http://www.r-project.org).
EMG. EMG recordings were band-pass filtered between 40 and 500 Hz to remove movement artifacts, and a
notch filter was applied to remove power line interference (50 Hz and harmonics). EMG recordings contami-
nated by artifacts were manually discarded.
We calculated the EMG onset latencies as the time from the IS to the onset of EMG activity in each muscle.
For this purpose, we used an algorithm developed by our group for automatically detecting the EMG o nsets44,
which is based on the ratios of consecutive peaks of the Teager–Kaiser Energy Operator (TKEO)45,46. All onsets
were visually inspected and manually adjusted, if necessary, to correct for any inaccuracies.
To obtain the EMG envelopes, the signals were full wave rectified, and lowpass filtered at 20 Hz. Then, in
addition to the onset latencies, we calculated the following features across each trial and muscle: peak amplitude
and area under the curve of the EMG envelope, used as EMG amplitude estimators; and centre of gravity (CoG),
defined as the time from the IS to the point where the cumulative energy curve of the EMG envelope reaches the
50% of the total energy, used as another estimator of the temporal distribution pattern of each muscle. Therefore,
we had a total of 32 EMG features (4 features × 8 muscles) for each trial in each subject.
Scientific Reports | (2021) 11:5363 | https://doi.org/10.1038/s41598-021-84789-3 3
Vol.:(0123456789)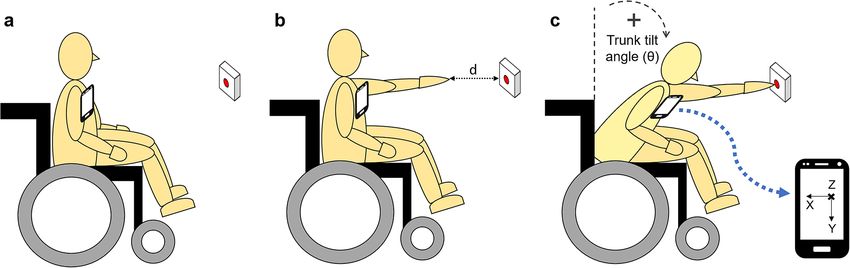
www.nature.com/scientificreports/
Figure 2. Example of the raw trunk tilt angle signal, θ, derived from the triaxial accelerometry of the
smartphone (a), the power spectrum of this angle signal (b), and the z-axis accelerometer data showing the peak
at the beginning of the movement (PeakAccZ) for non-SAS trials (black) and SAS trials (red) (c).
Accelerometry. Triaxial accelerometry was used to estimate the trunk tilt angle (angle in the sagittal plane) and
lateral angle (angle in the coronal plane). As the movement was mainly rotational, we assumed that linear accel-
eration was negligible, so the tilt (θ) and lateral (φ) angles at each time point, with respect to the vertical axis of
the body, could be derived as follows:
−1 az − π,
θ = cos � (1)
2
a +a 2 2
y z
π a x
ϕ = − cos−1 � , (2)
2 a2 + a2 x y
where ax, ay, and az are the values of the x, y, and z axes of the accelerometer, respectively, at each time point, and
the angles, θ and φ, are expressed in radians. Defined in this way, θ > 0 corresponds to forward tilt, and θ < 0 to
backward tilt, while φ > 0 represents a lateral deviation to the right, and φ < 0 to the left.
Next, we extracted different features from the angle signals of each trial. First, the angle signals were lowpass
filtered below 2 Hz, to reduce high-frequency noise. The maximum absolute value of the lateral angle was taken
as a measure of the trunk lateral deviation from the central sacral line. From the tilt angle signal, we calculated the
maximum tilt angle (i.e., trunk forward inclination angle), the total movement duration, and the durations and
angular velocities of the forward movement (from the beginning of the movement to the time of the maximum
tilt angle) and the backward movement (from the time of the maximum tilt angle to movement end) (Fig. 2a).
We also computed the power spectrum (PS) of the raw tilt angle signal of each trial as the squared magnitude
of the Fast Fourier Transform (FFT) (Fig. 2b). This was used to extract spectral features such as the median
frequency, third quartile frequency (fQ3), 95th percentile frequency (fmax), and the ratio between the energies
in the frequency bands > 3 Hz and ≤ 3 Hz (RATIOHL).
Moreover, as we were interested in the initiation of the movement, we measured the maximum peak-to-peak
distance in the first 200 ms of the signals from the three accelerometer axes, as illustrated in Fig. 2c. We will refer
to these features as PeakAccX, PeakAccY, and PeakAccZ.
Statistical analysis. Data were averaged across trials to obtain a single measure for each variable and sub-
ject at each distance (15 cm vs 30 cm) and condition (non-SAS vs SAS). We then calculated the group mean and
standard deviation (SD) to report descriptive statistics of each feature across distance and condition. Results are
reported as Mean (SD).
First, we investigated whether the early activation of SCM was a reliable indicator of the startle reflex in
our task, in which the SCM is also involved in the neck movement that accompanies trunk flexion. To do that,
multiple pairwise Wilcoxon tests were run to compare the onset latencies of all muscles in non-SAS, SCM≤120 ms,
and SCM>120 ms trials at each distance, and thus decide whether it was appropriate to disregard S CM>120 ms trials,
depending on whether they also induced a latency shortening. After that, only two conditions (non-SAS vs SAS)
were considered, since there were too few subjects with SCM>120 ms trials to maintain the three categories in the
main analysis described below.
A two-way repeated measures ANOVA was applied to each variable, to investigate the effects of distance,
condition, and the interaction between distance and condition. Q-Q plots were used to determine if the residu-
als were approximately normally distributed. The level of significance in all the statistical tests was set to 0.01
in order to restrict the number of false positives, since we are dealing with a large number of parameters (47
parameters in total: 1 the response time from the switch button, 14 from the accelerometer, and 32 from the
EMG) at 2 distances (15 cm/30 cm) and 2 conditions (non-SAS/SAS).
Scientific Reports | (2021) 11:5363 | https://doi.org/10.1038/s41598-021-84789-3 4
Vol:.(1234567890)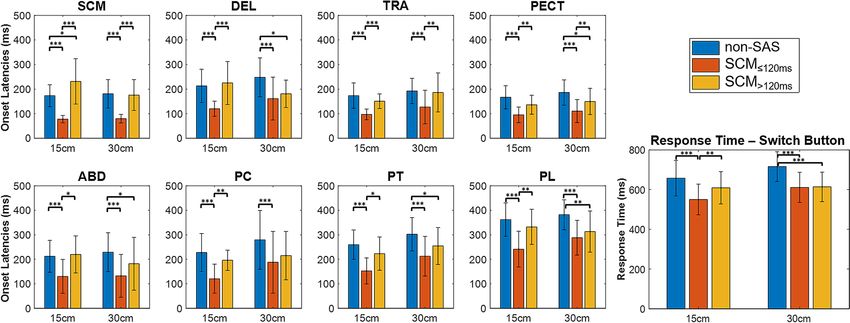
www.nature.com/scientificreports/

                                  Figure 3.  Example of the signals recorded during the trunk movement task at 15 cm. From top to bottom:
                                  EMG recordings of the OOc, SCM, DEL, TRA, PECT, ABD, PC, PT, and PL; artifact signal from the switch
                                  button, indicating the response time, and trunk tilt angle (θ) derived from the smartphone accelerometer. Small
                                  black dotted lines indicate the onset latencies of each muscle. The vertical dotted lines indicate the imperative
                                  signal (IS) (red), and the button press time (black). The response time until the button press is indicated with
                                  green arrows. The red arrows indicate the duration of the forward movement (DurAcc_Forw) and the total
                                  duration of the movement (DurAcc_Total) measured from the accelerometer data.

                                      For the variables showing statistically significant differences between non-SAS and SAS condition, we calcu-
                                  lated the percentage change for each subject, and then the mean and standard deviation of percentage change. We
                                  also calculated the percentage of subjects presenting at least a 5% and a 10% difference in that feature, to evaluate
                                  whether the differences in the average values were consistent and repeatable across subjects.
                                      The correlation of the startle changes in each of the variables with age and gender were analysed with Spear-
                                  man’s rank correlation coefficient and Mann–Whitney U-test, respectively.

                                  Results
                                  Characteristics of EMG activity and movement description. All subjects performed the task with-
                                  out difficulty. Because of artifact contamination, data of ABD from one participant and of PC from another
                                  participant were excluded from the analysis. Examples of the signals recorded in a non-SAS and a SAS trial are
                                  shown in Fig. 3. The trunk tilt angle (θ) indicates the movement trajectory: from a resting position, the subjects
                                  first moved slightly backward, as indicated by angle values below the baseline, and then they flexed the trunk
                                  forward until reaching the maximum tilt angle when pressing the switch button. Finally, they moved backward
                                  to the original position.
                                      The muscle recruitment pattern looked qualitatively similar in non-SAS and SAS trials: the neck and shoulder
                                  muscles (SCM, DEL, TRA, and PECT) were activated first and reached their maximum activity in the early phase
                                  of the movement. The ABD showed a prolonged low activity burst. The PC, PT, and PL muscles were activated
                                  sequentially in that order. The SAS elicited a blink reflex in 90% of the SAS trials in the dataset, evidenced in the
                                  EMG of the OOc as a short high amplitude burst within the first 45 (10) ms.

Scientific Reports |   (2021) 11:5363 |                https://doi.org/10.1038/s41598-021-84789-3                                                    5

                                                                                                                                                Vol.:(0123456789)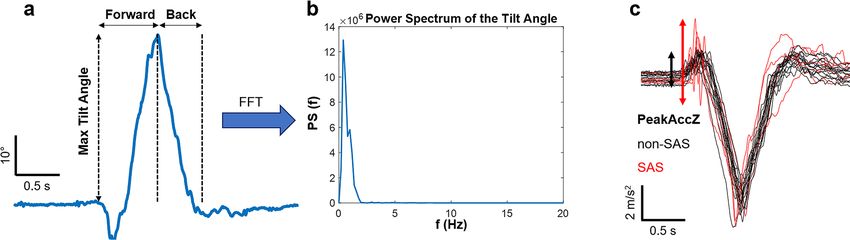
www.nature.com/scientificreports/
Figure 4. Barplots showing the response time (switch button) and onset latencies of the 8 muscles, in non-SAS
trials (blue), and SAS trials with or without an early response in SCM (red: S CM≤120 ms, yellow: S CM>120 ms).
Mean and standard deviation of the total values in the dataset are shown. Statistical significance levels for
pairwise comparisons using Wilcoxon tests are shown: 0.05*, 0.01*, 0.001***. Only the S CM≤120 ms trials show
significant reductions in all the muscle onset latencies and the response time.
As exemplified in Fig. 3, the SAS reduced the response time, as well as all the muscle onset latencies. However,
this only happened when an early response (≤ 120 ms) was observed in the SCM, i.e., in S CM≤120 ms trials, as
shown in Fig. 4. For this reason, the SCM response proved to be an effective startle indicator and, from this point
on, the S CM>120 ms trials were discarded since consistent startle responses were not elicited in these trials. There-
fore, all the results for the SAS condition include only SCM≤120 ms trials. This S CM≤120 ms response was present in
78% (129 trials) of the SAS trials in the dataset. Out of the 33 participants, 23 showed a SCM≤120 ms response in
at least 80% of the trials, while 5 only showed a SCM≤120 ms response in less than half of the trials (including both
distances). Data from participants with less than two SCM≤120 ms trials at each distance were excluded from further
analysis: for the distance of 15 cm, four subjects were discarded, while, at 30 cm, only one subject was discarded.
Table 1 shows a summary of all data and the results of comparative statistical tests (two-way repeated measures
ANOVA) for differences related to condition (SAS vs non-SAS) and target distance (30 cm vs 15 cm). Table 2
shows the mean percentage change in response time and each EMG and accelerometer feature showing statis-
tically significant differences (p < 0.01) between non-SAS and SAS trials, as well as the percentage of subjects
showing differences > 5% or > 10% in SAS with respect to non-SAS values.
Effect of target distance. The response time was longer at 30 cm than at 15 cm, as the target was further
away. Muscle latencies and CoG, measured in milliseconds from the IS, tended to be longer as well, but signifi-
cant changes were found only for the DEL and the three paraspinal muscles in both parameters, and the TRA
and PECT for onset latencies alone (all p ≤ 0.005). On the other hand, the EMG amplitude estimators showed
larger values at 30 cm compared to 15 cm, with statistically significant differences at a level of 0.01 in all muscles
(p ≤ 5 × 10⁻⁵) except for the peak amplitude of PECT (p = 0.508) and ABD (p = 0.045).
Data from the smartphone accelerometer showed that all subjects performed straightforward movements,
with minimal lateral deviation, always < 5°. The trunk tilt angles reached during the movement were higher
at 30 cm than at 15 cm, with mean values of 27 (5)° in non-SAS trials and 28 (6)° in SAS trials at 15 cm, in
contrast to 39 (7)º in non-SAS trials and 41 (7)° in SAS trials at 30 cm. The total movement duration, as well
as the durations of both forward and backward phases, increased with the distance (p ≤ 3 × 10⁻⁸), as the sub-
jects were further away from the target. Subjects were faster on trials at 30 cm, as denoted by the increase in
angular velocities (p ≤ 4 × 10–12). The size of the peak in the first 200 ms for each of the three accelerometer axes
(PeakAccX, PeakAccY, and PeakAccZ) did not change with target distance (p ≥ 0.03). The frequency content
of the accelerometer signal was lower in the movements at 30 cm than at 15 cm, according to all the extracted
spectral parameters (p ≤ 0.003).
Effect of the startling stimulus. The response time, i.e., time of button press, was significantly reduced
in SAS vs non-SAS trials: 554 (75) ms vs. 650 (85) ms at 15 cm, and 615 (73) vs. 721 (74) ms at 30 cm (p 5%, and more than 81% had differences > 10% for
all muscles. This is illustrated in Fig. 5, which shows the onset latencies in SAS and non-SAS conditions for all
subjects and muscles, both at 15 cm and 30 cm. Note that, as shown in Fig. 5, the pattern of muscle recruitment
does not seem modified with distance or condition: the SCM is the first muscle to be activated, followed by the
PECT and TRA, then the DEL and ABD, and, finally, the sequential activation of the PC, PT, and PL. However,
Scientific Reports | (2021) 11:5363 | https://doi.org/10.1038/s41598-021-84789-3 6
Vol:.(1234567890)www.nature.com/scientificreports/
Mean (SD) 15 cm Mean (SD) 30 cm p-values F-statistic
Parameter non-SAS SAS non-SAS SAS Startle Distance Startle Distance
Switch button
Response time (ms) 650 (85) 554 (75) 721 (74) 615 (73) < 0.001 < 0.001 136.37 42.45
EMG—onset latencies (ms)
SCM 168 (43) 77 (15) 180 (59) 79 (17) < 0.001 0.291 239.61 1.13
DEL 202 (59) 119 (31) 246 (81) 162 (89) < 0.001 < 0.001 105.2 17.63
TRA 165 (47) 96 (22) 191 (51) 123 (66) < 0.001 0.002 67.04 9.85
PECT 161 (45) 95 (32) 187 (53) 111 (47) < 0.001 0.005 128.28 8.44
ABD 202 (60) 128 (69) 229 (82) 131 (89) < 0.001 0.584 74.85 0.3
PC 223 (79) 121 (60) 278 (121) 187 (128) < 0.001 < 0.001 68.37 17.7
PT 251 (56) 150 (52) 300 (66) 208 (78) < 0.001 < 0.001 115.01 31.83
PL 350 (63) 246 (70) 379 (60) 285 (70) < 0.001 0.003 123.95 9.31
EMG—CoG (ms)
SCM 668 (143) 570 (167) 691 (95) 613 (132) < 0.001 0.19 38.74 1.75
DEL 576 (110) 483 (95) 640 (89) 543 (88) < 0.001 < 0.001 101.96 27.64
TRA 714 (123) 619 (137) 721 (99) 627 (106) < 0.001 0.901 90.73 0.02
PECT 609 (152) 502 (150) 655 (135) 537 (132) < 0.001 0.126 81.98 2.38
ABD 726 (139) 607 (147) 757 (150) 657 (170) < 0.001 0.147 52.17 2.15
PC 682 (122) 587 (143) 745 (150) 638 (133) < 0.001 0.003 79.05 9.5
PT 730 (97) 632 (88) 790 (97) 675 (105) < 0.001 0.001 122.03 11.46
PL 694 (95) 599 (106) 756 (92) 663 (90) < 0.001 < 0.001 51.57 17.09
EMG—areas (μV s)
SCM 30 (17) 36 (21) 39 (21) 45 (24) < 0.001 < 0.001 21.12 45.98
DEL 242 (118) 264 (139) 341 (164) 348 (171) 0.097 < 0.001 2.82 106.02
TRA 127 (83) 138 (89) 169 (113) 174 (114) 0.152 < 0.001 2.08 70.92
PECT 58 (42) 67 (46) 79 (58) 84 (64) 0.005 < 0.001 8.32 18.63
ABD 21 (17) 25 (17) 30 (27) 34 (28) 0.013 < 0.001 6.39 18.26
PC 28 (28) 34 (39) 41 (34) 46 (39) 0.001 < 0.001 10.91 35.08
PT 40 (24) 46 (32) 52 (25) 53 (28) 0.063 < 0.001 3.56 32.91
PL 20 (8.6) 20.4 (9.2) 29 (10) 30 (10) 0.652 < 0.001 0.21 93.59
EMG—peak amplitudes (μV)
SCM 102 (63) 133 (78) 133 (88) 155 (81) < 0.001 < 0.001 22.49 26.92
DEL 834 (512) 967 (524) 1114 (578) 1170 (583) < 0.001 < 0.001 12.81 82.86
TRA 402 (245) 485 (284) 499 (346) 564 (375) < 0.001 < 0.001 15.44 37.51
PECT 212 (137) 321 (275) 256 (142) 321 (208) < 0.001 0.508 18.68 0.44
ABD 88 (120) 99 (92) 115 (171) 138 (170) 0.22 0.045 1.53 4.16
PC 100 (105) 119 (112) 145 (129) 161 (138) 0.051 < 0.001 3.93 15.66
PT 141 (108) 163 (113) 170 (104) 190 (119) < 0.001 < 0.001 11.74 28.99
PL 87 (42) 88 (38) 118 (59) 120 (50) 0.83 < 0.001 0.05 49.44
Accelerometry
Duration (s) 1.17 (0.16) 1.16 (0.18) 1.31 (0.15) 1.28 (0.14) 0.41 < 0.001 0.69 37.12
Duration forward (s) 0.53 (0.05) 0.53 (0.06) 0.58 (0.05) 0.58 (0.06) 0.466 < 0.001 0.54 38.98
Duration backward (s) 0.63 (0.12) 0.63 (0.16) 0.72 (0.12) 0.71 (0.12) 0.507 < 0.001 0.44 20.73
Max. trunk tilt angle (°) 27.3 (5) 27.9 (6.2) 39.2 (6.6) 41 (6.8) 0.039 < 0.001 4.4 420.39
Max. lateral deviation (°) 3 (1.2) 3.1 (1.4) 3.4 (1.4) 3.4 (1.4) 0.638 0.023 0.22 5.38
Forward velocity (°/s) 52 (11) 54 (14) 69 (16) 72 (16) 0.029 < 0.001 4.9 170.2
Backward velocity (°/s) 46 (11) 48 (15) 57 (15) 61 (18) 0.075 < 0.001 3.26 64.83
PeakAccX (m/s 2) 2.7 (1.7) 4.1 (2.9) 2.7 (2) 3.6 (2.8) < 0.001 0.461 41.3 0.55
PeakAccY (m/s2) 2.2 (1.5) 4.3 (3.6) 2.6 (1.9) 4.6 (3.4) < 0.001 0.057 76.94 3.72
PeakAccZ (m/s2) 2.2 (1.2) 4.2 (2.9) 2.6 (1.6) 4.5 (3) < 0.001 0.034 72.99 4.64
Median frequency (Hz) 1.13 (0.2) 1.23 (0.38) 0.96 (0.11) 0.99 (0.14) 0.028 < 0.001 5.03 38.29
fQ3 (Hz) 1.59 (0.67) 2.3 (2.3) 1.28 (0.37) 1.49 (0.68) 0.01 0.003 6.94 9.62
fmax (Hz) 5.4 (2.6) 8.1 (4.8) 4.3 (2.9) 5.9 (4.1) < 0.001 < 0.001 44.16 18.08
RATIOHL (%) 12.7 (8.8) 21 (20) 8.7 (5.6) 13 (11) < 0.001 < 0.001 18.56 13.96
Table 1. Outcome measures in non-SAS and SAS trials, both at 15 cm and 30 cm. The first four columns show
the Mean (SD) for each condition, and the last four columns show the results of the statistical analysis, using two-
way repeated measures ANOVA with Startle effect and Distance as factors. p-values < 0.01 are highlighted in bold.
Scientific Reports | (2021) 11:5363 | https://doi.org/10.1038/s41598-021-84789-3 7
Vol.:(0123456789)www.nature.com/scientificreports/
Mean (SD) % Subjects % Subjects
Percentage showing showing
Change differences > 5% differences > 10%
p-value Startle factor Differences: Higher ( >) or
Parameter ANOVA Lower ( >) in SAS trials 15 cm 30 cm 15 cm 30 cm 15 cm 30 cm
Switch button
Response time (ms) < 0.001 < 15 (7) 15 (8) 97 78 77 72
EMG—onset latencies (ms)
SCM < 0.001 < 52 (14) 52 (16) 100 100 100 100
DEL < 0.001 < 37 (19) 35 (20) 97 91 90 88
TRA < 0.001 < 38 (20) 31 (48) 93 88 93 88
PECT < 0.001 < 39 (16) 40 (19) 97 94 97 94
ABD < 0.001 < 36 (31) 42 (26) 93 90 89 90
PC < 0.001 < 44 (21) 36 (26) 93 94 93 91
PT < 0.001 < 39 (20) 30 (24) 97 88 93 81
PL < 0.001 < 30 (16) 25 (15) 90 91 90 84
EMG—CoG (ms)
SCM < 0.001 < 15 (10) 12 (13) 90 78 67 59
DEL < 0.001 < 16 (7) 15 (9) 93 84 87 75
TRA < 0.001 < 14 (9) 13 (8) 87 91 63 75
PECT < 0.001 < 18 (10) 18 (12) 87 91 80 81
ABD < 0.001 < 17 (12) 14 (13) 79 84 79 74
PC < 0.001 < 14 (10) 14 (6) 83 97 77 72
PT < 0.001 < 13 (6) 14 (10) 87 88 73 72
PL < 0.001 < 14 (8) 12 (10) 97 88 70 56
EMG—areas (μV s)
SCM < 0.001 > 20 (23) 18 (24) 67 75 63 59
PECT 0.005 > 15 (21) 8 (22) 57 56 40 41
PC 0.001 > 20 (26) 12 (15) 70 63 57 47
EMG—peak amplitudes (μV)
SCM < 0.001 > 34 (32) 26 (42) 90 69 83 63
DEL < 0.001 > 19 (21) 7 (15) 77 44 63 28
TRA < 0.001 > 25 (27) 15 (15) 83 78 73 56
PECT < 0.001 > 44 (42) 27 (45) 90 75 90 59
PT < 0.001 > 18 (23) 14 (22) 77 66 63 59
Accelerometry
PeakAccX (m/s2) < 0.001 > 58 (74) 37 (48) 86 74 83 74
PeakAccY (m/s2) < 0.001 > 95 (79) 83 (65) 93 97 93 97
PeakAccZ (m/s2) < 0.001 > 89 (64) 73 (63) 97 94 97 81
fQ3 (Hz) 0.01 > 31 (63) 15 (26) 59 48 45 39
fmax (Hz) < 0.001 > 47 (40) 41 (71) 90 71 90 65
RATIOHL (%) < 0.001 > 55 (67) 46 (72) 83 71 79 68
Table 2. Mean percentage changes with respect to non-SAS values, and percentage of subjects showing at least
5% and 10% differences, for all the features showing statistically significant differences (p < 0.01) between non-
SAS and SAS trials, at 15 cm and 30 cm.
this was not quantified and was therefore not confirmed statistically. The CoG were also significantly reduced
for all muscles (p ≤ 2 × 10⁻⁸), but the magnitudes of the differences were lower than those of EMG onset latencies,
with mean percentage reductions between 12 and 18% (Table 2). The onset latencies indicate when each muscle
is activated, whereas the CoG indicate when they reach the 50% of their total energy, and thus give an idea of
how the activity of this muscle is distributed along the movement. In all distances and conditions, the earlier
CoG occurs in shoulder muscles, DEL and PECT. These are followed by two neck muscles, SCM and PC, and
finally the scapular and trunk stabilizers, TRA, ABD, PL, and PT (Table 1).
The mean values of the EMG amplitude estimators were higher in SAS than in non-SAS trials for all muscles,
but differences were only significant for SCM and PECT for both the area and peak amplitude, in addition to the
area of PC, and the peak amplitude of DEL, TRA, and PT (all p ≤ 0.005). The increase in EMG amplitude estima-
tors was found in a smaller proportion of subjects (Table 2), showing much less consistency than the reduction
of latencies. The peak amplitudes of SCM and PECT had the highest mean percentage changes (≥ 26%), and
they were present in the highest number of subjects (between 59 and 90% of the subjects had differences > 10%).
Scientific Reports | (2021) 11:5363 | https://doi.org/10.1038/s41598-021-84789-3 8
Vol:.(1234567890)www.nature.com/scientificreports/
Figure 5. Onset latencies for the eight muscles and all the subjects, during the trunk movement task in non-
SAS and SAS trials, at 15 cm (black) and 30 cm (blue). Each dotted line represents one subject, while the mean
values are shown in wider lines, with error bars corresponding to the standard deviation.
Figure 6. Barplots showing the mean and standard deviation of all the parameters extracted from the
smartphone accelerometer, for the two distances (15 cm vs 30 cm) and conditions (SAS vs non-SAS).
Data extracted from the smartphone accelerometer (Fig. 6) revealed no significant differences between non-
SAS and SAS trials for movement durations (p > 0.4), tilt angle (p = 0.04), lateral angle (p = 0.64), and angular
velocities (p ≥ 0.03) (Table 1). Therefore, although the onset latencies and the response time were reduced in SAS
trials, the movement duration, as indicated by the accelerometer traces, did not change (Fig. 3).
PeakAccX, PeakAccY, and PeakAccZ were significantly larger in SAS than in non-SAS trials in the three
accelerometer axes (p ≤ 7 × 10⁻⁹). Such increase was very consistent across subjects, especially in Y and Z-axes,
with mean percentage changes ≥ 73% and differences > 10% at least in 81% of the subjects. The spectral param-
eters also increased in SAS trials, indicating a higher frequency content of the tilt angle signal derived from the
Scientific Reports | (2021) 11:5363 | https://doi.org/10.1038/s41598-021-84789-3 9
Vol.:(0123456789)www.nature.com/scientificreports/
accelerometer data when the SAS was presented (Fig. 6). These differences were especially significant in the 95th
percentile frequency (fmax) and the energy ratio (RATIOHL) (p ≤ 7 × 10⁻⁵), but also for the 3rd quartile frequency
(fQ3) (p = 0.01), while they were not significant at a level of 0.01 for the median frequency (p = 0.03) (Table 1).
The increases in fmax and RATIOHL were consistent among subjects (mean percentage changes ≥ 41%, and
differences > 10% in 65–90% of the subjects), unlike what happened in fQ3, where differences > 10% occurred
only in 39–45% of the subjects (Table 2).
Interaction between distance and condition. No interaction effects were found between the two fac-
tors entered in the analysis (Condition: SAS/non-SAS and Distance: 15 cm/30 cm) for any of the EMG or the
accelerometer features, with p-values ranging from 0.09 to 0.996.
Correlation with age and gender. At a level of significance of 0.01, no correlations were found between
the changes in any of the variables and age or gender (p > 0.02 for all parameters). From the 94 correlation
tests (47 parameters at 2 distances), only two p-values were < 0.05 (but ≥ 0.04) for gender correlation, and four
p-values were < 0.05 (but ≥ 0.02) for age correlation, which are less than would be expected purely by chance.
Discussion
The StartReact phenomenon has long been investigated in different m ovements31–39, and it is well-known that a
prepared response can be triggered at short latency when a SAS is p resented47. Here we show that this phenom-
enon also occurs in postural muscles involved in trunk flexion in reaching tasks while sitting. We examined eight
shoulder, neck, and trunk muscles: the SCM, responsible for neck flexion; the DEL and PECT, prime movers
for shoulder flexion; the TRA, the main contributor to scapular stability and mobility; and the ABD, PC, PT,
and PL, muscles involved in bending the trunk forward and maintaining the upright posture. In SAS trials, we
found significant reductions in response time and onset latencies of the eight muscles under study, with similar
percentage changes (around 30–40%, Table 2) in most of them. Therefore, in this task, the SAS induces a similar
effect in prime movers and postural muscles, suggesting that all of them are modulated by the neural pathway
activated in the StartReact effect. Although there is still debate about the mechanisms of this e ffect47, a plausible
hypothesis is the subcortical storage explanation, which considers that, in preparation of voluntary actions, suf-
ficient detail of the movement is stored in the brainstem and spinal centres so that the motor program can be
triggered even without cortical c ommand32. This interpretation was given in a previous study about the startle
effect on the sit-to-stand movement36, where the authors found that the SAS affected prime movers and postural
muscles alike, just as in our study, and reasoned that all the examined muscles had a common modulation at
a subcortical level. This would be a possible explanation of the StartReact effect in the present study, although,
with the current data, we cannot discard alternative hypothesis such as cortical contributions48.
The greatest shortening of onset latency (52%) occurs in the SCM due to startle-related activation, since, as
it is well-known, unexpected loud auditory stimuli elicit SCM contraction. For this reason, the early activation
of this muscle is considered a reliable indicator of the startle r eflex42,43. However, unlike in previous studies, the
SCM in our experiment was activated not only in response to SAS, but, also, as a postural muscle needed for
task execution, as it is the responsible for the flexion of the neck that accompanies trunk flexion. Even so, the
SCM activation at short latencies demonstrated to be indicative of the startle response: only when this muscle
was activated within 120 ms of the SAS (SCM≤120 ms trials) a significant reduction in the onset latencies of all
the muscles was observed (Fig. 4). Although data for the SCM in Fig. 5 show a reduced dispersion because of
the selection of only S CM≤120 ms trials, this selection helped to ensure that the startle reflex circuitry had been
activated to trigger the prepared response.
We found enhanced EMG activity in SAS trials than in non-SAS trials, although the differences were sig-
nificant only for some muscles, especially the SCM and PECT, and only occurred in a proportion of subjects.
Previous works have reported increased EMG responses following the presentation of a SAS in the SCM and the
wrist flexor41,42, as well as the tibialis anterior36, hypothesizing that the reason might be a sustained increase in
subcortical motor pathways e xcitability41. We expected different effects in the neck and arm muscles compared
to trunk muscles, as the latter have a postural function to maintain equilibrium, and thus should be less sensitive
to perturbations. On the other hand, the EMG amplitudes for all the examined muscles were significantly higher
at 30 cm than at 15 cm, indicating that the subjects had to exert a greater muscle force to cover a longer distance.
Here, we have combined EMG and smartphone accelerometer data as a method to simultaneously analyse
muscle activity and movement patterns related to trunk flexion in an arm reaching task. EMG, as a neuro-
muscular assessment technique, has been extensively used in StartReact studies, and kinematic measures or
accelerometer signals have also been employed for measuring response time or movement duration in this
context31,40,49. However, in these cases, the data are usually recorded with uniaxial accelerometers, which lim-
its movement analysis to a few measures, whereas triaxial accelerometers could provide more precise spatial
information. Moreover, most of previous kinematic studies of trunk function relied on expensive specialized
equipment such as motion capture systems, which limits their application in the clinical setting. In contrast,
smartphones are available worldwide, and they are simple cost-effective tools that have accurate sensors and
powerful data-processing capabilities, so they would be easy to implement in the clinical practice. This work is a
first proof-of-concept of how the smartphone accelerometers could help in the assessment of trunk movements.
The smartphone accelerometer allows recording movement signals, which likely reflect postural control and
trunk stability, as suggested by Queralt et al.36, since the device is attached to the subjects’ thorax and tracks
the trunk displacement. Firstly, the data derived from the smartphone accelerometer allowed us to monitor the
trunk tilt angle and the lateral angle at any point during the movement. With that, we calculated the maximum
tilt angle reached by each subject at each distance, and the maximum lateral deviation. This lateral deviation was
Scientific Reports | (2021) 11:5363 | https://doi.org/10.1038/s41598-021-84789-3 10
Vol:.(1234567890)www.nature.com/scientificreports/
found to be very small in all situations because the participants were able-bodied subjects, so they made accurate,
straightforward movements with no difficulties. However, this may not be the case in patients with neurological
injuries, as they may need to adopt compensatory strategies to prevent instability when performing the experi-
mental task reported in this study, which may be reflected in greater lateral deviations. Secondly, we conducted
a spectral analysis of the tilt angle signal, which showed that higher frequency components appear following
the presentation of a SAS. This high frequency results from less smooth movements, and could indicate reduced
control in SAS trials, possibly related to an involuntary reaction to the unexpected stimulus or to the faster
movement initiation. This change in frequency might also relate to additional drive associated with the startle
reflex pathways adding to the voluntary initiation drive, but further research would be needed to investigate this.
The signals at 30 cm had slightly lower frequency content than at 15 cm, but the reason could be that, at 30 cm,
movements are longer and thus the effect of the transients, which have higher frequency content, is reduced.
We have also found an interesting parameter, the height of the peak that occurs in the accelerometer signal at
the beginning of the movement, measured in the three accelerometer axes (PeakAccX, PeakAccY, and PeakAccZ).
We think that this feature reflects the anticipatory movement preceding the trunk flexion, which significantly
increases in SAS trials (Fig. 2c) because the subjects involuntary jump or wince in response to the unexpected
loud sound. Therefore, the size of these peaks in the accelerometer signal could be a quantifiable surrogate of the
magnitude of body movement generated by the startling stimulus. On the other hand, the increase in the height
of these short duration peaks in SAS trials may contribute to the presence of higher frequency components in
the spectral domain, suggesting some kind of destabilization during movement initiation.
The accelerometer signal also enabled the calculation of the total movement duration, and the durations and
angular velocities of the forward and backward movements. None of these features changed when a SAS was
presented, even though the response time and onset latencies were markedly shortened. This indicates that the
time to complete the task is shorter because muscles are activated earlier and thus the movement starts sooner,
not because the execution is faster since the duration does not change. This explanation is supported by Fig. 3,
which shows that the onset latencies of all muscles and the button press time are closer to the IS in SAS trials, so
the response time is shorter, while the general movement pattern and the durations measured from the accel-
erometer data are preserved.
We have extracted different quantitative parameters from the EMG and accelerometer signals to examine
trunk flexion in healthy human subjects, and to investigate the startle response in this trunk task. In future work,
this study may be extended to evaluate trunk stability and the StartReact effect in patients with neurological
injuries, such as SCI and stroke. Impaired trunk stability represents a serious problem that limits these patients’
mobility and daily life activities, so providing quantitative measures of trunk function may contribute to assess-
ing patients’ condition and guiding rehabilitation interventions. On the other hand, the application of a SAS in
neurologically impaired patients would allow us to investigate the descending tracts conveying the startle reaction
in these patients, as well as the way in which a destabilizing unexpected stimulus can affect the compensation
mechanisms of impaired trunk muscles.
Some of the limitations of this study are the relatively low number of SAS trials per subject, and that we
explored the activation of trunk muscles in only one task. For technical reasons due to the limited number of
channels, we recorded the EMG from only the left side of the body, so we could not measure the anticipatory
body movements that would be produced in the right side of the body when lifting the left arm, which could be
explored in future work. In addition, we could have examined other tasks or trunk movements in multiple direc-
tions to obtain more information about recruitment of trunk muscles for maintenance of stability in different
situations. However, it would considerably increase the complexity and the time required for the experiment.
Moreover, we preferred to focus on a simple task that could be extrapolated to individuals with varying degrees
of disability, including paraplegic and tetraplegic patients, and populations with severely impaired trunk control.
In this work, we have described, documented, and quantified the patterns of muscle recruitment and accel-
erometer data that characterize the manoeuvre of trunk flexion in the context of a reaching task in able-bodied
individuals. We have proposed different quantitative measures related to the execution of this movement, which
could help to develop novel methods for evaluating trunk function. This is the first step to assess the changes
that may occur in patients with neurological disorders linked to impairment of trunk stability control. The
combination of neurophysiology measures and mobile health tools, such as smartphones, can provide valuable
information for the assessment of trunk movements in an objective and cost-effective way.
Data availability
The dataset analysed during the current study is available from the corresponding authors on reasonable request.
Received: 11 June 2020; Accepted: 18 February 2021
References
1. Imai, A., Kaneoka, K., Okubo, Y. & Shiraki, H. Effects of two types of trunk exercises on balance and athletic performance in youth
soccer players. Int. J. Sports Phys. Ther. 9, 47–57 (2014).
2. Butcher, S. J. et al. The effect of trunk stability training on vertical takeoff velocity. J. Orthop. Sports Phys. Ther. 37, 223–231 (2007).
3. Massion, J. Movement, posture and equilibrium: Interaction and coordination. Prog. Neurobiol. 38, 35–56 (1992).
4. Borghuis, J., Hof, A. L. & Lemmink, K. A. P. M. The importance of sensory-motor control in providing core stability: Implications
for measurement and training. Sports Med. 38, 893–916 (2008).
5. Caronni, A., Bolzoni, F., Esposti, R., Bruttini, C. & Cavallari, P. Accuracy of pointing movements relies upon a specific tuning
between anticipatory postural adjustments and prime mover activation. Acta Physiol. 208, 111–124 (2013).
6. Stamenkovic, A. & Stapley, P. J. Trunk muscles contribute as functional groups to directionality of reaching during stance. Exp.
Brain Res. 234, 1119–1132 (2016).
Scientific Reports | (2021) 11:5363 | https://doi.org/10.1038/s41598-021-84789-3 11
Vol.:(0123456789)www.nature.com/scientificreports/
7. Bohannon, R. W., Cassidy, D. & Walsh, S. Trunk muscle strength is impaired multidirectionally after stroke. Clin. Rehabil. 9, 47–51
(1995).
8. Rode, G., Tiliket, C. & Boisson, D. Predominance of postural imbalance in left hemiparetic patients. Scand. J. Rehabil. Med. 29,
11–16 (1997).
9. Tanaka, S., Hachisuka, K. & Ogata, H. Muscle strength of trunk flexion-extension in post-stroke hemiplegic patients. Am. J. Phys.
Med. Rehabil. 77, 288–290 (1998).
10. Haruyama, K., Kawakami, M. & Otsuka, T. Effect of core stability training on trunk function, standing balance, and mobility in
stroke patients: A randomized controlled trial. Neurorehabil. Neural Repair 31, 240–249 (2017).
11. Forogh, B. et al. The effect of repetitive transcranial magnetic stimulation on postural stability after acute stroke: A clinical trial.
Basic Clin. Neurosci. 8, 405–412 (2017).
12. Janssen-Potten, Y. J. M., Seelen, H. A. M., Drukker, J. & Reulen, J. P. H. Chair configuration and balance control in persons with
spinal cord injury. Arch. Phys. Med. Rehabil. 81, 401–408 (2000).
13. Chen, C. L. et al. The relationship between sitting stability and functional performance in patients with paraplegia. Arch. Phys.
Med. Rehabil. 84, 1276–1281 (2003).
14. Gabison, S. et al. Trunk strength and function using the multidirectional reach distance in individuals with non-traumatic spinal
cord injury. J. Spinal Cord Med. 37, 537–547 (2014).
15. Franchignoni, F. P., Tesio, L., Ricupero, C. & Martino, M. T. Trunk control test as an early predictor of stroke rehabilitation outcome.
Stroke 28, 1382–1385 (1997).
16. Tasseel-Ponche, S., Yelnik, A. P. & Bonan, I. V. Motor strategies of postural control after hemispheric stroke. Neurophysiol. Clin.
45, 327–333 (2015).
17. Collin, C. & Wade, D. Assessing motor impairment after stroke: A pilot reliability study. J. Neurol. Neurosurg. Psychiatry 53, 576–579
(1990).
18. Quinzaños, J., Villa, A. R., Flores, A. A. & Pérez, R. Proposal and validation of a clinical trunk control test in individuals with spinal
cord injury. Spinal Cord 52, 449–454 (2014).
19. Verheyden, G. et al. The trunk impairment scale: A new tool to measure motor impairment of the trunk after stroke. Clin. Rehabil.
18, 326–334 (2004).
20. Lynch, S. M., Leahy, P. & Barker, S. P. Reliability of measurements obtained with a modified functional reach test in subjects with
spinal cord injury. Phys. Ther. 78, 128–133 (1998).
21. Katz-Leurer, M., Fisher, I., Neeb, M., Schwartz, I. & Carmeli, E. Reliability and validity of the modified functional reach test at the
sub-acute stage post-stroke. Disabil. Rehabil. 31, 243–248 (2009).
22. Näf, O. B., Bauer, C. M., Zange, C. & Rast, F. M. Validity and variability of center of pressure measures to quantify trunk control
in stroke patients during quiet sitting and reaching tasks. Gait Posture 76, 218–223 (2020).
23. Milosevic, M. et al. Trunk control impairment is responsible for postural instability during quiet sitting in individuals with cervical
spinal cord injury. Clin. Biomech. 30, 507–512 (2015).
24. Morasso, P., Cherif, A. & Zenzeri, J. State-space intermittent feedback stabilization of a dual balancing task. Sci. Rep. 10, 8470
(2020).
25. Liao, C. F., Liaw, L. J., Wang, R. Y., Su, F. C. & Hsu, A. T. Electromyography of symmetrical trunk movements and trunk position
sense in chronic stroke patients. J. Phys. Ther. Sci. 27, 2675–2681 (2015).
26. Wang, Y. J. et al. Surface electromyography as a measure of trunk muscle activity in patients with spinal cord injury: A meta-
Analytic review. J. Spinal Cord Med. 39, 15–23 (2016).
27. Gauthier, C. et al. Which trunk inclination directions best predict multidirectional-seated limits of stability among individuals
with spinal cord injury?. J. Spinal Cord Med. 35, 343–350 (2012).
28. Zhang, S., McCullagh, P., Nugent, C. & Zheng, H. Activity monitoring using a smart phone’s accelerometer with hierarchical clas-
sification. In Proceedings—2010 6th International Conference on Intelligent Environments, IE 2010, 158–163 (2010). https://doi.
org/10.1109/IE.2010.36.
29. Tacconi, C., Mellone, S. & Chiari, L. Smartphone-based applications for investigating falls and mobility. In 2011 5th International
Conference on Pervasive Computing Technologies for Healthcare and Workshops, Pervasive Health 2011, 258–261 (2011). https://
doi.org/10.4108/icst.pervasivehealth.2011.246060.
30. Ferrer-Lluis, I., Castillo-Escario, Y., Montserrat, J. M. & Jane, R. Analysis of smartphone triaxial accelerometry for monitoring
sleep-disordered breathing and sleep position at home. IEEE Access. 8, 71231–71244 (2020).
31. Valls-Solé, J. et al. Reaction time and acoustic startle in normal human subjects. Neurosci. Lett. 195, 97–100 (1995).
32. Valls-Solé, J., Rothwell, J. C., Goulart, F., Cossu, G. & Muñoz, E. Patterned ballistic movements triggered by a startle in healthy
humans. J. Physiol. 516, 931–938 (1999).
33. Carlsen, A. N., Chua, R., Inglis, J. T., Sanderson, D. J. & Franks, I. M. Prepared movements are elicited early by startle. J. Mot. Behav.
36, 253–264 (2004).
34. Carlsen, A. N., Chua, R., Inglis, J. T., Sanderson, D. J. & Franks, I. M. Differential effects of startle on reaction time for finger and
arm movements. J. Neurophysiol. 101, 306–314 (2009).
35. Siegmund, G. P., Inglis, J. T. & Sanderson, D. J. Startle response of human neck muscles sculpted by readiness to perform ballistic
head movements. J. Physiol. 535, 289–300 (2001).
36. Queralt, A., Valls-Solé, J. & Castellote, J. M. The effects of a startle on the sit-to-stand manoeuvre. Exp. Brain Res. 185, 603–609
(2008).
37. MacKinnon, C. D. et al. Preparation of anticipatory postural adjustments prior to stepping. J. Neurophysiol. 97, 4368–4379 (2007).
38. Queralt, A. et al. The effects of an auditory startle on obstacle avoidance during walking. J. Physiol. 586, 4453–4463 (2008).
39. Castellote, J. M., Queralt, A. & Valls-Solé, J. Preparedness for landing after a self-initiated fall. J. Neurophysiol. 108, 2501–2508
(2012).
40. Oude Nijhuis, L. B., Allum, J. H. J., Valls-Solé, J., Overeem, S. & Bloem, B. R. First trial postural reactions to unexpected balance
disturbances: A comparison with the acoustic startle reaction. J. Neurophysiol. 104, 2704–2712 (2010).
41. Kumru, H. & Valls-Solé, J. Excitability of the pathways mediating the startle reaction before execution of a voluntary movement.
Exp. Brain Res. 169, 427–432 (2006).
42. Maslovat, D., Franks, I. M., Leguerrier, A. & Carlsen, A. N. Responses to startling acoustic stimuli indicate that movement-related
activation is constant prior to action: A replication with an alternate interpretation. Physiol. Rep. 3, e12300 (2015).
43. Carlsen, A. N., Maslovat, D., Lam, M. Y., Chua, R. & Franks, I. M. Considerations for the use of a startling acoustic stimulus in
studies of motor preparation in humans. Neurosci. Biobehav. Rev. 35, 366–376 (2011).
44. Castillo-Escario, Y., Rodríguez-Cañón, M., García-Alías, G. & Jané, R. Onset Detection to study muscle activity in reaching and
grasping movements in rats. In Proc. Annu. Int. Conf. IEEE Eng. Med. Biol. Soc. (EMBC), 5113–5116 (2019).
45. Teager, H. M. & Teager, S. M. Evidence for nonlinear sound production mechanisms in the vocal tract. In Speech Production and
Speech Modelling, 241–261 (Springer, 1990). https://doi.org/10.1007/978-94-009-2037-8_10.
46. Li, X., Zhou, P. & Aruin, A. S. Teager-Kaiser energy operation of surface EMG improves muscle activity onset detection. Ann.
Biomed. Eng. 35, 1532–1538 (2007).
47. Carlsen, A. N. & Maslovat, D. Startle and the StartReact effect: Physiological mechanisms. J. Clin. Neurophysiol. 36, 452–459 (2019).
48. Stevenson, A. J. T. et al. Cortical involvement in the StartReact effect. Neuroscience 269, 21–34 (2014).
Scientific Reports | (2021) 11:5363 | https://doi.org/10.1038/s41598-021-84789-3 12
Vol:.(1234567890)www.nature.com/scientificreports/
49. Castellote, J. M. & Valls-Solé, J. The StartReact effect in tasks requiring end-point accuracy. Clin. Neurophysiol. 126, 1879–1885
(2015).
Acknowledgements
This work was supported in part by a fellowship from “La Caixa” Foundation (ID 100010434) with fellowship
code LCF/BQ/DE18/11670019, in part by the Secretaria d’Universitats i Recerca de la Generalitat de Catalunya
under Grant GRC 2017 SGR 01770, in part by the Agencia Estatal de Investigación, the Spanish Ministry of
Science, Innovation and Universities, and the European Regional Development Fund under Grant RTI2018
098472-B-I00, in part by the CERCA Program/Generalitat de Catalunya, in part by H2020-ERA-NET Neuron
under Grant AC16/00034, in part by La Marató de TV3 2017 under Grant 201713.31, and in part by Premi Beca
“Mike Lane” 2019—Castellers de la Vila de Gràcia.
Author contributions
Y.C.E., H.K., J.V.S., J.V. and R.J. contributed to the concept and design of the study; Y.C.E., H.K. and L.G.A.
performed the experiments and collected the data; Y.C.E. analysed the data, prepared the figures and the first
manuscript draft; H.K., J.V.S., J.V. and R.J. provided research advice; all authors interpreted the results, edited
and reviewed the manuscript, and approved the final version of the manuscript.
Competing interests
The authors declare no competing interests.
Additional information
Correspondence and requests for materials should be addressed to Y.C.-E. or H.K.
Reprints and permissions information is available at www.nature.com/reprints.
Publisher’s note Springer Nature remains neutral with regard to jurisdictional claims in published maps and
institutional affiliations.
Open Access This article is licensed under a Creative Commons Attribution 4.0 International
License, which permits use, sharing, adaptation, distribution and reproduction in any medium or
format, as long as you give appropriate credit to the original author(s) and the source, provide a link to the
Creative Commons licence, and indicate if changes were made. The images or other third party material in this
article are included in the article’s Creative Commons licence, unless indicated otherwise in a credit line to the
material. If material is not included in the article’s Creative Commons licence and your intended use is not
permitted by statutory regulation or exceeds the permitted use, you will need to obtain permission directly from
the copyright holder. To view a copy of this licence, visit http://creativecommons.org/licenses/by/4.0/.
© The Author(s) 2021
Scientific Reports | (2021) 11:5363 | https://doi.org/10.1038/s41598-021-84789-3 13
Vol.:(0123456789)You can also read