Widespread Decoding of Tactile Input Patterns Among Thalamic Neurons - Frontiers
←
→
Page content transcription
If your browser does not render page correctly, please read the page content below
ORIGINAL RESEARCH
                                                                                                                                        published: 16 February 2021
                                                                                                                                   doi: 10.3389/fnsys.2021.640085

                                            Widespread Decoding of Tactile Input
                                            Patterns Among Thalamic Neurons
                                            Anders Wahlbom, Jonas M. D. Enander and Henrik Jörntell*
                                            Neural Basis of Sensorimotor Control, Department of Experimental Medical Science, Lund University, Lund, Sweden

                                            Whereas, there is data to support that cuneothalamic projections predominantly reach
                                            a topographically confined volume of the rat thalamus, the ventroposterior lateral (VPL)
                                            nucleus, recent findings show that cortical neurons that process tactile inputs are widely
                                            distributed across the neocortex. Since cortical neurons project back to the thalamus,
                                            the latter observation would suggest that thalamic neurons could contain information
                                            about tactile inputs, in principle regardless of where in the thalamus they are located.
                                            Here we use a previously introduced electrotactile interface for producing sets of highly
                                            reproducible tactile afferent spatiotemporal activation patterns from the tip of digit 2 and
                                            record neurons throughout widespread parts of the thalamus of the anesthetized rat. We
                                            find that a majority of thalamic neurons, regardless of location, respond to single pulse
                                            tactile inputs and generate spike responses to such tactile stimulation patterns that can
                                            be used to identify which of the inputs that was provided, at above-chance decoding
                                            performance levels. Thalamic neurons with short response latency times, compatible
                                            with a direct tactile afferent input via the cuneate nucleus, were typically among the
                                            best decoders. Thalamic neurons with longer response latency times as a rule were
                       Edited by:           also found to be able to decode the digit 2 inputs, though typically at a lower decoding
                Heiko J. Luhmann,
      Johannes Gutenberg University
                                            performance than the thalamic neurons with presumed direct cuneate inputs. These
                   Mainz, Germany           findings provide support for that tactile information arising from any specific skin area is
                        Reviewed by:        widely available in the thalamocortical circuitry.
                          Daniel Llano,
                   University of Illinois   Keywords: thalamus, neurophysiology, tactile, information processing, integrative neurophysiology
at Urbana-Champaign, United States
                           Ewa Kublik,
      Nencki Institute of Experimental      INTRODUCTION
               Biology (PAS), Poland
                 *Correspondence:           Information about tactile inputs is ubiquitous in the rat cortical circuitry, including primary visual
                        Henrik Jörntell     cortex as demonstrated for a set of tactile input patterns delivered to digit 2 (Enander et al., 2019).
             henrik.jorntell@med.lu.se      Also, in humans, an fMRI study showed that specific responses in the primary somatosensory cortex
                                            could be triggered by specific visual inputs (Smith and Goodale, 2015). As the cortex projects back
      Received: 10 December 2020            to the thalamus, and not just to homonymous thalamic nuclei (Halassa and Sherman, 2019), but to
       Accepted: 25 January 2021
                                            diverse parts of the thalamus, it would seem a natural consequence that also in the thalamus there
      Published: 16 February 2021
                                            would be ubiquitous representation of tactile information. This possibility has not been explored
                             Citation:      in great detail, as the focus in thalamic recording studies typically lie in the study of the modality
       Wahlbom A, Enander JMD and
                                            expected to be specific for the thalamic nuclei recorded from. A recent study (Allen et al., 2017),
         Jörntell H (2021) Widespread
    Decoding of Tactile Input Patterns
                                            though, showed that visual input affected the responses to tactile whisker stimuli in the primary
            Among Thalamic Neurons.         somatosensory thalamic nucleus, the ventral posteromedial nucleus (VPM), in the anesthetized rat.
    Front. Syst. Neurosci. 15:640085.       Further, Bieler et al. (2018) found tactile inputs to evoke field potential responses in the lateral
     doi: 10.3389/fnsys.2021.640085         geniculate nucleus (LGN). They also found that individual cells in the VPM can project directly to

Frontiers in Systems Neuroscience | www.frontiersin.org                          1                                       February 2021 | Volume 15 | Article 640085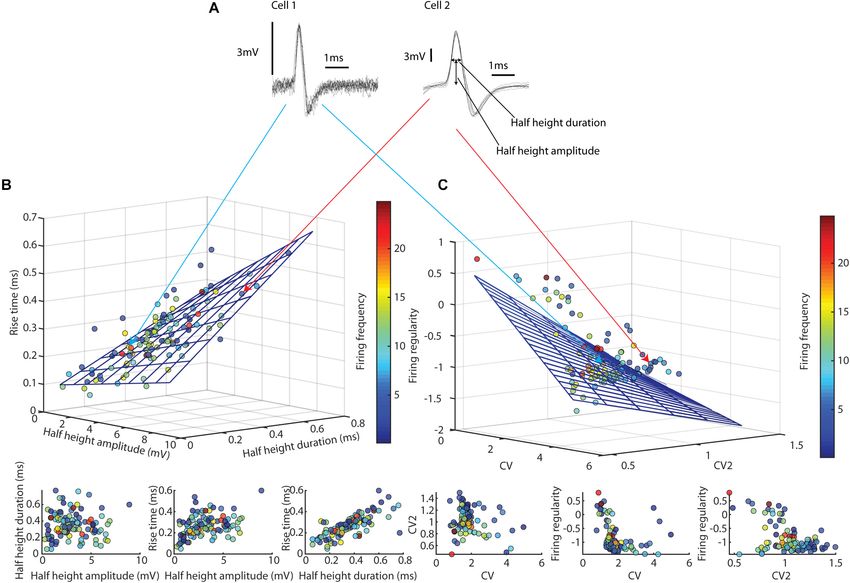
Wahlbom et al.                                                                                                   Tactile Decoding in Thalamic Neurons

the primary visual cortex. Moreover, it has previously been                 interspike intervals (ISIs), which evaluates the spread of ISI
reported that primary sensory thalamic nuclei project to more               values relative to the mean ISI for the entire spike train; (2)
than one primary sensory cortical area (Henschke et al., 2015).             CV2, reported as an average value for each neuron, compares
These findings show that tactile inputs can reach wide cortical             the relative difference between two adjacent ISIs (Holt et al.,
areas, and since these cortical areas project back to different             1996), and (3) the “firing regularity” measure of Mochizuki
primary thalamic regions, a wide region of the thalamus which               et al. (2016), which describes the distribution of multiple ISIs.
may not receive direct cuneate nucleus input (Alloway et al., 1994;         All these measures are dimensionless and reflect the spike
Bermejo et al., 2003) can potentially be reached by tactile inputs          train structure independently of the absolute firing rate of the
via longer pathways.                                                        neuron. Also in this case, there was little tendency for clustering
    Such findings are not widely reported in the literature and             (Figure 1C and Table 1), and again the distribution resembled
a possible reason for that could be the limited sensitivity of              a continuum, regardless of firing frequency. Here a multilinear
the analysis methods by which the presence of information                   regression analysis showed only weak tendencies toward a linear
concerning ‘unexpected’ modalities could be detected. In                    relationship [F(2, 106) = 28.0, p = 2.28 × 10⁻¹³ , r2 = 0.44].
this study we used highly reproducible spatiotemporal tactile               Based on the absence of any clear clusters for these metrics,
activation patterns delivered to the digit 2 combined with                  we ascribe all our neuron recordings as being putative thalamic
a decoding analysis of neuronal spike responses which has                   projection neurons, which is in line with an estimate of only about
previously proven to be a highly sensitive tool for exploring               1% of the neuron population being local inhibitory interneurons
the presence of neural signals reporting on the quality of tactile          in the non-visual thalamic sensory relay nuclei of the rat
inputs in various parts of the neocortex (Oddo et al., 2017; Genna          (Arcelli et al., 1997).
et al., 2018; Enander and Jorntell, 2019; Enander et al., 2019;
Wahlbom et al., 2019). We recorded from a variety of thalamic               Decoding of Tactile Input Patterns
regions in the anesthetized rat and find that a majority of thalamic        We next quantified the specificity of the spike responses to a fixed
neurons recorded have a detectable tactile input and that the               set of eight spatiotemporal patterns of activation of skin afferents
spike responses of these cells as a rule carry information about the        in the ventral side of distal digit 2 [see section “Materials and
quality of tactile inputs delivered to the same population of tactile       Methods” for details, and furthermore the stimulation patterns
afferents, confined to the ventral side of the second forepaw digit.        are described graphically in Supplementary Figure 1 and in
                                                                            greater detail in Oddo et al. (2017); also Genna et al. (2018) and
                                                                            Enander et al. (2019)]. Figure 3A illustrates a set of raw spike
RESULTS                                                                     responses to two of the stimulation patterns in two different
                                                                            cells. It can be noted that the dynamics of the overall activity
We made extracellular unitary spike recordings (Figure 1A) from             differed substantially between the two neurons. It can also be
109 thalamic neurons across the rostrocaudal and mediolateral               noted that the responses to repeated applications of the same
extent of the thalamus (Figure 2). We analyzed these neurons                stimulation pattern varied, sometimes greatly, for the same
with respect to their spike shapes, spike firing patterns, response         neuron. Figure 3B shows a schematic displaying the placement
latency times and decoding of a set of eight spatiotemporal                 of the stimulation electrodes used to create the spatiotemporal
tactile afferent activation patterns delivered to the ventral side of       pattern of skin afferent activation. Displayed as peristimulus time
the distal digit 2.                                                         histograms (PSTHs), the differences between the responses of
                                                                            the two neurons were more easily estimated (Figure 3C). As
Spike Properties and Spike Firing                                           an alternative to the PSTH, we also overlaid a Kernel Density
Properties of Thalamic Neurons                                              Estimation (KDE) (Shimazaki and Shinomoto, 2010) of the spike
As the neuronal population in the thalamic nuclei consists                  response (solid lines in Figure 3C), which further clarified the
not only of thalamocortical projection neurons but also of                  difference between the responses of the two neurons to the same
local interneurons (Su et al., 2020), we first explored the                 stimulation pattern.
spike shapes and the spike firing metrics of the recorded                      The differences between responses in the same neuron to
neurons for exploration of any possible distinct cluster formation          each of the eight stimulation patterns were quantified using
separating these two tentative groups of neurons. The spike                 a decoding analysis similar to previous publications (Enander
shape metrics (Figure 1B and Table 1) had no obvious tendency               and Jorntell, 2019; Enander et al., 2019; Wahlbom et al., 2019).
to form clusters, but instead seemed to form a continuum.                   Using PCA of the individual spike responses to each stimulation
A multilinear regression analysis showed tendencies toward a                pattern, the position in high-dimensional PC space was defined
linear relationship [F(2, 106) = 93.0, p = 1.92 × 10⁻²⁹ , r2 = 0.73],       and related to the positions of other responses evoked by
which at least partly could be due to that there was a strong               the same and by the other stimulation patterns using kNN
relationship between rise time and half height duration. Note               classification. Figure 3D reports the decoding performance,
also that the firing frequency varied widely between neurons                measured as F1-score, for the two illustrated neurons. Cell#1 was
(Table 1) but had no apparent impact on the spike shape                     clearly better at reporting correctly which stimulation pattern
metrics (Figure 1B).                                                        was delivered (100% F1 score, every single response for all
   To quantify the spike firing regularity (Figure 1C), we used             eight stimulation patterns was correctly classified) than Cell#2
three measures; (1) the coefficient of variation (CV) of the                (37.3% F1 score). In fact, across all neurons previously recorded

Frontiers in Systems Neuroscience | www.frontiersin.org                 2                                   February 2021 | Volume 15 | Article 640085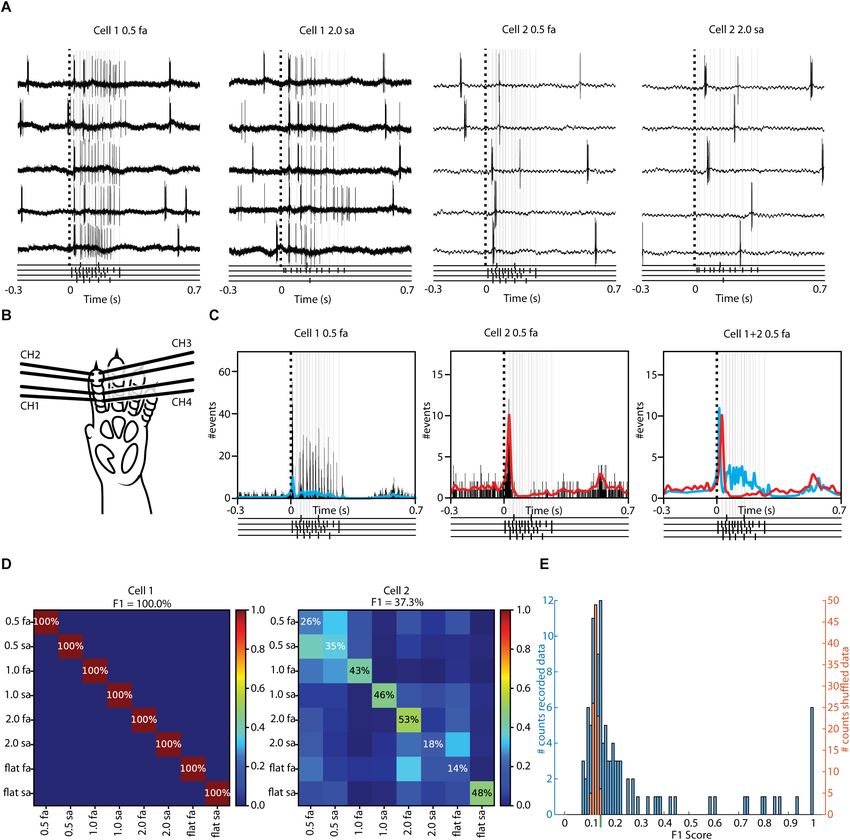
Wahlbom et al.                                                                                                                       Tactile Decoding in Thalamic Neurons

  FIGURE 1 | Spike firing metrics suggested that thalamic neurons formed a continuum, thus not offering a basis for subdividing our thalamic neurons into classes.
  (A) The spike shapes of two different thalamic neurons. Each example consists of 10 superimposed traces. (B) Relationship between spike shape parameters
  across all thalamic neurons recorded. The 3D plot at the top contains a multilinear regression overlaid on the data points. Below, each pairwise relationship is plotted
  separately. (C) Relationships between three different measures of spike firing regularity. The 3D plot on top contains a multilinear regression overlaid on the data
  points. Below, each pairwise relationship is shown separately.

in the S1 neocortex (Oddo et al., 2017; Enander and Jorntell,                            patterns. According to this criterion, 65 of 109, or 59.6%, of the
2019; Wahlbom et al., 2019) using the exact same method, we                              recorded thalamic neurons decoded the tactile input patterns.
have never observed such high decoding accuracy as 100%.                                 A one-sample Kolmogorov-Smirnov test combined with visual
Across the whole population of recorded thalamic neurons, there                          inspection was used to determine that the distributions for the
were no less than 6 thalamic neurons with in principle perfect                           decoding performance and the shuffled decoding performance
decoding, but otherwise the decoding performance varied greatly                          was not normally distributed (for the F1-score, non-shuffled data,
(Figure 3E). It should be noted that in this type of analysis, pure                      the p-value was 1.46 × 10⁻²⁷ , whereas for the shuffled data the
noise for eight stimulation patterns would result in a reported                          p-value was 6.36 × 10⁻²⁹ ), thus a non-parametric comparison
decoding performance of 12.5% (1/8), which would thus be the                             was performed. A Kruskal-Wallis test rejects the null hypothesis
objective threshold for ascribing a minimal level of decoding                            that the two data samples came from the same distribution at a
performance to any single cell. Here, we instead used the existing                       1% significance level (H = 33.65, 1 d.f., p = 6.6 × 10⁻⁹ ). The mean
responses of each neuron and shuffled their stimulation pattern                          decoding performance and SD for the recorded and shuffled data
labels in order to obtain a baseline for above-chance decoding                           is presented in Table 2.
performance for each neuron separately (Figure 3E, orange
bars). The resulting mean decoding performance for the shuffled                          Response Latency Times
responses fell very closely to the theoretical 12.5% limit. However,                     Displayed as PSTHs, it was again clear that different thalamic
the SD of the decoding for the shuffled data was non-negligible,                         neurons could vary widely in the shape of the response they
and we therefore defined a limit of mean + 2 SD (12.42% +                                produced to individual stimulation patterns (Figure 4A). These
2∗ 0.85% = 14.12%, approximately indicated in Figure 3E by the                           PSTHs, were also used to calculate the response latency times
green bar below the x-axis) above which level a thalamic neuron                          (Figure 4A, dashed blue lines). A response latency time could
was counted as being positively decoding the tactile afferent input                      not be identified for all thalamic neurons according to the

Frontiers in Systems Neuroscience | www.frontiersin.org                              3                                         February 2021 | Volume 15 | Article 640085
Wahlbom et al. Tactile Decoding in Thalamic Neurons
FIGURE 2 | Location of neuronal recording sites in stereotaxic coordinates with the outline of the thalamic nuclei indicated. All thalamic neuron recording sites are
shown in horizontal, sagittal and coronal view. For each viewing plane, the plane is split into three ranges and all recording sites within each range is shown. The
ranges of each outline level are here presented as lower limit-upper limit the plane of the outline section illustrated; Paxinos and Watson, 2006). The left column
shows the horizontal plane with top row: 4.9–5.3 mm (5.3 mm), middle row: 5.6–6.3 mm (6.1 mm) and bottom row: 6.3–7 mm (6.6 mm). In the same manner the
middle column shows the sagittal plane with top row: 1.7–2.4 mm (2.1 mm), middle row 2.4–3.1 mm (2.9 mm) and bottom row: 3.1–3.8 mm (3.4 mm). Right column
show the coronal range with top row_ –1.8 to –2.5 mm (–2.1 mm), middle row: –2.5 to –3.2 mm (–2.8 mm) and bottom row: –3.2 to –3.9 mm (–3.6 mm). Rt,
Reticular thalamic nucleus; VPL, ventroposterior lateral nucleus; VPM, ventroposterior medial nucleus; VL, ventrolateral nucleus; PO, posterior complex; AVVL,
anteroventral nucleus of thalamus ventrolateral part; ANG, anterior nuclear group.
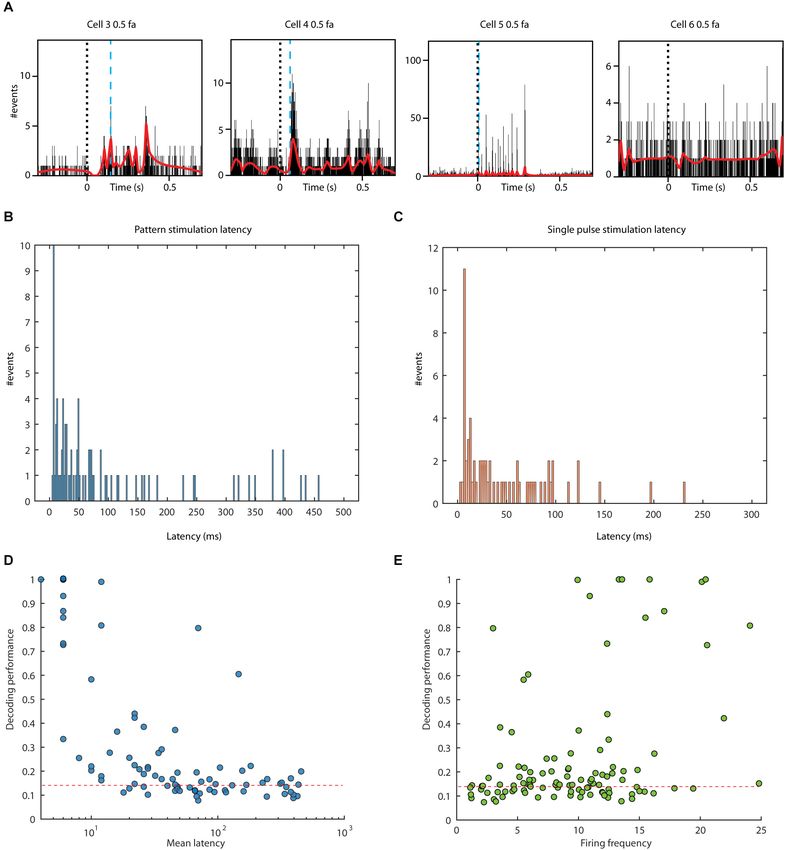
criteria used (section “Materials and Methods”). However, when When the latency times were instead based on the responses
the response latency time of a neuron was extracted from the to isolated single pulse stimulations, 65/109 (59.6%) neurons
responses evoked by the stimulation patterns, 85/109 (78.0%) had an identified response latency time (Figure 4C), the
neurons had an identified response latency time (Figure 4B). difference to the former being explicable by the fact that the
stimulation patterns consisted of several stimulation pulses in
sequence hence increasing the chance of detecting a response.
TABLE 1 | Population data of spike shape and spike firing metrics. There was a relationship between decoding performance and
response latency time, in particular for neurons with the shortest
Spike/firing property Mean ± SD
response latency times (Figure 4D). A similar plot for the
Half height amplitude 3.07 ± 1.80 mV decoding performance against firing frequency revealed no clear
Half height duration 0.35 ± 0.15 ms relationship (Figure 4E).
Rise time 0.27 ± 0.10 ms The latency times calculated from the responses evoked by the
Firing frequency 9.61 ± 5.26 Hz stimulation patterns were obtained using a bin width of 2 ms
CV 1.86 ± 0.73 (section “Materials and Methods”). Changing the bin width to
CV2 1.05 ± 0.20 5 ms for this calculation, we instead obtained 76 neurons with
Firing regularity (log) −0.90 ± 0.51 an identified response latency time, whereas a bin width of 10 ms
Frontiers in Systems Neuroscience | www.frontiersin.org 4 February 2021 | Volume 15 | Article 640085Wahlbom et al. Tactile Decoding in Thalamic Neurons
FIGURE 3 | A majority of our recorded thalamic neurons had above chance decoding of tactile input. (A) Sample raw responses of two different neurons to two
different stimulation patterns. Below each sample, the presented stimulation pattern is shown with black markers with light gray lines extending upwards.
(B) Schematic of the rat forepaw showing the location of the four pairs of electrotactile stimulation electrodes (Supplementary Figure 1 illustrates the full set of
stimulation patterns). (C) Peristimulus Time Histograms (PSTHs) and Kernel Density Estimations (KDEs) of all of the responses to one of the stimulation patterns for
the two sample cells. The KDEs of the two cells are shown superimposed and normalized in the diagram to the right. Below each PSTH/KDE the presented
stimulation pattern is shown with black markers with light gray lines extending upwards. (D) Confusion matrices of the decoding performance for the two sample
cells across all eight stimulation patterns. (E) Decoding performance for the entire population of recorded neurons (blue bars). Orange bars show the corresponding
distribution of the decoding following shuffling of the stimulation pattern labels. Green bar below the x-axis corresponds to the mean plus 2 SD of the shuffled data,
which was the decision boundary for counting a thalamic neuron as being an above-chance decoder.
yielded 66 neurons with an identified response latency time. The widths, since the requirement was two consecutive bins being
fact that these times varied depending on the bin width could above two SD of the background activity regardless of bin width.
be explained by the higher threshold when using the longer bin A one-sample Kolmogorov-Smirnov test combined with
visual inspection showed that none of the observed latency
distributions were normally distributed (stimulation pattern
TABLE 2 | Decoding performance across the population of thalamic neurons, p = 3.4 × 10−76 , single pulse p = 7.1 × 10−57 ). A Kruskal-Wallis
compared with shuffled data.
test did not reject the null hypothesis that the data samples came
Mean F1-score ± SD 0.2601 ± 0.2556 from the same distribution at a 1% significance level (H = 4.86, 1
Mean shuffled F1-score ± SD 0.1242 ± 0.0085 d.f., p = 2.7 × 10⁻² ).
Frontiers in Systems Neuroscience | www.frontiersin.org 5 February 2021 | Volume 15 | Article 640085Wahlbom et al. Tactile Decoding in Thalamic Neurons
FIGURE 4 | Response latency times and their relationship to decoding performance. (A) PSTHs and KDEs of the responses to one stimulation pattern in four
sample cells. The blue dashed line indicates the estimated response onset latency time in each case (note that the response latency time for each neuron was
calculated using the responses from all eight stimulation patterns). No response latency time could be identified for the neuron to the far right. (B) All detected
response latency times for neurons during stimulation patterns. (C) All detected response latency times based on responses evoked by single pulse stimulation.
(D) Relationship between decoding performance (F1-score) and the logarithm of the response latency time for pattern stimulation. Dashed red line indicates the
decoding level threshold defined in Figure 3E. (E) Relationship between the decoding performance and the average firing frequency.
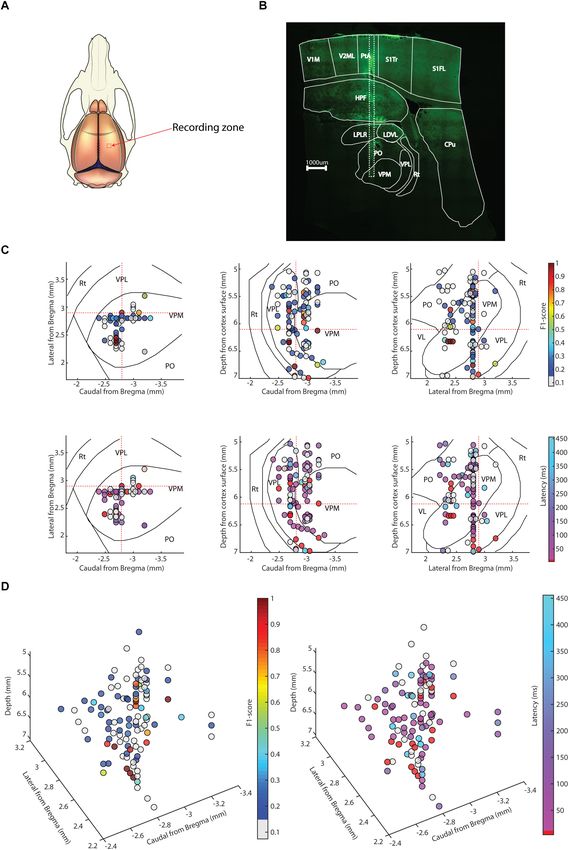
Location of Decoding Performance and stereotactic location, where Figure 5B illustrates a sample track
that could be histologically verified to be in the same location
Response Latency Times as that indicated by the stereotaxic coordinates. A total of five
We also explored whether there was a relationship between the recording tracks were identified histologically in five separate
location within the thalamus of the recorded neuron and its animals, in which the observed anterioposterior deviations of
decoding performance or its response latency time (Figure 5). the recording location compared to that expected from the
In brief, there was no strong relationship as estimated from stereotaxic coordinate of the track amounted to an error of
Frontiers in Systems Neuroscience | www.frontiersin.org 6 February 2021 | Volume 15 | Article 640085Wahlbom et al. Tactile Decoding in Thalamic Neurons FIGURE 5 | Relationships between location and decoding level and response latency time. (A) Schematic of the recording area from a dorsal view. (B) Sagittal section of the brain (with the thalamic nuclei outlined according to Paxinos and Watson, 2006) illustrating one electrode track (white dotted box). (C) 3D location of thalamic neurons visualized in three viewing directions, mapped onto one plane each (horizontal 6.3 mm, sagittal 2.9 mm and coronal –2.8 mm; more precise locations displayed in Figure 2) with color coded decoding performance (top row of plots) and response latency times (bottom row of plots). Response latency times of 10 ms or lower have been colored red. Dotted red lines in each plot indicate the stereotactic planes in the other two plots, for reference. (D) Similar display as in (C) but as 3D projections, with decoding performance shown to the left and response latency times to the right. Note that for visualization, multiple neurons recorded during the same recording session and electrode have been shifted 40 µm in the mediolateral axis, and neurons recorded very closely to each other according to stereotaxic coordinates, but in different sessions, have been shifted 40 µm in the rostrocaudal axis. V1, primary visual cortex; V2, secondary visual cortex; HPF, hippocampal formation; PtA, parietal area; S1, primary somatosensory cortex; CPu, caudate putamen (striatum); LPLR, lateroposero laterorostral nucleus; LDVL, laterodorsal ventrolateral nucleus. Frontiers in Systems Neuroscience | www.frontiersin.org 7 February 2021 | Volume 15 | Article 640085
Wahlbom et al.                                                                                                Tactile Decoding in Thalamic Neurons

0.24 +/− 0.21 mm (mean+/−SD; the maximum deviation                       used. These spatiotemporal patterns of tactile afferent activation
was 0.5 mm). Hence, the stereotactic locations used for the              are highly reproducible and evolve in space and time in a
displays in Figures 5C,D reasonably correctly reflected actual           way that creates a richly resolvable input (Oddo et al., 2017),
recording positions and hence a large proportion of the thalamus         which for this type of analysis offers an advantage compared to
was recorded from (see also Figure 2). In addition, in 8 of              single shock stimuli or spatiotemporally highly reduced inputs.
the electrode tracks we recorded two or more neurons at a                Detection of input, and input specificity, in the brain in vivo is
dorsoventral separation of >=1.0 mm (max neuron separation               typically achieved against a background of spontaneous activity,
in one track was 1.51 mm), i.e., a distance spanning at                  which in the analysis equals noise. Against this background, it
least two separate thalamic nuclei. Thus, neurons with high              is crucial to find a type of input that provides the possibility to
decoding performance and relatively short response latency times         separate signal from noise—but it is given that part of the signal
were located throughout the dorsoventral, rostrocaudal and               will always be concealed by this noise and the experimental
mediolateral stereotactic axes of the thalamus, as visualized in         approach essentially becomes a matter of exposing as much
Figures 5C,D using 2D and 3D plots. (Note that in each plot,             as possible of the tip of the iceberg of the underlying signal.
a 3D distribution of recording sites is mapped to a single 2D            Whereas our approach is designed to overcome that problem,
plane for each viewing direction. Figure 2 shows the locations           it still to some extent suffers from it. For example, a much
of the same recording sites but instead maps the recording sites         higher number of repetitions of these eight input patterns
on three planes for each viewing direction, which gives a more           would likely have exposed the tip of the iceberg among an
accurate reflection of the thalamic nucleus in which a recording         even higher number of thalamic neurons. Hence, we believe
was made). Figures 5C,D show that there was possibly a tendency          that given sensitive enough methods, all thalamic neurons we
for a higher decoding performance among neurons in the ventral           recorded could well have been found to decode tactile input
part of VPL, which has been identified as the main thalamic relay        patterns from digit 2.
for cutaneous input from the forepaw skin (Francis et al., 2008;             We made our electrode tracks according to stereotaxic
Li et al., 2014; Uemura et al., 2020). The response latency times        coordinates with the aim to cover essentially the full rostrocaudal
followed a similar pattern of distribution.                              extent of the thalamus (although the medial thalamic nuclei
                                                                         were not covered) across the experimental series, and in a
                                                                         number of tracks we made at least two separate recordings
DISCUSSION                                                               separated by 1.0 mm or more dorsoventrally, i.e., spanning
                                                                         two or more thalamic nuclei. Identification of the thalamic
We found that putative thalamic projection neurons distributed           neurons was also made using the response latency times, where
throughout all parts of the thalamus that we recorded from               any response recorded at 10 ms or below was considered to
could decode tactile input patterns delivered to distal digit            be indicative of a neuron receiving direct cuneothalamic input
2. Thalamic neurons with the shortest response latency times             (Francis et al., 2008). However, only 8/109 recorded units
had a clear tendency to decode the tactile input patterns with           had such short response latency times. For the rest of the
the highest accuracy (Figure 4D). It is likely that some of              units, the cutaneous input appeared to involve longer pathways,
these thalamic neurons received monosynaptic tactile input               presumably primarily thalamo-cortico-thalamic, longer cortico-
from the cuneate nucleus. All of the other thalamic neurons,             cortico-thalamic or brainstem pathways.
which provided above chance decoding of the tactile input                    From the literature, units with direct cuneo-thalamic inputs
patterns, received tactile input at longer response latency times,       from digit 2 would be expected to be primarily localized to a
which indicates that they received the tactile input via longer          small part of VPL (Villanueva et al., 1998), adjacent to the VPM
pathways. Such indirect pathways could for example include               (Francis et al., 2008; Li et al., 2014; Uemura et al., 2020). However,
the neocortex, where at least minimal levels of neuronal                 the cuneate has also been observed to project to the posterior
decoding accuracy for tactile input patterns are widely present          thalamic nucleus, although this observation applies to parts of
throughout various areas of cortex, including primary visual             the cuneate in which afferent with high precision information
cortex (Enander et al., 2019). Indirect pathways could in                from digit 2 may possibly not exist (Berkley et al., 1986). In terms
addition to the cortex include the brain stem, the superior              of brainstem pathways, the cuneate output has a high number
colliculus or the cerebellum (see below). Although approximately         of potential indirect routes (Loutit et al., 2021) to the thalamus,
40% of the recorded thalamic neurons did not exceed the                  including the superior colliculus (Bezdudnaya and Castro-
set decoding threshold this is not necessarily definitive proof          Alamancos, 2011; Gharaei et al., 2020). The cerebellar nuclei
that they do not represent tactile information from digit 2.             can be provided with cutaneous input via spinal interneurons
Weaker inputs could possibly have been found for example                 and the lateral reticular nucleus (Bengtsson and Jorntell, 2014;
if we had been able to use more than 100 repetitions per                 Jorntell, 2017), and has powerful input to the motor thalamus
tactile input pattern.                                                   (VL) (Jorntell and Ekerot, 1999), which is a potential explanation
   One reason that we found much more widespread                         for the decoding of tactile digit 2 information we observed in this
representations of sensory information in the thalamic cells             part of the thalamus.
compared to previous reports, which tended to focus on                       In addition to the decoding performance analysis,
thalamic nuclear specificity of sensory modalities (for example          we also analyzed the response latency times, where the
Brecht and Sakmann (2002)), is likely due to the type of input           presence of a defined latency time was a strong indication

Frontiers in Systems Neuroscience | www.frontiersin.org              8                                   February 2021 | Volume 15 | Article 640085
Wahlbom et al. Tactile Decoding in Thalamic Neurons
that the neuron did receive tactile input that came in Recordings
addition to their decoding performance level. In this case, All recording tracks were aimed to the thalamus according to the
we could estimate that 76/109 (69.7%) of the neurons had stereotaxic coordinates defined by Paxinos and Watson (2006).
detectable tactile input. The location of the bregma was determined to be located at the
Ubiquitous thalamic representations of the quality of tactile point where the coronal and sagittal sutures crossed, and a flat
input patterns is naturally in line with previous observations elevation of the skull was ensured by placing bregma and lambda
that such representations are also ubiquitous across cortical at the same relative height. According to these criteria all our
areas (Enander et al., 2019). They are also in line with that S1 recordings were performed in the thalamus.
receives direct input from multiple primary sensory thalamic Neurons were recorded with patch clamp pipettes
nuclei, and that other primary sensory cortical areas receive extracellularly in the loose patch recording mode using the
input from non-homonymous primary sensory thalamic nuclei EPC 800 Patch Clamp Amplifier (HEKA, Lambrecht, Germany)
(Henschke et al., 2015) (also demonstrated for a VPL neuron without any applied filters. Patch clamp pipettes were pulled
projecting to V1, by Bieler et al. (2018)). In addition, it also from borosilicate glass capillaries to 6–15M Ohm using a
fits well with observations that layer V neurons can provide Sutter Instruments (Novato, CA) P-97 horizontal puller. The
input to thalamic nuclei other than the ones believed to composition of the electrolyte solution in the patch pipettes was
primarily supply that cortical region (Halassa and Sherman, (in mM) potassium-gluconate (135), HEPES (10), KCl (6.0),
2019). Furthermore, a subset of whisker-responsive neurons Mg-ATP (2), EGTA (10). The solution was titrated to 7.35–7.40
in VPM was also found to respond to visual input (Allen using 1M KOH. In order to find neurons, the electrode was
et al., 2017). Another potential contributing explanation for our advanced with a stepping motor and the recording depths were
observations would be if cuneate inputs terminate outside VPL, tracked. The stimulation electrodes located in the skin of digit 2
as discussed above, rather than having an exclusive projection were repeatedly activated at 0.3 s intervals and the characteristic
to an assumed digit area in the VPL (Francis et al., 2008; evoked field potentials and occasional neuron spike recordings
Li et al., 2014; Uemura et al., 2020). Hence, whereas many of the cortex and the hippocampus could be followed as we
observations and open alternatives support the basic finding of approached the thalamus. Once located in the dorsal part of the
widespread thalamic representations of tactile inputs that we thalamus, the recording electrode was more slowly advanced
made here, a unique contribution of our study was that the (approximately 0.3–1.0 µm per second) while the same skin
thalamic neurons moreover has information about the detailed stimulation was active, and any spike activity encountered was
quality of the tactile stimulus to digit 2. Naturally, we do not taken as an indication of a neuron. The advancement then
expect such widespread thalamic representations to be a property stopped, and attempts to isolate a single neuron were made.
that would exclusive apply to input from digit 2, or even the On successful isolation, a standard protocol of artificial tactile
tactile sense, but likely represent a general principle for all sensory stimulation patterns (see below) was commenced. All data was
information as well as information being more internal to the digitized at 100 kHz using CED 1401 mk2 hardware and Spike2
neocortical circuitry. software (Cambridge Electronics Devices, CED, Cambridge,
United Kingdom).
MATERIALS AND METHODS
Tactile Afferent Stimulations
Surgical Procedures The recordings were made in a set of experiments similar to those
Adult male Sprague-Dawley rats (N = 29, weight 308– in Oddo et al. (2017), where four pairs of stimulation electrodes
364 g) were prepared and maintained under anesthesia with (made of stainless steel insect pins of size 000, diameter 0.25 mm,
a ketamine and xylazine mixture (20:1). Following isofluorane with etched tips) were inserted into the volar side of the second
sedation (2% for 30–60 s), anesthesia was induced via an digit of the contralateral forepaw. These stimulation electrodes
i.p. injection (40 mg/kg of ketamine, 2 mg/kg of xylazine) delivered 0.5 mA pulses lasting 0.14 ms. As a standard protocol,
and maintenance was administered through an intravenous the animal was then episodically presented with repeatable
catheter inserted into the right femoral vein (∼5 mg/kg spatiotemporal patterns, reminiscent of the activation of primary
ketamine per hour with a continuous infusion). For recording afferents when touching objects with four different curvatures
sessions, the level of anesthesia was monitored with a surface (in total eight patterns, named 0.5 fa, 0.5 sa, 1.0 fa, 1.0 sa, 2.0
electrocorticogram (ECoG) electrode placed in the vicinity fa, 2.0 sa, flat fa and flat sa), as described in Oddo et al. (2017).
of the recording area. The ECoG was characterized by The eight spatiotemporal stimulation patterns were delivered
irregular occurrences of sleep spindles, a sign of deep sleep in a pre-defined random order, where the stimulation patterns
(Niedermeyer and da Silva, 2005). The level of anesthesia was lasted for less than 340 ms and the consecutive deliveries of the
additionally characterized by an absence of withdrawal reflexes stimulation patterns were separated by 1.8 s. In this relaxation
to noxious pinches to the hind paw. All animal experiment phase, the firing activity of the neuron was then free from external
procedures in the present study were in accordance with inputs. Each pattern was delivered 100 times. The digit was also
institutional guidelines and were approved in advance by the presented with single pulse stimulations, where only one pair of
Local Animal Ethics Committee of Lund, Sweden (permit ID stimulation electrodes at a time were used to provide stimulation,
M118–13). 100 times for each electrode pair.
Frontiers in Systems Neuroscience | www.frontiersin.org 9 February 2021 | Volume 15 | Article 640085Wahlbom et al. Tactile Decoding in Thalamic Neurons
Post Processing neuron’s F1-score for the classification task, here called decoding
The signal was imported from Spike2 to MATLAB (R2018b, performance. A more detailed description of the method is
The Mathworks, Inc.), where it was low-pass filtered using a described below.
moving average over 50 µs, i.e., a width of 5 samples. Cellular
(i) We used an exponential kernel with a characteristic
spikes were identified from the signal using tailored template
time of 5 ms to convolve the spike trains evoked by
matching routines with manually constructed templates. Each
each stimulation presentation into continuous functions,
spike template was adapted to identify the same spike in all
following 1,000 ms after the start of the stimulation.
parts of the recording, as verified by visual inspection of a high
(ii) The convolved responses were randomly assigned to one of
number of random raw recording traces (visualized in time-
two groups, half into a training set and the other half into a
voltage diagrams with a duration of 50–300 ms) in the beginning,
test set. These two data sets were handled separately for the
the middle and the end of the recording.
remainder of the analysis.
(iii) Bootstrapping was used to resample each data set 200
Spike Shape Analysis times and PCA was used on the training set in order to
All recorded spike shapes of a neuron were overlaid and a mean determine the N principal components (PCs) that were
spike shape was created. From this shape, the spike amplitude required to explain 95% of the variance observed in the
was calculated from the inflection point to the maximum peak bootstrapped data.
value. The rise time was calculated as the time between 10% of (iv) The scalar product for each bootstrapped response and N
the spike amplitude and the maximum spike amplitude. The half- PCs was then computed using the least squares method.
height amplitude was calculated as half of the spike amplitude, From this result, each bootstrapped response could be
and the half height duration was the time between when the half placed in an N-dimensional space.
height amplitude was crossed on the rising and falling phase of (v) The last step of the analysis was to use the kNN-
the mean spike shape. classification procedure to decode the stimuli from
each bootstrapped response. For each response in the
Firing Behavior Analysis bootstrapped test set the nine closest responses in the
Three different methods were used to evaluate the spike firing training set were identified using a Euclidian distance
regularity of the recorded neurons. In all three cases the calculation in the N-dimensional space. A test response
measurement was based on the interspike intervals (ISI). The was classified as belonging to the same pattern that had
coefficient of variation CV was calculated as a relative majority out of the nine closest responses from
σISI the training set.
CV = (1)
µISI (vi) These five steps were repeated 50 times, with each
repetition having a new random division of the convolved
where σISI is the SD of the ISIs of the neuron and µISI responses into a training and test set. The data from these
is the mean ISI. 50 iterations was combined and an average confusion
The CV2 of a neuron compares two adjacent ISIs and was matrix was obtained.
calculated as
2 |ISI i+1 − ISI i | From this confusion matrix the precision and recall of the
CV2 = (2)
ISI i+1 + ISI i classifier was calculated as
where ISIi is the ith ISI and ISIi+1 the following ISI, and was TP
Precision = (3)
presented as the average of all CV2s of a neuron. The last measure TP + FP
used was the firing regularity, as shown in Mochizuki et al. (2016).
A gamma distribution was fitted to the distribution of the ISIs of TP
a neuron using the gamfit function in MATLAB (R2018b, The Recall = (4)
TP + FN
Mathworks, Inc.) and a maximum likelihood estimate for the
shape factor was extracted. The firing regularity is then presented Were TP are the True Positives, FP the False Positives and FN the
as the logarithm of the shape factor. Lastly the average firing False Negatives. From these two parameters the F1-score, which
frequency of a neuron was calculated by dividing the number of we use as a measure of decoding performance, was calculated as
recorded spikes with the recording duration. their harmonic mean,
Precision × Recall
Decoding Performance F1 = 2 ×
Precision + Recall
(5)
In order to evaluate the neuronal response to the electrotactile
stimulation of the second digit we used a modified version of a The full method was repeated a second time, but with the spike
previously published method (Oddo et al., 2017). The method train responses shuffled with respect to the presented stimulation
uses bootstrapping of the neuronal data, principal component pattern before a split into training and test set was made. The
analysis (PCA) and k-nearest neighbor (kNN) classification resulting mean and SD of the F1 score for the entire population
in order to evaluate how well a neuron can differentiate of neurons was used to create a chance F1-score limit defined as
between different spatiotemporal tactile inputs, reported as the the mean plus two SD. If a neuron’s F1-score for the non-shuffled
Frontiers in Systems Neuroscience | www.frontiersin.org 10 February 2021 | Volume 15 | Article 640085Wahlbom et al. Tactile Decoding in Thalamic Neurons
data set was above this limit it was counted as being able to decode DATA AVAILABILITY STATEMENT
the tactile information.
The bootstrapping used in this method is described in further The data is available on https://figshare.com/collections/
detail here. First, the convolved responses were grouped by Widespread_decoding_of_tactile_input_patterns_among_
stimulation pattern, then a new sample of N responses were taken thalamic_neurons/5291314.
from this population using sampling with replacement, where N
was equal to the number of available responses. The sum of these
responses was stored as a bootstrapped response. ETHICS STATEMENT
Latency Analysis The animal study was reviewed and approved by the Local
The neuronal response latency times were defined as the time Animal Ethics Committee of Lund, Sweden (permit ID
between the onset of a stimulus, either pattern stimulation or M118–13).
single pulse stimulation, and the time point were two consecutive
bins of 2 ms in a peristimulus time histogram (PSTH) of the
stimulated activity exceeded the mean + 2 SD. The SD was AUTHOR CONTRIBUTIONS
calculated from a PSTH of the spontaneous activity, according
AW and HJ designed the experiments. AW performed all
to the rate change method presented in Levakova et al. (2015).
the experiments. AW, HJ, and JE designed and performed the
The PSTH of the activity evoked by the pattern stimulation
analysis and wrote the manuscript. All authors contributed to the
was based on all 800 trials, from the onset of the stimulation
article and approved the submitted version.
and for a duration of 500 ms, divided into bins of 2 ms. In
a similar manner, the 400 trials of single pulse stimulations
were combined into a PSTH lasting 300 ms. All data used
FUNDING
for the latency analysis was normalized based on the number
of trials for each neuron and PSTH type (pattern or single This work was supported by the EU Grant FET 829186
pulse stimulation). ph−coding (Predictive Haptic COding Devices In Next
Generation interfaces), the Swedish Research Council (project
Histology grant no. K2014-63X-14780-12-3).
In five experiments, the patch pipette electrolyte solution was
mixed with Neurobiotin Tracer (Vector Laboratories) in order
to stain recorded neurons or the tracks made to reach them. ACKNOWLEDGMENTS
The animals were kept under general anesthesia and then
transcardially perfused using 100 ml phosphate buffered saline Lund University Bioimaging Center (LBIC), Lund University, is
(PBS) followed by 75 ml 4% paraformaldehyde (PFA) solution. gratefully acknowledged for providing experimental resources.
The brains were then removed and post-fixed in 4% PFA solution
for 48–72 h and stored in PBS. Before sectioning, the brain was
submerged in 25% sucrose in PBS for 48 h. Sixty micrometer SUPPLEMENTARY MATERIAL
sections were then cut using a cryostat-microtome and the
sections were stained with Streptavidin conjugated to Alexa Flour The Supplementary Material for this article can be found
488 (Molecular Probes Inc.). A confocal microscope combined online at: https://www.frontiersin.org/articles/10.3389/fnsys.
with a fluorescence microscope was then used to identify any 2021.640085/full#supplementary-material
stained neurons and electrode tracks. This was used together with
Supplementary Figure 1 | (A) Schematic of the rat forepaw showing the
the atlas by Paxinos and Watson (2006) in order to determine the placement of the four pairs of stimulation electrodes (color coded). (B) The eight
location of the recorded neuron, which was compared with the stimulation patterns used as the tactile inputs. Each color corresponds to a
location according to stereotaxic coordinates. stimulation channel as indicated in (A).
REFERENCES Arcelli, P., Frassoni, C., Regondi, M. C., De Biasi, S., and Spreafico, R. (1997).
GABAergic neurons in mammalian thalamus: a marker of thalamic complexity?
Allen, A. E., Procyk, C. A., Brown, T. M., and Lucas, R. J. (2017). Convergence of Brain Res. Bull. 42, 27–37. doi: 10.1016/s0361-9230(96)00107-4
visual and whisker responses in the primary somatosensory thalamus (ventral Bengtsson, F., and Jorntell, H. (2014). Specific relationship between excitatory
posterior medial region) of the mouse. J. Physiol. 595, 865–881. doi: 10.1113/ inputs and climbing fiber receptive fields in deep cerebellar nuclear neurons.
jp272791 PLoS One 9:e84616. doi: 10.1371/journal.pone.0084616
Alloway, K. D., Wallace, M. B., and Johnson, M. J. (1994). Cross-correlation Berkley, K. J., Budell, R. J., Blomqvist, A., and Bull, M. (1986). Output systems of
analysis of cuneothalamic interactions in the rat somatosensory system: the dorsal column nuclei in the cat. Brain Res. 396, 199–225. doi: 10.1016/0165-
influence of receptive field topography and comparisons with thalamocortical 0173(86)90012-3
interactions. J. Neurophysiol. 72, 1949–1972. doi: 10.1152/jn.1994.72.4. Bermejo, P. E., Jimenez, C. E., Torres, C. V., and Avendano, C. (2003). Quantitative
1949 stereological evaluation of the gracile and cuneate nuclei and their projection
Frontiers in Systems Neuroscience | www.frontiersin.org 11 February 2021 | Volume 15 | Article 640085Wahlbom et al. Tactile Decoding in Thalamic Neurons
neurons in the rat. J. Comp. Neurol. 463, 419–433. doi: 10.1002/cne. Loutit, A. J., Vickery, R. M., and Potas, J. R. (2021). Functional organization
10747 and connectivity of the dorsal column nuclei complex reveals a
Bezdudnaya, T., and Castro-Alamancos, M. A. (2011). Superior colliculus cells sensorimotor integration and distribution hub. J. Comp. Neurol. 529,
sensitive to active touch and texture during whisking. J. Neurophysiol. 106, 187–220.
332–346. doi: 10.1152/jn.00072.2011 Mochizuki, Y., Onaga, T., Shimazaki, H., Shimokawa, T., Tsubo, Y., Kimura, R.,
Bieler, M., Xu, X., Marquardt, A., and Hanganu-Opatz, I. L. (2018). Multisensory et al. (2016). Similarity in neuronal firing regimes across mammalian species.
integration in rodent tactile but not visual thalamus. Sci. Rep. 8:15684. J. Neurosci. 36, 5736–5747.
Brecht, M., and Sakmann, B. (2002). Whisker maps of neuronal subclasses of the Niedermeyer, E., and da Silva, F. H. L. (2005). Electroencephalography: Basic
rat ventral posterior medial thalamus, identified by whole-cell voltage recording Principles, Clinical Applications, and Related Fields. Lippincott Williams &
and morphological reconstruction. J. Physiol. 538, 495–515. doi: 10.1113/ Wilkins.
jphysiol.2001.012334 Oddo, C. M., Mazzoni, A., Spanne, A., Enander, J. M., Mogensen, H., Bengtsson,
Enander, J. M. D., and Jorntell, H. (2019). Somatosensory cortical neurons decode F., et al. (2017). Artificial spatiotemporal touch inputs reveal complementary
tactile input patterns and location from both dominant and non-dominant decoding in neocortical neurons. Sci. Rep. 8:45898.
digits. Cell Rep. 26, 3551–3560 e3554. Paxinos, G., and Watson, C. (2006). The Rat Brain in Stereotaxic Coordinates: Hard
Enander, J. M. D., Spanne, A., Mazzoni, A., Bengtsson, F., Oddo, C. M., and Jorntell, Cover Edition. Amsterdam: Elsevier.
H. (2019). Ubiquitous neocortical decoding of tactile input patterns. Front. Cell. Shimazaki, H., and Shinomoto, S. (2010). Kernel bandwidth optimization in spike
Neurosci. 13:140. doi: 10.3389/fncel.2019.00140 rate estimation. J. Comput. Neurosci. 29, 171–182. doi: 10.1007/s10827-009-
Francis, J. T., Xu, S., and Chapin, J. K. (2008). Proprioceptive and cutaneous 0180-4
representations in the rat ventral posterolateral thalamus. J. Neurophysiol. 99, Smith, F. W., and Goodale, M. A. (2015). Decoding visual object categories in
2291–2304. doi: 10.1152/jn.01206.2007 early somatosensory cortex. Cereb. Cortex 25, 1020–1031. doi: 10.1093/cercor/
Genna, C., Oddo, C. M., Mazzoni, A., Wahlbom, A., Micera, S., and Jorntell, bht292
H. (2018). Bilateral tactile input patterns decoded at comparable levels but Su, J., Charalambakis, N. E., Sabbagh, U., Somaiya, R. D., Monavarfeshani, A.,
different time scales in neocortical neurons. J. Neurosci. 38, 3669–3679. doi: Guido, W., et al. (2020). Retinal inputs signal astrocytes to recruit interneurons
10.1523/jneurosci.2891-17.2018 into visual thalamus. Proc. Natl. Acad. Sci. U.S.A. 117, 2671–2682. doi: 10.1073/
Gharaei, S., Honnuraiah, S., Arabzadeh, E., and Stuart, G. J. (2020). Superior pnas.1913053117
colliculus modulates cortical coding of somatosensory information. Nat. Uemura, Y., Haque, T., Sato, F., Tsutsumi, Y., Ohara, H., Oka, A., et al. (2020).
Commun. 11:1693. Proprioceptive thalamus receiving forelimb and neck muscle spindle inputs via
Halassa, M. M., and Sherman, S. M. (2019). Thalamocortical circuit motifs: a the external cuneate nucleus in the rat. Brain Struct. Funct. 225, 2177–2192.
general framework. Neuron 103, 762–770. doi: 10.1016/j.neuron.2019.06.005 doi: 10.1007/s00429-020-02118-2
Henschke, J. U., Noesselt, T., Scheich, H., and Budinger, E. (2015). Possible Villanueva, L., Desbois, C., Le Bars, D., and Bernard, J. F. (1998). Organization of
anatomical pathways for short-latency multisensory integration processes in diencephalic projections from the medullary subnucleus reticularis dorsalis and
primary sensory cortices. Brain Struct. Funct. 220, 955–977. doi: 10.1007/ the adjacent cuneate nucleus: a retrograde and anterograde tracer study in the
s00429-013-0694-4 rat. J. Comp. Neurol. 390, 133–160. doi: 10.1002/(sici)1096-9861(19980105)390:
Holt, G. R., Softky, W. R., Koch, C., and Douglas, R. J. (1996). Comparison 13.0.co;2-y
of discharge variability in vitro and in vivo in cat visual cortex neurons. Wahlbom, A., Enander, J. M. D., Bengtsson, F., and Jorntell, H.
J. Neurophysiol. 75, 1806–1814. doi: 10.1152/jn.1996.75.5.1806 (2019). Focal neocortical lesions impair distant neuronal information
Jorntell, H. (2017). Cerebellar physiology: links between microcircuitry properties processing. J. Physiol. 597, 4357–4371. doi: 10.1113/jp2777
and sensorimotor functions. J. Physiol. 595, 11–27. doi: 10.1113/jp272769 17
Jorntell, H., and Ekerot, C. F. (1999). Topographical organization of projections
to cat motor cortex from nucleus interpositus anterior and forelimb skin. Conflict of Interest: The authors declare that the research was conducted in the
J. Physiol. 514(Pt 2), 551–566. doi: 10.1111/j.1469-7793.1999.551ae.x absence of any commercial or financial relationships that could be construed as a
Levakova, M., Tamborrino, M., Ditlevsen, S., and Lansky, P. (2015). A review of potential conflict of interest.
the methods for neuronal response latency estimation. Biosystems 136, 23–34.
doi: 10.1016/j.biosystems.2015.04.008 Copyright © 2021 Wahlbom, Enander and Jörntell. This is an open-access article
Li, C. X., Chappell, T. D., Ramshur, J. T., and Waters, R. S. (2014). Forelimb distributed under the terms of the Creative Commons Attribution License (CC BY).
amputation-induced reorganization in the ventral posterior lateral nucleus The use, distribution or reproduction in other forums is permitted, provided the
(VPL) provides a substrate for large-scale cortical reorganization in rat forepaw original author(s) and the copyright owner(s) are credited and that the original
barrel subfield (FBS). Brain Res. 1583, 89–108. doi: 10.1016/j.brainres.2014.07. publication in this journal is cited, in accordance with accepted academic practice. No
022 use, distribution or reproduction is permitted which does not comply with these terms.
Frontiers in Systems Neuroscience | www.frontiersin.org 12 February 2021 | Volume 15 | Article 640085You can also read